combining genetics and population dynamics to · pdf filecombining genetics and population...
TRANSCRIPT

COMBINING GENETICS AND POPULATION DYNAMICS TO IMPROVE THE MANAGEMENT OF PACIFIC OCEAN PERCH (SEBASTES ALUTUS)
Katie PalofTony GharrettTerry Quinn
Funded by: PCCRC, Sea Grant, NMFS Auke Bay Laboratory, CIFAR, Rasmuson Fisheries Research Center

BACKGROUND
Marine species assumed to have
broad dispersal and movement
Significant genetic structure for POP
Limited net dispersal
Spatially limited neighborhoods
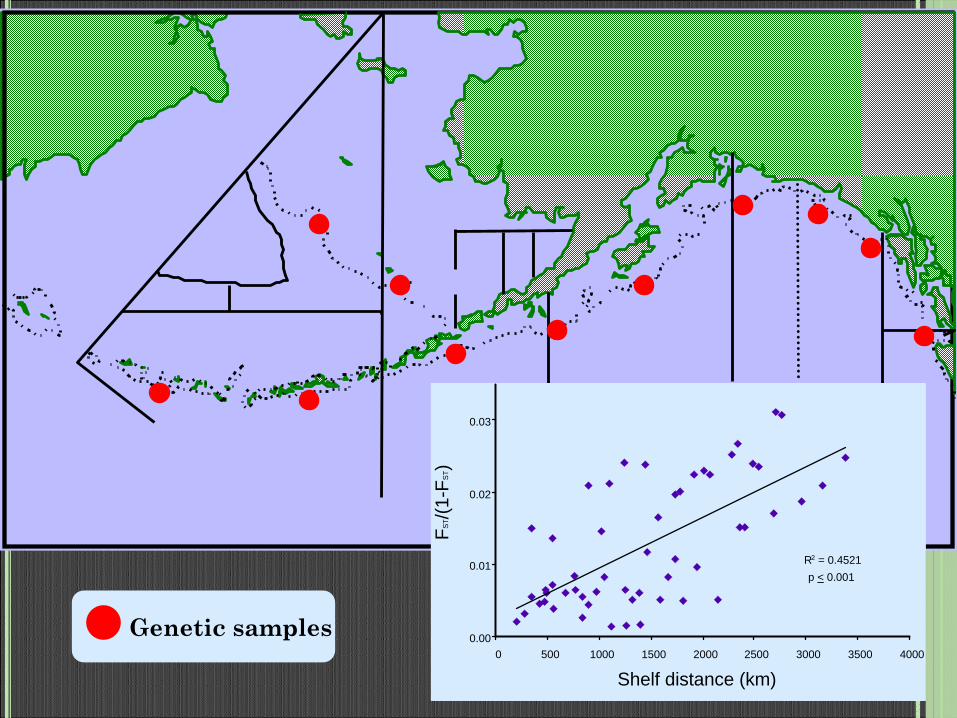
R2 = 0.4521p < 0.001
0.00
0.01
0.02
0.03
0 500 1000 1500 2000 2500 3000 3500 4000
Shelf distance (km)
FST /(
1-FS
T )
Genetic samples

GENETICS AND MANAGEMENT:
management areas mean dispersal (birth to reproduction)
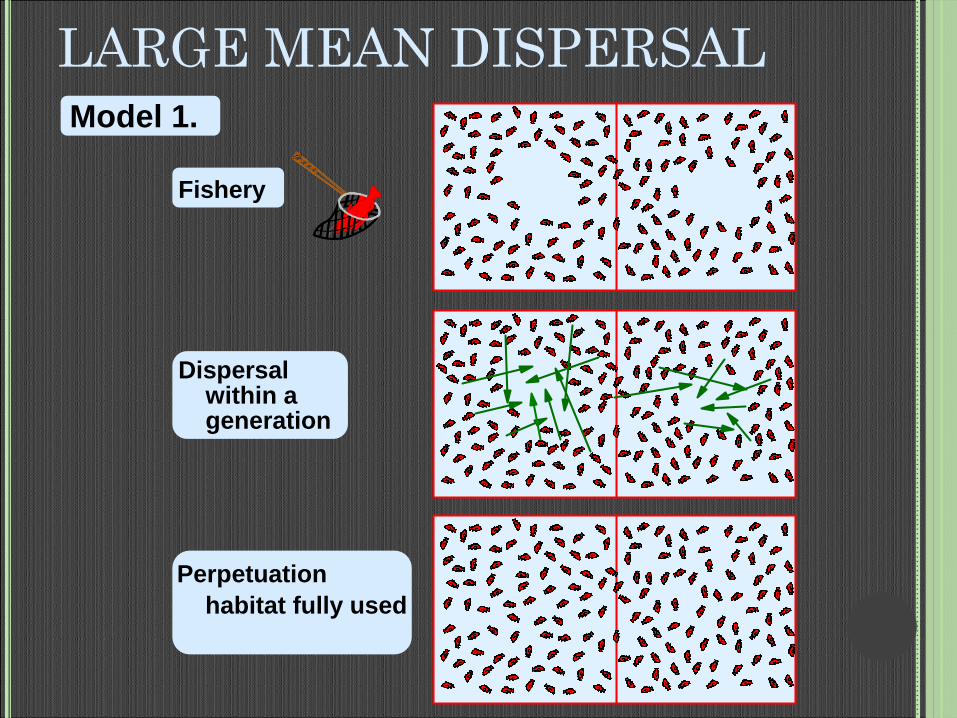
LARGE MEAN DISPERSALModel 1.
Fishery
Dispersalwithin a generation
Perpetuationhabitat fully used

SMALL MEAN DISPERSALModel 2.
Fishery
Dispersalwithin a generation
Stock erosionunder used and overused habitat

QUESTIONS?
How does population sub-division influence population dynamics models?
How can we evaluate the influence of the spatial scale of harvest on population sub-division?
What is the quality of our genetic data?

DATA QUALITY ISSUE – NULL ALLELES
Incorrect scoring due to null alleles
Validate data quality
Simulations
Lab validation
Correct species ID?
Use SNP to ID POP samples

Null Alleles: 2 Chromosomes = 2 Alleles
ATTTCGACGCG
TAAAGCTGCGC ATTAATTAATTAATTA
…
TACTGCGCTG
ATGACGCGAC
ATTTCGACGCG
TAAAGCTGCGC ATTAATTAATTAATTA
…
TACTGCGCTG
ATGACGCGAC
120
142

RESULTS
Simulation
results
Threshold of detection and influence on estimates at 0.025 to 0.05 null allele frequency
Inbreeding coefficients (FIS
) >0.05 may indication the presence of null alleles
Only 1 locus is at this level, with an FIS
of 0.05
Lab results
2 new sets of primers at 13 loci suggest no significant null allele presence

Table 1. Results of lab null allele analysis# of original homozygotes
# presumptive nulls
% nulls of homozygotes
% null of all individuals
Locus New Primers 998
Sal1 1st 91 0 0 02nd 91 0 0 0
Sal2 1st 248 0 0 02nd 248 0 0 0
Sal3 1st 119 0 0 02nd 119 0 0 0
Sal4 1st 113 0 0 02nd 113 3 0.0265 0.0030
Sma
7 1st 126 0 0.0000 0.00002nd - - - -
SR7-7 1st 66 1 0.0152 0.00102nd - - - -
SR7-2 1st 52 2 0.0385 0.00202nd 52 2 0.0385 0.0020
SR7-25 1st 94 0 0.0000 0.00002nd 94 1 0.0106 0.0010
Spi10 1st 194 0 0.0000 0.00002nd - - - -
Sth3B 1st 188 1 0.0053 0.00102nd 188 2 0.0106 0.0020
Spi12 1st 275 0 0.0000 0.00002nd 275 1 0.0036 0.0010
Spi6 1st 134 0 0.0000 0.00002nd 134 2 0.0149 0.0020
Sal6 1st 215 0 0 02nd - - - -

SUMMARY OF NULL ALLELE WORK
Null alleles have low frequencies for the loci used in this study
Null alleles, if present at low levels, have little influence on estimation of genetic parameters
Quality of our data is excellent!
Continue forward with estimations from this data
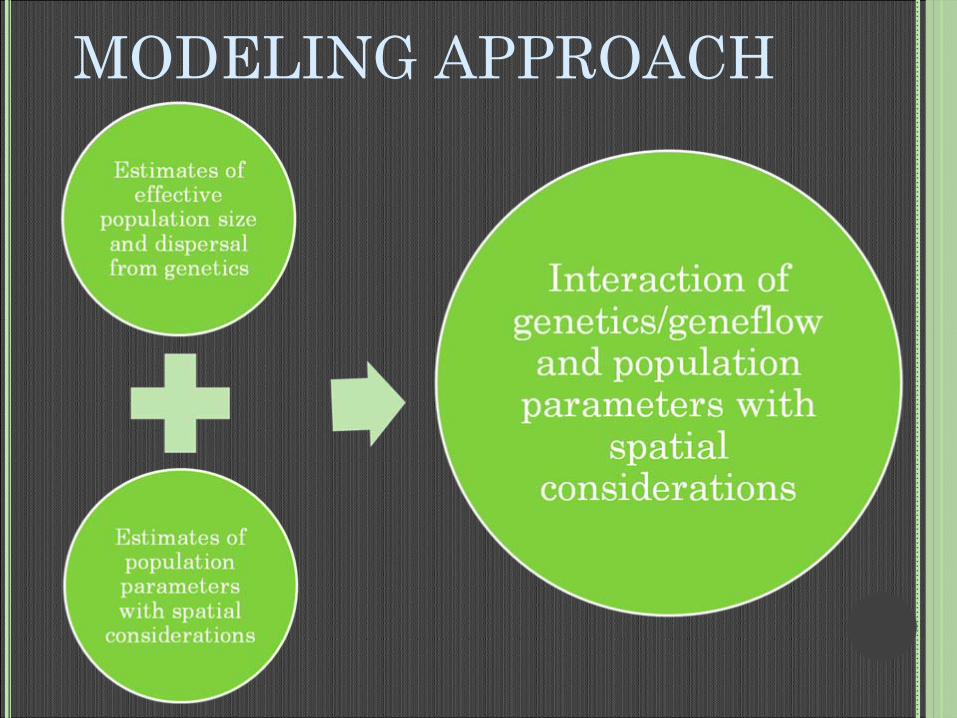
MODELING APPROACH

CURRENT WORK
Literature review of spatial models & the influence of harvest
Developing simple models to explore the relationship between harvest, spatial population structure, population dynamics, geneflow, etc.
Examine the spatial breakdown of current POP data

SPATIAL STRUCTURE AND POPULATION DYNAMICS
Determine logical spatial breaks from survey data

NATURAL SPATIAL BREAKS?


SPATIAL STRUCTURE AND POPULATION DYNAMICS
Determine logical spatial breaks from genetic and survey data
Estimate population dynamic parameters for each spatial region
Are the genetic differences reflected in these estimable parameters?

DIRECTION FOR MODELING

ACKNOWLEDGEMENTS
PCCRC
M.S. funding sources: Sea Grant, NMFS Auke Bay Laboratory, CIFAR, Rasmuson
Fisheries
Research Center
A.J. Gharrett, T.J. Quinn II