combined experimental and theoretical study of acetylene...
TRANSCRIPT

ww.sciencedirect.com
i n t e r n a t i o n a l j o u r n a l o f h y d r o g e n en e r g y 4 5 ( 2 0 2 0 ) 1 2 8 3e1 2 9 6
Available online at w
ScienceDirect
journal homepage: www.elsevier .com/locate/he
Combined experimental and theoretical study ofacetylene semi-hydrogenation over Pd/Al2O3
Liliana P.L. Goncalves a,b, Jianguang Wang c, Simone Vinati d,Emanuele Barborini d, Xian-Kui Wei e, Marc Heggen e, Miguel Franco a,Juliana P.S. Sousa a, Dmitri Y. Petrovykh a, Olıvia Salom�e G.P. Soares b,Kirill Kovnir f,g, Jaakko Akola c,h,**, Yury V. Kolen'ko a,*
a International Iberian Nanotechnology Laboratory (INL), Avenida Mestre Jos�e Veiga, 4715-330 Braga, Portugalb Laboratory of Separation and Reaction Engineering e Laboratory of Catalysis and Materials (LSRE-LCM),
Faculdade de Engenharia, Universidade do Porto, Rua Dr. Roberto Frias, 4200-465 Porto, Portugalc Computational Physics Laboratory, Tampere University, P.O. Box 692, 33014 Tampere, Finlandd Tethis S.p.A., Milan 20143, Italye Ernst Ruska-Centre for Microscopy and Spectroscopy with Electrons and Peter Grunberg Institute,
Forschungszentrum Julich GmbH, 52425 Julich, Germanyf Department of Chemistry, Iowa State University, Ames, IA 50011, United Statesg Ames Laboratory, U.S. Department of Energy, Ames, IA 50011, United Statesh Department of Physics, Norwegian University of Science and Technology, 7491, Trondheim, Norway
a r t i c l e i n f o
Article history:
Received 10 September 2018
Received in revised form
6 April 2019
Accepted 9 April 2019
Available online 9 May 2019
Keywords:
Heterogeneous catalysis
Hydrogenation
Kinetics
DFT
Modelling
Nanoclusters
E-mail addresses: [email protected]://doi.org/10.1016/j.ijhydene.2019.04.0860360-3199/© 2019 Hydrogen Energy Publicati
a b s t r a c t
The semi-hydrogenation of acetylene (C2H2 þ H2 ¼ C2H4, DH ¼ �172 kJ mol�1) is a well-
studied reaction that is important for purification of ethylene, C2H4, feed used in poly-
ethylene production. Pd-based catalysts are most commonly used to remove acetylene
from ethylene feed prior to ZieglereNatta polymerization because acetylene is a poison for
ZieglereNatta catalysts. New applications of the analogous catalytic processes, with
similar requirements for the conversion and selectivity, are considered for the storage of H2
within the context of the H2 economy. Here, a combination of experimental and theoretical
studies was employed to explore the performance of synthesized Pd nanoparticles and the
feasibility of using computational modelling for predicting their catalytic properties. Spe-
cifically, a model 5%Pd/Al2O3 nanocatalyst was successfully synthesized using high-
throughput flame spray pyrolysis (FSP) method. As a catalyst for acetylene semi-
hydrogenation, the material shows high conversion of 97%, a modest selectivity of 62%,
and a turnover frequency of ethylene formation of 5 s�1. The experimental data were
further supported by computational modelling of catalytic properties. Results of micro-
kinetic simulations, based on parameters obtained from DFT calculations, over a Pd30/
Al2O3(100) model system were correlated with experiments. The insights from this direct
comparison of theory and experiments provide indications for future improvements of the
theoretical predictions and for novel types of materials with improved catalytic properties.
© 2019 Hydrogen Energy Publications LLC. Published by Elsevier Ltd. All rights reserved.
* Corresponding author.** Corresponding author. Department of Physics, Norwegian University of Science and Technology, 7491 Trondheim, Norway.
(J. Akola), [email protected] (Y.V. Kolen'ko).
ons LLC. Published by Elsevier Ltd. All rights reserved.

i n t e rn a t i o n a l j o u r n a l o f h y d r o g e n en e r g y 4 5 ( 2 0 2 0 ) 1 2 8 3e1 2 9 61284
Introduction
An important industrial example of the semi-hydrogenation
of acetylene, C2H2, to ethylene, C2H4 (C2H2 þ H2 ¼ C2H4), is
related to the need to reduce to a few ppm the acetylene
concentration in the ethylene feedstock for polyethylene
polymerization, which is typically produced from steam
cracking of hydrocarbons and contains 0.5e2% of acetylene
[1]. Without the catalytic semi-hydrogenation, this minor
amount of acetylene negatively affects the polymerization
process because acetylene poisons the ZieglereNatta poly-
merization catalysts. Furthermore, to keep the process
economically viable, the catalyst should not further convert
ethylene into ethane, meaning that highly selective semi-
hydrogenation of acetylene needs to be achieved [2,3].
Similar needs for improving the selectivity of catalysts [4] also
emerge from the recent advances in the H2 economy, whereby
catalytic hydrogenation of unsaturated hydrocarbons, such as
cyclohexane, methylcyclohexane, decalin, etc. [5] offers a
promising pathway to store/use renewable H2.
Pd-based catalysts have been employed in semi-
hydrogenation of C2H2 to C2H4 due to their high activity for
acetylene conversion. Unfortunately, these catalysts typically
exhibit low selectivity because they subsequently convert
C2H4 to unwanted C2H6 [6e8]. They also present limited sta-
bility caused by the accumulation of oligomers, which is
mostly attributed to the fact that these catalysts provide
active sites that enable side reactions [9e11]. An increase in
the selectivity and stability of Pd catalysts has been achieved
by, for example, the addition of promoters to the catalysts, or
bymixingwith othermetals andmetal oxides [12e17]. Despite
the numerous studies addressing the improvement of Pd-
based catalysts, it is still not possible to increase their selec-
tivity and stability, a goal that requires understanding the
catalytic reaction mechanism.
The reaction pathways of acetylene hydrogenation on
Pd(111) surface have been investigated using first-principles
DFT calculations, and the results revealed that the hydroge-
nation of acetylene to vinyl and vinyl to ethylene had similar
activation barriers [18]. Later, using first-principles-based ki-
netic Monte Carlo simulations, Mei et al. reported that the
simulated apparent activation energy, ethylene selectivity,
and reaction orders were comparable with experiments [19].
More recently, semi-hydrogenation of acetylene over Pd-
doped Cu(111) surfaces at low-temperature has been exam-
ined by DFT combinedwithmicrokineticmodelling [20]. It was
found that the ethylene selectivity on a single-Pd-doped
Cu(111) surface was higher than that of a monolayer-Pd-
doped Cu(111), but the acetylene conversion exhibited in-
verse behaviors on these two surfaces. Until now, most
theoretical studies have focused on the hydrogenation of
acetylene over metal surfaces, while the investigations of Pd
anchored on a supporting material remain a considerable
challenge [21,22]. Accordingly, to develop advanced catalysts
for semi-hydrogenation of C2H2, it is necessary to achieve a
basic understanding of the catalytic reactions on model
systems.
Herein, we report new synthesis, characterization, and
catalytic hydrogenation properties of a Pd nanocatalyst
supported on alumina, Pd/Al2O3. Moreover, we investigate
whether state-of-the-art theoretical modelling can predict the
catalytic behavior. The results of this study show a good
agreement between the performed experiments and theoret-
ical simulations, which opens a practical opportunity for
computational screening of complex catalysts.
Experimental
Catalyst preparation
The flame spray pyrolysis (FSP) sample was produced
employing a commercial FSP system (NPS10, Tethis, Italy). The
NPS10 is a bench top system that allows the production of FSP
nanopowder with laboratory mass-scale for R&D purposes.
The burner where the pyrolysis reactions take place is
described, for example, by M€adler et al. [23]. In our work, a
liquid solution containing the metal organometallic pre-
cursors was injected, by a syringe pump (at a rate of
5 cm3 min�1) through a stainless-steel capillary, into a nozzle
where it was dispersed by an oxygen flow of 5 dm3 min�1 (at a
pressure drop of 1.5 bar). A concentric flamelet ring was fed
with a premixed mixture of methane/oxygen (CH4
1.5 dm3 min�1, O2 3.2 dm3 min�1) for generating the support-
ing flame. Additional oxygen (5 dm3min�1) was supplied by an
outer sheath flow to assure enough oxidant for complete
conversion of the reactants. The powder was collected on a
glassfiber filter (GF/A Whatman, Kent, United Kingdom),
150 mm in diameter. The filter was placed in a water-cooled
holder 400 mm above the nozzle.
The liquid precursor was prepared by dissolving Pd(II)-
acetylacetonate (99% Strem Chemicals) into acetonitrile
(anhydrous, 99.8%, Sigma Aldrich) and then placing a suitable
quantity of the obtained solution into a premixed solution of
Al(III)-sec-butoxide (98%, Strem Chemicals) and xylene (Carlo
Erba) in order to form a final solution of 0.69 M of Al. This
synthesized sample will be referred to as Pd/Al2O3 as-syn-
thesized. The obtained Pd loading was 5%, matching the
loading of the reference commercial catalyst, which has been
previously comprehensively characterized [11,24].
Catalyst Characterization
X-ray diffractionPowder X-ray diffraction (XRD) patterns of the samples were
obtained using a X'Pert PRO diffractometer (PANalytical) with
a PIXcel 3D detector, set at 45 kV and 40 mA. The sample was
ground to a fine powder and placed in the sample holder. A
BraggeBrentano configuration was used in a 2q range from 20�
to 80� with step size of 0.01� and a time per step of 300 s. Ob-
tained data were analyzed with High Score software (Pan-
Analytical), matching the patterns to International Centre for
Diffraction Data (ICDD) database.
Electron microscopyA probe-corrected FEI Titan 80e200 Chemi-STEM microscope,
equipped with a high-brightness Schottky field emission
electron gun, was operated at 200 kV to carry out the

i n t e r n a t i o n a l j o u r n a l o f h y d r o g e n en e r g y 4 5 ( 2 0 2 0 ) 1 2 8 3e1 2 9 6 1285
structural and morphological analysis of the as-synthesized
catalyst. The scanning transmission electron microscope
(STEM) images were collected by a high-angle annular-dark-
field (HAADF) detector in an angle range between 70mrad and
200 mrad.
X-ray photoelectron spectroscopySupported catalyst powders were analysed in an ESCALAB 250
Xi system (Thermo Scientific). As-synthesized, oxidized, and
reduced samples were scraped onto Al foil substrates and
measured using a non-monochromatic Al Ka X-ray source
(operating at 400 W power) to minimize charging artefacts.
Peak fitting was performed in Avantage instrument software
(Thermo Scientific), choosing a minimal number of compo-
nents that produced random residuals consistently for all the
samples. A convolution of Gaussian and Lorentzian line
shapes was used for most of the spectral components; Pd 3d
peaks required small asymmetric tails.
The binding energy (BE) scale is based on a BE shift (uni-
formly applied for all the samples) that placed the aliphatic C
1s peak associated with the supported catalyst material to
285.0 ± 0.2 eV, the value chosen based on previous measure-
ments on non-metallic surfaces: polymer films [25], adventi-
tious carbon [26], and alkane chains in self-assembled
monolayers [27]. This BE correction places the (unresolved) Al
2p peak associated with the alumina of the catalyst support
particles at 74.6 ± 0.2 eV.
Due to the apparent differential charging, there was a
consistent (for all the samples) shift of 2.5± 0.1 eV between the
high-resolution elemental peaks corresponding to the
supported-catalyst particles and Al-foil substrate: aliphatic C
1s component as well as aluminum-oxide Al 2p and O 1s
components. This differential charging shift enabled an un-
ambiguous selection of the aliphatic C 1s component associ-
ated with the supported-catalyst particles to be used as the
above-mentioned BE reference.
Nitrogen physisorptionThe surface area, pore size, and pore volume of the samples
were calculated with the determination of the N2
adsorptionedesorption isotherms of the samples at �77 K.
The characterization was performed using a Quantachrome
Autosorb IQ2 multi-station apparatus. Approximately 100 mg
of sample was placed in the sample holder and outgassed
under vacuum at 423 K for 240 min before the analysis. The
specific surface area of the sampleswas determined according
to the BrunauereEmmetteTeller (BET) method in the range of
(0.05 < P/P0 < 0.3), the pore size was determined by the Bar-
retteJoynereHalenda (BJH) method, and the pore volume was
determined using the amount of vapor adsorbed at relative
pressure close to unity (P/P0 ¼ 0.97).
Hydrogen chemisorptionH2 chemisorption experiments on the Pd catalysts were per-
formed on an AMIe200 Catalyst Characterization apparatus
(Altamira) and using the pulsed method, in which pulses of
58 mL of H2 are injected in the carrier gas (Ar, 25 cm3 min�1)
that flows through the sample, until the metal saturation, i.e.,
until the peak area becomes constant. The adsorbed hydrogen
quantity is calculated by the integration of each peak that
comes from each pulse, determined using a thermal conduc-
tivity detector (TCD). Before the analysis, the sample was
preheated to 473 K in pure Ar flow and left for 1 h. Next, the
flow was exchanged to a pure flow of hydrogen and the
sample was reduced for 1 h. After the reduction, the system
was purged with Ar and cooled down to 308 K. The hydrogen
adsorption stoichiometry was assumed to be 0.5 H2:Pd [28].
Catalytic measurements on acetylene semi-hydrogenationreaction
Catalyticmeasurementswere performed in a continuous-flow
fixed-bed quartz reactor with internal diameter of 7 mm,
using quartz wool to trap the catalyst inside the reactor. The
temperature in the bed was measured using a Type K ther-
mocouple connected to a thermocouple data logger, and the
gases, acetylene (2.6), hydrogen (5.0), and helium (5.0), were
supplied using Bronkhorst mass flow controllers. The reaction
products were analysed by a GCe2010 Plus from Shimadzu,
equipped with a VPeAlumina column and a flame ionization
detector (FID). The reactor was loaded with 1 mg of catalyst
diluted in 100 mg silicon carbide (SiC) (60e80 mesh) and prior
to each experiment, the catalyst was reduced in situ at 473 K
for 30 min under a 20 cm3 min�1 H2 flow.
The conversion and selectivity of the catalysts were
evaluated by isothermal and temperature-programmed ex-
periments at atmospheric pressure for both the prepared
sample after reduction (Pd/Al2O3 reduced) and commercial
5%Pd/Al2O3 catalyst (Pd/Al2O3_Ref reduced) (Alfa Aesar),
which was used as reference. In the case of the isothermal
experiments at 473 K, after the reduction treatment, the gas
flow was changed to a mixture of 2% C2H2 and 20% H2
balanced with helium at a total flow rate of 50 cm3 min�1 and
the time on stream was 9 h to evaluate the stability of the
catalyst. For the temperature-programmed experiments,
after reduction, the temperature was reduced to 300 K in
20 cm3 min�1 helium flow and then the gas flow was changed
to the same composition as in the isothermal experiments.
The temperature was increased in 50 K steps at 10 K min�1. In
each step, the composition of the gas flow was analyzed after
30 min of stabilization.
The conversion on acetylene (XC2H2) was calculated using
the following equation:
XC2H2ð%Þ ¼ C2H2ðfeedÞ � C2H2
C2H2ðfeedÞ (1)
Where C2H2(feed) is the concentration of acetylene on the
feed and C2H2 is the concentration of acetylene in the product
stream. The selectivity in ethylene formation (SC2H4) was
calculated as follows:
SC2H4ð%Þ ¼ C2H4
C2H2ðfeedÞ � C2H2(2)
where C2H4 is the concentration of ethylene in the product
stream.
The turnover frequency (TOF) was calculated as:
TOF ¼ No: of C2H4 molecules formed
No: of exposed Pd sites on catalyst � time(3)

i n t e rn a t i o n a l j o u r n a l o f h y d r o g e n en e r g y 4 5 ( 2 0 2 0 ) 1 2 8 3e1 2 9 61286
The activation energy (Ea) for acetylene hydrogenation
under the established conditions for the tested samples was
calculated from the Arrhenius plot as:
Ea ¼ �slopeðArrhenius plotÞ � R (4)
where R is the gas constant.
Computational modelling details
The structures and energies of the reactant, transition, and
product states in acetylene hydrogenation over an alumina-
supported Pd cluster were calculated using the density func-
tional theory (DFT) methods as implemented in the CP2K pro-
gram package [29,30]. All calculations were carried out spin-
polarized within the generalized gradient approximation
(GGA) using the Perdew, Burke, and Ernzerhof (PBE) exchange-
correction potential [31] and analytical pseudopotentials of the
type suggested by Goedecker, Teter, and Hutter (GTH) [32]. The
KohneSham wave functions were expanded in a double-zeta
valence polarized (DZVP) basis set [33], which was optimized
based on molecular properties. An auxiliary plane-wave basis
with a 600 Ry kinetic energy cutoff was used to describe the
electron density of valence electrons [34]. Only the G-point was
employed for Brillouin zone integration as the model systems
are laterally large and the alumina substrate (slab) is an insu-
lator. The DFT-D3 method with the standard parameters sug-
gested by Goerigk and Grimme was employed to correct the
dispersion interaction [35]. Bader analysis of effective charges
on atoms was used to determine the charge transfer [36,37],
and the reaction paths were calculated using the climbing-
image nudged elastic band (CIeNEB) method [38].
A periodic slab model was used for the support by cleaving
a bulk g-Al2O3 model [39] in the (100) direction. The Al2O3(100)
support was chosen as a four-layer (4 � 3) slab (in total 480
atoms, lateral size 22.33� 25.19Å2) and a vacuumspacing of at
least 24 �A thickness in the vertical direction. The top two
atomic layers were allowed to relax during the simulations
while the bottom two layers were fixed. Here, a Pd30 cluster
with the square-base pyramidal structure was chosen as a
representative model catalyst structure. Previously, the same
structure with 30 Pd atoms (fcc) was used for Pd and PdeO
clusters based on the correspondence with electron micro-
scopy analysis [40]. To justify the Pd30/Al2O3 model as a
representative choice, a larger model catalyst composed of a
pyramidal Pd55 cluster and an Al2O3(100) support with (5 x 3)-
four-layer-slab (600 atoms, lateral size of 27.33 � 25.19 Å2) has
been tested. After optimization, Pd55 still displays the
pyramid-like configuration with a base dimension of
10.71 � 10.78 Å2. The nearest distances of cluster images are
16.6 and 14.4 �A in lateral directions, large enough to avoid
interactions between cluster images, as imposed by periodic
boundary conditions. The situation is comparable to the Pd30/
Al2O3 model where the corresponding image distances are
14.3 and 17.2 �A. For these two model structures, our DFT cal-
culations reveal that the differences for acetylene adsorption
energy (0.06 eV) and Bader charge on acetylene molecule
(0.01e) aremarginal. Meanwhile, the computational cost of the
larger Pd55/Al2O3 model is more than an order of magnitude
more expensive. Thus, we consider the Pd30/Al2O3 model
structure both as feasible and representative for reaction
modelling. Here, we need to declare that a larger model
catalyst would need a much larger substrate to suppress
clusterecluster interactions due to periodic boundary condi-
tions. This would lead to model structures of several thou-
sands of atoms (most of them in the substrate), which is not
feasible for DFT simulations in this context.
For acetylene hydrogenation over Pd30/Al2O3(100), it was
assumed that atomic hydrogen is already available on the
catalyst surface (See Supporting Information). Based on the
co-adsorption configuration of H* þ H*, the adsorption sites of
C2H2 and C2H4 were optimized by considering different sites
on the cluster surface. Here, the adsorption energy (E2ads) was
calculated as
E2ads ¼ EðadsorbateÞ þ E
�Pd30ðHÞ2
�Al2O3Þ e EðadsorbateðHÞ2
þ Pd30=Al2O3
(5)
where E(Y) is the total energy of the corresponding system Y.
Microkinetic simulations were performed based on data
(parameters) from DFT calculations over the Pd30/Al2O3(100)
model catalyst to study the acetylene hydrogenation under
varying conditions [41e43]. The full details of themicrokinetic
model have been explained by Ma et al. [42]. The simulations
were carried out at temperatures from 300 to 500 K, atmo-
spheric pressure and feed composition of 2% C2H2 and 20%H2.
The kinetic values were estimated once the simulations were
equilibrated to a steady state.
The acetylene conversion (XC2H2) and ethylene formation
selectivity (SC2H4) were calculated as
XC2H2 ¼ ðRC2H4 þ RC2H6ÞRC2H2
(6)
SC2H4 ¼ RC2H4
ðRC2H4 þ RC2H6Þ (7)
where R refers to the reaction rate for the formation of the
corresponding species.
Results
Characterization results
A 5% Pd on Al2O3 sample (Pd/Al2O3 as-synthesized) was pre-
pared by flame spray pyrolysis (FSP), characterized, and tested
for acetylene semi-hydrogenation reaction to achieve a basic
understanding of the catalytic semi-hydrogenation of acety-
lene to ethylene on basic model systems. The powder XRD
pattern of Pd/Al2O3 as-synthesized (Fig. 1) shows the charac-
teristic peaks of cubic Al2O3 corresponding to the support, and
the presence of PdO is confirmed by the presence of a peak at
2q of ca. 34�.By imaging using high-angle annular-dark-field technique
in scanning transmission electron microscopy (HAADFe-
STEM), PdO nanoparticles are observed to be uniformly
anchored on the Al2O3 support (Fig. 2a). Statistical measure-
ments reveal that sizes of the crystalline PdO particles on the

Fig. 1 e XRDpatternof thePd/Al2O3 as-synthesized catalyst.
Red lines: PdO; Black lines: Al2O3. (For interpretation of the
references to color in thisfigure legend, the reader is referred
to theWeb version of this article).
i n t e r n a t i o n a l j o u r n a l o f h y d r o g e n en e r g y 4 5 ( 2 0 2 0 ) 1 2 8 3e1 2 9 6 1287
Pd/Al2O3 as-synthesized sample are in the 1e5 nm range, and
the Al2O3 supports have diameters in the 10e35 nm range. In
Fig. 2b, close inspection of the morphology reveals that most
of the PdO particles have elongated shapes and form
agglomerates.
In addition to the XRD pattern, analysis by X-ray photoelec-
tron spectroscopy (XPS) also reveals that the Pd/Al2O3 as-syn-
thesizedmaterial containsPdcatalystparticles in their terminal
PdOoxidationstate.This conclusion is supporteddirectlyby the
observed binding energy (BE) of the Pd 3d5/2 component at
336.9 eV (Fig. 3, top) [44]. The as-synthesized nature of this PdO
oxidation state is indicated by the minimal changes in the XPS
signatures of Pd 3dandC1sproducedby intentionally oxidizing
the as-synthesized sample (Fig. 3, middle). In order to charac-
terize the sample as it is used for the catalytic testing, XPS
analysis was also performed after the reduction of the sample
(Pd/Al2O3 reduced). In contrast to the as-synthesized sample,
under reducing conditions the dominant Pd 3d5/2 component
shifts to 335.3 eV (purple in Fig. 3, bottom), i.e., into the BE range
of 335.1e335.4 eV previously reported [44,45] for metallic Pd.
Furthermore, the chemistry of the associated organic material
(solid symbols in C 1s region, Fig. 3) also undergoes an apparent
reduction from oxidized to aliphatic (red and blue C 1s compo-
nents in Fig. 3, respectively) [25].
Fig. 2 e Low (a) and medium (b) magnification HAADFeS
To characterize the active surface area of the catalyst, H2
chemisorption was performed on Pd/Al2O3 reduced and the
results are summarized in Table 1. The average palladium
particle size (dM) determined by hydrogen titration is
approximately 6 nm, while the particle size determined by
HAADFeSTEM is 2.85 nm. The palladium dispersion (DM) is
19% and the metallic surface area (SM) is 83 m2 g�1. The BET
specific surface area (SBET), total pore volume (Vp), and pore
width (dp) of the Pd/Al2O3 as-synthesized catalyst were
determined by N2 physisorption, and the results are summa-
rized in Table 1. The sample presents a surface area of 118 m2
gcat�1 , a total pore volume of 0.3 cm3 gcat
�1 , and a pore width of
2 nm.
Catalytic measurements for acetylene semi-hydrogenationreaction
Fig. 4 presents the catalytic results, as a function of temper-
ature and time on stream, of acetylene semi-hydrogenation
reaction on Pd/Al2O3 reduced and Pd/Al2O3_Ref reduced,
both reduced in situ; in this sub-section, these samples will be
denoted as Pd/Al2O3 and Pd/Al2O3_Ref, respectively. Fig. 4a
presents the Arrhenius plot of ethylene formation TOF, from
which the activation energy of acetylene hydrogenation is
determined. Fig. 4b shows the variation of acetylene conver-
sion (XC2H2) and ethylene formation selectivity (SC2H4) with
temperature for both samples tested and Fig. 4c shows the
same parameters as a function of time on stream.
Both samples display an increase in acetylene conversion
and ethylene selectivity with temperature: in the case of the
reference sample (Pd/Al2O3_Ref), XC2H2 increases from 23% at
325 K to 92% at 500 K and SC2H4 increases from 34% at 325 K to
56% at 500 K. For Pd/Al2O3, XC2H2 increases from 12% at 325 K
to 97% at 500 K and SC2H4 increases from 42% at 325 K to 62% at
470 K. Pd/Al2O3 behaves similarly to the reference sample,
with somewhat higher selectivity for ethylene formation, for
the tested temperatures. Regarding the stability, evaluated
with the variation of XC2H2 and SC2H4 over time (Fig. 4c), both
samples show similar XC2H2 values at 473 K over the tested
time on stream,which decrease from 99% to 83% in the case of
TEM image of the Pd/Al2O3as-synthesized catalyst.
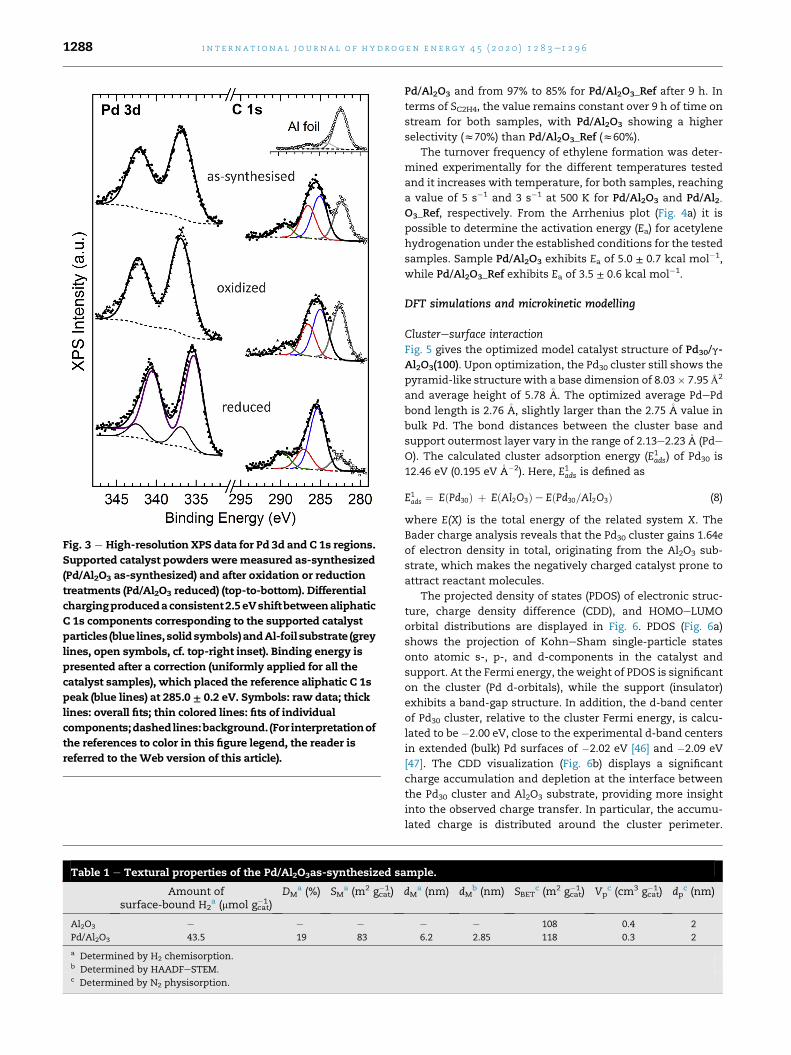
Fig. 3 e High-resolution XPS data for Pd 3d and C 1s regions.
Supported catalyst powders weremeasured as-synthesized
(Pd/Al2O3 as-synthesized) and after oxidation or reduction
treatments (Pd/Al2O3 reduced) (top-to-bottom). Differential
chargingproducedaconsistent2.5eVshiftbetweenaliphatic
C 1s components corresponding to the supported catalyst
particles (blue lines,solidsymbols) andAl-foil substrate (grey
lines, open symbols, cf. top-right inset). Binding energy is
presented after a correction (uniformly applied for all the
catalyst samples), which placed the reference aliphatic C 1s
peak (blue lines) at 285.0 ± 0.2 eV. Symbols: raw data; thick
lines: overall fits; thin colored lines: fits of individual
components;dashedlines:background. (For interpretationof
the references to color in this figure legend, the reader is
referred to theWeb version of this article).
Table 1 e Textural properties of the Pd/Al2O3as-synthesized sa
Amount ofsurface-bound H2
a (mmol gcat�1 )
DMa (%) SM
a (m2 gcat�1 )
Al2O3 e e e
Pd/Al2O3 43.5 19 83
a Determined by H2 chemisorption.b Determined by HAADFeSTEM.c Determined by N2 physisorption.
i n t e rn a t i o n a l j o u r n a l o f h y d r o g e n en e r g y 4 5 ( 2 0 2 0 ) 1 2 8 3e1 2 9 61288
Pd/Al2O3 and from 97% to 85% for Pd/Al2O3_Ref after 9 h. In
terms of SC2H4, the value remains constant over 9 h of time on
stream for both samples, with Pd/Al2O3 showing a higher
selectivity (z70%) than Pd/Al2O3_Ref (z60%).
The turnover frequency of ethylene formation was deter-
mined experimentally for the different temperatures tested
and it increases with temperature, for both samples, reaching
a value of 5 s�1 and 3 s�1 at 500 K for Pd/Al2O3 and Pd/Al2-O3_Ref, respectively. From the Arrhenius plot (Fig. 4a) it is
possible to determine the activation energy (Ea) for acetylene
hydrogenation under the established conditions for the tested
samples. Sample Pd/Al2O3 exhibits Ea of 5.0 ± 0.7 kcal mol�1,
while Pd/Al2O3_Ref exhibits Ea of 3.5 ± 0.6 kcal mol�1.
DFT simulations and microkinetic modelling
Clusteresurface interactionFig. 5 gives the optimized model catalyst structure of Pd30/g-
Al2O3(100). Upon optimization, the Pd30 cluster still shows the
pyramid-like structure with a base dimension of 8.03� 7.95 Å2
and average height of 5.78 �A. The optimized average PdePd
bond length is 2.76 �A, slightly larger than the 2.75 �A value in
bulk Pd. The bond distances between the cluster base and
support outermost layer vary in the range of 2.13e2.23 �A (Pde
O). The calculated cluster adsorption energy (E1ads) of Pd30 is
12.46 eV (0.195 eV �A�2). Here, E1ads is defined as
E1ads ¼ EðPd30Þ þ EðAl2O3Þ e EðPd30=Al2O3Þ (8)
where E(X) is the total energy of the related system X. The
Bader charge analysis reveals that the Pd30 cluster gains 1.64e
of electron density in total, originating from the Al2O3 sub-
strate, which makes the negatively charged catalyst prone to
attract reactant molecules.
The projected density of states (PDOS) of electronic struc-
ture, charge density difference (CDD), and HOMOeLUMO
orbital distributions are displayed in Fig. 6. PDOS (Fig. 6a)
shows the projection of KohneSham single-particle states
onto atomic s-, p-, and d-components in the catalyst and
support. At the Fermi energy, the weight of PDOS is significant
on the cluster (Pd d-orbitals), while the support (insulator)
exhibits a band-gap structure. In addition, the d-band center
of Pd30 cluster, relative to the cluster Fermi energy, is calcu-
lated to be �2.00 eV, close to the experimental d-band centers
in extended (bulk) Pd surfaces of �2.02 eV [46] and �2.09 eV
[47]. The CDD visualization (Fig. 6b) displays a significant
charge accumulation and depletion at the interface between
the Pd30 cluster and Al2O3 substrate, providing more insight
into the observed charge transfer. In particular, the accumu-
lated charge is distributed around the cluster perimeter.
mple.
dMa (nm) dM
b (nm) SBETc (m2 gcat
�1 ) Vpc (cm3 gcat
�1 ) dpc (nm)
e e 108 0.4 2
6.2 2.85 118 0.3 2

Fig. 4 e Catalytic measurement results as a function of the
temperature and time on stream of acetylene semi-
hydrogenation reaction on Pd/Al2O3 and Pd/Al2O3_Ref. The
Arrhenius plot of ethylene formation TOF (a), acetylene
conversion (XC2H2), and ethylene formation selectivity
(SC2H4) as a function of the temperature (b) and time on
stream (c).
i n t e r n a t i o n a l j o u r n a l o f h y d r o g e n en e r g y 4 5 ( 2 0 2 0 ) 1 2 8 3e1 2 9 6 1289
Furthermore, the HOMO and LUMO orbital distributions
(Fig. 6b) show that both states that are relevant to chemical
reactivity are mainly delocalized within the Pd30 cluster, with
very small weight on the Al2O3 support.
Acetylene hydrogenationThe optimal adsorption site of the H2 molecule was mapped
by testing H2 on different sites of the Pd30 cluster surface, and
the results are presented in supplementary material. Fig. 7
displays the structures of the initial state (IS), transition
state (TS), intermediate state (IM), and final state (FS), and the
energy diagrams along the hydrogenation pathways of
acetylene to ethylene (Fig. 7a) and consecutive unwanted
ethylene to ethane (Fig. 7b). At IS1, C2H2 binds on the hollow
site of the Pd30 surface with E2ads ¼ 2.11 eV. The adsorbed C2H2
molecule receives 0.16e electron density from the catalyst.
During the acetylene hydrogenation reaction, C2H2 is first
hydrogenated to C2H4 by attaching two H atoms through TS1,
IM1, and TS2 along the reaction pathway as shown in Fig. 7a.
In the first transition state (TS1), H atom moves to the adja-
cent Pd top site from its original hollow site with a HePd and
HeC bond of 1.57 and 1.65 �A, respectively. At the same time,
the orientation of C2H2 also changes slightly, and the acti-
vation barrier is 0.72 eV (TS1). After this, the first interme-
diate state (IM1) of C2H3 is formed with an exothermic energy
of 0.05 eV. The activation barrier for the second H atom (TS2)
is 0.75 eVwith HePd and HeC bond lengths of 1.57 and 1.88�A,
respectively. The first product molecule of C2H4 is formed in
FS1 by the H atom binding to C2H3 and the reaction energy is
�0.36 eV.
Following the first-step hydrogenation of C2H2 to C2H4, two
additional H atoms were placed on the same hollow sites of
the Pd30 surface. C2H4 prefers to bind on a bridge site of the
Pd30(H)2 surface with the adsorption energy of 1.33 eV and a
net charge of �0.05e. Next, C2H4 is hydrogenated to the final
product (FS2) of C2H6 by attaching H atoms one-by-one. The
reaction pathway in Fig. 7b includes two transition states with
activation barriers of 0.92 eV (TS3) and 0.81 eV (TS4) and one
intermediate (IM2, C2H5) with reaction energy of 0.26 eV. The
corresponding higher activation barriers give the first indica-
tion for ethylene selectivity. The final product of C2H6 (FS2) is
generated with an exothermic energy of �0.10 eV. The CeC
and CeH bond lengths of the C2H6molecule are 1.53 and 1.10�A
(1.54 and 1.11 �A in gas phase), respectively.
Microkinetic simulationsFig. 8 displays the microkinetic results for the temperature
dependence of the Arrhenius plot of ethylene formation TOF,
acetylene conversion (XC2H2), and ethylene formation selec-
tivity (SC2H4), and the surface coverages of hydrogen (qH) and
acetylene (qC2H2). The simulations show that the TOFs of
ethylene increase with temperature. The apparent activation
energy (Ea) of acetylene hydrogenation is 8.8 ± 0.6 kcal mol�1
by fitting the Arrhenius plot in Fig. 8a. Here, we need to
emphasize that this apparent activation energy is different
from the DFT-calculated activation barriers in the elementary
reaction steps, as shown in Fig. 7.
The simulated results of XC2H2 and SC2H4 as a function of
temperature are plotted in Fig. 8b. Both increase with the
temperature between 300 and 500 K; XC2H2 increases from 80%

Fig. 5 e Model structure (side view and top view) of a pyramidal Pd30 cluster on g-Al2O3 (100) surface. Color key: Pd, dark
green; O, red; Al, pink. (For interpretation of the references to color in this figure legend, the reader is referred to the Web
version of this article).
Fig. 6 e The electronic properties of Pd30/Al2O3(100) system: (a) Projected density states (PDOS) on the atomic s-, p-, and d-
orbitals in the cluster and support, respectively. The vertical line indicates the Fermi level. (b) Side view of charge density
difference (CDD) and HOMOeLUMO orbitals. The yellow and aqua colors for CDD represent charge depletion and
accumulation, respectively. For HOMO/LUMO these colors represent the different signs of the wavefunction. The isosurface
values are ±0.002 e a0¡3 for CDD and ±0.01 e a0
¡3 for HOMO and LUMO. (For interpretation of the references to color in this
figure legend, the reader is referred to the Web version of this article).
i n t e rn a t i o n a l j o u r n a l o f h y d r o g e n en e r g y 4 5 ( 2 0 2 0 ) 1 2 8 3e1 2 9 61290
at 300 K to 100% at 400 K, and SC2H4 increases from90% at 300 K
to 99% at 470 K. The formation of C4 and C6 byproducts are not
included in the current simulations, which can lower the
ethylene selectivity at the lower temperature [48].
The surface coverages of all species were also examined,
and those for hydrogen (qH) and acetylene (qC2H2) are plotted as
a function of temperature in Fig. 8c. They exhibit opposite
behavior with increasing temperature: qH decreases from
0.11 ML at 300 K to 0.06 ML at 450 K, while qC2H2 increases from
0.58 ML at 300 K to 0.70 ML at 500 K. Furthermore, the surface
coverages of vinyl, ethylene, and ethyl (not shown) are very
low in the range of the temperatures considered herein.
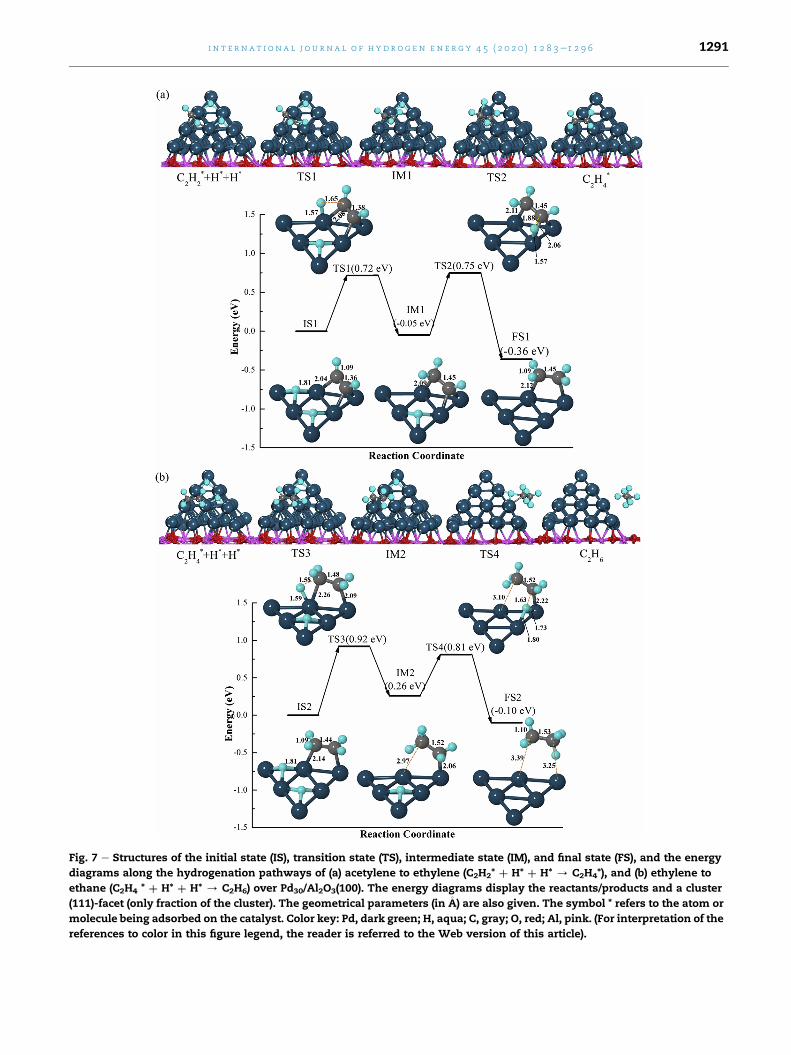
Fig. 7 e Structures of the initial state (IS), transition state (TS), intermediate state (IM), and final state (FS), and the energy
diagrams along the hydrogenation pathways of (a) acetylene to ethylene (C2H2* þ H* þ H* / C2H4*), and (b) ethylene to
ethane (C2H4 * þ H* þ H* / C2H6) over Pd30/Al2O3(100). The energy diagrams display the reactants/products and a cluster
(111)-facet (only fraction of the cluster). The geometrical parameters (in �A) are also given. The symbol * refers to the atom or
molecule being adsorbed on the catalyst. Color key: Pd, dark green; H, aqua; C, gray; O, red; Al, pink. (For interpretation of the
references to color in this figure legend, the reader is referred to the Web version of this article).
i n t e r n a t i o n a l j o u r n a l o f h y d r o g e n en e r g y 4 5 ( 2 0 2 0 ) 1 2 8 3e1 2 9 6 1291

Fig. 8 e Microkinetic modelling results as a function of
temperature in acetylene hydrogenation over Pd30/
Al2O3(100). (a) Arrhenius plot of ethylene formation TOF, (b)
acetylene conversion (XC2H2) and ethylene formation
selectivity (SC2H4), and (c) surface coverage of hydrogen (qH)
and acetylene (qC2H2).
i n t e rn a t i o n a l j o u r n a l o f h y d r o g e n en e r g y 4 5 ( 2 0 2 0 ) 1 2 8 3e1 2 9 61292
Discussion
Here, we present a combined approach using both experi-
mental and theoretical studies to develop and validate a
theoretical model for predicting the behavior of catalysts.
Typically, it is possible to find overlapping experimental and
theoretical studies in the literature, however, combined ap-
proaches are rather rare. A Pd/Al2O3 catalyst (Pd/Al2O3 as-
synthesized) was synthesized using the flame spray pyrolysis
method, a typical method for catalyst preparation, and it was
used as standard catalyst, after in situ reduction (Pd/Al2O3
reduced), to test the theoretical model obtained through
computational simulations. The performance of a representa-
tive Pd30 cluster was simulated and it was compared with the
real Pd catalyst on alumina to confirm the success of the
developed model.
Thecharacterizationof thePd/Al2O3 as-synthesized sample
by XRD showed that the Pd catalyst nanoparticles are in the
PdO state (Fig. 1), which is expected due to oxidation of the
catalysts during synthesis because ofhigh oxidation conditions
present in the flame. This resultwas confirmed byXPS analysis
with the binding energy of the Pd 3d5/2 (Fig. 3), which is in
excellent agreementwith theBEof 336.8 eVpreviously reported
by Brun et al. [44] for a reference PdO powder. However, as
shown by the XPS results, after reduction (Pd/Al2O3 reduced),
the dominant Pd 3d5/2 component is in the range of
335.1e335.4 eV, previously reported [44,45] for metallic Pd,
which means that the catalyst nanoparticles are metallic Pd
after in situ reduction and before reaction. XPS confirms the
reduction of the associated organic material from oxidized to
aliphatic, thus, supporting the conclusion that both Pd and
organic constituents of the sample become oxidized during
synthesis rather than due to subsequent exposure to air. We
note that the 0.5e3 eV higher BE values reported for the
metallic and oxidized Pd supported on insulating (e.g., alumina
[49] or zeolite [50]) particles may result from the ambiguous
nature of the C 1s component assigned as the aliphatic-carbon
BE reference: The possible artifacts due to differential charging
are highlighted by the 2.5 eV separation explicitly observed in
this work between the spectral signatures derived from the Al-
foil substrate and the supported catalyst particles (open and
solid symbols in Fig. 3, respectively).
The HAADFeSTEM shows, as expected, that the catalyst
prepared using flame spray pyrolysis (Pd/Al2O3 as-synthe-
sized) yielded spherical PdO particles with an average size of
2.85 nm (Table 1), uniformly distributed on the supporting
material (Fig. 2). The obtained average size and particle shape
is similar to those reported, for example, by Strobel et al. [51]
for Pd on alumina also prepared by FSP, which presents
spherically shaped Pd nanoparticles with an average size of
2.7 nm. The structure and morphology of the support were
maintained after the deposition of the Pd nanoparticles (Table
1). The specific surface area (SBET), pore volume (Vp), and pore
diameter (dp) are similar for the used Al2O3 support and for the
Pd/Al2O3 as-synthesized catalyst, which confirms that the
deposition of the Pd nanoparticles did not alter the micro-
structure of the support. Similarly to the Pd particle size, the
microstructure of our sample is comparable to the properties
of the catalyst prepared by Strobel et al. [51], which had a
specific surface area of 120 m2 gcat�1 .
The particle sizewas determined both by HAADFeSTEMon
the Pd/Al2O3 as-synthesized sample and H2 chemisorption on
the Pd/Al2O3 reduced catalyst (Table 1), and the particle size
obtained fromH2 chemisorption is higher. This discrepancy is
due to the different weighting of the two procedures: chemi-
sorption determines the surface-area weighted diameter,
while HAADFeSTEM determines the number-average diam-
eter. Importantly, the value determined by chemisorption
provides valuable information for heterogeneous catalysis, as
it is related to the activemetallic surface area. The values of Pd
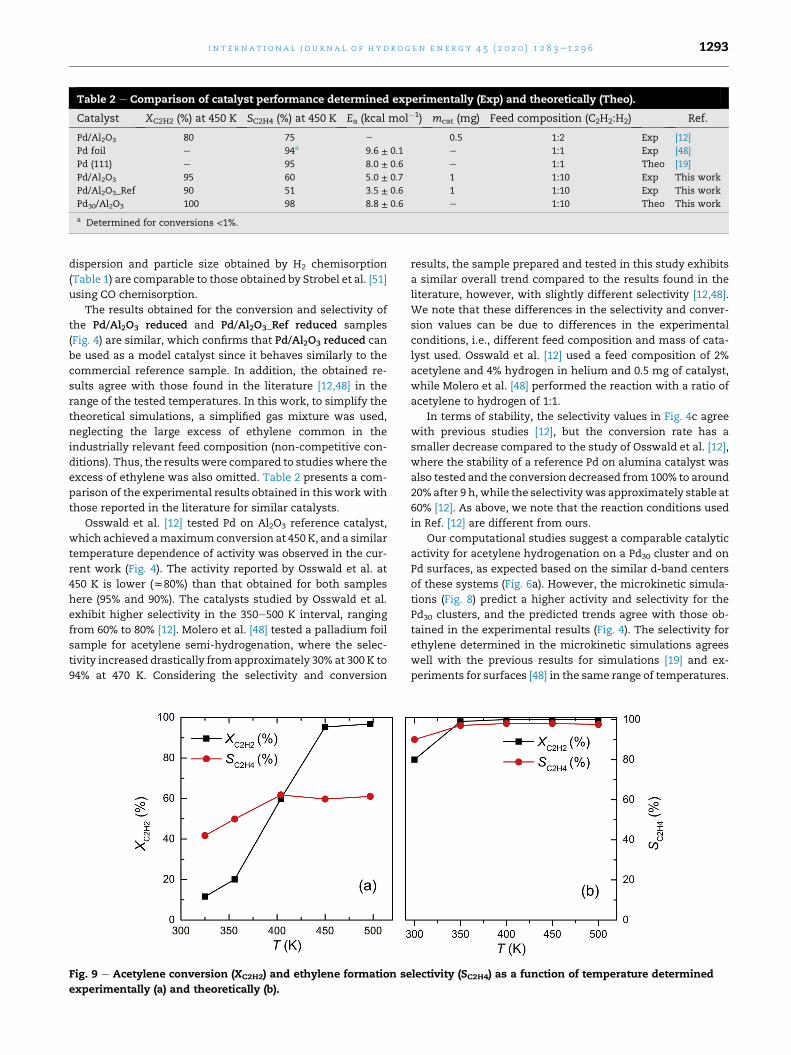
Table 2 e Comparison of catalyst performance determined experimentally (Exp) and theoretically (Theo).
Catalyst XC2H2 (%) at 450 K SC2H4 (%) at 450 K Ea (kcal mol�1) mcat (mg) Feed composition (C2H2:H2) Ref.
Pd/Al2O3 80 75 e 0.5 1:2 Exp [12]
Pd foil e 94a 9.6 ± 0.1 e 1:1 Exp [48]
Pd (111) e 95 8.0 ± 0.6 e 1:1 Theo [19]
Pd/Al2O3 95 60 5.0 ± 0.7 1 1:10 Exp This work
Pd/Al2O3_Ref 90 51 3.5 ± 0.6 1 1:10 Exp This work
Pd30/Al2O3 100 98 8.8 ± 0.6 e 1:10 Theo This work
a Determined for conversions <1%.
i n t e r n a t i o n a l j o u r n a l o f h y d r o g e n en e r g y 4 5 ( 2 0 2 0 ) 1 2 8 3e1 2 9 6 1293
dispersion and particle size obtained by H2 chemisorption
(Table 1) are comparable to those obtained by Strobel et al. [51]
using CO chemisorption.
The results obtained for the conversion and selectivity of
the Pd/Al2O3 reduced and Pd/Al2O3_Ref reduced samples
(Fig. 4) are similar, which confirms that Pd/Al2O3 reduced can
be used as a model catalyst since it behaves similarly to the
commercial reference sample. In addition, the obtained re-
sults agree with those found in the literature [12,48] in the
range of the tested temperatures. In this work, to simplify the
theoretical simulations, a simplified gas mixture was used,
neglecting the large excess of ethylene common in the
industrially relevant feed composition (non-competitive con-
ditions). Thus, the results were compared to studieswhere the
excess of ethylene was also omitted. Table 2 presents a com-
parison of the experimental results obtained in this work with
those reported in the literature for similar catalysts.
Osswald et al. [12] tested Pd on Al2O3 reference catalyst,
which achieved amaximumconversion at 450 K, and a similar
temperature dependence of activity was observed in the cur-
rent work (Fig. 4). The activity reported by Osswald et al. at
450 K is lower (z80%) than that obtained for both samples
here (95% and 90%). The catalysts studied by Osswald et al.
exhibit higher selectivity in the 350e500 K interval, ranging
from 60% to 80% [12]. Molero et al. [48] tested a palladium foil
sample for acetylene semi-hydrogenation, where the selec-
tivity increased drastically from approximately 30% at 300 K to
94% at 470 K. Considering the selectivity and conversion
Fig. 9 e Acetylene conversion (XC2H2) and ethylene formation se
experimentally (a) and theoretically (b).
results, the sample prepared and tested in this study exhibits
a similar overall trend compared to the results found in the
literature, however, with slightly different selectivity [12,48].
We note that these differences in the selectivity and conver-
sion values can be due to differences in the experimental
conditions, i.e., different feed composition and mass of cata-
lyst used. Osswald et al. [12] used a feed composition of 2%
acetylene and 4% hydrogen in helium and 0.5 mg of catalyst,
while Molero et al. [48] performed the reaction with a ratio of
acetylene to hydrogen of 1:1.
In terms of stability, the selectivity values in Fig. 4c agree
with previous studies [12], but the conversion rate has a
smaller decrease compared to the study of Osswald et al. [12],
where the stability of a reference Pd on alumina catalyst was
also tested and the conversion decreased from 100% to around
20% after 9 h, while the selectivity was approximately stable at
60% [12]. As above, we note that the reaction conditions used
in Ref. [12] are different from ours.
Our computational studies suggest a comparable catalytic
activity for acetylene hydrogenation on a Pd30 cluster and on
Pd surfaces, as expected based on the similar d-band centers
of these systems (Fig. 6a). However, the microkinetic simula-
tions (Fig. 8) predict a higher activity and selectivity for the
Pd30 clusters, and the predicted trends agree with those ob-
tained in the experimental results (Fig. 4). The selectivity for
ethylene determined in the microkinetic simulations agrees
well with the previous results for simulations [19] and ex-
periments for surfaces [48] in the same range of temperatures.
lectivity (SC2H4) as a function of temperature determined
i n t e rn a t i o n a l j o u r n a l o f h y d r o g e n en e r g y 4 5 ( 2 0 2 0 ) 1 2 8 3e1 2 9 61294
The quantitative differences between the experiments (Pd/
Al2O3 reduced) and theory (Pd30/Al2O3(100)) can be explained
by the particle size: the clusters in Pd30/Al2O3(100) are
considerably smaller than the Pd nanoparticles on Pd/Al2O3
reduced, which explains the lower experimental selectivity.
The larger Pd nanoparticles favor the formation of the b-hy-
dride phase, which supplies active hydride species to surfaces
resulting in full hydrogenation of acetylene to ethane, thus
decreasing the ethylene selectivity [52,53]. Furthermore, our
microkinetic model has been parameterized at low coverage
limit which may affect the results.
The computed activation energy over Pd30/Al2O3(100)
(8.8 ± 0.6 kcal mol�1) is comparable to the experimental value
obtained by Molero et al. [48] of 9.6 ± 0.1 kcal mol�1 over a
clean Pd foil, and with the computed one by Mei et al. [19] of
8.0 ± 0.6 kcal mol�1 over Pd(111), at the conditions of P(H2)-
¼ P(C2H2) ¼ 100 Torr and temperature range of 300e500 K, but
the activation energy obtained experimentally for the Pd/
Al2O3 reduced sample is slightly lower (5.0 ± 0.7 kcal mol�1).
Again, these values are sensitive to the experimental condi-
tions (feed composition), catalyst itself (film, nanoparticle), as
well as synthetic history.
Fig. 9 shows the comparison between the acetylene con-
version (XC2H2) and ethylene formation selectivity (SC2H4) re-
sults as a function of temperature determined experimentally
and theoretically. It can be observed that the results obtained
experimentally with the Pd/Al2O3 reduced catalyst qualita-
tively agree with the microkinetic simulations based on pa-
rameters from extensive DFT calculations over a Pd30/
Al2O3(100) model catalyst. The predicted and experimental
conversions agree well at temperatures above 450 K, while
selectivities and conversions at lower temperatures are
different, apart from the agreement in the general trend of
increasing of activity and selectivity with temperature. In
addition to the aforementioned reasons, the mismatch be-
tween theory and experiment may be due to simplifications
used in the modelling, where the dissolution of hydrogen and
carbon in the Pd subsurface region were not considered [52].
More expensive calculations where the structure of the Pd
cluster is flexible and can be refined are required to improve
the theoretical results. Nevertheless, the good agreement at
high temperatures shows that the model used in this study
can be used for fast screening of potential catalysts, especially
of intermetallic catalysts with covalent bonding, where the
dissolution of hydrogen or carbon is suppressed [24].
Conversely, the high selectivity predicted by the theory in-
dicates that novel material designs that attempt to minimize
the dissolution of hydrogen and carbon in Pd should be
considered for increasing the selectivity of the practical
catalysts.
Conclusions
It has been shown that by high-throughput FSP method it is
possible to prepare large quantities of active and selective Pd
catalyst for the acetylene semi-hydrogenation reaction. In
particular, the prepared catalyst, reduced in situ, achieves a
conversion of acetylene of 97% at 500 K and a selectivity to
ethylene of 62% at 470 K. Furthermore, these results correlate
with the microkinetic simulations based on parameters from
extensive DFT calculations over a Pd30/Al2O3(100) model
catalyst. The insights gained from this direct comparison can
be applied to a parallel computational screening of complex
hydrogenation catalysts and synthesis and investigation of
the most promising candidates, in the context of both indus-
trial polymerization process and novel applications in the H2
economy.
Acknowledgements
This work was supported by the European Union's Horizon
2020 research and innovation program through the CritCat
Project under Grant Agreement No. 686053. L.P.L.G. is thankful
for the support to FCT PhD grant SFRH/BD/128986/2017. This
work is also a result of: Project “AIProcMat@N2020 - Advanced
Industrial Processes and Materials for a Sustainable Northern
Region of Portugal 2020”, with the reference NORTE-01-0145-
FEDER-000006, supported by Norte Portugal Regional Opera-
tional Programme (NORTE 2020), under the Portugal 2020
Partnership Agreement, through the European Regional
Development Fund (ERDF); Associate Laboratory LSRE-LCM e
UID/EQU/50020/2019 e funded by national funds through FCT
/ MCTES (PIDDAC). The DFT calculations were carried out in
CSC - the IT Center for Science Ltd., Espoo, Finland.
Appendix A. Supplementary data
Supplementary data to this article can be found online at
https://doi.org/10.1016/j.ijhydene.2019.04.086.
r e f e r e n c e s
[1] Borodzi�nski A, Bond GC. Selective hydrogenation of ethynein ethene-rich streams on palladium catalysts. Part 1.Effect of changes to the catalyst during reaction. Catal RevSci Eng 2006;48:91e144. https://doi.org/10.1080/01614940500364909.
[2] Spanjers CS, Held JT, Jones MJ, Stanley DD, Sim RS, Janik MJ,et al. Zinc inclusion to heterogeneous nickel catalystsreduces oligomerization during the semi-hydrogenation ofacetylene. J Catal 2014;316:164e73. https://doi.org/10.1016/j.jcat.2014.05.007.
[3] Trimm DL, Liu IOY, Cant NW. The selective hydrogenation ofacetylene over a Ni/SiO2 catalyst in the presence andabsence of carbon monoxide. Appl Catal A Gen2010;374:58e64. https://doi.org/10.1016/j.apcata.2009.11.030.
[4] Guczi L, Moln�ar �A, Teschner D. Hydrogenation reactions:concepts and practicevol. 7. Elsevier Ltd.; 2013. https://doi.org/10.1016/B978-0-08-097774-4.00713-0.
[5] Okada Y, Sasaki E, Watanabe E, Hyodo S, Nishijima H.Development of dehydrogenation catalyst for hydrogengeneration in organic chemical hydride method. Int JHydrogen Energy 2006;31:1348e56. https://doi.org/10.1016/j.ijhydene.2005.11.014.
[6] Guo Z, Liu Y, Liu Y, Chu W. Promising SiC support for Pdcatalyst in selective hydrogenation of acetylene to ethylene.Appl Surf Sci 2018;442:736e41. https://doi.org/10.1016/j.apsusc.2018.02.145.
i n t e r n a t i o n a l j o u r n a l o f h y d r o g e n en e r g y 4 5 ( 2 0 2 0 ) 1 2 8 3e1 2 9 6 1295
[7] Kim SK, Kim C, Lee JH, Kim J, Lee H, Moon SH. Performance ofshape-controlled Pd nanoparticles in the selectivehydrogenation of acetylene. J Catal 2013;306:146e54. https://doi.org/10.1016/j.jcat.2013.06.018.
[8] Benavidez AD, Burton PD, Nogales JL, Jenkins AR, Ivanov SA,Miller JT, et al. Improved selectivity of carbon-supportedpalladium catalysts for the hydrogenation of acetylene inexcess ethylene. Appl Catal A Gen 2014;482:108e15. https://doi.org/10.1016/j.apcata.2014.05.027.
[9] Moln�ar �A, S�ark�any A, Varga M. Hydrogenation of carbon-carbon multiple bonds: chemo-, regio- and stereo-selectivity.J Mol Catal A Chem 2001;173:185e221. https://doi.org/10.1016/S1381-1169(01)00150-9.
[10] Zhang Q, Li J, Liu X, Zhu Q. Synergetic effect of Pd and Agdispersed on Al2O3 in the selective hydrogenation ofacetylene. Appl Catal A Gen 2000;197:221e8. https://doi.org/10.1016/S0926-860X(99)00463-9.
[11] Osswald J, Giedigkeit R, Jentoft RE, Armbruster M, Girgsdies F,Kovnir K, et al. Palladium-gallium intermetallic compoundsfor the selective hydrogenation of acetylene. Part I:preparation and structural investigation under reactionconditions. J Catal 2008;258:210e8. https://doi.org/10.1016/j.jcat.2008.06.013.
[12] Osswald J, Kovnir K, Armbruster M, Giedigkeit R, Jentoft RE,Wild U, et al. Palladium-gallium intermetallic compounds forthe selective hydrogenation of acetylene. Part II: surfacecharacterization and catalytic performance. J Catal2008;258:219e27. https://doi.org/10.1016/j.jcat.2008.06.014.
[13] Han Y, Peng D, Xu Z, Wan H, Zheng S, Zhu D. TiO2 supportedPd@Ag as highly selective catalysts for hydrogenation ofacetylene in excess ethylene. Chem Commun 2013;49:8350.https://doi.org/10.1039/c3cc43511c.
[14] Pei GX, Liu XY, Wang A, Lee AF, Isaacs MA, Li L, et al. Agalloyed Pd single-atom catalysts for efficient selectivehydrogenation of acetylene to ethylene in excess ethylene.ACS Catal 2015;5:3717e25. https://doi.org/10.1021/acscatal.5b00700.
[15] Kim E, Shin EW, Bark CW, Chang I, Yoon WJ, Kim WJ. Pdcatalyst promoted by two metal oxides with differentreducibilities: properties and performance in the selectivehydrogenation of acetylene. Appl Catal A Gen 2014;471:80e3.https://doi.org/10.1016/j.apcata.2013.11.036.
[16] S�ark�any A, Weiss AH, Guczi L. Structure sensitivity ofacetylene-ethylene hydrogenation over Pd catalysts. JCatal 1986;98:550e3. https://doi.org/10.1016/0021-9517(86)90343-X.
[17] Crespo-Quesada M, Yarulin A, Jin M, Xia Y, Kiwi-Minsker L.Structure sensitivity of alkynol hydrogenation on shape- andsize-controlled palladium nanocrystals: which sites are mostactive and selective? J Am Chem Soc 2011;133:12787e94.https://doi.org/10.1021/ja204557m.
[18] Sheth PA, Neurock M, Smith CM. A first-principles analysis ofacetylene hydrogenation over Pd (111). J Phys Chem B2003:2009e17. https://doi.org/10.1021/jp021342p.
[19] Mei D, Sheth PA, Neurock M, Smith CM. First-principles-based kinetic Monte Carlo simulation of the selectivehydrogenation of acetylene over Pd (111). J Catal2006;242:1e15. https://doi.org/10.1016/j.jcat.2006.05.009.
[20] Ma L, Lv C, Wang G. A DFT study and micro-kinetic analysisof acetylene selective hydrogenation on Pd-doped Cu (111)surfaces. Appl Surf Sci 2017;410:154e65. https://doi.org/10.1016/j.apsusc.2017.01.084.
[21] Yang J, Lv CQ, Guo Y, Wang GC. A DFTþU study of acetyleneselective hydrogenation on oxygen defective anatase (101)and rutile (110) TiO2 supported Pd4 cluster. J Chem Phys2012;136:104107. https://doi.org/10.1063/1.3692292.
[22] Meng LD, Wang GC. A DFT þ U study of acetylene selectivehydrogenation over anatase supported PdaAgb(a þ b ¼ 4)
cluster. Phys Chem Chem Phys 2014;16:17541e50. https://doi.org/10.1039/c4cp01818d.
[23] M€adler L, Kammler HK, Mueller R, Pratsinis SE. Controlledsynthesis of nanostructured particles by flame spraypyrolysis. J Aerosol Sci 2002;33:369e89. https://doi.org/10.1016/S0021-8502(01)00159-8.
[24] Kovnir K, Armbruster M, Teschner D, Venkov TV,Szentmikl�osi L, Jentoft FC, et al. In situ surfacecharacterization of the intermetallic compound PdGa - ahighly selective hydrogenation catalyst. Surf Sci2009;603:1784e92. https://doi.org/10.1016/j.susc.2008.09.058.
[25] Lock EH, Petrovykh DY, Mack P, Carney T, White RG,Walton SG, et al. Surface composition, chemistry, andstructure of polystyrene modified by electron-beam-generated plasma. Langmuir 2010;26:8857e68. https://doi.org/10.1021/la9046337.
[26] Stine R, Petrovykh DY. Oriented self-assembled monolayersof bifunctional molecules on InAs. J Electron Spectrosc RelatPhenom 2009;172:42e6. https://doi.org/10.1016/j.elspec.2009.02.001.
[27] Petrovykh DY, Smith JC, Clark TD, Stine R, Baker LA,Whitman LJ. Self-assembled monolayers of alkanethiols onInAs. Langmuir 2009;25:12185e94. https://doi.org/10.1021/la804314j.
[28] Li Y, Jang BW-L. Selective hydrogenation of acetylene overPd/Al2O3 catalysts: effect of non-thermal RF plasmapreparation methodologies. Top Catal 2017;60:997e1008.https://doi.org/10.1007/s11244-017-0765-5.
[29] CP2K n.d. http://www.cp2k.org (accessed November 3, 2017).[30] VandeVondele J, Krack M, Mohamed F, Parrinello M,
Chassaing T, Hutter J. QUICKSTEP: fast and accurate densityfunctional calculations using a mixed. Gaussian Plane WavesApproach 2005;167:103e28. https://doi.org/10.1016/j.cpc.2004.12.014.
[31] Perdew JP, Burke K, Ernzerhof M. Generalized gradientapproximation made simple. Phys Rev Lett 1996;77:3865e8.https://doi.org/10.1103/PhysRevLett.77.3865.
[32] Goedecker S, Teter M, Hutter J. Separable dual-spaceGaussian pseudopotentials. Phys Rev B 1996;54:1703e10.https://doi.org/10.1103/PhysRevB.54.1703.
[33] Vandevondele J, Hutter J. Gaussian basis sets for accuratecalculations on molecular systems in gas and condensedphases. J Chem Phys 2007;127:114105. https://doi.org/10.1063/1.2770708.
[34] Lippert G, Hutter J, Parrinello M. A hybrid Gaussian and planewave density functional scheme. Mol Phys 1997;92:477e87.https://doi.org/10.1080/002689797170220.
[35] Grimme S, Antony J, Ehrlich S, Krieg H. A consistent andaccurate ab initio parametrization of density functionaldispersion correction ( DFT-D ) for the 94 elements H-Pu. JChem Phys 2010;132:154104. https://doi.org/10.1063/1.3382344.
[36] Tang W, Sanville E, Henkelman G. A grid-based Baderanalysis algorithm without lattice bias. J Phys CondensMatter 2009;21:084204. https://doi.org/10.1088/0953-8984/21/8/084204.
[37] Bader RFW. A quantum theory of molecular structure and itsapplications. Chem Rev 1991;91:893e928. https://doi.org/10.1021/cr00005a013.
[38] Henkelman G, Uberuaga BP, J�onsson H. A climbing imagenudged elastic band method for finding saddle points andminimum energy paths A climbing image nudged elasticband method for finding saddle points and minimum energypaths. J Chem Phys 2016;113:9901e4. https://doi.org/10.1063/1.1329672.
[39] Digne M, Sautet P, Raybaud P, Euzen P, Toulhoat H. Use ofDFT to achieve a rational understanding of acid e basic
i n t e rn a t i o n a l j o u r n a l o f h y d r o g e n en e r g y 4 5 ( 2 0 2 0 ) 1 2 8 3e1 2 9 61296
properties of g -alumina surfaces. J Catal 2004;226:54e68.https://doi.org/10.1016/j.jcat.2004.04.020.
[40] Honkanen M, Wang J, K€arkk€ainen M, Huuhtanen M, Jiang H,Kallinen K, et al. Regeneration of sulfur-poisoned Pd-basedcatalyst for natural gas oxidation. J Catal 2018;358:253e65.https://doi.org/10.1016/j.jcat.2017.12.021.
[41] Ma L, Melander M, Weckman T, Lipasti S, Laasonen K,Akola J. DFT simulations and microkinetic modelling of 1-pentyne hydrogenation on Cu20 model catalysts. J Mol GraphModel 2016;65:61e70. https://doi.org/10.1016/j.jmgm.2016.02.007.
[42] Ma L, Melander M, Weckman T, Laasonen K, Akola J. COoxidation on the Au15Cu15 cluster and the role of vacanciesin the MgO (100) support. J Phys Chem C 2016;120:26747e58.https://doi.org/10.1021/acs.jpcc.6b06876.
[43] Ma L, Laasonen K, Akola J. Catalytic activity of AuCu clusterson MgO (100): effect of alloy composition for CO oxidation. JPhys Chem C 2017;121:10876e86. https://doi.org/10.1021/acs.jpcc.6b12054.
[44] Brun M, Berthet A, Bertolini JC. XPS, AES and Auger parameterof Pd and PdO. J Electron Spectrosc Relat Phenom1999;104:55e60. https://doi.org/10.1016/S0368-2048(98)00312-0.
[45] Powell CJ. Recommended Auger parameters for 42 elementalsolids. J Electron Spectrosc Relat Phenom 2012;185:1e3.https://doi.org/10.1016/j.elspec.2011.12.001.
[46] Gorzkowski MT, Lewera A. Probing the limits of d - bandcenter theory: electronic and electrocatalytic properties ofPd-shell � Pt-core nanoparticles. J Phys Chem C2015;119:18389e95. https://doi.org/10.1021/acs.jpcc.5b05302.
[47] Hofmann T, Yu TH, Folse M, Weinhardt L, Ba M, Zhang Y,et al. Using photoelectron spectroscopy and quantum
mechanics to determine d - band energies of metals forcatalytic applications. J Phys Chem C 2012;116:24016e26.https://doi.org/10.1021/jp303276z.
[48] Molero H, Bartlett BF, Tysoe WT. The hydrogenation ofacetylene catalyzed by Palladium : hydrogen pressuredependence. J Catal 1999;181:49e56. https://doi.org/10.1006/jcat.1998.2294.
[49] Babu NS, Lingaiah N, Gopinath R, Sankar Reddy PS,Sai Prasad PS. Characterization and reactivity ofalumina-supported Pd catalysts for the room-temperature hydrodechlorination of chlorobenzene. JPhys Chem C 2007;111:6447e53. https://doi.org/10.1021/jp065866r.
[50] Mandal S, Roy D, Chaudhari RV, Sastry M. Pt and Pdnanoparticles immobilized on amine-functionalized zeolite:excellent catalysts for hydrogenation and heck reactions.Chem Mater 2004;16:3714e24. https://doi.org/10.1021/cm0352504.
[51] Strobel R, Krumeich F, Stark WJ, Pratsinis SE, Baiker A. Flamespray synthesis of Pd/Al2O3catalysts and their behavior inenantioselective hydrogenation. J Catal 2004;222:307e14.https://doi.org/10.1016/j.jcat.2003.10.012.
[52] Gigola CE, Aduriz HR, Bodnariuk P. Particle size effect in thehydrogenation of acetylene under industrial conditions. ApplCatal 1986;27:133e44. https://doi.org/10.1016/S0166-9834(00)81052-0.
[53] Teschner D, Borsodi J, Wootsch A, R�evay Z, H€avecker M. Theroles of subsurface carbon and hydrogen in palladium-catalyzed alkyne hydrogenation. Science 2008;320(80):86e90.https://doi.org/10.1126/science.1155200.