colorado parks and wildlife avian research …
TRANSCRIPT

COLORADO PARKS AND WILDLIFE AVIAN RESEARCH PROGRAM STUDY PLAN March 1, 2015
COLUMBIAN SHARP-TAILED GROUSE DEMOGRAPHIC RESPONSE TO HABITAT
IMPROVEMENTS
Principal Investigator Anthony D. Apa, Ph.D., Colorado Parks and Wildlife, Avian Research Program
Cooperators
Jim Haskins and Bill deVergie, Area Wildlife Managers; Brad Petch, Senior Terrestrial Biologist; Trevor Balzer, Sagebrush Habitat Coordinator; Kathy Griffin, Grouse Coordinator; Liza Rossi, Brian Holmes, and Jeff Yost, Terrestrial Biologists, Michael Warren, Energy Liaison; Becky Jones, Biologist-RMBO/NRCS/CPW.
STUDY PLAN APPROVAL Prepared by: Prepared by: _____________________________ Date: __________________ Submitted by: ____________________________ Date: ___________________ Reviewed by: ____________________________ Date: ___________________ ____________________________ Date: ___________________ ____________________________ Date: ___________________ Reviewed by: ____________________________ Date: ___________________ Biometrician Approved by: ____________________________ Date: ___________________ Avian Research Leader

2
COLORADO PARKS AND WILDLIFE AVIAN RESEARCH PROGRAM STUDY PLAN March 1, 2015
TITLE: Columbian Sharp-tailed Grouse Demographic Response to Habitat Improvements AUTHOR: Anthony D. Apa PROJECT PERSONNEL: Jim Haskins and Bill deVergie, Area Wildlife Managers; Brad Petch, Senior Terrestrial Biologist; Trevor Balzer Sagebrush Habitat Coordinator; Kathy Griffin, Grouse Coordinator; Liza Rossi, Brian Holmes, and Jeff Yost, Terrestrial Biologists, Michael Warren, Energy Liaison; Becky Jones, Biologist-RMBO/NRCS/CPW. NEED
The Columbian sharp-tailed grouse (CSTG, Tympanuchus phasianellus columbianus) is one of 6 subspecies of sharp-tailed grouse in North America (Connelly et al. 1998). Historically its distribution ranged from the northwest in British Columbia to the southwest in Colorado (Aldrich 1963, Miller and Graul 1980). Isolated populations exist (or formally existed) in Washington, Idaho, Wyoming, Colorado, Montana (extirpated), Utah, Nevada (reintroduced) and Oregon (reintroduced) (Bart 2000, Hoffman et al. 2015) occupying 10% of its former range (U.S. Department of the Interior 2000). Habitat loss and degradation from anthropogenic activities are cited as the primary reasons for its decline (Yocom 1952, Giesen and Braun 1993, McDonald and Reese 1998, Schroeder et al. 2000) with the conversion of native shrub plant communities to agricultural production being the most prevalent.
The United States Fish and Wildlife Service (USFWS) has been petitioned twice to list the CSTG for protections under the Endangered Species Act and concluded that the CSTG was not warranted for listing following both petitions (U.S. Department of the Interior 2000, 2006). ESA listing was, in part, not warranted because of CSTG range expansion facilitated by Conservation Reserve Program (CRP) in 1985 and subsequent reauthorizations. CSTG have increased in distribution and densities primarily in Idaho, Utah, and Colorado (U.S. Department of the Interior 2000) and the USFWS concluded that these efforts secured the larger metapopulations of CSTG and thus, the CSTG was not at risk of extinction. The CSTG (Mountain Sharp-tail) is a game species in Colorado, and is designated as a species of “state special concern.” There have been efforts to increase the range of CSTG through reintroductions into vacant habitat in Oregon and Nevada. Additional reintroduction efforts have occurred within Utah, and Colorado to expand its range into historic vacant suitable habitat (Colorado; Dolores and Grand counties).
The CSTG historically inhabited, and currently inhabits where available, native big sagebrush (Artemisia tridentata spp.) mountain shrub, and shrub-steppe communities in western North America (Connelly et al. 1998). By the mid-1950’s to mid-1960’s many of the native sagebrush communities on private land were converted to agricultural production (Braun et al. 1976). These practices continued into the mid-1980’s until the 1985 Farm Bill provided an opportunity for private landowners to enroll highly erodible lands into the CRP which ultimately removed these agricultural lands from production (Negus et al. 2010). Since the goal was to stabilize erodible soils, many CRP planting seed mixes included only 2-3 plant species (Boisvert 2002, Negas et al. 2010). Generally, CRP fields provide breeding, summer, and fall habitat for CSTG in the western United States (Sirotnak et al. 1991, Apa 1998, Hoffman 2001, Rodgers and Hoffman 2005, Gorman and Hoffman 2010, Stinson and Schroeder 2012, Hoffman et al. 2015), but do not provide substantial winter habitat (Schneider 1994, Ulliman 1995).
In Colorado a preponderance of plantings were seeded to intermediate wheatgrass (Agropyron intermedium), smooth brome (Bromus inermis), and occasionally included alfalfa (Meticago sativa) (Hoffman 2001, Hoffman et al. 2015). These mixes resulted in mature herbaceous stands of grass that
3
provide marginal benefits to CSTG (Hoffman et al. 2015). In some situations in Washington, CRP fields were so small in size, McDonald (1998) hypothesized that these stands could act as ecological traps (Gates and Gysel 1978, Best 1986) for nesting CSTG females. There are concerns that aging CRP fields are of reduced quality and an issue for the production and survival of CSTG (Boisvert 2002, Gillette 2014, Hoffman et al. 2015). Many CRP fields in Colorado and elsewhere once supported high quality habitat, but more recently have declined in quality (Negus et al. 2010). Additionally, some CRP plantings in Idaho were sufficiently diverse to support CSTG (Apa 1998) and facilitate range expansion (Mallett 2000).
In contrast, mineland reclamation sites in northwest Colorado have been shown to be beneficial to CSTG and provide high quality spring-summer-fall habitat to CSTG when compared to CRP (Boisvert 2002) or native rangeland (Collins 2004). Mineland reclamation provides sufficient quality to support favorable demographic rates for females when compared to CRP. Boisvert (2002) reported that the 282 day post-capture female survival rate in mineland reclamation was two times higher than survival of females captured in CRP. In addition, females that inhabited CRP had more than 11 times higher proportional hazards mortality risk than females in mineland reclamation. Boisvert (2002) also reported higher CSTG productivity in mineland reclamation habitat. Nest success was nearly five times higher for females nesting in mineland reclamation when compared to CRP. In addition, Boisvert (2002) reported that chick mortality was higher for females that inhabited native shrubland communities and CRP when compared to females in mineland reclamation. Boisvert (2002) concluded that CRP and upland shrub habitats likely were deficient in quality brood-rearing resources (e.g. forbs).
Although CRP fields do not provide all the life requisites for CSTG (e.g. winter habitat; Connelly et al 1998, Schneider 1994, Ulliman 1995), and CRP provides only marginal benefits to CSTG in Colorado (Boisvert 2002) and Idaho (Gillette 2014), CRP is substantially better than fields in active agricultural production (Sirotnak et al. 1991, Mallet 2000, Hoffman 2001, Boisvert 2002, Gillette 2014). This is because CRP replaced agricultural crops with perennial grasses and forbs effectively linking native sagebrush communities between private and public land. These larger functioning landscapes provide generalist species like the CSTG (Apa 1998) suitable habitat (Hoffman 2001, Rodgers and Hoffman 2005) on a large scale.
Thus, based on past observational research, and that some existing CRP habitats are not occupied by CSTG, there is building evidence that management efforts could improve existing or expired CRP and that habitat improvements could be beneficial for CSTG. This has resulted in management recommendations to improve CRP quality (Hoffman 2001, 2015, Boisvert 2002, Gillette 2014) by improving existing CRP (1-2 grass and < 3 forb species) that provides low quality CSTG nesting and brood-rearing habitat. Habitat improvements (adding legumes and bunchgrasses) would enhance CSTG habitat quality and suitability and could improve population productivity and growth (Gillette 2014). Habitat improvements could also counteract losses in CRP due to contract conclusion and an overall reduction of CRP (Gillette 2014, Hoffman et al. 2015) or mitigate other potential threats (oil and gas development; Hoffman et al. 2015).
Ecological theory supporting habitat improvements (quality) through wildlife habitat enhancement and/or management has been a long established tenet of wildlife management (Leopold 1933, Dassman 1964), but the wildlife-habitat relationship is complex (Morrison et al. 2006). The understanding of the wildlife-habitat relationship is constantly evolving through defining and assessing habitat quality as it relates to population growth rates, density, and demographic rates (Van Horne 1983, Knutsen et al 2006, Johnson 2007). This is especially true when attempting to couple the intended or unintended changes in habitat quality with the mechanisms inherent with wildlife population change, especially with avian species (Marzluff et al. 2000).
The assessment of habitat quality in relation to avian species is a complex question and an issue of concern for wildlife and habitat managers (Marzluff et al. 2000). Knutson et al. (2006) reviewed approaches to assess habitat quality and suggested that estimates of abundance, food availability, nest survival, annual productivity, and annual survival (see Knutson et al. 2006 for citations) should be
4
included as indicators of habitat quality. Additionally, home range size had been shown to be inversely related to habitat quality (Cody 1985), but Knutson et al. (2006) concluded that there is no single indicator of habitat quality. Johnson (2007) furthered recommendations by Franklin et al. (2000) and suggested that several possible indicators of habitat quality should be assessed because if only one parameter is used it could lead to misrepresentations of habitat quality (e.g. density; Van Horne 1983). Therefore, when attempting to link habitat-specific measurements of quality to the performance or productivity of birds, research should address demography (Johnson 2007) in an effort to hypothesize a causal link between a demographic population response and a change in habitat quality (Block and Brennan 1993, Hall et al. 1997, Knutson et al. 2006, Johnson 2007).
Although it would be desirable to experimentally manipulate as many mechanisms that influence demography as possible, it is financially and logistically impractical. Thus, it could be advantageous to experimentally manipulate a minimal number of mechanisms (e.g. nest sites, food) and gain a thorough understanding of these and then use observation and future research to infer the remaining suite of mechanisms (Marzluff et al. 2000; Fig. 1). To better understand and improve the predictive ability of habitat quality improvements on population viability, the mechanisms responsible for these changes need additional understanding (Raphael and Maurer 1990, Marzluff et al. 2000; Fig 1.).
For the purposes of this proposal, habitat quality is defined as “the ability of the environment to provide conditions appropriate for survival, reproduction, and population persistence” (Block and Brennan 1993:38). Johnson (2007) suggests that habitat quality is best described and defined at the perspective of the individual as the per capita rate of population change for a given habitat. Thus, abundance, reproduction and survival are the most efficient measures to assess habitat quality (Virkkala 1990, Homes et al. 1996, Franklin et al. 2000, Murphy 2001, Persson 2003, Knutson et al. 2006, Johnson 2007). Specifically, since survival and reproduction directly influence a population growth rate (λ), Sӕther and Bakke (2000) suggest that λ is also an important parameter to assess habitat quality, especially in single species management (Williams et al. 2002, Johnson 2007). Williams et al. (2002) also suggested that nest survival and annual production (chicks/female) could be used to assess habitat quality and are useful tools when evaluating population growth change in prospective or retrospective analyses (Sӕther and Bakke 2000).
CSTG provide an opportunity to evaluate demographic rates and population growth to assess changes in habitat quality. CSTG are a highly productive, generalist species (Apa 1998) that have centralized breeding locations and have generally limited movements during the breeding season (Boisvert t al. 2005) with relatively small home ranges that have a median size of 65 - 113 ha and 69 - 75 ha in spring-fall and brood-rearing habitat, respectively (Collins 2004). Boisvert (2002) reported similar home ranges sizes with smaller median home range size in mineland reclamation (75 ha) when compared to CRP (112 ha). These life history traits and relatively small movements facilitate a relatively rapid response to habitat management, ultimately providing managers and researchers an opportunity to work collaboratively to investigate a mechanistic response to landscape level habitat quality improvements.
To evaluate the demographic and population response of CSTG to breeding and summer/fall habitat improvements rigorous estimates of adult female survival and production (Sӕther and Bakke 2000) are needed. Although techniques to estimate female survival are well established using VHF radio telemetry (McDonald 1998, Boisvert 2002, Collins 2004, Gillette 2014) elasticity analysis suggests that the population growth rate may be less sensitive to an adult survival rate in “highly productive” species (Sӕther and Bakke 2000). Thus, obtaining rigorous estimates of the temporal variation in chick and juvenile survival are necessary to support future management recommendations (Sӕther and Bakke 2000).
A standard for estimating CSTG chick survival from hatch to 4-7 weeks post-hatch has involved flush counts or observing female behavior. Flush counts to estimate productivity from 35 – 49 days post-hatch and brood survival (McDonald 1998, Boisvert 2002, Collins 2004, Gillette 2014) have been conducted, but Collins (2004) acknowledged biases (e.g. delectability) associated with flush counts. In an effort to minimize biases associated with flush counts, Collins (2004) attempted to improve detectability
5
by incorporating and pairing flush counts using hunting dogs. Unfortunately, these approaches can lead to imprecise estimates of chick survival because of unknown detection probabilities associated with cryptic chicks combined with a no movement defensive strategy to avoid detection. Other issues can bias chick survival estimates and include chick exchange between broods observed with greater sage-grouse (Centrocercus urophasianus) (Dahlgren et al. 2010, Thompson 2012).
To obtain a more reliable estimate of chick survival, my field methods will include the use of VHF micro transmitters attached to day-old chicks to obtain survival estimates using techniques established with surrogate species (greater sage-grouse, Gunnison sage-grouse (C. minimus) and plains sharp-tailed grouse (T. p. jamesi) (Burkepile et al. 2002, Manzer and Hannon 2007, Dahlgren et al. 2010, and Davis 2012, Thompson 2012)) and more recently with CSTG (Appendix A; Apa 2014). OBJECTIVES The overall objective of this research is to ascertain the short- and long-term demographic and population response of CSTG to improvements in habitat quality by increasing floristic horizontal and vertical structure and species richness in monotypic stands of non-native grasses. Specific objectives are to:
1. Ascertain the current baseline (before impact) demographic (age specific survival, nest success) and spatial (home range and movements) parameters in existing non-native grass dominated communities (controls and treatments sites).
2. Ascertain the short-term (2 year) post-habitat enhancement, demographic (age specific survival, nest success), and spatial (home range and movements) parameters in non-native grass dominated communities and compare with treated sites.
3. Ascertain the long-term (5-7 year) post-habitat enhancement, demographic (age specific survival, nest success), and spatial (home range and movements) parameters in non-native grass dominated communities and compare with treated sites.
EXPECTED RESULTS AND BENEFITS
This research project will evaluate the response of CSTG populations to management actions that are designed to enhance habitat. The results of this study will be used to develop specific habitat enhancement protocol that will allow, in a predictive fashion, a higher level of management certainty (Ratti and Garton 1994, Garton et al. 2005) in management activities and would assist and result with increased densities and range expansion of CSTG. Improved and increasing CSTG populations would provide additional individuals for translocations to facilitate range expansion, allow continued or expanded sport harvest, and compensate or mitigate current or future CRP habitat loss. Range expansion and increased densities of CSTG could preclude any future attempts to list the CSTG for protections under the ESA. APPROACH RESEARCH HYPOTHESIS
Increased structural and floristic diversity and species richness will improve nesting and brood-rearing habitat quality for Columbian sharp-tailed grouse resulting in a positive population growth rate influenced by increased nest success and adult, chick, and juvenile survival.

6
STUDY AREA
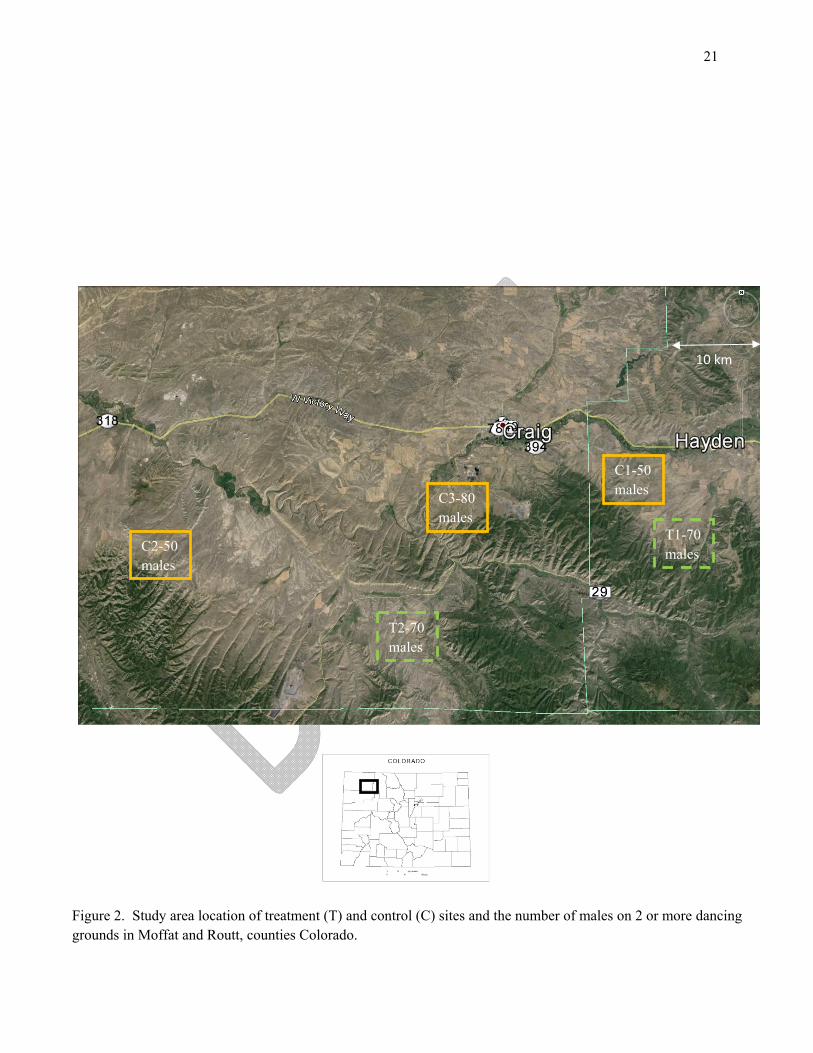
The study area is located in northwestern Colorado, specifically in southwestern Routt and southeast Moffat counties (Fig. 2). It is further described by Boisvert (2002) and Collins (2004). The study area is predominantly (70%) privately owned by individuals or mining companies and is interspersed with Bureau of Land Management and State Land Board properties (Hoffman 2001).
The landscape cover types that contribute to CSTG breeding and summer habitat were historically sagebrush-grass or mountain shrub communities but currently have a grassland cover type created by the CRP (see Need section). Elevations range from 2,000 – 2,600 m with soils ranging from silt and clay loams 8 – 150 cm deep (Boisvert 2002, Collins 2004). Daily temperatures range from 5 – 25 oC and average annual precipitation varies by elevation but ranges from 50 cm near Steamboat Springs to less than 25 cm near Craig (Boisvert 2002, Collins 2004). METHODS Survival and Productivity
Grouse Spring Capture – Female CSTG will be captured in the spring using walk-in funnel traps (Schroeder and Braun 1991) in the morning on dancing grounds. Trapping will occur on 7 dancing grounds in three study sites in Moffat county (C2, C3, T2; Fig. 2) that range in size from 10 – 45 males. Trapping will also occur on 8 dancing grounds in two study sites in Routt county (C1, T1; Fig. 2) that range in size from 6 – 24 males. Traps will be opened ½ hour before sunrise and closed/blocked at the cessation of trapping each morning. Trapping will depend upon spring conditions and the timing of peak of female attendance (Giesen 1987, R. Hoffman, retired CPW, personal communication).
Females (n = 120/year; Table 1) will be fitted with 12 g elastic necklace-mounted radio transmitter (Model RI-2BM, Holohil Systems, Ltd., Carp, Ontario) equipped with a 12-hour mortality circuit having an 8.5 month nominal battery life (Appendix A; Apa 2014). The transmitter mass is < 2% (range 1.7 – 1.9%) of an adult or yearling female body mass (Collins 2004, Appendix A; Apa 2014). A 16 cm antenna will be bent to lie between the wings and down the back of the grouse. Captured grouse will be classified by gender (Snyder 1935, Henderson et al. 1967) and age (Ammann 1944). Females will be aged as yearling or adult by examining the condition of the outer primaries (Ammann 1944). Mass (± 1 g) will be recorded by placing the restrained individual in a cotton bag and weighed on an electronic balance. I will not attempt to recapture females and remove transmitters (if still active) at the end of the study. Thus, the transmitters will remain on the female through the extent of their life.
Females will be fitted with an individually numbered aluminum leg band (size 12) attached on the tarsus. Males will not be marked. Individuals will be processed and released at the point of capture. All trapping and handling procedures will generally follow established Colorado Division of Parks and Wildlife Sage-grouse Trapping and Handling Protocol (e.g. walk-in traps, spotlighting, and handling; Appendix B) and Fair et al. (2010). If recurring ( > 2 incidents) injuries occur, appropriate measures will be taken to ascertain the cause and modifications to the traps or trapping procedure will be implemented and reported to ACUC. Birds will be released by placing them on the ground near the dancing ground. Individuals releasing birds will quickly and quietly back away until the bird has walked, run, or flushed. Behavior at release will be observed in case an injury was over-looked.
Nest Monitoring and Chick Capture - Movements will be monitored every 1 – 3 days and general locations will be obtained using triangulation from a ≥ 30 m distance (to minimize disturbance) using hand-held Yagi antennas attached to a receiver. Locations will be obtained between 0800 and 1800 hours. Movements will be monitored to determine nest initiation, location, and incubation. If a female has been located in the same location for two consecutive days incubation initiation will be assumed. Visual observations of the female on the nest will be made if possible depending on vegetation density of cover 7 - 10 days post-incubation confirmation. Incubating females will be checked 2-3 times/week to

7
monitor nest fate. Nest monitoring will be conducted using telemetry at two points at right angles from one another 10 -20 m distance (25-26 day incubation period) from the incubating female. Once monitoring reveals a successful hatch (female movement away from nest) all chicks in the brood will be captured within 24 hours. Females will be located < 2 hours after sunrise in order to capture chicks while they are being brooded. The brood female will be flushed, chicks will be captured by hand, and all chicks will be confined in insulated soft sided coolers equipped with hand warmers (sufficiently large to handle 10 – 12 chicks) to maintain thermoregulation. Capture efforts will not occur during inclement weather to reduce thermoregulation issues with chicks (captured or uncaptured). All chicks will be weighed (± 0.01 g) using an electronic scale. Four chicks/brood will be randomly selected and a 0.65 g backpack style (model A1025, Advanced Telemetry Systems, Isanti, MN) transmitter will be sutured along the dorsal midline between the wings (Burkepile et al. 2002, Dreitz et al. 2011, Manzer and Hannon 2007, Thompson 2012) (n ≈ 55 broods/year; n ≈ 220 chicks/year; Table 1). In advance of attaching the transmitter, the area will be swabbed with isopropyl alcohol. Two sterile, unused 20-gauge needles will be inserted subcutaneously and perpendicular to the dorsal mid-line. Monofilament suture (Braunamide: polyamide 3/0 thread, pseudo monofilament, non-absorbable, white) will be threaded through the needle barrel. The needles will be removed and the suture material will be tied off using a square knot and excess suture material will be removed. One drop of cryanocrylate glue will be placed on the knot. Transmitters have a nominal battery life of 28 days. Following processing, all chicks will be released simultaneously at the brood site. Processing time will take 25 – 35 minutes (Appendix A; Apa 2014). The brood female will be monitored during brood processing to assure that she remains in the near vicinity. Brood abandonment is not expected based upon previous research (Burkepile et al. 2002, Manzer and Hannon 2007, Thompson 2012, Apa 2014; Appendix A). Chicks will be monitored post-release (1 - 2 hrs) to monitor brood female affinity and assess post-handling chick survival. Chick mass ranges from 15 - 19 g (Appendix A; Apa 2014) which is similar to PSTG (Manzer and Hannon 2007). Manzer and Hannon (2007) reported PSTG day-old chick mass (range; 14-18 g). Thus transmitter mass will consist of 3 - 4% of the day-old non-flight capable chick mass. As chicks age, and become flight capable, transmitter mass will decline to < 1% as chick mass (85- 130 g) increases (Appendix A; Apa 2014). Radio-marked female and chick movements and survival will be monitored daily until 20 days-of-age. Chick and brood positions will be determined by locating females and circling at a 25 m radius. Position (i.e., distance) of radio-marked chicks in relation to the female will also be recorded. Attempts will be made to find all chicks that are separated or missing from broods to determine fate and/or cause of mortality. Brood locations will be collected equally among 4 time periods: brooding (< 2 hour after sunrise or before sunset), morning (0800-1100), mid-day (1100-1400), and afternoon (1400-1800) throughout the study. I will capture juveniles when they are 20-23 days old at approximately two hours before sunrise while juveniles are brooding with the female (Appendix A; Apa 2014). The female and brood will be circled using radio telemetry and approached slowly with the aid of a “red light” on a head lamp and the location will be marked with yellow glow sticks. Once a visual location is confirmed the female and brood will be captured using a 1.5 m diameter hoop net. All birds will be restrained and the brood female will be release immediately at the point of capture. The duration of the transmitter suture attachment has not been studied in the wild. Based on personal experience, upon recapture, transmitters frequently remain attached by only one of the two sutures. The remaining suture is loosely attached by small amounts of tissue. In addition, unattached (dropped) transmitters are occasionally located. Upon further inspection, fragments of skin remain attached to the suture material strongly suggesting a “drop off” of the transmitter. Therefore, for the purposes of this study, I assume that sutured transmitters will not remain attached to the bird as it grows. Juveniles (n ≈ 110/year; Table 1) will be recaptured, chick transmitters removed, and fitted with a 3.9 g back-pack style juvenile transmitter (Model A1080, Advanced Telemetry Systems, Isanti, MN)

8
(Table 1). The attachment method will be the same as described earlier for day-old-chicks (Burkepile et al. 2002, Dreitz et al. 2011, Manzer and Hannon 2007, Thompson 2012, Apa 2014). A new suture site will be selected near the previous suture site because there will be insufficient suture material at the previous location to attach a larger transmitter. Juveniles will be 85 - 130 g at capture (Apa 2014), which allows for sufficient space along the dorsal mid-line to avoid the previous suture location and compounded irritation. The previous suture location will be assessed for signs of severe irritation or infection. If these conditions are present, the site will be treated with sulfadiazine (thermazine) water based cream before the juvenile is released (L. Wolfe, personal communication). The juvenile transmitter has a nominal battery life of 8.5 months and will consist of 3.0 - 4.6% of chick mass (Apa 2014). Techniques to capture 4-month old juveniles continue to be untested due to access restrictions (Appendix A; Apa 2014). The same aforementioned protocol used for 20-day-old chicks will be applied. Throughout all phases of this pilot study, if serious injuries (e.g. broken legs or wings, etc.) occur, and rehabilitation is not possible, injured birds will be euthanized using cervical dislocation and reported to the ACUC. I estimate approximately 70 - 80 juveniles/year could be captured. Aerial locations and/or detections (survival) will be obtained once/month throughout the research. All trapping and handling protocol where previous approved in a pilot study (Apa 2014; Permit #01-2014) and for the current study by CPW ACUC (Permit # XXXXX). Habitat Quality
Vegetation Sampling - All nest (n = 96; Table 1) and brood (n = 120; Table 1) sites will have four, 10-m transects placed in the cardinal directions intersecting at the nest bowl. Sampling will be conducted within 7 days of nesting cessation (successful or unsuccessful) or the last brood location. Paired random site vegetation sampling will be conducted within 7 days of its paired sample (nest (n = 96) or brood (n = 120) site) (Table 1). The fourth order (Johnson 1980) habitat quality evaluation will conducted at nest, brood-rearing, and random sites. Abiotic site characteristics such as date, time, UTM coordinates, slope, aspect, and elevation will also be recorded.
Overstory horizontal and vertical structure – If present, overstory shrub canopy cover (foliar intercept) by lowest possible taxa will be measured using line-intercept (Canfield 1941). Gaps greater than 5 cm will not be included. Height of the nearest shrub within 1 m of the transect line will be measured at 2.5 m, 5 m, and 10 m.
Understory horizontal and vertical structure – The percent of forbs and grass cover (by lowest possible taxa), bare ground, and litter horizontal understory cover will be estimated using 20 x 50 cm quadrats (Daubenmire 1959). Eleven cover classes will be used and are delineated as follows: Trace: 0-2%, 1: 3-9%, 2: 10-19%, 3: 20-29%, 4: 30-39%, 5: 40-49%, 6: 50-59%, 7: 60-69%, 8: 70-79%, 9: 80-89%, 10: 90-100%. Two quadrats will be located on opposite sides of the nest bowl along the N/S transect line. Subsequent plots will be placed systematically and perpendicular to the transect at 2.5, 5, and 10 m locations, totaling 2 nest plots and 12 others. Grass and forb height will be measured along the transect. The nearest, grass/forb part at the points where the edge of the nest bowl and the transects intercept, and within the bottom left quarter each quadrat.
Females with broods will be located 1-2 times per week. When females with broods are circled, the intersection point of flags placed in the cardinal directions will be used to identify the center of the brood location which will determine the intersection point of the transects. Habitat measurements will be conducted at as many brood locations as possible with equal sampling across individuals retain sample independence and avoid sampling autocorrelation issues.
I will create a grid layer of 200 m2 cells centering on the dancing grounds out to 2 km in each study area and then select individual grid cells based on a spatially balanced random sample which will serve as sampling locations for random sites. Vegetation samples will not be conducted in native mountain shrub or sagebrush-grass sites. Cells with grouse locations will not be considered as part of the
9
random sample. The same vegetation data collection techniques will be conducted on at least one paired random location for each nest and brood site. Treatments
The goal of this research is to conduct treatments (habitat improvements) in two lek complexes (T1 and T2; Figs. 2, 3). The actual location and placement of the habitat enhancement will depend upon landowner permission and agency funding. Treatments will be in collaboration with NW Regional management staff and the NW Region Habitat Coordinator. Treatments will be focused in habitat adjacent to and within 2 km of dancing grounds to elicit the maximum influence on breeding and summer habitat. Several authors report that 80% of the breeding and summer habitat is within 2 km of a dancing ground (Apa 1998, Boisvert 2002, Collins 2004, Hoffman 2015, Apa 2014). Although the NW Region Habitat Coordinator will prescribe and conduct treatments in collaboration with CSTG experts, a possible approach could include a disking/interseeding of bunchgrasses and forbs (Negus et al. 2010). Negus et al. (2010) recommended that 25% - 50% (314 ha - 628 ha) of the potential treatment area (area of a 2 km radius from a capture lek; 1,256 ha) should be treated per year with all treatments occurring in 4 years or less. This area of potential treatment could encompass several spring-fall or brood-rearing home ranges (Boisevert 2002, Collins 2004). Negus et al. (2010) found treatment establishment in approximately 3 years post treatment, but recommended that research should be delayed as much as 5 years post-treatment to yield more conclusive results of bird response. Treatments will be initiated between the fall of 2016 and the fall of 2017. ANALYSIS Study Design and Data Analyses
All research will be conducted on private land with willing landowners (Fig. 2). Based on previous experience, many landowners will likely have access and/or treatment restrictions. Situations could arise that may impact the access, timing, and/or location of treatments and controls that would impact replication and randomization. Possible scenarios could include, landowners choosing to discontinue involvement in the study, changes in landownership or land management influencing the location, size or seed composition of a treatment therefore, a flexible study design is needed.
The aforementioned scenarios would impact the primary tenants of experimental treatments; randomization and replication (Wiens and Parker 1995). To accommodate these potential issues, I will treat these modifications in the same manner as described by Eberhardt and Thomas (1991) and Wiens and Parker (1995) in describing the analyses of the effects of accidental environmental impacts. Since, accidental environmental impacts are unplanned and not replicated or spatially and statistically balanced (Eberhardt and Thomas 1991, Wiens and Parker 1995), they are characteristically temporally or spatially impacted by pseudoreplication (Hurlbert 1984, Stewart-Oaten et al. 1986). Wiens and Parker (1995:1071) acknowledged the pseudoreplication of treatments (accidental environmental impact) and the associated non-independence among samples and termed them “judicious pseudoreplication.”
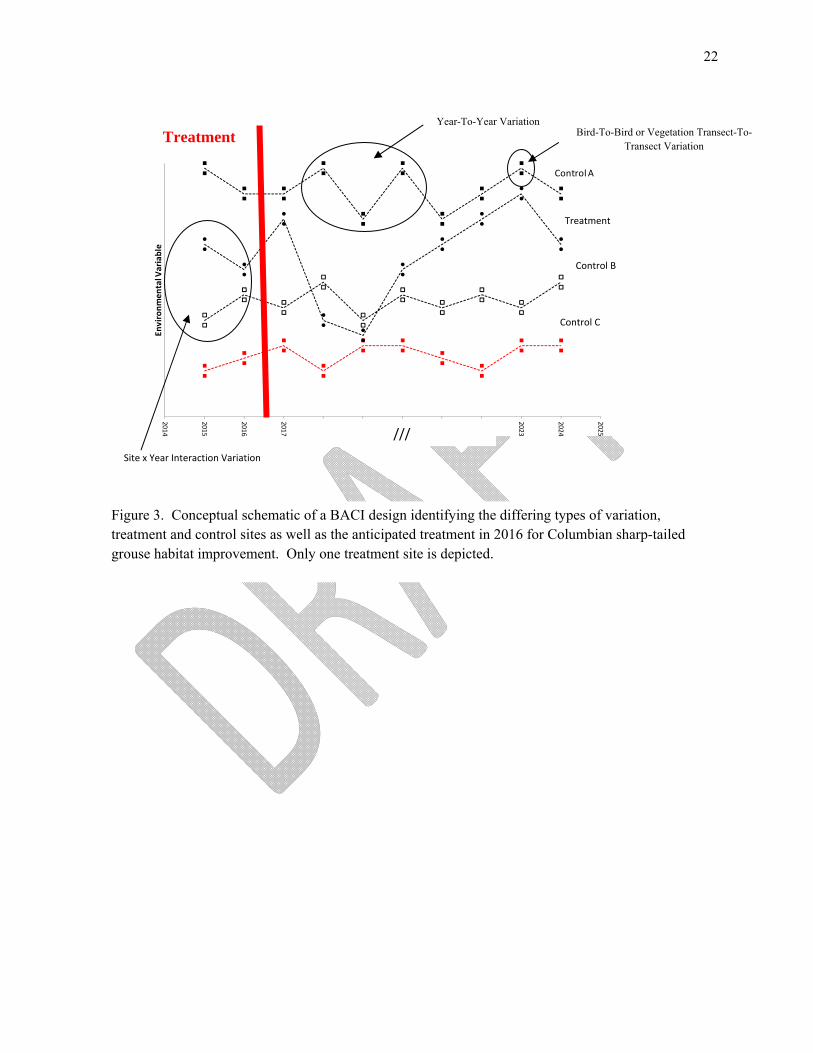
To accommodate judicious pseudoreplication and other study design challenges, an alternative study design has been selected that involves the comparison of an impact site before and after while accounting for issues with natural change by pairing it to a control (Eberhart 1976, Steward-Oaten et al. 1986) or reference site (Steward-Oaten and Bence 2001); a before-after control-impact design (BACI) (Smith 2002). Although there are criticisms of BACI designs and its inability to discriminate the effects of treatments with a single control (Underwood 1991, 1992, 1994), Steward-Oaten and Bence (2001) argued that criticisms are unwarranted because BACI controls are not true experimental controls in the statistical sense because they are not independent or randomly selected. They suggest that the controls in a BACI design are selected specifically for their correlative ability and thus can be used as covariates and

10
not used to estimate variances of the effect estimates. Even though the BACI design is typically used in environmental impact assessments (Smith 2002), BACI designs have been recommended (Michener 1997) and applied (Maccherini and Santi 2012) in restoration ecology studies.
A BACI design with paired controls will be employed (Smith 2002). This design is somewhat similar to a typical repeated measures design with the following two-factor mixed-effect ANOVA model:
Xijk = µ + αi + τk(i) + βj + (αβ)ij +εijk where µ is the overall mean, αi is the effect of period (i = before or after), τk(i) represents the times within period (k = 1, 2,…tA, for i = after and k = 1,2,…,tB for i = before), βj is the effect of location (j = control or treatment), (αβ)ij is the interaction between period and location, and εijk represents the error. The fixed effects include timing (before and after treatment), if the site is a treatment or control, and the interaction. The random effects include the before or after are nested within year, the treatment or control are nested within the replicated controls or treatments, and the interaction (Little et al. 2006).
BACI design assumptions include; the measurements within and across site and years are independent, normality of residuals, equality of variation at each site and year, and normality of year, site, year*site interaction effects. In BACI designs it is not necessary to be spatially or statistically balanced and the number of birds and transects can vary among sites and year and not all sites need to be measure in all years.
I am proposing three control or reference sites (lek complexes; Table 1, Figs. 2, 3) that will have no habitat improvements. There will be degrees of habitat quality within the controls that include better quality (mineland reclamation) and low to marginal quality (existing or expired CRP). Additionally, I propose two treatment (impact) sites, (Table 1; Figs. 2, 3), but these treatment sites are not finalized and will require negotiation (location, seed mix, and treatment approach) and additional communication with the landowners. Sampling will be conducted for a least two years before treatment (impact) and two years immediately post-treatment (impact). Active research will not be conducted for 5 - 7 years following treatment allowing for vegetation establishment and maturation. Once the treatment has matured, the long-term portion of the after treatment (impact) study will be conducted in the same manner as the before and immediately after treatment.
Response variables will include nest survival (Rotella et al. 2004), adult and yearling monthly and annual survival, chick daily, monthly and annual survival/recruitment, and home range. Covariates will also include grass and forb cover and height and plant species richness. The long-term population response and associated demographic rates will be evaluated using population matrix models (Caswell 2001, Powell et al. 2000, Doherty et al. 2004, Sӕther and Bakke 2000). Chick, juvenile, and adult/yearling survival will be estimated using the Kaplan-Meier (K-M) (Kaplan and Meier 1958) product-limit function with staggered entry (Pollock et al. 1989).
Female home range will be estimated using a nonparametric fixed kernel density estimator (Worton 1989, White and Garrott 1990) that is based on the distribution and concentration of locations (Janke and Gates 2013). Since bandwidth selection can influence home range estimates (Gitzen et al. 2006, Downs and Horner 2008) I will follow a procedure outlined by Janke and Gates (2013) and will compare 3 bandwidth estimators. The estimators will include least squares cross validation (Seaman and Powell 1996), reference bandwidth (Worton 1989), and likelihood cross validation (Horne and Garton 2006, Horne and Garton 2009) and they will be compared in relation data fit across point patterns and sample sizes (Janke and Gates 2013).

11
PROJECT SCHEDULE Timeline: January – April 2015: proposal development and review; ACUC submission. January - April 2015, 2016, 2017, and 2018: hire technicians (6-7/year). Mid-March – mid-April 2015, 2016, 2017, and 2018: assemble and gather equipment; build and repair traps. Mid-April – May 2015, 2016, 2017, and 2018: Trap, radio-mark, and monitor nesting activities of CSTG females (n = 120/year). May – July 2015, 2016, 2017, 2018: Monitor nest success, capture and mark CSTG chicks (n ≈ 220/year). Work with regional staff to identify and fund treatments (fall 2015 through spring 2016). July – August 2015, 2016, 2017, and 2018: Monitor chick survival, recapture and mark juvenile CSTG (n ≈ 80/year). November 2018 – December 2019: Complete final report and submit manuscripts for publication on short-term research results. PROJECT BUDGET
Item FY14-15 FY15-16 FY16-17 FY 17-18 FY 18-192 VHF Transmitters (adult, chick, juvenile)1 $88,000 $88,000 $88,000 $88,000 Equipment (trapping supplies, etc.) $9,000 $9,000 $9,000 $9,000 ATV (2) $16,000 Equipment Maintenance $5,000 $5,000 $5,000 $5,000 $3,000Temporary Labor (6/year) $51,000 $110,000 $110,000 $110,000 $51,000Graduate Student Associated Costs $14,000 $28,000 $28,000 $28,000 Trucks (rent and gas) $30,000 $60,000 $60,000 $60,000 $30,000Field Station (rent and utilities) $6,000 $12,000 $12,000 $12,000 $6,000TOTAL3 $219,000 $312,000 $312,000 $312,000 $90,0001VHF transmitter costs in all but the first fiscal year will be reduced due to lower costs associated with the reuse transmitters and the costs refurbishing and resupplying transmitters. 2Future year (long-term) budgets are not estimated. 3Budget estimates do not include habitat treatment costs that will be acquired from other sources.

12
LITERATURE CITED Aldrich, J.W. 1963. Geographic orientation of American Tetraonidae. Journal of Wildlife Management
27:529-545. Ammann, G. A. 1944. Determining the age of pinnate and sharp-tailed grouse. Journal of Wildlife
Management 8:170-171. Apa, A. D. 1998. Habitat use and movement of sage and Columbian sharp-tailed grouse in southeastern
Idaho. Ph.D. Dissertation, University of Idaho, Moscow, ID, USA. Apa, A. D. 2014. Columbian sharp-tailed grouse chick and juvenile radio transmitter evaluation.
Unpublished progress report. Colorado Division of Parks and Wildlife, Fort Collins, Colorado, USA.
Bart, J. 2000. Status assessment of Columbian sharp-tailed grouse. Unpublished report to the U.S. Fish
and Wildlife Service, Status Review Team, Portland, Oregon, USA. Best, L.B. 1986. Conservation tillage: ecological traps for nesting birds? Wildlife Society Bulletin
14:308-317. Boisvert, J. H. 2002. Ecology of Columbian sharp-tailed grouse associated with Conservation Reserve
Program and reclaimed surface mine lands in northwestern Colorado. M.S. Thesis. University of Idaho, Moscow, ID, USA.
Boisvert, J. H., R. W. Hoffman, and K. P. Reese. 2005. Home range and seasonal movements of
Columbian sharp-tailed grouse associated with Conservation Reserve Program and mine reclamation. Western North American Naturalist 65:36-44.
Block, W. M., and L. A. Brennan. 1993. The habitat concept in ornithology: theory and applications.
Current Ornithology 11:35-91. Braun, C.E., M.F. Baker, R.L. Eng, J.S. Gashwiler, and M.H. Schroeder. 1976. Conservation committee
report on effects of alteration of sagebrush communities on the associated avifauna. The Wilson Bulletin 88:165-171.
Burkepile, N. A., J. W. Connelly, D. W. Stanley, and K. P. Reese. 2002. Attachment of radiotransmitters
to one-day-old sage grouse chicks. Wildlife Society Bulletin 30:93-96. Canfield, R. H. 1941. Application of the line interception method in sampling range vegetation. Journal
of Forestry 39:388-394. Caswell, H. 2001. Matrix population models-construction, analysis and interpretation. Sinauer
Association, Inc. Sunderland, Massachusetts, USA. Cody, M. L. 1985. Habitat selection in birds. Editor M. L. Cody. Physiological Ecology: A series of
monographs, texts, and treatises. Academic Press, Inc. New York, USA.

13
Collins, C. P. 2004. Ecology of Columbian sharp-tailed grouse associated with coal mine reclamation and native shrub-steppe cover types in northwestern Colorado. M.S. Thesis. University of Idaho, Moscow, ID, USA.
Connelly, J.W., M.W. Gratson, and K.P. Reese. 1998. Sharp-tailed grouse (Tympanuchus phasianellus).
The Birds of North America Number 354. Birds of North America, Inc., Philadelphia, Pennsylvania, USA.
Dahlgren, D. K., T. A. Messmer, and D. N. Koons. 2010. Achieving better estimates of greater sage-
grouse chick survival in Utah. Journal of Wildlife Management 74:1286-1294. Dasmann, R. F. 1964. Wildlife Biology. John Wiley & Sons, Inc. New York, NY, USA. Daubenmire, R. 1959. A canopy-coverage method of vegetational analysis. Northwest Science 33:43-
64. Davis, A. J. 2012. Gunnison sage-grouse demography and conservation. Ph.D. Dissertation, Colorado
State University, Fort Collins, Colorado, USA. Doherty, P. F., E. A. Schreiber, J. D. Nichols, J. E. Hines, W. A. Link, G. A. Schenk, and R. W.
Schreiber. 2004. Testing life history predictions in a long-lived seabird: a population matrix approach with improved parameter estimation. Oikos 105:606-618.
Downs, J. A., and M. W. Horner. 2008. Effects of point pattern shape on home-range estimates. Journal
of Wildlife Management 72:1813-1818. Dreitz, V. J., L. A. Baeten, T. Davis, and M. M. Riordan. 2011. Testing radiotransmitter attachment
techniques on northern bobwhite and chukar chicks. Wildlife Society Bulletin 35:475-480. Eberhardt, L. L. 1976. Quantitative ecology and impact assessment. Journal of Environmental
Management 4:27-70. Eberhardt, L. L., and J. M. Thomas. 1991. Designing environmental field studies. Ecological
Monographs 61:53-73. Fair, J., E. Paul, and J. Jones. Eds. 2010. Guidelines to the use of wild birds in research. Ornithological
Council. Washington, D.C. USA. Franklin, A. B., D. R. Anderson, R. J. Gutiérrez, and K. P. Burnham. 2000. Climate, habitat quality, and
fitness in northern spotted owl populations in northwestern California. Ecological Monographs 70:539-590.
Garton, E. O., J. T. Ratti, and J. H. Giudice. 2005. Research and Experimentation Design. Pages 43 – 71
in C. E. Braun, editor. Techniques for wildlife investigations and management. Sixth edition. The Wildlife Society, Bethesda, Maryland, USA.
Gates, J.E., and L.W. Gysel. 1978. Avian nest dispersion and fledging success in field-forest ecotones.
Ecology 59:871-883.

14
Gitzen, R. A., J. J. Millspaugh, and B J. Kernohan. 2006. Bandwidth selection for fixed-kernal analysis of animal utilization distributions. Journal of Wildlife Management 70:1334-1344.
Giesen, K. M. 1987. Population characteristics and habitat use by Columbian sharp-tailed grouse in
northwestern Colorado. Final Report, Colorado Division of Wildlife Federal Aid Project W-37-R, Denver, CO, USA.
Giesen, K.M., and C.E. Braun. 1993. Status and distribution of Columbian sharp-tailed grouse in
Colorado. Prairie Naturalist 25:237-242. Giesen, K. M., T. J. Schoenberg, and C. E. Braun. 1982. Methods for trapping sage grouse in Colorado.
Wildlife Society Bulletin 10:224-231. Gillette, G.L. 2014. Ecology and Management of Columbian Sharp-tailed Grouse in Southern Idaho:
Evaluating infrared technology, the Conservation Reserve Program, statistical population reconstruction, and the olfactory concealment theory. Ph.D. Dissertation, University of Idaho, Moscow, Idaho, USA.
Gorman, E. T., and R. W. Hoffman. 2010. Status and management of sharp-tailed grouse in Colorado.
Colorado Division of Wildlife, Unpublished Report, Denver, CO, USA. Gregg, M. A., and J. A. Crawford. 2009. Survival of greater sage-grouse chicks and broods in the
northern Great Basin. Journal of Wildlife Management 73:904-913. Hall, L. S., P. R. Krausman, and M. L. Morrison. 1997. The habitat concept and a plea for standard
terminology. Wildlife Society Bulletin 25:173-182. Henderson, F. R., F. W. Brooks, R. E. Wood, and R. B. Dahlgren. 1967. Sexing of prairie grouse by
crown feather patterns. Journal of Wildlife Management 31:764-769. Hoffman, R. W., technical editor. 2001. Northwest Colorado Columbian sharp-tailed grouse
conservation plan. Northwest Colorado Columbian Sharp-tailed Grouse Work Group and Colorado Division of Wildlife, Fort Collins, CO, USA.
Hoffman, R. W., K. A. Griffin, A. D. Apa, M. A. Schroeder, J. M. Knetter, J. D. Robinson, S. P.
Espinosa, T. J. Christiansen, R. D. Northrup, D. A. Budeau, and M. J. Chutter. 2015. Guidelines for the Management of Columbian Sharp-Tailed Grouse Populations and Their Habitats. Western Agencies Sage and Columbian Sharp-tailed Grouse Technical Committee, Western Association of Fish and Wildlife Agencies. Cheyenne, Wyoming.
Homes, R. T., P. P. Marra, and T. W. Sherry. 1996. Habitat-specific demography of breeding black-
throated blue warblers (Dendroica caerulescens): implications for population dynamics. Journal of Animal Ecology 65:183-195.
Horne, J. S., and E. O. Garton. 2006. Likelihood cross-validation versus least squares cross-validation
for choosing the smoothing parameter in kernel home-range analysis. Journal of Wildlife Management 70:641-648.
Horne, J. S. and E. O. Garton. 2009. Animal Space Use 1.3.
http://www.cnr.uidaho.edu/population_ecology/animal_space_use Accessed 25 March 2015.

15
Hurlbert, S. H. 1984. Pseudoreplication and the design of ecological field experiments. Ecological
Monographs 54:187-211. Janke, A. K. and R. J. Gates. 2013. Home range and habitat selection in northern bobwhite coveys in an
agricultural landscape. Journal of Wildlife Management 77:405-413. Johnson, D.H. 1980. The comparison of usage and availability measurements for evaluating resource
preference. Ecology 61:65-71. Johnson, M. D. 2007. Measuring habitat quality: A review. Condor 109:489-504. Kaplan, E. L., and P. Meier. 1958. Non-parametric estimation from incomplete observation. Journal of
the American Statistics Association 53:457-481. Knutson, M. G., L. A. Powell, R. K. Hines, M. A. Friberg, and G. J. Niemi. 2006. An assessment of bird
habitat quality using population growth rates. Condor 108:301-314. Leopold, A. 1933. Game management. University of Wisconsin Press, Madison, Wisconsin, USA. Little, R. C., G. A. Milliken, W. W. Stroup, R. D. Wolfinger, and O. Schabenberger. 2006. SAS for
Mixed Models, Second Edition. SAS Institute Inc., Cary, North Carolina, USA. Maccherine, S., and E. Santi. 2012. Long-term experimental restoration in a calcareous grassland:
Identifying the most effective restoration strategies. Biological Conservation 146:123-135. Mallett, J. 2000. Idaho Department of Fish and Game response to 90-day finding on a petition to list the
Columbian sharp-tailed grouse as threatened. Administrative record of the Status Review Team, U.S. Fish and Wildlife Service, Portland, Oregon, USA.
Manzer, D. L., and S. J. Hannon 2007. Survival of sharp-tailed grouse Tympanuchus phasianellus chicks
and hens in a fragmented prairie landscape. Wildlife Biology 14:16-25. Marzluff, J. M., M. G. Raphael, and R. Sallabanks. 2000. Understanding the effects of forest
management on avian species. Wildlife Society Bulletin 28:1132-1143. McDonald, M. W. 1998. Ecology of Columbian sharp-tailed grouse in eastern Washington. Thesis.
University of Idaho, Moscow, ID, USA. McDonald, M. W., and K. P. Reese. 1998. Landscape changes within the historical range of Columbian
sharp-tailed grouse in eastern Washington. Northwest Science 72:34-41. Michener, W. K. 1997. Quantitatively evaluating restoration experiments: research design, statistical
analysis, and data management considerations. Restoration Ecology 5:324-337. Miller, G.C., and W.D. Graul. 1980. Status of sharp-tailed grouse in North America. Page 18-28 in P.A.
Vohs and F.L. Knopf, editors. Proceedings Prairie Grouse Symposium. Oklahoma State University, Stillwater, Oklahoma, USA.
16
Morrison, M. L., B. G. Marcot, and R. W. Mannan. 2006. Wildlife-Habitat Relationships – concepts and applications. Island Press, Washington, D.C., USA.
Murphy, M. T. 2001. Source-sink dynamics of a declining eastern kingbird population and the value of
sink habitats. Conservation Biology 15:737-748. Negus, L.P., C.A. Davis, and S.E. Wessel. 296. Avian response to mid-contract management of
Conservation Reserve Program fields. American Midland Naturalist 164:296-310. Persson, M. 2003. Habitat quality, breeding success and density in tawny owl Strix aluco. Ornis Svecica
13:137-143. Pollock, K. H., S. R. Winterstein, C. M. Bunck, and AP. D. Curtis. 1989. Survival analysis in telemetry
studies: the staggered entry design. Journal of Wildlife Management 53:7-15. Powell, L. A., J. D. Land, M. J. Conroy, and D. G. Krementz. 2000. Effects of forest management on
density, survival, and population growth of wood thrushes. Journal of Wildlife Management 64:11-23.
Raphael, M. G., and B. A. Maurer. 1990. Biological considerations for study design. Studies in Avian
Biology 13:123-125. Ratti, J. T. and E. O. Garton. 1994. Research and Experimental Design. Page 1-23 in T. A. Bockhout,
editor. Research and management techniques for wildlife and habitats. Fifth edition The Wildlife Society, Bethesda, Maryland, USA.
Rodgers, R. D., and R. W. Hoffman. 2005. Prairie grouse population response to conservation reserve
grasslands: an overview. Pages 120–128 in A. W. Allen and M. W. Vandever, editors. The Conservation Reserve Program-planting for the future. U.S. Geological Survey, Biological Resources Division, Scientific Investigation Report 2005-5145, Fort Collins, CO, USA.
Rotella, J. J., S. J. Dinsmore, and T. L. Shaffer. 2004. Modeling nest-survival data: a comparison of
recently developed methods that can be implemented in MARK and SAS. Animal Biodiversity and Conservation 27:187-205.
Sӕther, B. E., and O. Bakke. 2000. Avian life history variation and contribution of demographic traits to
the population growth rate. Ecology 81:642-653. Seaman, D. E., and R. A. Powell. 1996. An evaluation of the accuracy of kernel density estimators for
home range analysis. Ecology 77:2075-2085. Schroeder, M. A., and C. E. Braun. 1991. Walk-in traps for capturing greater prairie chickens on leks.
Journal of Ornithology 62:378-385. Schroeder, M. A., D. W. Hays, M. A. Murphy, and D. J. Pierce. 2000. Changes in the distribution and
abundance of Columbian sharp-tailed grouse in Washington. Northwestern Naturalist 81:95-103. Schneider, J. W. 1994. Winter feeding and nutritional ecology of Columbian sharp-tailed grouse in
southeastern Idaho. M.S. Thesis. University of Idaho, Moscow, ID, USA.

17
Sirotnak, J. M., K. P. Reese, J. W. Connelly, and K. Radford. 1991. Effects of the Conservation Reserve Program (CRP) on wildlife in southeastern Idaho. Idaho Department of Fish and Game, Job Completion Report, Project W-160-R-15, Boise, ID, USA.
Smith, E. P. BACI design. Pages 141-148 In: Encyclopedia of Environmetrics. A. H. El-Shaarawi and
W. W. Piegorsch, Eds. John Wiley & Sons, Ltd. Chichester, United Kingdom. Snyder, L. L. 1935. A study of the sharp-tailed grouse. Royal Ontario Museum of Zoology, Biological
Service, Publication 40, Toronto, Ontario, Canada. Stewart-Oaten, A., and J. R. Bence. 2001. Temporal and spatial variation in environmental impact
assessment. Ecological Monographs 71:305-339. Stewart-Oaten, A., W. W. Murdoch, and K. R. Parker. 1986. Environmental impact assessment:
“pseudoreplication” in time? Ecology 67:929-940. Stinson, D. W., and M. A. Schroeder. 2012. Washington state recovery plan for the Columbian sharp-
tailed grouse. Washington Department of Fish and Wildlife, Olympia, WA, USA. Thompson, T. R. 2012. Dispersal ecology of greater sage-grouse in northwestern Colorado: evidence
from demographic and genetic methods. Ph.D. Dissertation. University of Idaho, Moscow, ID. USA.
Ulliman, M. J. 1995. Winter habitat ecology of Columbian sharp-tailed grouse in southeastern Idaho.
M.S. Thesis. University of Idaho, Moscow, ID, USA. Underwood, A. J. 1991. Beyond BACI: experimental designs for detecting human environmental
impacts on temporal variations in natural populations. Australian Journal of Marine and Freshwater Research 42:569-587.
Underwood, A. J. 1992. Beyond BACI: the detection of environmental impacts on populations in the
real, but variable, world. Journal of Experimental Marine Biology and Ecology 161:145-178. Underwood, A. J. 1994. On beyond BACI: sampling designs that might reliably detect environmental
disturbances. Ecological Applications 4:3-15. United States Department of the Interior. 2000. Endangered and threatened wildlife and plants; 12-
month finding for a petition to list Columbian sharp-tailed grouse as threatened. Federal Register 65:197.
United States Department of the Interior. 2006. Endangered and threatened wildlife and plants; 90-day
finding on a petition to list the Columbian sharp-tailed grouse as threatened or endangered. Federal Register 71:67318–67325.
Van Horne, B. 1983. Density as a misleading indicator of habitat quality. Journal of Wildlife
Management 47:893-901. Virkkala, R. 1990. Ecology of the Siberian tit Parus cinctus in relation to habitat quality: effects of
forest management. Ornis Scandinavica 21:139-146.
18
Wakkinen, W. L., K. P. Reese, J. W. Connelly, and R. A. Fischer. 1992. An improved spotlighting techniques for capturing sage grouse. Wildlife Society Bulletin 20:425-426.
White, G. C., and R. A. Garrott. 1990. Analysis of wildlife radio-tracking data. Academic Press, Inc.,
Sand Diego, California, USA. Wiens, J. A., and K. P. Parker. 1995. Analyzing the effects of accidental environmental impacts:
approaches and assumptions. Ecological Applications 5:1069-1083. Williams, B. K., J. D. Nichols, and M.J. Conroy. 2002. Analysis and management of animal
populations: modeling, estimation, and decision making. Academic Press, San Diego, California, USA.
Worton, B. J. 1989. Kernal methods for estimating the utilization distribution in home-range studies.
Ecology 70:164-168. Yocom, C. F. 1952. Columbian sharp-tailed grouse in the state of Washington. American Midland
Naturalist 48:185-192.

19
2015 2016Fall
Treatment 2017 2018 2024 2025 Total
ControlLek Complex 1 20 20 20 20 20 20 120Lek Complex 2 30 30 30 30 30 30 180Lek Complex 3 20 20 20 20 20 20 120
TreatmentLek Complex 1 20 20 20 20 20 20 120Lek Complex 2 30 30 30 30 30 30 180
ControlLek Complex 1 37/18 37/18 37/18 37/18 37/18 37/18 222/108Lek Complex 2 56/27 56/27 56/27 56/27 56/27 56/27 336/162Lek Complex 3 37/18 37/18 37/18 37/18 37/18 37/18 222/108
TreatmentLek Complex 1 37/18 37/18 37/18 37/18 37/18 37/18 222/108Lek Complex 2 56/27 56/27 56/27 56/27 56/27 56/27 336/162
ControlLek Complex 1 16/16 16/16 16/16 16/16 16/16 16/16 96/96Lek Complex 2 24/24 24/24 24/24 24/24 24/24 24/24 144/144Lek Complex 3 16/16 16/16 16/16 16/16 16/16 16/16 96/96
TreatmentLek Complex 1 16/16 16/16 16/16 16/16 16/16 16/16 96/96Lek Complex 2 24/24 24/24 24/24 24/24 24/24 24/24 144/144
ControlLek Complex 1 20/20 20/20 20/20 20/20 20/20 20/20 120/120Lek Complex 2 30/30 30/30 30/30 30/30 30/30 30/30 180/180Lek Complex 3 20/20 20/20 20/20 20/20 20/20 20/20 120/120
TreatmentLek Complex 1 20/20 20/20 20/20 20/20 20/20 20/20 120/120Lek Complex 2 30/30 30/30 30/30 30/30 30/30 30/30 180/180
Table 1. Proposed sample sizes for females, chicks and nest vegetation transects for control, treatment (impact) sites at each lek complex before treatment (impact) and after treatment (impact) short- and long-term in Routt and Moffat counties, Colorado.
Chicks/Juveniles
Nest Vegetation Transects1
5-Year Treatment Maturation
Females
1Use/random paired sample size
BEFORE AFTER (SHORT-TERM) AFTER (LONG-TERM)
Brood Vegetation Transects1

20
Food
Competitors Predators Parasites
Microclimate Disease
Nest sites Brood sites
Escape cover
Figure 1. Mechanisms that link CRP structure and function to population viability (adapted from Marzluff et al. 2000)
Conservation Reserve Program
structure and function
Population viability (abundance, survival,
reproduction, recruitment)
21
10 km
C1-50 males C3-80
malesT1-70 malesC2-50
males
T2-70 males
Figure 2. Study area location of treatment (T) and control (C) sites and the number of males on 2 or more dancing grounds in Moffat and Routt, counties Colorado.
22
2014
2015
2016
2017
2018
2019
2020
2021
2022
2023
2024
2025
Environm
ental Variable
Control A
Treatment
Control B
Control C
Year-To-Year Variation Bird-To-Bird or Vegetation Transect-To-
Transect Variation Treatment
///Site x Year Interaction Variation
Figure 3. Conceptual schematic of a BACI design identifying the differing types of variation, treatment and control sites as well as the anticipated treatment in 2016 for Columbian sharp-tailed grouse habitat improvement. Only one treatment site is depicted.

23
APPENDIX A Colorado Division of Parks and Wildlife September 2013-September 2014
WILIDLIFE RESEARCH REPORT State of: Colorado : Division of Parks and Wildlife Cost Center: 3420 : Avian Research Work Package: 1656 : Columbian Sharp-tailed Grouse Conservation Task No.: N/A : Columbian sharp-tailed grouse chick and juvenile
radio transmitter evaluation Federal Aid Project No. N/A Period Covered: September 1, 2013 – August 31, 2014 Author: A. D. Apa Personnel: J. Haskins, B. Petch, T Balzer, L Rossi, J Yost, CPW; Brandon Miller, RMBO/NRCS/CPW All information in this report is preliminary and subject to further evaluation. Information MAY NOT BE PUBLISHED OR QUOTED without permission of the author. Manipulation of these data beyond that contained in this report is discouraged.
ABSTRACT The Columbian sharp-tailed grouse (CSTG, Tympanuchus phasianellus columbianus) is one of six subspecies of sharp-tailed grouse in North America. CSTG currently occupy 10% of their former range due to habitat loss. Since the initiation of the Conservation Reserve Program (CRP), CSTG have increased in distribution and density. Managers desire to improve existing or historically enrolled CRP fields. Research techniques to evaluate the population response of CSTG to habitat treatments (via understanding chick and juvenile demographic parameters) do not exist. Therefore, the objectives of my study are to: 1) evaluate the capture and transmitter attachment technique for day-old CSTG chicks, 2) evaluate the capture and transmitter attachment technique for 30-day-old CSTG chicks, 3) evaluate the capture technique for > 120 day-old CSTG juveniles, and 4) evaluate 2 necklace transmitter attachment designs for female CSTG. My study occurred near Hayden, Routt County, Colorado from April - August 2014. I captured CSTG in the spring using walk-in funnel traps, fit females with 2, 12 g necklace-mounted radio transmitter designs to, monitor survival, and nesting effort. I captured chicks from successful females and radio-marked a sample with 0.65 g backpack style (3.9 g for juveniles) transmitter sutured along the dorsal midline between the wings. I monitored survival and movement daily. I conducted summary statistics and Kaplan-Meier function estimates with staggered entry for female and chick survival. I captured 32 female CSTG and monitored survival and productivity from April through August. I documented a 5-month female survival rate of 0.57 which similar to previous research. Twenty nests exhibited a 47% apparent nest success. Twenty-five chicks and 16 juveniles from seven broods were radio-marked with a mean chick mass was 16.3 g and juvenile mass of 94.3 g. The total average handling time was 31 minutes. Chick survival to 17 days was 0.49 and juvenile survival was 0.66 from 18 -50 days-of-age. The primary cause of female mortality was predation. Survival estimates for chick and juveniles was consistent with previous research in Alberta and South Dakota with sharp-tailed grouse. The techniques evaluated in this pilot study are deemed appropriate for future research in Colorado.

24
WILDLIFE RESEARCH REPORT
COLUMBIAN SHARP-TAILED GROUSE CHICK AND JUVENILE RADIO TRANSMITTER
EVALUATION
ANTHONY D. APA
PROJECT OBJECTIVES My project goal is to evaluate trapping and transmitter attachment methods on CSTG that have been previously used on GRSG. My study objectives are to:
1. Evaluate the capture and transmitter attachment technique for day-old CSTG chicks. 2. Evaluate the capture and transmitter attachment technique for 30-day-old CSTG chicks. 3. Evaluate the capture technique for > 120 day-old CSTG juveniles. 4. Evaluate 2 necklace transmitter attachment designs for female CSTG.
If the techniques are successfully developed they will be used in a future research project.
INTRODUCTION The Columbian sharp-tailed grouse (CSTG, Tympanuchus phasianellus columbianus) is one of 6 subspecies of sharp-tailed grouse in North America. Current distribution ranges from British Columbia in the northwest to Colorado in the southeast. In-between populations exist in Washington, Idaho, Wyoming, Montana (extirpated), Utah, and Nevada (reintroduced) and Oregon (reintroduced). It currently occupies 10% of its former range across western North America (U.S. Department of the Interior 2000) and habitat loss is cited as the primary reason for its decline (Yocom 1952, Giesen and Braun 1997, McDonald and Reese 1998, Schroeder et al. 2000). Since the establishment of the Conservation Reserve Program (CRP) in 1985, CSTG have increased in distribution and density primarily in Idaho, Utah, and Colorado (U.S. Department of the Interior 2000). The CSTG (Mountain Sharp-tail) is a game species in Colorado, and is designated as a species of state special concern. Management efforts to increase distribution in un-occupied but historic range of CSTG have occurred via reintroductions into Oregon and Nevada from source populations in Idaho. Additional reintroduction efforts have occurred within Utah and Colorado. Specifically, Colorado Parks and Wildlife has conducted reintroduction efforts within historic range in Dolores and Grand Counties. Overview of Potential Future Research - Although management efforts continue to expand the range of CSTG, there is interest in improving habitat quality within occupied range. Improving habitat quality could: 1) increase densities and occupancy, 2) improve habitat in vacant and/or low quality CRP in unoccupied to expand distribution and/or, 3) be used as habitat improvements to mitigate impacts related to other habitat loss issues on the landscape (e.g., oil and gas exploration and development). Although research in Colorado (Boisvert 2002, Collin 2004) suggests that CRP is generally beneficial to CSTG (over other agricultural practices), adjacent higher quality habitats in native or mineland reclamation provide higher quality habitat resulting in more productive CSTG populations. Poor quality CRP, consists of 1-2 grass and < 3 forb species (Boisvert 2002), with the grass species being predominantly sod-forming species (e.g. intermediate wheatgrass (Thinopyrum intermedium) and smooth

25
brome (Bromus inermis)). These species tend to dominate sites and do not provide high quality CSTG nesting and brood-rearing habitat (Boisvert 2002). Dasmann (1964:59) stated “To manage wildlife we must first manage the habitat.” Thus habitat management can range from complete protection from disturbance to improving quality so that the wildlife populations can be productive, maintained, and/or optimized to increase its carrying capacity (Dasmann 1964). Although Dasmann (1964) was correct in his statements nearly 50 years ago, the wildlife-habitat relationship is complex and differs widely among species and landscapes. Although our understanding of the wildlife-habitat relationship has improved, knowledge has evolved to define and assess habitat quality as it relates to population growth rates, density, and demographic rates (Van Horne 1983, Knutsen et al 2006, Johnson 2007). This is paramount when attempting to couple habitat quality change with wildlife population demographic changes. CSTG provide a unique opportunity to evaluate a population response to habitat quality change. CSTG are a highly productive, generalist species (Apa 1998) having centralized breeding locations and limited movements during the breeding season (Boisvert et al. 2005). This behavior allows managers to target habitat improvements in nesting and brood-rearing areas. Since CSTG are breeding and brood-rearing habitat generalists and more productive (when compared to greater sage-grouse [GRSG; Centrocercus urophasianus]; Apa 1998), these characteristics can facilitate a relatively rapid response to habitat management. This allows managers and researchers to work cooperatively in attempting to couple landscape level habitat quality improvements in coordination with the demographic and population response of CSTG. More information is needed to evaluate the demographic and population response of CSTG to breeding and summer/fall habitat improvements through more rigorous estimates of chick and juvenile (> 5 weeks-of-age) survival, dispersal, and recruitment. The field methods to obtain those estimates exist for surrogate species, but not for CSTG. Transmitter attachment and capture methods have been developed to estimate GRSG chick survival from hatch to 50 days (Burkepile et al. 2002, Gregg and Crawford 2009, Dahlgren et al. 2010, Thompson 2012), but only one study investigated approaches to estimate GRSG juvenile survival (> 50 days-of-age for estimates of dispersal and recruitment; Thompson 2012). Additionally, one study (Manzer and Hannon 2007) has developed the field techniques to estimate plains sharp-tailed grouse (T. p. jamesi; PSTG) chick survival from hatch to 30 days-of-age, but PSTG are approximately 100 g larger (Sisson 1976) than CSTG (Collins 2004) and are not a perfect surrogate for my proposed field method evaluation.
STUDY AREA Study Area Specific to Pilot Research My study was conducted near Hayden, Routt County, Colorado. It is interspersed with native big sagebrush (Artemisia tridentata spp.)/grass or mountain shrub communities, dominated by private land that is currently, or was historically, enrolled in the Conservation Reserve Program. Primarily exotic grasses (smooth brome and intermediate wheatgrass) and forbs (alfalfa (Medicago sativa)) dominate the habitat (Fig. 1). The average annual precipitation in Hayden, Colorado is 43.2 cm. The average minimum and maximum annual temperatures are -2.8o C and 14.4o C, respectively.

26
METHODS Methods Specific to Pilot Research Grouse Capture – I captured CSTG in the spring using walk-in funnel traps (Schroeder and Braun 1991) in the morning on dancing grounds and opened traps ½ hour before sunrise and closed/blocked them at the cessation of trapping each morning. I initiated trapping based upon the timing and peak of female attendance (Giesen 1987). I fit females with a either a 14.5 g necklace-mounted radio transmitter (Model A4120, Advanced Telemetry Systems, Isanti, MN) or a 15 g necklace mounted radio transmitter (Model RI-2BM4, Holohil Systems, Ltd., Ontario, Canada) both with a 4-hour mortality circuit and approximately a 8.5 month nominal battery life. Each transmitter had its 16 cm antenna bent to lie down between the wings and down the back of the grouse. I classified grouse by gender (Snyder 1935, Henderson et al. 1967) and age (yearling or adult; Ammann 1944), placed them in a cotton bag, and weighed them on an electronic balance. I fit all females with an individually numbered aluminum leg band (size 12) on the tarsus, and released them at the point of capture. Nest Monitoring and Chick Capture - I monitored movements using triangulation from a ≥ 30 m distance (to minimize disturbance) using hand-held Yagi antenna attached to a receiver, and monitored nesting behavior to identify nest location. Nesting was also confirmed by obtaining a second directional location at a 90o angle to the first. If a female was observed in the same location for two consecutive days, she was assumed to be incubating. I attempted a visual observation of the female, if vegetation concealment was conducive, 7-10 days post-incubation confirmation and monitored nest fate using telemetry at a ≥ 30 m distance (24-26 day incubation period). Once monitoring revealed a successful hatch (female movement away from the nest), I captured all chicks in the brood within 12 - 24 hours. I located females < 2 hours after sunrise during brooding and flushed the female. I captured all chicks by hand and confined them in a small heated cooler to assist in maintaining thermoregulation. I weighed (± 0.01 g) all chicks with an electronic scale and a random sample (depending on brood size) was selected for transmitter attachment. A 0.65 g backpack style (Model A1025; nominal battery life is 28 days; Advanced Telemetry Systems, Isanti, MN) transmitter was sutured along the dorsal midline between the wings (Burkepile et al. 2002, Dreitz et al. 2011, Manzer and Hannon 2007, Thompson 2012). Two 20-gauge needles were inserted subcutaneously and perpendicular to the dorsal mid-line, and monofilament suture (Braunamide: polyamide 3/0 thread, pseudo monofilament, non-absorbable, white) material was threaded through the needle barrel. I applied one drop of cryanocrylate glue on the knot, and released the chicks (marked and unmarked) simultaneously at the capture site. Chick survival and movements were monitored 1-2 hours post-release to determine brood female affinity and post-handling chick behavior. I monitored female and chick movements and survival daily until 14 days-of-age, by circling at a 25 m radius. I documented the position (i.e., distance) of radio-marked chicks in relation to the brood female, systematically searching the area for missing chicks/transmitters. I collected brood locations equally among 4 time periods: brooding (< 2 hour after sunrise or before sunset), morning (0800-1100), mid-day (1100-1400), and afternoon (1400-1800) throughout the study, increasing the location sampling period to every 1-3 days until the brood was 20-30 days of age. I captured surviving juveniles at two different ages using spotlight techniques (Giesen et al. 1992, Wakkinen et al. 1992). The first capture was at 20-25 days-of-age. I captured 20-25 day-old juveniles approximately 2 hours before sunrise to enhance the possibility of females brooding juveniles. The

27
female and brood were circled using telemetry and approached slowly with the aid of a “red light” on a head lamp and the location was marked using yellow glow sticks. The female and brood were captured using a 1.5 m diameter hoop net. All birds were immediately restrained and the brood female was release at the point of capture. The chick transmitter was removed and replaced with a 3.9 g back-pack style juvenile transmitter (Model A1080, nominal life 6-7 months; Advanced Telemetry Systems, Isanti, MN). I used the same attachment method as described earlier for day-old-chicks (Burkepile et al. 2002, Dreitz et al. 2011, Manzer and Hannon 2007, Thompson 2012). I will attempt to capture surviving juveniles 10-12 weeks following initial radio-marking in late-September and October, and fit juveniles with a12 g adult style necklace-mounted radio transmitters mentioned earlier. I used techniques to capture juveniles using spotlight techniques described earlier. Data Analysis - I conducted summary statistics and Kaplan-Meier (K-M) function estimates with staggered entry for female and chick survival (Kaplan and Meier 1958, Pollock et al. 1998).
RESULTS AND DISSCUSSION Results - I captured 32 female CSTG (21 adults: 10 yearlings: 1 unknown) from 15 - 26 April 2014 on four dancing grounds (Big Elk 1, Stokes Gulch 2 & 3, and Postovit). Adult and yearling female mass (x̄ ± SE) was 683.5 ± 11.6 g (n = 21) and 651.8 ± 11.0 g (n = 10), respectively. From April through August, I documented 13 female mortalities resulting in a 5-month female survival rate of 0.57 ± 0.02 (n = 31; 95% CI 0.38 - 0.75) (Fig. 2). Specifically, survival for females equipped with ATS and Holohil transmitters was 0.53 ± 0.03 (n = 15; 95% CI 0.28 – 0.79) and 0.60 ± 0.03 (n = 16; 95% CI 0.33 – 0.86) (Fig. 3). I did not include two females in the survival analyses (one radio failure and one was euthanized due to an irreversible capture related injury). All other mortalities were predation related and had no sign of crop restriction or impaction. My overall nest initiation rate was 90% (n = 18/20) for 12 adults and 8 yearlings that specifically exhibiting a100% and 88% nest initiation rate, respectively. I documented a 41% (n = 9/22) apparent nest success and a 47% (n = 9/19) apparent female success. No renesting adult females were successful and one renesting yearling was successful. Female movement from the lek of capture to nest averaged 2.16 ± 0.53 km (n = 22; range 0.20 - 10.78). Sixty-four percent of the nests were located within 2 km of the lek of capture. I captured 43, day-old chicks from seven broods with a mean mass of 16.3 ± 0.4 g (range 14.7 - 19.3). I radio-marked 25 of those chicks resulting in an average number of chicks marked/brood of 3.6 ± 0.5 chicks (range 2 - 5). Total brood size was 6.7 ± 1.2 chicks (range 3 - 11). The average time to process an entire brood (radio-mark, weigh, and release) was 31 ± 6 minutes resulting in an average brood processing time/chick of 4.9 minutes (range 2.7 - 8 minutes). I recaptured and marked juveniles that were 18 - 21 days-of-age. Juvenile mass at capture was 94.3 ± 3.7 g (n = 15; range 85 - 130 g). I estimated survival from 1 - 50 days-of-age and for two time periods; chicks from 1 - 17 days-of-age juveniles from 18 - 50 days-of-age. The latter time period corresponds to transmitter exchange. Survival from capture to 30 days-of-age was 0.39 ± 0.02 (n = 31; 95% CI 0.22 - 0.56) and 50 days-of-age was 0.32 ± 0.02 (n = 31; 95% CI 0.16 - 0.49) (Fig. 4). Chick and juvenile survival was 0.49 ± 0.02 (n = 25; 95% CI 0.27 – 0.71) (Fig. 5) and 0.62 ± 0.03 (n = 16; 95% CI 0.42 - 0.89) (Fig. 6), respectively. Discussion – My trapping time frame, although brief, was similar to reports from Boisvert (2002) and Collins (2004). My adult: yearling capture ratio (2.1:1) was different than reported by Collins (2004; 5.0:1) and Boisvert (2002; 3.6:1), but is likely indicative of my shorter trapping period and smaller

28
sample sizes. Adult and yearling female mass was similar to earlier reports (Boisvert 2002, Collins 2004). My 5-month female survival (0.57) was similar to that reported by Collins (2004;0.41 - 0.58) for birds in mineland reclamation, but much lower (0.70 - 0.79) than females in shrub steppe habitat at 150 days exposure post-capture. In contrast, my survival was higher than reported by Boisvert (2002; 0.50). Based on these results, I believe I was successful in addressing and correcting issues from the 2013 research pilot where I experienced low female survival due to the transmitter attachment technique (Apa 2013). To specifically address objective 4, I have selected the elastic necklace style for future research. This decision is based on previous studies and personal experience with both styles. I documented a similar, but slightly lower (90%), nest initiation rate than reported by Collins (2004;97%) and Boisvert (2002; 97%). My apparent nest success (41%) was less congruent with previous Colorado research. It was similar to nest success reported by Collins (2004;42%) but lower than reported by Boisvert (2002;63%). Although nest success appeared low, it was not abnormally low and likely due to the small spatial and temporal nature of this pilot study. In my assessment of objective 2, I successfully increased samples sizes from the 2013 pilot study (Apa 2013) and successfully radio-mark CSTG day-old chicks. Transmitter size was ≤ 5% of body mass, averaging 4.0% of a day-old chick’s body mass (range; 3.4 - 4.4%). Manzer and Hannon (2007) fit chicks with transmitters similarly to me and reported a transmitter mass of 6 - 8% of chick mass (13.7 - 18 g). Manzer and Hannon (2007) fit chicks with larger (1.1 g) transmitters which resulted in a higher percent of mass than I report, because chick mass for PSTG and CSTG were similar. My resulting 30-day juvenile survival (0.39) was similar to the 30-day survival (0.41; 95% CI 0.25 – 0.57) reported by Manzer and Hannon (2007). My confidence intervals were also similar. In addition, Manzer and Hannon (2007) reported that 73% of the chick mortality they experienced occurred in the first 15 days. In contrast, I observed that only 48% of the mortalities occurred the first 15 days. In my assessment of objective 3, transmitter mass averaged 4.1% (range 3.0 – 4.6) of juvenile mass. Although Manzer and Hannon (2007) did not estimate survival past 30 days, Norton (2005) radio-marked juvenile PSTG at 14 - 21 days-of-age in South Dakota. Norton (2005) estimated survival (0.50 0 0.63() from 0 – 18 days-of-age from the literature. Norton (2005) reports survival from 19 days to the end of August (fledging) and it ranged from 0.67 – 0.77. My estimate of chick survival was within his reported confidence intervals. My survival estimates compare well with Manzer and Hannon (2007) through 30 days-of-age and with Norton (2005) even though he did not mark chicks at hatch. Based on these survival estimates and my success in capturing and marking chicks and juveniles, I suggest that there is reasonable evidence that these approaches can be successfully used in future research. ACKNOWLEDGEMENTS I want to thank the CPW Area 10 staff for assistance in landowner contacts, logistics, and trapping. This study occurred exclusively on private land and I thank those private landowners for the assistance and cooperation. Although I used the pronoun “I” throughout this document, I personally collected very little field data; therefore I want to thank R. Schakowsky and R. Harris for the many hours in the field conducting the field observations and data collection and entry. Most importantly, I want to thank R. Hoffman for his assistance, professional guidance, and advice throughout all phases of this research.
29
LITERATURE CITED Ammann, G. A. 1944. Determining the age of pinnate and sharp-tailed grouse. Journal of Wildlife
Management 8:170-171. Amstrad, S. C. 1980. A radio-collar for game birds. Journal of Wildlife Management 44:214-217. Apa, A. D. 1998. Habitat use and movement of sage and Columbian sharp-tailed grouse in southeastern
Idaho. Ph.D. Dissertation, University of Idaho, Moscow, ID, USA. Apa, A.D. 2013. Columbian sharp-tailed grouse chick and juvenile radio transmitter evaluation. Pages 1
– 10 in: J.H. Gammoned (Editor), Wildlife Research Reports, Colorado Parks and Wildlife, Fort Collins, CO, USA.
Boisvert, J. H. 2002. Ecology of Columbian sharp-tailed grouse associated with Conservation Reserve
Program and reclaimed surface mine lands in northwestern Colorado. M.S. Thesis. University of Idaho, Moscow, ID, USA.
Boisvert, J. H., R. W. Hoffman, and K. P. Reese. 2005. Home range and seasonal movements of
Columbian sharp-tailed grouse associated with Conservation Reserve Program and mine reclamation. Western North American Naturalist 65:36-44.
Burkepile, N. A., J. W. Connelly, D. W. Stanley, and K. P. Reese. 2002. Attachment of radiotransmitters
to one-day-old sage grouse chicks. Wildlife Society Bulletin 30:93-96. Collins, C. P. 2004. Ecology of Columbian sharp-tailed grouse associated with coal mine reclamation
and native shrub-steppe cover types in northwestern Colorado. M.S. Thesis. University of Idaho, Moscow, ID, USA.
Dahlgren, D. K., T. A. Messmer, and D. N. Koons. 2010. Achieving better estimates of greater sage-
grouse chick survival in Utah. Journal of Wildlife Management 74:1286-1294. Dasmann, R. F. 1964. Wildlife Biology. John Wiley & Sons, Inc. New York, NY, USA. Dreitz, V. J., L. A. Baeten, T. Davis, and M. M. Riordan. 2011. Testing radiotransmitter attachment
techniques on northern bobwhite and chukar chicks. Wildlife Society Bulletin 35:475-480. Giesen, K. M. 1987. Population characteristics and habitat use by Columbian sharp-tailed grouse in
northwestern Colorado. Final Report, Colorado Division of Wildlife Federal Aid Project W-37-R, Denver, CO, USA.
Giesen, K. M., T. J. Schoenberg, and C. E. Braun. 1982. Methods for trapping sage grouse in Colorado.
Wildlife Society Bulletin 10:224-231. Gregg, M. A., and J. A. Crawford. 2009. Survival of greater sage-grouse chicks and broods in the
northern Great Basin. Journal of Wildlife Management 73:904-913. Henderson, F. R., F. W. Brooks, R. E. Wood, and R. B. Dahlgren. 1967. Sexing of prairie grouse by
crown feather patterns. Journal of Wildlife Management 31:764-769.

30
Johnson, M. D. 2007. Measuring habitat quality: A review. Condor 109:489-504. Kaplan, E. L., and P. Meier. 1958. Non-parametric estimation from incomplete observation. Journal of
the American Statistics Association 53:457-481. Knutson, M. G., L. A. Powell, R. K. Hines, M. A. Friberg, and G. J. Niemi. 2006. An assessment of bird
habitat quality using population growth rates. Condor 108:301-314. Manzer, D. L. 2004. Sharp-tailed grouse breeding success, survival, and site selection in relation of
habitat measured at multiple scales. Ph.D. Dissertation. University of Alberta, Edmonton, Alberta, Canada.
Manzer, D. L., and S. J. Hannon 2007. Survival of sharp-tailed grouse Tympanuchus phasianellus chicks
and hens in a fragmented prairie landscape. Wildlife Biology 14:16-25. McDonald, M. W., and K. P. Reese. 1998. Landscape changes within the historical range of Columbian
sharp-tailed grouse in eastern Washington. Northwest Science 72:34-41. Norton, M. A. 2005. Reproductive success and brood habitat use of greater prairie chickens and sharp-
tailed grouse on the Fort Pierre National Grasslands of central South Dakota. M.S. Thesis. South Dakota State University, Brookings, SD, USA.
Pollock, K. H., S. R. Winterstein, C. M. Bunck, and AP. D. Curtis. 1989. Survival analysis in telemetry
studies: the staggered entry design. Journal of Wildlife Management 53:7-15. Schroeder, M. A., and C. E. Braun. 1991. Walk-in traps for capturing greater prairie chickens on leks.
Journal of Ornithology 62:378-385. Schroeder, M. A., D. W. Hays, M. A. Murphy, and D. J. Pierce. 2000. Changes in the distribution and
abundance of Columbian sharp-tailed grouse in Washington. Northwestern Naturalist 81:95-103. Sisson, L. 1976. The sharp-tailed grouse in Nebraska. Nebraska Game and Parks Commission. Lincoln,
NE, USA. Snyder, L. L. 1935. A study of the sharp-tailed grouse. Royal Ontario Museum of Zoology, Biological
Service, Publication 40, Toronto, Ontario, Canada. Thompson, T. R. 2012. Dispersal ecology of greater sage-grouse in northwestern Colorado: evidence
from demographic and genetic methods. Ph.D. Dissertation. University of Idaho, Moscow, ID. USA.
Van Horne, B. 1983. Density as a misleading indicator of habitat quality. Journal of Wildlife
Management 47:893-901. United States Department of the Interior. 2000. Endangered and threatened wildlife and plants; 12-
month finding for a petition to list Columbian sharp-tailed grouse as threatened. Federal Register 65:197.
Wakkinen, W. L., K. P. Reese, J. W. Connelly, and R. A. Fischer. 1992. An improved spotlighting
techniques for capturing sage grouse. Wildlife Society Bulletin 20:425-426.

31
Yocom, C. F. 1952. Columbian sharp-tailed grouse in the state of Washington. American Midland
Naturalist 48:185-192.

32
Figure 1. Columbian sharp-tailed grouse study area in Routt County, Colorado, 2013.
0
0.1
0.2
0.3
0.4
0.5
0.6
0.7
0.8
0.9
1
Survival
APR MAY JUN JUL AUGMonth
Female Survival
95% Confidence Limit
Figure 2. Kaplan-Meier product limit monthly survival with staggered entry of female Columbian sharp-tailed grouse (n = 31) from April - August in Routt County, Colorado, 2014.
33
0
0.1
0.2
0.3
0.4
0.5
0.6
0.7
0.8
0.9
1
Survival
Female Survival (Holohil)95% CI
APR MAY JUN JUL AUGMonth
Female Survival (ATS)95% CI
0
0.1
0.2
0.3
0.4
0.5
0.6
0.7
0.8
0.9
1
0 1 2 3 4 5 6 7 8 9 10 11 12 13 14 15 16 17 18 19 20 21 22 23 24 25 26 27 28 29 30 31 32 33 34 35 36 37 38 39 40 41 42 43 44 45 46 47 48 49 50
Survival
Chick/Juvenile95% CI
Figure 3. Kaplan-Meier product limit monthly survival with staggered entry of female Columbian sharp-tailed grouse fit with ATS (n = 15) and Holohil (n = 16) necklace style radio transmitters from April - August in Routt County, Colorado, 2014.
Day
Figure 4. Kaplan-Meier product limit daily survival with staggered entry of chick and juvenile Columbian sharp-tailed grouse chicks (n = 31) to 50 days-of-age in Routt County, Colorado, 2014.

34
0
0.1
0.2
0.3
0.4
0.5
0.6
0.7
0.8
0.9
1
0 1 2 3 4 5 6 7 8 9 10 11 12 13 14 15 16 17
Survival
Chick95% CI
Figure 5. Kaplan-Meier product limit daily survival with staggered entry of Columbian sharp-tailed grouse chicks (n = 25) from hatch to 18 days-of-age in Routt County, Colorado, 2014.
Day
0
0.1
0.2
0.3
0.4
0.5
0.6
0.7
0.8
0.9
1
18 19 20 21 22 23 24 25 26 27 28 29 30 31 32 33 34 35 36 37 38 39 40 41 42 43 44 45 46 47 48 49 50
Survival
Juvenile95% CI
Day Figure 6. Kaplan-Meier product limit daily survival with staggered entry of juvenile Columbian sharp-tailed grouse chicks (n = 16) from 19 - 50 days-of-age in Routt County, Colorado, 2014.
35
APPENDIX B
SAGE-GROUSE TRAPPING AND HANDLING PROTOCOL CAPTURE Sage-grouse have been captured in Colorado with a variety of techniques including spotlighting and long-handled nets, drive traps, and stationary and vehicle-mounted cannon nets (Giesen et al. 1982). Giesen reviewed the effectiveness of these methods and concluded that spotlighting was the most efficient (birds/hour) and resulted in injury/mortality rates below 1%. Capture rates using spotlight trapping methods during spring (on leks) are biased towards adult males since hens and yearlings are far less likely to roost on leks. This method results in unbiased capture rates relative to sex and age classes during summer and winter. Use of drive traps in Moffat County during summer resulted in mortality rates of 1.4% (5 of 347 birds captured), and minor injuries such as abrasions on the head and carpal joint were common. This method was not effective in North Park, and is effective only in areas where hens and broods concentrate. Under these conditions vehicle-mounted cannon nets were also effective. This capture method resulted in 5 of 221 (2.3%) grouse suffering broken wings. Both drive traps and vehicle-mounted cannon nets were highly selective towards juveniles. Young (1994) pioneered the use of walk-in traps to capture sage-grouse on leks. She modified the traps and techniques described by Schroeder and Braun (1991) for trapping Greater Prairie Chickens on leks in eastern Colorado. This capture method resulted in minor injuries to approximately 10% of the prairie chickens captured. These injuries consisted of small cuts on the forehead directly above the maxilla, the wing near the base of the alula, and the back of the head and neck. The former injury was common when birds were in traps for long periods of time; they constantly probed their heads through the sides of traps. The latter two injuries were common when males were captured simultaneously in the same trap; head injuries were caused by pecking by the other bird and wing injuries by attempts to escape. Frequency of all injuries was reduced by rapid removal of birds from traps and improvements in trap design (elimination of exposed metal points). Use of walk-in traps on leks resulted in 8 mortalities in 231 captures (3.5%). Two males died of heat or other stress while in the trap, 1 male was impaled by the bottom of the trap as he tried to escape and 1 male was killed by another male in the same trap. Four birds were killed by raptors while in the traps. Seven of the 8 mortalities could have been prevented with increased monitoring of the traps. Schroeder and Braun (1991) found walk-in traps were effective at catching male prairie chickens throughout the breeding season. This method was effective for females primarily during the peak of hen attendance on leks. Because of the sexual dimorphism of sage-grouse, Young (1994) selectively captured females by reducing the size of the funnel opening to prevent males from entering traps (see Walk-in trapping section for trap dimensions). Spotlighting Giesen et al. (1982) described the general procedures used in spotlighting sage-grouse. Wakkinen et. al. (1992) described their modification of this technique where they used binoculars to spot roosting sage-grouse at night with the aid of spotlights. The use of binoculars increased trapping success > 40% and increased sage-grouse detection in 55 of 58 (95%) instances. Sage-grouse roosting along roads or on, or near, leks are spotted at night by observers in vehicles or on foot using high powered (500,000-1 million candlepower), 12-volt spotlights. A 2-person trapping crew approaches the bird at a brisk pace. A portable tape player worn by one of the trappers plays snowmobile engine noise or some other “white” noise to mask the sound of their approach. One person carries a spotlight and keeps the bird illuminated
36
while the other walks past the spotlighter and places the net over the sage-grouse. This person continues to apply downward pressure on the flexible net handle to prevent the bird from getting under the rim until the spotlighter can move up and cover the edges of the rim with their knees or hand. This person holds the grouse through the net with both hands to prevent struggling. The person holding the net then moves forward, reaches under the net, and gets a firm hold of both feet of the sage-grouse in one hand. The bird is then pulled out from under the net and either placed in a gunnysack or held against the chest, with one hand covering the free wing and the other retaining a firm hold on both feet. The nets used have a rim diameter of 60-100 cm, which greatly reduces the risk of striking the bird with the rim. Rims are made of lightweight aluminum to minimize impact on birds if they are struck. One inch by 1-inch nylon netting forms the pouch of the net. This size prevents birds from extending their head or neck through the netting and reduces the risk of injury. Netting is attached to the rim so as to leave a sage-grouse sized pouch. This ensures that pressing down on the rim will not press down on the grouse, and prevents grouse from flushing into slack netting. Walk-in Trapping Schroeder et al. (1991) described using walk-in traps to catch Greater Prairie Chickens in eastern Colorado. Young (1994) modified the traps described by Schroeder et al. (1991). She used 360 x 46-cm sections of 5 x 10-cm welded wire to form 1-m diameter circular traps. The tops of the traps were covered with 1x1-inch nylon netting and the traps are placed on leks in spring. The entrance to the trap is constructed of welded wire bent into an inverted “U.” The funnel was tapered from 25 cm at the entrance to 15 cm at the exit (Young 1994). Birds are directed towards the trap by chicken wire leads placed on the lek. Leads are most efficient when oriented so that birds encounter them as they attempt to approach the center of the lek. Traps are set out on leks late in the afternoon or before birds attend the lek in the morning. Traps set in the afternoon will be checked after dark to ensure no birds have entered the traps. One or 2 people continuously observe the traps starting at daybreak the following morning. Since injuries and mortalities (from predation) are most likely to occur when traps are not monitored and birds stay in the traps for relatively long periods, all leks being trapped will be continuously monitored. Birds will be removed from traps (and the displaying birds disturbed by necessity) immediately if any of the following conditions occur:
1. Two or more males in the same trap and they are illustrating aggressive behavior towards one another.
2. Any bird that continuously flushes against the top of the trap or repeatedly probing with their heads through the welded wire.
3. A raptor or raptors begins to threaten a trapped bird. 4. The potential to catch additional birds is low. 5. High temperatures (>85 degrees F), wind, rain, snow, or other environmental conditions appear to
be stressing birds in traps. Birds are removed from the traps through a hole in the top netting. This hole is normally secured by strings tied to the welded wire frame or secured by bent welded wire tabs. Observers approach walk-in traps containing birds at a brisk pace, untie the knot securing the removal opening (or by lifting the netting over the bent welded wire tab), then reach in with both hands (blocking the hole with their arms) and secure the bird as quickly as possible. Birds are secured with both hands around both wings, or held against the ground with one hand while both legs are secured in the other. The bird is then placed in a

37
gunnysack or held against the chest with one hand covering the free wing and the other retaining a firm hold on both feet. If the same lek is trapped consecutive days, funnels will be blocked when observers leave to prevent birds from entering the traps, or the back of the trap will be raised approximately 30 cm to allow easy egress if birds do enter. Behavior of birds on leks relative to traps and trap leads will be observed to facilitate re-arrangement of trap and lead locations. CODA Netlauncher The CODA netlauncher has not been previously used to capture sage-grouse. The CODA netlauncher is similar to the CODA netgun used for big game capture, but is mounted to a frame and sits on the ground. The netlauncher uses expanding gasses from a blank cartridge to propel 4 weights that are attached to a 20’ x 20’-1” x 1” mesh net. When the netlauncher is fired, these propelled weights pull the net from the unit’s canister and carry the net over the grouse. Twenty-four hours prior to netlauncher deployment, the dominant male and its territory are identified. After the grouse leave the strutting ground for the day, the male’s territory is marked with surveyors flagging. To center the net, the netlauncher is test fired. All 4 projectile landing locations are marked for reference. The netlauncher is deployed and fired the following morning. Great care is taken to identify any grouse that are in the line of fire of the projectiles. The netlauncher is not fired until a safe opportunity presents itself. Grouse captured are immediately covered with an opaque breathable material until they can be transferred into a gunnysack for processing. On an experimental basis, a netlauncher was borrowed from a sister state agency for use during the 2001 strutting season. Forty females were captured during 7 different attempts and no injuries were documented. HANDLING Captured sage-grouse will be processed as quickly as possible to minimize handling stress. Only trained and experienced people will handle birds. Birds will be processed immediately upon capture unless multiple birds are caught at the same time (walk-in trapping), or unless processing immediately will reduce the likelihood of capturing nearby birds while spotlighting leks. Birds not processed immediately will be held in gunnysacks tied at the top. Gunnysacks are well ventilated and prevent overheating. During processing, a breathable hood will be placed over each bird’s head to calm it, and a Velcro strap will be wrapped around the body to restrain both wings. Birds will be banded with serially numbered aluminum leg bands, and weighed. Weights will be obtained by placing the restrained bird on the pan of an electronic balance. Some sage-grouse may be fitted with 18-20 gm radio transmitters, which will be hung around the bird’s neck using black (UV resistant) nylon cable ties. The transmitter weight is < 2% of the body weight of a yearling Gunnison sage-grouse and is well within the maximum, (5% of the body weight) suggested for avian species. This attachment method has been used on over 650 hen pheasants and several dozen sage-grouse without causing noticeable discomfort or injury. Nylon cable ties are light and can be custom fit to the bird very quickly, which reduces processing time. Nylon ties eventually degrade due to exposure to UV. It is likely that radios and cable ties will fall off if birds live much longer than the expected 16-20 month battery life typical of these radio transmitters. Birds suffering significant injuries such as broken wings or bones will be taken to the authorized wildlife rehabilitation facility in Del Norte. If, in the opinion of the researcher on site, the injury will result in the

38
bird’s death the bird will be euthanized by cervical dislocation. Minor injuries such as abrasions will be treated with silvadene cream (available over-the-counter) and the birds released. If recurring injuries of any kind occur, appropriate measures will be taken to ascertain the cause of these injuries and modify the trap or trapping protocol to reduce or eliminate them. Birds will be released by placing them under a sagebrush bush or in other dense cover to reduce the chance they will flush into something in their haste to escape. At no time will birds be flung into the air, dumped out of gunnysacks, or released in any manner which may initiate a panic-like flight. Individuals releasing birds will quickly and quietly back away until the bird has walked, run, or flushed. Behavior at release will be observed in case an injury was missed. Some projects, such as transplants, will have their own release protocols.

39
Literature Cited Giesen, K.M., T.J. Schoenberg, and C.E. Braun. 1982. Methods for trapping sage-grouse in Colorado. Wildlife Society Bulletin. 10:224-231. Schroeder, M.A. and C.E. Braun. 1991. Walk-in traps for capturing greater prairie- chickens. Journal of Field Ornithology 62:378-385. Wakkinen, W.L., K.P. Reese, J.W. Connelly, and R.A. Fischer. 1992. An improved spotlighting technique for capturing sage-grouse. Wildlife Society Bulletin. 20:425-426. Young, J.R. 1994. The influence of sexual selection on phenotypic and genetic divergence among sage-grouse populations. Ph.D. Thesis. Purdue University, West Lafayette,
IN, USA I, _____________________________ have read and understand the sage grouse trapping (print name) protocol. Additionally I have received appropriate training with regards to differences between Columbian sharp-tailed grouse and sage grouse and will abide by the protocol. _______________________________ (Sign Name)