college readiness data for manassas city, manassas park ... · were dual enrolled in high school:...
TRANSCRIPT

College Readiness Data forManassas City, Manassas Park City,
and Prince William County High Schools: Fall 2011 through Fall 2015
Research Report No. 92-16
Office of Institutional Effectiveness and Student Success InitiativesJUNE 2016
NORTHERN VIRGINIA COMMUNITY COLLEGE
OFFICE OF INSTITUTIONAL EFFECTIVENESS AND STUDENT SUCCESS INITIATIVES
The purpose of the Office of Institutional Effectiveness and Student Success Initiatives is to conduct analytical studies and provide information in support of institutional planning, policy formulation, and decision making. In addition, the office provides leadership and support in research related activities to members of the NOVA community engaged in planning and evaluating the institution’s success in accomplishing its mission.
4001 Wakefield Chapel Road Annandale, VA 22003-3796
(703) 323-3129 www.nvcc.edu/oir
When citing data from this report, the Virginia Community College System (VCCS) must be cited as the source.

i
Table of Contents
Introduction ................................................................................................................................ 1
Explanatory Notes for Tables ..................................................................................................... 2
Manassas City ........................................................................................................................... 4
Manassas Park City ..................................................................................................................11
Prince William County ...............................................................................................................18

ii
List of Tables
Table MCPS 1. Manassas City School Division – Number of Graduates by High School: 2014-15 .......................................................................................................................................... 5
Table MCPS 2. Manassas City School Division – Number of Students Who Were Dual Enrolled in High School: Fall 2015 ...................................................................................................... 5
Table MCPS 3. Manassas City School Division – English VPT Placement Results for Test Participants Only: Fall 2015 ................................................................................................... 5
Table MCPS 4. Manassas City School Division – Math VPT Placement Results for Test Participants Only: Fall 2015 ................................................................................................... 5
Table MCPS 5. Manassas City School Division – Distribution of GPA Ranges: Fall 2015 ........... 5
Table MCPS 6. Manassas City School Division – Distribution of Grades Earned in Developmental Courses: Fall 2015 ........................................................................................ 6
Table MCPS 7. Manassas City School Division – Distribution of Grades Earned in College-Level Courses: Fall 2015 ................................................................................................................ 6
Table MCPS 8. Manassas City School Division – Curricular Program Classifications: Fall 2015 7
Table MCPS 9. Manassas City School Division: Osbourn High School – Curricular Program Selections: Fall 2015 ............................................................................................................. 7
Table MCPS 10. Manassas City School Division – Number of Graduates by High School: 2010-11 to 2014-15 ........................................................................................................................ 7
Table MCPS 11. Manassas City School Division – Entering Fall Number of Students Who Were Dual Enrolled in High School: Five-Year Aggregation Fall 2011 through Fall 2015 ................ 8
Table MCPS 12. Manassas City School Division – English VPT Placement Results for Test Participants Only: Fall 2013 through Fall 2015 ...................................................................... 8
Table MCPS 13. Manassas City School Division – Math VPT Placement Results for Test Participants Only: Fall 2012 through Fall 20151 ..................................................................... 8
Table MCPS 14. Manassas City School Division – Distribution of Fall Term GPA Ranges: Five-Year Aggregation Fall 2011 through Fall 2015 ...................................................................... 8
Table MCPS 15. Manassas City School Division – Distribution of Grades Earned in Developmental Courses: Five-Year Aggregation Fall 2011 through Fall 2015 ....................... 8
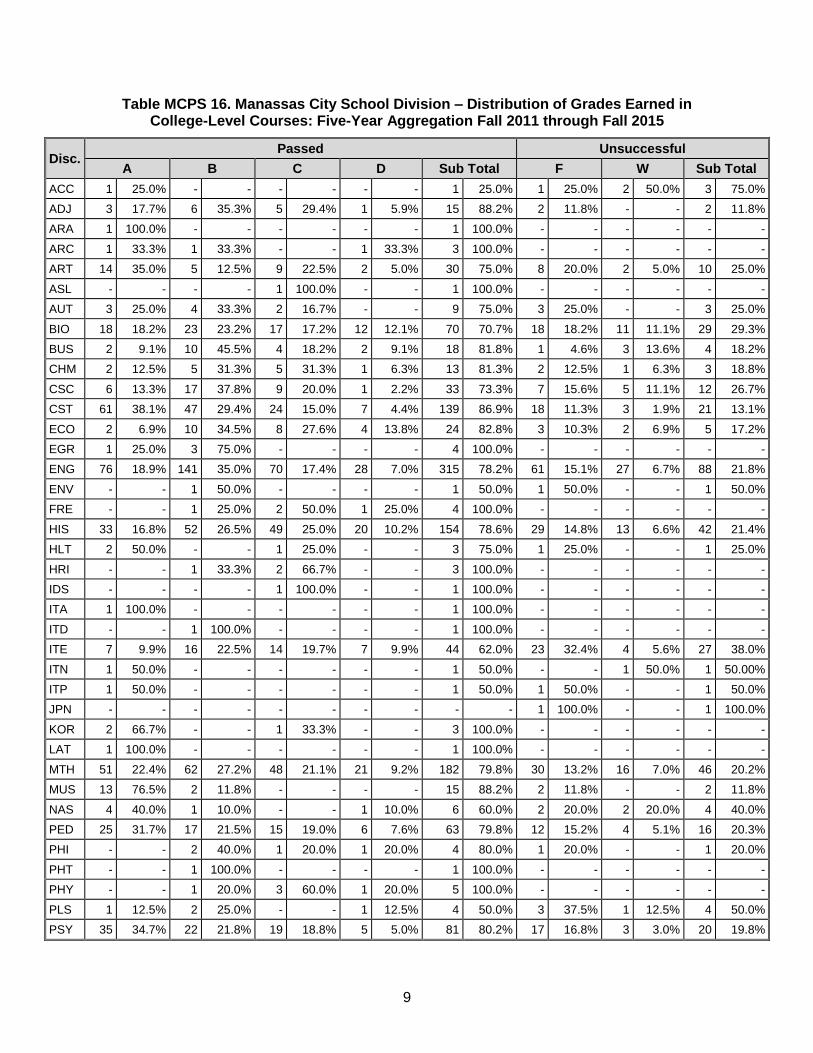
Table MCPS 16. Manassas City School Division – Distribution of Grades Earned in College-Level Courses: Five-Year Aggregation Fall 2011 through Fall 2015 ...................................... 9
Table MCPS 17. Manassas City School Division – Curricular Program Classifications: Five-Year Aggregation Fall 2011 through Fall 2015 ............................................................................. 10
Table MCPS 18. Manassas City School Division: Osbourn High School – Curricular Program Selections: Five-Year Aggregation Fall 2011 through Fall 2015 .......................................... 10
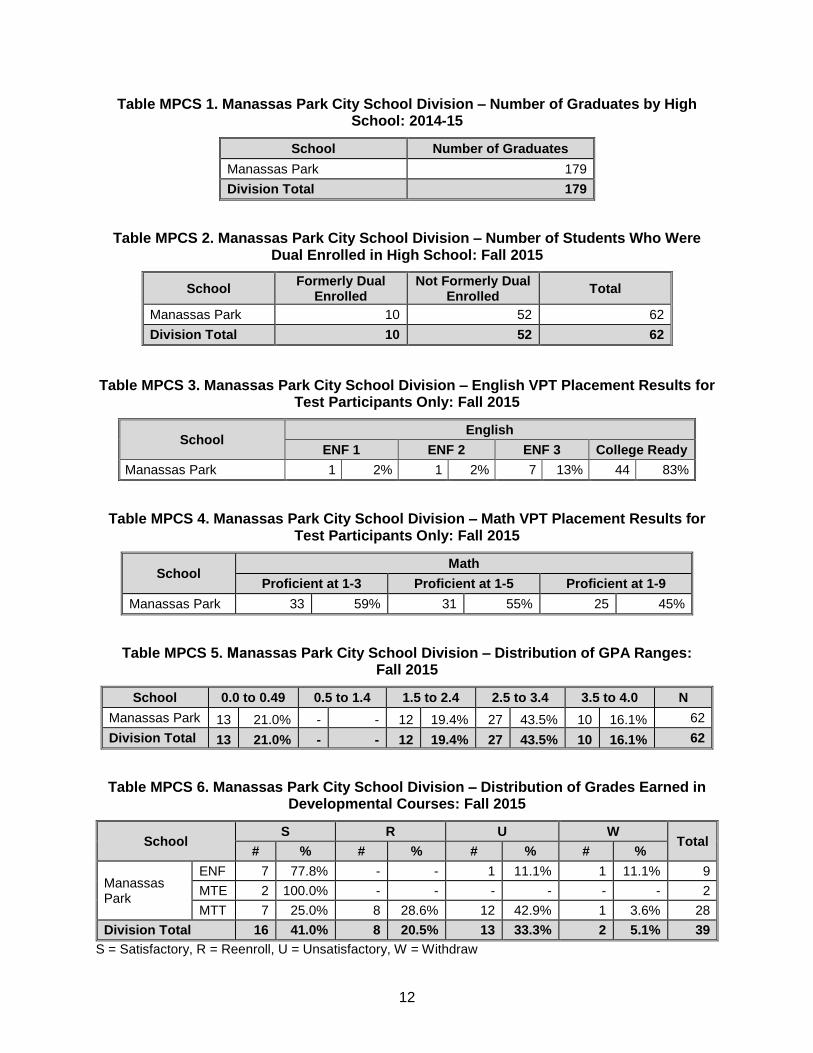
Table MPCS 1. Manassas Park City School Division – Number of Graduates by High School: 2014-15 ............................................................................................................................... 12
Table MPCS 2. Manassas Park City School Division – Number of Students Who Were Dual Enrolled in High School: Fall 2015 ....................................................................................... 12
Table MPCS 3. Manassas Park City School Division – English VPT Placement Results for Test Participants Only: Fall 2015 ................................................................................................. 12
Table MPCS 4. Manassas Park City School Division – Math VPT Placement Results for Test Participants Only: Fall 2015 ................................................................................................. 12
Table MPCS 5. Manassas Park City School Division – Distribution of GPA Ranges: Fall 2015 12

iii
Table MPCS 6. Manassas Park City School Division – Distribution of Grades Earned in Developmental Courses: Fall 2015 ...................................................................................... 12
Table MPCS 7. Manassas Park City School Division – Distribution of Grades Earned in College-Level Courses: Fall 2015 ..................................................................................................... 13
Table MPCS 8. Manassas Park City School Division – Curricular Program Classifications: Fall 2015 .................................................................................................................................... 13
Table MPCS 9. Manassas Park City School Division: Manassas Park High School – Curricular Program Selections: Fall 2015 ............................................................................................ 14
Table MPCS 10. Manassas Park City School Division – Number of Graduates by High School: 2010-11 to 2014-15 ............................................................................................................. 14
Table MPCS 11. Manassas Park City School Division – Entering Fall Number of Students Who Were Dual Enrolled in High School: Five-Year Aggregation Fall 2011 through Fall 2015 .... 14
Table MPCS 12. Manassas Park City School Division – English VPT Placement Results for Test Participants Only: Fall 2013 through Fall 2015 .................................................................... 15
Table MPCS 13. Manassas Park City School Division – Math VPT Placement Results for Test Participants Only: Fall 2012 through Fall 20152 ................................................................... 15
Table MPCS 14. Manassas Park City School Division – Distribution of Fall Term GPA Ranges: Five-Year Aggregation Fall 2011 through Fall 2015 ............................................................ 15
Table MPCS 15. Manassas Park City School Division – Distribution of Grades Earned in Developmental Courses: Five-Year Aggregation Fall 2011 through Fall 2015 ..................... 15
Table MPCS 16. Manassas Park City School Division – Distribution of Grades Earned in College-Level Courses: Five-Year Aggregation Fall 2011 through Fall 2015 ....................... 16
Table MPCS 17. Manassas Park City School Division – Curricular Program Classifications: Five-Year Aggregation Fall 2011 through Fall 2015 ............................................................ 17
Table MPCS 18. Manassas Park City School Division: Manassas Park High School – Curricular Program Selections: Five-Year Aggregation Fall 2011 through Fall 2015 ............................ 17
Prince William County School Division – Number of Graduates by High School: 2014-15 ............................................................................................................................... 19
Prince William County School Division – Number of Students Who Were Dual Enrolled in High School: Fall 2015 ....................................................................................... 19
Prince William County School Division – English VPT Placement Results for Test Participants Only: Fall 2015 ......................................................................................... 20
Prince William County School Division – Math VPT Placement Results for Test Participants Only: Fall 2015 ................................................................................................. 20
Prince William County School Division – Distribution of GPA Ranges: Fall 2015 .................................................................................................................................... 21
Prince William County School Division – Distribution of Grades Earned in Developmental Courses: Fall 2015 ...................................................................................... 22
Prince William County School Division – Distribution of Grades Earned in College-Level Courses: Fall 2015 ........................................................................................ 23
Prince William County School Division – Curricular Program Classifications: Fall 2015 .................................................................................................................................... 24
Prince William County School Division: Battlefield High School – Curricular Program Selections: Fall 2015 ............................................................................................ 25
Prince William County School Division: Brentsville District High School – Curricular Program Selections: Fall 2015 ............................................................................ 25
iv
Prince William County School Division: C.D. Hylton High School – Curricular Program Selections: Fall 2015 ............................................................................................ 26
Prince William County School Division: Forest Park High School – Curricular Program Selections: Fall 2015 ............................................................................................ 26
Prince William County School Division: Freedom High School – Curricular Program Selections: Fall 2015 ............................................................................................ 27
Prince William County School Division: Gar-Field High School – Curricular Program Selections: Fall 2015 ............................................................................................ 27
Prince William County School Division: Osbourn Park High School – Curricular Program Selections: Fall 2015 ............................................................................................ 28
Prince William County School Division: Patriot High School – Curricular Program Selections: Fall 2015 ............................................................................................ 28
Prince William County School Division: Potomac High School – Curricular Program Selections: Fall 2015 ............................................................................................ 29
Prince William County School Division: Stonewall Jackson High School – Curricular Program Selections: Fall 2015 ............................................................................ 29
Prince William County School Division: Woodbridge Senior High School – Curricular Program Selections: Fall 2015 ............................................................................ 30
Prince William County School Division – Number of Graduates by High School: 2010-11 to 2014-15 ................................................................................................ 30
Prince William County School Division – Entering Fall Number of Students Who Were Dual Enrolled in High School: Five-Year Aggregation Fall 2011 through Fall 2015 .................................................................................................................................... 31
Prince William County School Division – English VPT Placement Results for Test Participants Only: Fall 2013 through Fall 2015 ............................................................ 31
Prince William County School Division – Math VPT Placement Results for Test Participants Only: Fall 2012 through Fall 2015 .................................................................... 32
Prince William County School Division – Distribution of Fall Term GPA Ranges: Five-Year Aggregation Fall 2011 through Fall 2015 .............................................. 32
Prince William County School Division – Distribution of Grades Earned in Developmental Courses: Five-Year Aggregation Fall 2011 through Fall 2015 ..................... 33
Prince William County School Division – Distribution of Grades Earned in College-Level Courses: Five-Year Aggregation Fall 2011 through Fall 2015 ....................... 35
Prince William County School Division – Curricular Program Classifications: Five-Year Aggregation Fall 2011 through Fall 2015 ............................................................ 37
Prince William County School Division: Battlefield High School – Curricular Program Selections: Five-Year Aggregation Fall 2011 through Fall 2015 ............................ 37
Prince William County School Division: Brentsville District High School – Curricular Program Selections: Five-Year Aggregation Fall 2011 through Fall 2015............ 38
Prince William County School Division: C.D. Hylton High School – Curricular Program Selections: Five-Year Aggregation Fall 2011 through Fall 2015 ............................ 39
Prince William County School Division: Forest Park High School – Curricular Program Selections: Five-Year Aggregation Fall 2011 through Fall 2015 ............................ 40
Prince William County School Division: Freedom High School – Curricular Program Selections: Five-Year Aggregation Fall 2011 through Fall 2015 ............................ 41

v
Prince William County School Division: Gar-Field High School – Curricular Program Selections: Five-Year Aggregation Fall 2011 through Fall 2015 ............................ 42
Prince William County School Division: Osbourn Park High School – Curricular Program Selections: Five-Year Aggregation Fall 2011 through Fall 2015 ............................ 43
Prince William County School Division: Patriot High School – Curricular Program Selections: Five-Year Aggregation Fall 2011 through Fall 2015 ............................ 44
Prince William County School Division: Potomac High School – Curricular Program Selections: Five-Year Aggregation Fall 2011 through Fall 2015 ............................ 45
Prince William County School Division: Stonewall Jackson High School – Curricular Program Selections: Five-Year Aggregation Fall 2011 through Fall 2015............ 46
Prince William County School Division: Woodbridge Senior High School – Curricular Program Selections: Five-Year Aggregation Fall 2011 through Fall 2015............ 47

1
College Readiness Data: Manassas City, Manassas Park City, and Prince William County High Schools
Introduction
This report presents data from the Virginia Community College System (VCCS) on students’
level of preparedness for college, or college readiness. Information is included for students
enrolled in a VCCS college who graduated from high schools served by Northern Virginia
Community College (NOVA). Because the data is shown for students who had previously
attended a high school within NOVA’s jurisdiction, the majority of data in this report will
represent NOVA students. However, it is possible that some students who attended a Northern
Virginia high school may have enrolled in a VCCS college other than NOVA. These students
would be included in the tables in this report also.
The data in this report, presented in table format, provide information on indicators of college
preparedness which shows how well high school graduates are prepared for college. This
information includes the student outcomes of recent high school graduates during their first
semester at a VCCS college.
The tables in this report consist of two types: a one-year profile for 2014-15 high school
graduates enrolled at a VCCS college during Fall 2015, and a five-year aggregated profile (Fall
2011 through Fall 2015) of high school graduates enrolled at a VCCS college. The following
categories are included:
a. Number of high school graduates by high school;
b. Dual enrolled students;
c. VPT placement test results;
d. Grade Point Average (GPA) ranges;
e. Course grades;
f. Curricular program classifications; and
g. Curricular program selections.
This report presents the data for Manassas City, Manassas Park City, and Prince William
County. Data for the other public school districts in NOVA’s service area (Alexandria City,
Arlington County, Fairfax County, Falls Church City, and Loudoun County) are presented in
separate reports.
The information in these College Readiness reports includes only the data provided by VCCS
on this subject area.
2
Explanatory Notes for Tables
The tables in this report consist of two types: a one-year profile and a five-year aggregated
profile. The first series of tables for each school district present results for Fall 2015. The
second series of tables for each school district repeat the same type of information presented in
the first series, however, the data is aggregated by high school for the five-year period of Fall
2011 through Fall 2015. A brief explanation of each table within each series is provided below.
Series 1: A One-Year Profile for 2014-15 High School Graduates Entering Community
College in Fall 2015
Number of Graduates by High School
This table shows the number of high school graduates from each high school within the school
district during the 2014-15 academic year.
Number of Students Who Were Dual Enrolled in High School
This table presents the number of students entering community college in Fall 2015 who were
dual enrolled during high school.
VPT Placement Results
This table displays the VPT placement test results by high school for high school graduates
entering community college in Fall 2015.
Distribution of GPA Ranges
This table shows the distribution of GPA (grade point average) ranges for community college
students in Fall 2015 by the high school from which they graduated.
Distribution of Grades Earned in Developmental Courses
This table presents the distribution of grades earned by community college students in
developmental courses in Fall 2015 by the high school from which they graduated.
Distribution of Grades Earned in College-Level Courses
This table presents the distribution of passing grades (A, B, C, D) earned by community college
students in college-level courses in Fall 2015 by discipline. It also presents the distribution of
unsuccessful grades (F, W). The grades are aggregated for all students in all high schools
within a school district.
Curricular Program Selections
There are two tables titled ‘Curricular Program Selections’ for each high school within a school
district. The first table presents community college students who chose a curricular program
(career-tech, transfer, or unclassified) during the Fall 2015 semester by the high school from
which they graduated. The second table specifies the discipline that was selected by those
students.

3
Series 2: A Five-Year Aggregate Profile from Fall 2011 through Fall 2015
Number of Graduates by High School
This table shows the number of high school graduates from each high school within the school
district from the 2010-11 academic year through the 2014-15 academic year.
Entering Fall Number of Students Who Were Dual Enrolled in High School
This table presents the number of students who entered community college between Fall 2011
and Fall 2015 who were dual enrolled while in high school.
VPT Placement Results
Due to recent changes to placement testing, these tables display less than five-year
aggregates. VPT English aggregate results are for Fall 2013 through Fall 2015 while VPT math
aggregate results are for Fall 2012 through Fall 2015.
Distribution of GPA Ranges
This table shows the distribution of GPA (grade point average) ranges for students who entered
community college between Fall 2011 and Fall 2015 by the high school from which they
graduated.
Distribution of Grades Earned in Developmental Courses
This table presents the distribution of grades earned in developmental courses by students who
entered community college between Fall 2011 and Fall 2015 by the high school from which they
graduated.
Distribution of Grades Earned in College-Level Courses
This table presents the distribution of passing grades (A, B, C, D) earned in college-level
courses by students who entered community college between Fall 2011 and Fall 2015 by
discipline; it also presents the distribution of unsuccessful grades (F, W). The grades are
aggregated for all students in all high schools within a school district.
Curricular Program Classifications
This table presents the curricular programs (career-tech, transfer, or unclassified) chosen by
students who entered community college between Fall 2011 and Fall 2015 by the high school
from which they graduated.
Curricular Program Selections
This table specifies the discipline that was selected by community college students in curricular
programs between Fall 2011 and Fall 2015.

4
Manassas City

5
Table MCPS 1. Manassas City School Division – Number of Graduates by High School: 2014-15
School Number of Graduates
Osbourn 451
Division Total 451
Table MCPS 2. Manassas City School Division – Number of Students Who Were Dual Enrolled in High School: Fall 2015
School Formerly Dual
Enrolled Not Formerly Dual
Enrolled Total
Osbourn 26 100 126
Division Total 26 100 126
Table MCPS 3. Manassas City School Division – English VPT Placement Results for Test
Participants Only: Fall 2015
School English
ENF 1 ENF 2 ENF 3 College Ready
Osbourn - - 7 6% 19 16% 94 78%
Table MCPS 4. Manassas City School Division – Math VPT Placement Results for Test Participants Only: Fall 2015
School Math
Proficient at 1-3 Proficient at 1-5 Proficient at 1-9
Osbourn 73 59% 67 54% 54 44%
Table MCPS 5. Manassas City School Division – Distribution of GPA Ranges: Fall 2015
School 0.0 to 0.49 0.5 to 1.4 1.5 to 2.4 2.5 to 3.4 3.5 to 4.0 N
Osbourn 19 15.1% 10 7.9% 39 31.0% 44 34.9% 14 11.1% 126
Division Total 19 15.1% 10 7.9% 39 31.0% 44 34.9% 14 11.1% 126

6
Table MCPS 6. Manassas City School Division – Distribution of Grades Earned in Developmental Courses: Fall 2015
School S R U W
Total # % # % # % # %
Osbourn
ENF 19 76.0% - - 4 16.0% 2 8.0% 25
MTE 3 75.0% - - 1 25.0% - - 4
MTH 1 100.0% - - - - - - 1
MTT 13 22.4% 7 12.1% 36 62.1% 2 3.5% 58
Division Total 36 40.9% 7 8.0% 41 46.6% 4 4.6% 88
S = Satisfactory, R = Reenroll, U = Unsatisfactory, W = Withdraw
Table MCPS 7. Manassas City School Division – Distribution of Grades Earned in
College-Level Courses: Fall 2015
Disc. Passed Unsuccessful
A B C D Sub Total F W Sub Total
ACC 1 50.0% - - - - - - 1 50.0% - - 1 50.0% 1 50.0%
ARC 1 33.3% 1 33.3% - - 1 33.3% 3 100.0% - - - - - -
ART 1 10.0% 1 10.0% 3 30.0% 1 10.0% 6 60.0% 3 30.0% 1 10.0% 4 40.0%
AUT 2 100.0% - - - - - - 2 100.0% - - - - - -
BIO 3 16.7% 6 33.3% 1 5.6% 3 16.7% 13 72.2% 4 22.2% 1 5.6% 5 27.8%
BUS 1 12.5% 3 37.5% 1 12.5% 1 12.5% 6 75.0% - - 2 25.0% 2 25.0%
CHM 1 20.0% 3 60.0% - - - - 4 80.0% - - 1 20.0% 1 20.0%
CSC - - 5 62.5% 2 25.0% - - 7 87.5% - - 1 12.5% 1 12.5%
CST 10 40.0% 9 36.0% 3 12.0% - - 22 88.0% 3 12.0% - - 3 12.0%
ECO - - 4 40.0% 2 20.0% 2 20.0% 8 80.0% 2 20.0% - - 2 20.0%
EGR 1 100.0% - - - - - - 1 100.0% - - - - - -
ENG 12 12.8% 36 38.3% 18 19.2% 5 5.3% 71 75.5% 17 18.1% 6 6.4% 23 24.5%
FRE - - 1 50.0% - - 1 50.0% 2 100.0% - - - - - -
HIS 11 22.9% 11 22.9% 15 31.3% 3 6.3% 40 83.3% 6 12.5% 2 4.2% 8 16.7%
IDS - - - - 1 100.0% - - 1 100.0% - - - - - -
ITE 1 10.0% 1 10.0% 2 20.0% 1 10.0% 5 50.0% 4 40.0% 1 10.0% 5 50.0%
ITN 1 100.0% - - - - - - 1 100.0% - - - - - -
ITP 1 100.0% - - - - - - 1 100.0% - - - - - -
MTH 13 26.0% 8 16.0% 13 26.0% 5 10.0% 39 78.0% 8 16.0% 3 6.0% 11 22.0%
MUS 1 33.3% 1 33.3% - - - - 2 66.7% 1 33.3% - - 1 33.3%
PED 5 21.7% 5 21.7% 5 21.7% 4 17.4% 19 82.6% 3 13.0% 1 4.4% 4 17.4%
PHI - - - - 1 100.0% - - 1 100.0% - - - - - -
PHY - - 1 50.0% - - 1 50.0% 2 100.0% - - - - - -
PSY 9 45.0% 5 25.0% 3 15.0% - - 17 85.0% 3 15.0% - - 3 15.0%
SDV 25 29.4% 23 27.1% 14 16.5% 6 7.1% 68 80.0% 12 14.1% 5 5.9% 17 20.0%
SOC 1 10.0% 5 50.0% 2 20.0% - - 8 80.0% 1 10.0% 1 10.0% 2 20.0%
SPA 1 16.7% - - 1 16.7% 1 16.7% 3 50.00% 1 16.7% 2 33.3% 3 50.0%
Total 102 22.7% 129 28.7% 87 19.4% 35 7.8% 353 78.6% 68 15.1% 28 6.2% 96 21.4%

7
Table MCPS 8. Manassas City School Division – Curricular Program Classifications: Fall 2015
School Career-Tech Transfer Unclassified Total
Osbourn 16 12.7% 109 86.5% 1 0.8% 126
Division Total 16 12.7% 109 86.5% 1 0.8% 126
Table MCPS 9. Manassas City School Division: Osbourn High School – Curricular Program Selections: Fall 2015
HS = Osbourn
Curriculum Students Percent
Accounting 1 0.8%
Administration of Justice 2 1.6%
Architecture 1 0.8%
Automotive 1 0.8%
Business Administration 15 11.9%
Career Studies 1 0.8%
Computer Science 7 5.6%
Early Childhood Development 1 0.8%
Engineering 11 8.7%
Fine Arts 6 4.8%
General Engineering Technology 3 2.4%
General Studies 17 13.5%
Information Technology 5 4.0%
Interior Design 1 0.8%
Liberal Arts 13 10.3%
Management 2 1.6%
Marketing 1 0.8%
Music 2 1.6%
Photography 1 0.8%
Science 14 11.1%
Social Sciences 20 15.9%
Unclassified 1 0.8%
HS Total 126 100.0%
Table MCPS 10. Manassas City School Division – Number of Graduates by High School:
2010-11 to 2014-15
School 2010-11 2011-12 2012-13 2013-14 2014-15 Total
Osbourn 431 445 485 467 451 2,279
Division Total 431 445 485 467 451 2,279

8
Table MCPS 11. Manassas City School Division – Entering Fall Number of Students Who Were Dual Enrolled in High School: Five-Year Aggregation Fall 2011 through Fall 2015
School Formerly Dual
Enrolled Not Formerly Dual Enrolled
Total
Osbourn 51 565 616
Division Total 51 565 616
Table MCPS 12. Manassas City School Division – English VPT Placement Results for Test Participants Only: Fall 2013 through Fall 20151
School English
ENF 1 ENF 2 ENF 3 College Ready
Osbourn 3 1% 21 6% 56 17% 259 76%
Table MCPS 13. Manassas City School Division – Math VPT Placement Results for Test Participants Only: Fall 2012 through Fall 20151
School Math
Proficient at 1-3 Proficient at 1-5 Proficient at 1-9
Osbourn 293 61% 274 57% 205 43%
Table MCPS 14. Manassas City School Division – Distribution of Fall Term GPA Ranges:
Five-Year Aggregation Fall 2011 through Fall 2015
School 0.0 to 0.49 0.5 to 1.4 1.5 to 2.4 2.5 to 3.4 3.5 to 4.0 N
Osbourn 107 17.4% 53 8.6% 148 24.0% 211 34.3% 97 15.7% 616
Division Total 107 17.4% 53 8.6% 148 24.0% 211 34.3% 97 15.7% 616
Table MCPS 15. Manassas City School Division – Distribution of Grades Earned in Developmental Courses: Five-Year Aggregation Fall 2011 through Fall 2015
School S R U W
Total # % # % # % # %
Osbourn
ENF 55 69.6% 4 5.1% 11 13.9% 9 11.4% 79
ENG 108 76.6% 15 10.6% 14 9.9% 4 2.8% 141
MTE 4 66.7% - - 2 33.3% - - 6
MTH 28 52.8% 5 9.4% 16 30.2% 4 7.6% 53
MTT 55 26.8% 37 18.1% 101 49.3% 12 5.9% 205
BSK - - 1 25.0% 3 75.0% - - 4
Division Total 250 51.2% 62 12.7% 147 30.1% 29 5.9% 488
S = Satisfactory, R = Reenroll, U = Unsatisfactory, W = Withdraw
1Due to recent changes to placement testing, these tables display less than five-year aggregates. VPT English
aggregate results are for Fall 2013 through Fall 2015, while VPT math aggregate results are for Fall 2012 through Fall 2015.
9
Table MCPS 16. Manassas City School Division – Distribution of Grades Earned in College-Level Courses: Five-Year Aggregation Fall 2011 through Fall 2015
Disc. Passed Unsuccessful
A B C D Sub Total F W Sub Total
ACC 1 25.0% - - - - - - 1 25.0% 1 25.0% 2 50.0% 3 75.0%
ADJ 3 17.7% 6 35.3% 5 29.4% 1 5.9% 15 88.2% 2 11.8% - - 2 11.8%
ARA 1 100.0% - - - - - - 1 100.0% - - - - - -
ARC 1 33.3% 1 33.3% - - 1 33.3% 3 100.0% - - - - - -
ART 14 35.0% 5 12.5% 9 22.5% 2 5.0% 30 75.0% 8 20.0% 2 5.0% 10 25.0%
ASL - - - - 1 100.0% - - 1 100.0% - - - - - -
AUT 3 25.0% 4 33.3% 2 16.7% - - 9 75.0% 3 25.0% - - 3 25.0%
BIO 18 18.2% 23 23.2% 17 17.2% 12 12.1% 70 70.7% 18 18.2% 11 11.1% 29 29.3%
BUS 2 9.1% 10 45.5% 4 18.2% 2 9.1% 18 81.8% 1 4.6% 3 13.6% 4 18.2%
CHM 2 12.5% 5 31.3% 5 31.3% 1 6.3% 13 81.3% 2 12.5% 1 6.3% 3 18.8%
CSC 6 13.3% 17 37.8% 9 20.0% 1 2.2% 33 73.3% 7 15.6% 5 11.1% 12 26.7%
CST 61 38.1% 47 29.4% 24 15.0% 7 4.4% 139 86.9% 18 11.3% 3 1.9% 21 13.1%
ECO 2 6.9% 10 34.5% 8 27.6% 4 13.8% 24 82.8% 3 10.3% 2 6.9% 5 17.2%
EGR 1 25.0% 3 75.0% - - - - 4 100.0% - - - - - -
ENG 76 18.9% 141 35.0% 70 17.4% 28 7.0% 315 78.2% 61 15.1% 27 6.7% 88 21.8%
ENV - - 1 50.0% - - - - 1 50.0% 1 50.0% - - 1 50.0%
FRE - - 1 25.0% 2 50.0% 1 25.0% 4 100.0% - - - - - -
HIS 33 16.8% 52 26.5% 49 25.0% 20 10.2% 154 78.6% 29 14.8% 13 6.6% 42 21.4%
HLT 2 50.0% - - 1 25.0% - - 3 75.0% 1 25.0% - - 1 25.0%
HRI - - 1 33.3% 2 66.7% - - 3 100.0% - - - - - -
IDS - - - - 1 100.0% - - 1 100.0% - - - - - -
ITA 1 100.0% - - - - - - 1 100.0% - - - - - -
ITD - - 1 100.0% - - - - 1 100.0% - - - - - -
ITE 7 9.9% 16 22.5% 14 19.7% 7 9.9% 44 62.0% 23 32.4% 4 5.6% 27 38.0%
ITN 1 50.0% - - - - - - 1 50.0% - - 1 50.0% 1 50.00%
ITP 1 50.0% - - - - - - 1 50.0% 1 50.0% - - 1 50.0%
JPN - - - - - - - - - - 1 100.0% - - 1 100.0%
KOR 2 66.7% - - 1 33.3% - - 3 100.0% - - - - - -
LAT 1 100.0% - - - - - - 1 100.0% - - - - - -
MTH 51 22.4% 62 27.2% 48 21.1% 21 9.2% 182 79.8% 30 13.2% 16 7.0% 46 20.2%
MUS 13 76.5% 2 11.8% - - - - 15 88.2% 2 11.8% - - 2 11.8%
NAS 4 40.0% 1 10.0% - - 1 10.0% 6 60.0% 2 20.0% 2 20.0% 4 40.0%
PED 25 31.7% 17 21.5% 15 19.0% 6 7.6% 63 79.8% 12 15.2% 4 5.1% 16 20.3%
PHI - - 2 40.0% 1 20.0% 1 20.0% 4 80.0% 1 20.0% - - 1 20.0%
PHT - - 1 100.0% - - - - 1 100.0% - - - - - -
PHY - - 1 20.0% 3 60.0% 1 20.0% 5 100.0% - - - - - -
PLS 1 12.5% 2 25.0% - - 1 12.5% 4 50.0% 3 37.5% 1 12.5% 4 50.0%
PSY 35 34.7% 22 21.8% 19 18.8% 5 5.0% 81 80.2% 17 16.8% 3 3.0% 20 19.8%

10
Table MCPS 16 (Cont’d). Manassas City School Division – Distribution of Grades Earned in College-Level Courses: Five-Year Aggregation Fall 2011 through Fall 2015
Disc. Passed Unsuccessful
A B C D Sub Total F W Sub Total
RAD - - 2 66.7% - - - - 2 66.7% 1 33.3% - - 1 33.3%
REL 1 100.0% - - - - - - 1 100.0% - - - - - -
SDV 180 41.5% 103 23.7% 61 14.1% 25 5.8% 369 85.0% 51 11.8% 14 3.2% 65 15.0%
SOC 12 30.8% 13 33.3% 4 10.3% 2 5.1% 31 79.5% 7 18.0% 1 2.6% 8 20.5%
SPA 7 35.0% 1 5.0% 4 20.0% 1 5.0% 13 65.0% 4 20.0% 3 15.0% 7 35.0%
Total 568 27.1% 573 27.3% 379 18.1% 151 7.2% 1,671 79.6% 310 14.8% 118 5.6% 428 20.4%
Table MCPS 17. Manassas City School Division – Curricular Program Classifications: Five-Year Aggregation Fall 2011 through Fall 2015
School Career-Tech Transfer Unclassified Total
Osbourn 59 9.6% 541 87.8% 16 2.6% 616
Division Total 59 9.6% 541 87.8% 16 2.6% 616
Table MCPS 18. Manassas City School Division: Osbourn High School – Curricular Program Selections: Five-Year Aggregation Fall 2011 through Fall 2015
HS = Osbourn
Curriculum Students Percent
Accounting 1 0.2%
Administration of Justice 9 1.5%
American Sign Language 1 0.2%
Architecture 5 0.8%
Automotive 8 1.3%
Biotechnology 1 0.2%
Business Administration 49 8.0%
Career Studies 5 0.8%
Computer Science 39 6.3%
Culinary Arts 2 0.3%
Early Childhood Development 2 0.3%
Engineering 38 6.2%
Fine Arts 16 2.6%
Fire Science Technology 1 0.2%
General Engineering Technology 5 0.8%
General Studies 166 27.0%
Hospitality 1 0.2%
Information Systems Technology 4 0.7%
Information Technology 18 2.9%
Interior Design 2 0.3%
Liberal Arts 56 9.1%
Management 7 1.1%
Marketing 2 0.3%
Music 10 1.6%
Photography 1 0.2%
Science 55 8.9%
Social Sciences 96 15.6%
Unclassified 16 2.6%
HS Total 616 100.0%

11
Manassas Park City
12
Table MPCS 1. Manassas Park City School Division – Number of Graduates by High School: 2014-15
School Number of Graduates
Manassas Park 179
Division Total 179
Table MPCS 2. Manassas Park City School Division – Number of Students Who Were Dual Enrolled in High School: Fall 2015
School Formerly Dual
Enrolled Not Formerly Dual
Enrolled Total
Manassas Park 10 52 62
Division Total 10 52 62
Table MPCS 3. Manassas Park City School Division – English VPT Placement Results for Test Participants Only: Fall 2015
School English
ENF 1 ENF 2 ENF 3 College Ready
Manassas Park 1 2% 1 2% 7 13% 44 83%
Table MPCS 4. Manassas Park City School Division – Math VPT Placement Results for
Test Participants Only: Fall 2015
School Math
Proficient at 1-3 Proficient at 1-5 Proficient at 1-9
Manassas Park 33 59% 31 55% 25 45%
Table MPCS 5. Manassas Park City School Division – Distribution of GPA Ranges:
Fall 2015
School 0.0 to 0.49 0.5 to 1.4 1.5 to 2.4 2.5 to 3.4 3.5 to 4.0 N
Manassas Park 13 21.0% - - 12 19.4% 27 43.5% 10 16.1% 62
Division Total 13 21.0% - - 12 19.4% 27 43.5% 10 16.1% 62
Table MPCS 6. Manassas Park City School Division – Distribution of Grades Earned in Developmental Courses: Fall 2015
School S R U W
Total # % # % # % # %
Manassas Park
ENF 7 77.8% - - 1 11.1% 1 11.1% 9
MTE 2 100.0% - - - - - - 2
MTT 7 25.0% 8 28.6% 12 42.9% 1 3.6% 28
Division Total 16 41.0% 8 20.5% 13 33.3% 2 5.1% 39
S = Satisfactory, R = Reenroll, U = Unsatisfactory, W = Withdraw

13
Table MPCS 7. Manassas Park City School Division – Distribution of Grades Earned in College-Level Courses: Fall 2015
Disc. Passed Unsuccessful
A B C D Sub Total F W Sub Total
ACC - - - - - - - - - - - - 1 100.0% 1 100.0%
ADJ 3 50.0% 2 33.3% 1 16.7% - - 6 100.0% - - - - - -
ART - - 1 33.3% 1 33.3% - - 2 66.7% 1 33.3% - - 1 33.3%
BIO 3 18.8% 5 31.3% 3 18.8% - - 11 68.8% 4 25.0% 1 6.3% 5 31.3%
BUS 1 25.0% 1 25.0% - - - - 2 50.0% 2 50.0% - - 2 50.0%
CHM - - - - 1 25.0% 2 50.0% 3 75.0% 1 25.0% - - 1 25.0%
CSC 1 16.7% 1 16.7% - - 2 33.3% 4 66.7% 1 16.7% 1 16.7% 2 33.3%
CST 2 18.2% 5 45.5% 1 9.1% - - 8 72.7% 3 27.3% - - 3 27.3%
ECO 2 40.0% - - - - - - 2 40.0% 3 60.0% - - 3 60.0%
EGR - - - - - - - - - - 1 100.0% - - 1 100.0%
ENG 10 21.3% 16 34.0% 6 12.8% 5 10.6% 37 78.7% 9 19.2% 1 2.1% 10 21.3%
GEO - - - - - - - - - - - - 1 100.0% 1 100.0%
HIS 6 33.3% 9 50.0% 2 11.1% 1 5.6% 18 100.0% - - - - - -
HLT 1 100.0% - - - - - - 1 100.0% - - - - - -
ITE 1 14.3% - - 2 28.6% - - 3 42.9% 3 42.9% 1 14.3% 4 57.1%
MTH 4 16.0% 7 28.0% 7 28.0% 2 8.0% 20 80.0% 5 20.0% - - 5 20.0%
PED 3 42.9% 2 28.6% - - 1 14.3% 6 85.7% 1 14.3% - - 1 14.3%
PLS 1 100.0% - - - - - - 1 100.0% - - - - - -
PSY 6 46.2% 4 30.8% 1 7.7% 1 7.7% 12 92.3% 1 7.7% - - 1 7.7%
SDV 14 32.6% 11 25.6% 7 16.3% 2 4.7% 34 79.1% 9 20.9% - - 9 20.9%
SOC 2 100.0% - - - - - - 2 100.0% - - - - - -
SPA - - - - 1 100.0% - - 1 100.0% - - - - - -
WEL - - 1 100.0% - - - - 1 100.0% - - - - - -
Total 60 26.8% 65 29.0% 33 14.7% 16 7.1% 174 77.7% 44 19.6% 6 2.7% 50 22.3%
Table MPCS 8. Manassas Park City School Division – Curricular Program Classifications:
Fall 2015
School Career-Tech Transfer Total
Manassas Park 9 14.5% 53 85.5% 62
Division Total 9 14.5% 53 85.5% 62

14
Table MPCS 9. Manassas Park City School Division: Manassas Park High School – Curricular Program Selections: Fall 2015
HS = Manassas Park
Curriculum Students Percent
Administration of Justice 3 4.8%
Business Administration 5 8.1%
Career Studies 1 1.6%
Computer Science 5 8.1%
Dental Hygiene 1 1.6%
Engineering 3 4.8%
Fine Arts 2 3.2%
General Studies 11 17.7%
Information Technology 4 6.5%
Liberal Arts 9 14.5%
Management 1 1.6%
Marketing 2 3.2%
Science 7 11.3%
Social Sciences 8 12.9%
HS Total 62 100.0%
Table MPCS 10. Manassas Park City School Division – Number of Graduates by High School: 2010-11 to 2014-15
School 2010-11 2011-12 2012-13 2013-14 2014-15 Total
Manassas Park 182 166 174 155 179 856
Division Total 182 166 174 155 179 856
Table MPCS 11. Manassas Park City School Division – Entering Fall Number of Students
Who Were Dual Enrolled in High School: Five-Year Aggregation Fall 2011 through Fall 2015
School Formerly Dual
Enrolled Not Formerly Dual
Enrolled Total
Manassas Park 38 220 258
Division Total 38 220 258

15
Table MPCS 12. Manassas Park City School Division – English VPT Placement Results for Test Participants Only: Fall 2013 through Fall 20152
School English
ENF 1 ENF 2 ENF 3 College Ready
Manassas Park 1 1% 3 2% 16 12% 110 85%
Table MPCS 13. Manassas Park City School Division – Math VPT Placement Results for Test Participants Only: Fall 2012 through Fall 20152
School Math
Proficient at 1-3 Proficient at 1-5 Proficient at 1-9
Manassas Park 126 70% 119 66% 91 51%
Table MPCS 14. Manassas Park City School Division – Distribution of Fall Term GPA Ranges: Five-Year Aggregation Fall 2011 through Fall 2015
School 0.0 to 0.49 0.5 to 1.4 1.5 to 2.4 2.5 to 3.4 3.5 to 4.0 N
Manassas Park 32 12.4% 25 9.7% 67 26.0% 93 36.0% 41 15.9% 258
Division Total 32 12.4% 25 9.7% 67 26.0% 93 36.0% 41 15.9% 258
Table MPCS 15. Manassas Park City School Division – Distribution of Grades Earned in Developmental Courses: Five-Year Aggregation Fall 2011 through Fall 2015
School S R U W
Total # % # % # % # %
Manassas Park
ENF 16 80.0% 2 10.0% 1 5.0% 1 5.0% 20
ENG 34 82.9% 5 12.2% 1 2.4% 1 2.4% 41
MTE 4 66.7% - - 2 33.3% - - 6
MTH 10 37.0% 5 18.5% 11 40.7% 1 3.7% 27
MTT 17 27.9% 14 23.0% 27 44.3% 3 4.9% 61
BSK - - - - 1 100.0% - - 1
Division Total 81 51.9% 26 16.7% 43 27.6% 6 3.9% 156
S = Satisfactory, R = Reenroll, U = Unsatisfactory, W = Withdraw
2Due to recent changes to placement testing, these tables display less than five-year aggregates. VPT English
aggregate results are for Fall 2013 through Fall 2015, while VPT math aggregate results are for Fall 2012 through Fall 2015.

16
Table MPCS 16. Manassas Park City School Division – Distribution of Grades Earned in College-Level Courses: Five-Year Aggregation Fall 2011 through Fall 2015
Disc. Passed Unsuccessful
A B C D Sub Total F W Sub Total
ACC - - 1 25.0% 1 25.0% - - 2 50.0% - - 2 50.0% 2 50.0%
ADJ 4 44.4% 2 22.2% 3 33.3% - - 9 100.0% - - - - - -
ART 4 26.7% 4 26.7% 5 33.3% - - 13 86.7% 2 13.3% - - 2 13.3%
AUT - - 1 16.7% 1 16.7% - - 2 33.3% 4 66.7% - - 4 66.7%
BIO 13 22.0% 14 23.7% 16 27.1% 2 3.4% 45 76.3% 11 18.6% 3 5.1% 14 23.7%
BUS 2 15.4% 4 30.8% 2 15.4% - - 8 61.5% 3 23.1% 2 15.4% 5 38.5%
CHD - - 2 66.7% - - 1 33.3% 3 100.0% - - - - - -
CHM 2 12.5% 3 18.8% 5 31.3% 3 18.8% 13 81.3% 2 12.5% 1 6.3% 3 18.8%
CSC 4 17.4% 6 26.1% - - 4 17.4% 14 60.9% 5 21.7% 4 17.4% 9 39.1%
CST 23 37.1% 22 35.5% 8 12.9% 3 4.8% 56 90.3% 6 9.7% - - 6 9.7%
ECO 2 11.8% 3 17.7% 3 17.7% 2 11.8% 10 58.8% 6 35.3% 1 5.9% 7 41.2%
EDU 1 100.0% - - - - - - 1 100.0% - - - - - -
EGR 1 33.3% 1 33.3% - - - - 2 66.7% 1 33.3% - - 1 33.3%
ENG 31 19.1% 58 35.8% 25 15.4% 14 8.6% 128 79.0% 28 17.3% 6 3.7% 34 21.0%
FIN - - - - - - - - - - - - 1 100.0% 1 100.0%
GEO - - - - - - - - - - - - 2 100.0% 2 100.0%
HIS 20 24.4% 20 24.4% 22 26.8% 13 15.9% 75 91.5% 5 6.1% 2 2.4% 7 8.5%
HLT 1 33.3% 1 33.3% - - 1 33.3% 3 100.0% - - - - - -
ITD - - - - - - 1 100.0% 1 100.0% - - - - - -
ITE 2 7.4% 5 18.5% 7 25.9% 3 11.1% 17 63.0% 9 33.3% 1 3.7% 10 37.0%
JPN - - - - - - - - - - - - 1 100.0% 1 100.0%
KOR - - 1 100.0% - - - - 1 100.0% - - - - - -
MTH 24 22.4% 24 22.4% 25 23.4% 15 14.0% 88 82.2% 13 12.2% 6 5.6% 19 17.8%
MUS 4 66.7% 1 16.7% - - - - 5 83.3% 1 16.7% - - 1 16.7%
NAS 1 100.0% - - - - - - 1 100.0% - - - - - -
PED 14 37.8% 6 16.2% 8 21.6% 1 2.7% 29 78.4% 5 13.5% 3 8.1% 8 21.6%
PHI - - 2 50.0% . . 2 50.0% 4 100.0% - - - - - -
PHY - - - - 1 50.0% - - 1 50.0% 1 50.0% - - 1 50.0%
PLS 1 33.3% - - - - - - 1 33.3% 2 66.7% - - 2 66.7%
PSY 15 29.4% 15 29.4% 8 15.7% 4 7.8% 42 82.4% 6 11.8% 3 5.9% 9 17.7%
RAD 1 100.0% - - - - - - 1 100.0% - - - - - -
REL - - 1 100.0% - - - - 1 100.0% - - - - - -
RUS 1 100.0% - - - - - - 1 100.0% - - - - - -
SDV 74 39.4% 40 21.3% 30 16.0% 7 3.7% 151 80.3% 29 15.4% 8 4.3% 37 19.7%
SOC 6 54.6% 1 9.1% 2 18.2% 1 9.1% 10 90.9% 1 9.1% - - 1 9.1%
SPA 4 40.0% - - 2 20.0% 1 10.0% 7 70.0% 2 20.0% 1 10.0% 3 30.0%
WEL - - 1 100.0% - - - - 1 100.0% - - - - - -
Total 255 27.3% 239 25.6% 174 18.6% 78 8.3% 746 79.8% 142 15.2% 47 5.0% 189 20.2%

17
Table MPCS 17. Manassas Park City School Division – Curricular Program Classifications: Five-Year Aggregation Fall 2011 through Fall 2015
School Career-Tech Transfer Unclassified Total
Manassas Park 22 8.5% 234 90.7% 2 0.8% 258
Division Total 22 8.5% 234 90.7% 2 0.8% 258
Table MPCS 18. Manassas Park City School Division: Manassas Park High School – Curricular Program Selections: Five-Year Aggregation Fall 2011 through Fall 2015
HS = Manassas Park
Curriculum Students Percent
Administration of Justice 3 1.2%
Automotive 2 0.8%
Business Administration 28 10.9%
Career Studies 3 1.2%
Computer Science 16 6.2%
Dental Hygiene 1 0.4%
Early Childhood Development 2 0.8%
Engineering 12 4.7%
Fine Arts 3 1.2%
General Studies 76 29.5%
Information Technology 10 3.9%
Liberal Arts 25 9.7%
Management 4 1.6%
Marketing 3 1.2%
Multimedia Design 1 0.4%
Music 3 1.2%
Music Recording Technology 1 0.4%
Practical Nursing 1 0.4%
Science 38 14.7%
Social Sciences 24 9.3%
Unclassified 2 0.8%
HS Total 258 100.0%

Prince William County

19
Prince William County School Division – Number of Graduates by High School: 2014-15
School Number of Graduates
Battlefield High 578
Brentsville District High 202
C.D. Hylton High 536
Forest Park High 561
Freedom High 464
Gar-Field High 532
Osbourn Park High 609
Patriot High 729
Potomac High 354
Stonewall Jackson High 489
Woodbridge High 656
Division Total 5,710
Prince William County School Division – Number of Students Who Were Dual
Enrolled in High School: Fall 2015
School Formerly Dual
Enrolled Not Formerly Dual
Enrolled Total
Battlefield High 34 126 160
Brentsville District High 2 61 63
C.D. Hylton High 3 140 143
Forest Park High 3 154 157
Freedom High 38 103 141
Gar-Field High 17 150 167
Osbourn Park High 2 159 161
Patriot High 6 172 178
Potomac High 4 88 92
Stonewall Jackson High 0 129 129
Woodbridge High 1 212 213
Division Total 110 1,494 1,604

20
Prince William County School Division – English VPT Placement Results for Test Participants Only: Fall 2015
School
English
Adult Literacy
ENF 1 ENF 2 ENF 3 College Ready
Battlefield High - - 1 1% 3 2% 13 10% 116 87%
Brentsville District High - - - - 2 3% 5 9% 51 88%
C.D. Hylton High - - 3 2% 10 8% 16 12% 100 78%
Forest Park High - - 1 1% 1 1% 16 11% 123 87%
Freedom High - - 2 2% 7 6% 24 19% 93 74%
Gar-Field High - - 3 2% 6 4% 20 13% 127 81%
Osbourn Park High - - 1 1% 9 6% 21 14% 115 79%
Patriot High 1 1% 3 2% 7 5% 21 14% 122 79%
Potomac High - - 1 1% 5 6% 17 19% 65 74%
Stonewall Jackson High - - 1 1% 4 3% 25 21% 90 75%
Woodbridge High - - 1 1% 5 3% 22 12% 155 85%
Prince William County School Division – Math VPT Placement Results for Test Participants Only: Fall 2015
Math
Proficient at 1-3 Proficient at 1-5 Proficient at 1-9
Battlefield High 112 76% 109 74% 90 61%
Brentsville District High 40 65% 38 61% 27 44%
C.D. Hylton High 83 59% 83 59% 76 54%
Forest Park High 107 71% 98 65% 88 58%
Freedom High 83 60% 79 57% 68 49%
Gar-Field High 119 72% 115 70% 92 56%
Osbourn Park High 100 64% 95 61% 79 51%
Patriot High 119 72% 116 70% 95 57%
Potomac High 43 49% 35 40% 29 33%
Stonewall Jackson High 83 66% 79 63% 69 55%
Woodbridge High 129 65% 127 64% 107 54%

21
Prince William County School Division – Distribution of GPA Ranges: Fall 2015
School 0.0 to .49 0.5 to 1.4 1.5 to 2.4 2.5 to 3.4 3.5 to 4.0 N
Battlefield High 19 11.9% 9 5.6% 43 26.9% 55 34.4% 34 21.3% 160
Brentsville District High 11 17.5% 6 9.5% 12 19.0% 24 38.1% 10 15.9% 63
C.D. Hylton High 20 14.0% 16 11.2% 33 23.1% 48 33.6% 26 18.2% 143
Forest Park High 17 10.8% 18 11.5% 25 15.9% 58 36.9% 39 24.8% 157
Freedom High 21 14.9% 25 17.7% 35 24.8% 41 29.1% 19 13.5% 141
Gar-Field High 28 16.8% 22 13.2% 33 19.8% 55 32.9% 29 17.4% 167
Osbourn Park High 15 9.3% 12 7.5% 28 17.4% 60 37.3% 46 28.6% 161
Patriot High 15 8.4% 15 8.4% 37 20.8% 59 33.1% 52 29.2% 178
Potomac High 17 18.5% 16 17.4% 24 26.1% 25 27.2% 10 10.9% 92
Stonewall Jackson High 17 13.2% 9 7.0% 30 23.3% 49 38.0% 24 18.6% 129
Woodbridge High 29 13.6% 26 12.2% 51 23.9% 62 29.1% 45 21.1% 213
Division Total 209 13.0% 174 10.8% 351 21.9% 536 33.4% 334 20.8% 1,604

22
Prince William County School Division – Distribution of Grades Earned in Developmental Courses: Fall 2015
School S R U W
Total # % # % # % # %
Battlefield High
ENF 12 80.0% 1 6.7% 2 13.3% - - 15
MTE 5 83.3% - - 1 16.7% - - 6
MTH 1 100.0% - - - - - - 1
MTT 5 12.8% 1 2.6% 31 79.5% 2 5.1% 39
Brentsville District High
ENF 4 57.1% 2 28.6% - - 1 14.3% 7
MTE 1 50.0% - - 1 50.0% - - 2
MTT 5 20.8% 7 29.2% 11 45.8% 1 4.2% 24
C.D. Hylton High
ENF 17 65.4% 7 26.9% 1 3.9% 1 3.9% 26
MTE - - 1 100.0% - - - - 1
MTT 7 14.3% 5 10.2% 34 69.4% 3 6.1% 49
Forest Park High
ENF 15 83.3% 2 11.1% 1 5.6% - - 18
MTE 3 100.0% - - - - - - 3
MTT 13 32.5% 6 15.0% 18 45.0% 3 7.5% 40
Freedom High
ENF 19 59.4% 10 31.3% 2 6.3% 1 3.1% 32
MTH - - - - 1 100.0% . . 1
MTT 7 15.9% 5 11.4% 31 70.5% 1 2.3% 44
Gar-Field High
ENF 18 64.3% 9 32.1% 1 3.6% - - 28
MTE 4 100.0% - - - - - - 4
MTT 10 23.8% 10 23.8% 21 50.0% 1 2.4% 42
Osbourn Park High
ENF 17 63.0% 5 18.5% 4 14.8% 1 3.7% 27
MTE 2 66.7% - - 1 33.3% - - 3
MTT 20 35.1% 9 15.8% 28 49.1% - - 57
Patriot High
ENF 19 63.3% 4 13.3% 6 20.0% 1 3.3% 30
MTE - - - - 1 100.0% - - 1
MTT 14 28.0% 9 18.0% 26 52.0% 1 2.0% 50
Potomac High
ENF 13 59.1% 5 22.7% 3 13.6% 1 4.6% 22
MTE 5 83.3% - - 1 16.7% - - 6
MTT 8 21.1% 7 18.4% 20 52.6% 3 7.9% 38
Stonewall Jackson High
ENF 19 82.6% - - 1 4.35% 3 13.04% 23
MTE 2 100.0% - - - - - - 2
MTT 13 35.1% 7 18.9% 15 40.5% 2 5.4% 37
Woodbridge High
ENF 19 70.4% 5 18.5% 2 7.4% 1 3.7% 27
MTT 19 30.2% 12 19.1% 27 42.9% 5 7.9% 63
Division Total 316 41.2% 129 16.8% 291 37.9% 32 4.2% 768
S = Satisfactory, R = Reenroll, U = Unsatisfactory, W = Withdraw

23
Prince William County School Division – Distribution of Grades Earned in College-Level Courses: Fall 2015
Disc. Passed Unsuccessful
A B C D Sub Total F W Sub Total
ACC 7 41.2% 2 11.8% 2 11.8% 2 11.8% 13 76.5% 2 11.8% 2 11.8% 4 23.5%
ADJ 19 42.2% 14 31.1% 10 22.2% 2 4.4% 45 100.0% - - - - - -
AIR - - - - - - 1 50.0% 1 50.0% 1 50.0% - - 1 50.0%
ARA 3 60.0% 2 40.0% - - - - 5 100.0% - - - - - -
ART 53 39.3% 35 25.9% 13 9.6% 6 4.4% 107 79.3% 23 17.0% 5 3.7% 28 20.7%
ASL 1 50.0% - - - - 1 50.0% 2 100.0% - - - - - -
AUT 5 31.3% 5 31.3% 1 6.3% - - 11 68.8% 3 18.8% 2 12.5% 5 31.3%
BIO 58 20.1% 79 27.4% 67 23.3% 33 11.5% 237 82.3% 33 11.5% 18 6.3% 51 17.7%
BUS 53 39.9% 34 25.6% 20 15.0% 9 6.8% 116 87.2% 17 12.8% - - 17 12.8%
CHD 1 50.0% - - - - 1 50.0% 2 100.0% - - - - - -
CHM 13 13.4% 22 22.7% 15 15.5% 15 15.5% 65 67.0% 24 24.7% 8 8.3% 32 33.0%
CSC 35 37.6% 24 25.8% 10 10.8% 6 6.5% 75 80.7% 12 12.9% 6 6.5% 18 19.4%
CST 101 33.6% 85 28.2% 45 15.0% 18 6.0% 249 82.7% 42 14.0% 10 3.3% 52 17.3%
ECO 26 36.6% 7 9.9% 16 22.5% 6 8.5% 55 77.5% 10 14.1% 6 8.5% 16 22.5%
EDU 1 100.0% - - - - - - 1 100.0% - - - - - -
EGR 5 55.6% 3 33.3% 1 11.1% - - 9 100.0% - - - - - -
EMS - - - - 2 100.0% - - 2 100.0% - - - - - -
ENG 348 26.6% 385 29.4% 211 16.1% 100 7.6% 1,044 79.8% 217 16.6% 48 3.7% 265 20.2%
ENV 2 25.0% 1 12.5% 2 25.0% 2 25.0% 7 87.5% - - 1 12.5% 1 12.5%
FNS - - - - - - - - - - 1 100.0% - - 1 100.0%
FRE 2 20.0% 3 30.0% 2 20.0% - - 7 70.0% 1 10.0% 2 20.0% 3 30.0%
GEO 3 30.0% 1 10.0% 2 20.0% - - 6 60.0% 3 30.0% 1 10.0% 4 40.0%
GOL 1 20.0% 3 60.0% - - - - 4 80.0% 1 20.0% - - 1 20.0%
HIM - - 1 100.0% - - - - 1 100.0% - - - - - -
HIS 132 26.2% 126 25.1% 113 22.5% 49 9.7% 420 83.5% 76 15.1% 7 1.4% 83 16.5%
HLT 4 13.8% 11 37.9% 5 17.2% 3 10.3% 23 79.3% 3 10.3% 3 10.3% 6 20.7%
HRI 1 25.0% 2 50.0% 1 25.0% - - 4 100.0% - - - - - -
HUM 1 33.3% 2 66.7% - - - - 3 100.0% - - - - - -
ITA - - - - - - - - - - 1 100.0% - - 1 100.0%
ITD 5 83.3% - - 1 16.7% - - 6 100.0% - - - - - -
ITE 50 19.3% 54 20.9% 38 14.7% 37 14.3% 179 69.1% 65 25.1% 15 5.8% 80 30.9%
ITN 3 16.7% 4 22.2% 5 27.8% 1 5.6% 13 72.2% 3 16.7% 2 11.1% 5 27.8%
ITP 2 16.7% 3 25.0% 3 25.0% 3 25.0% 11 91.7% - - 1 8.3% 1 8.3%
JPN - - - - - - - - - - - - 1 100.0% 1 100.0%
LGL - - 1 33.3% - - 1 33.3% 2 66.7% 1 33.33% - - 1 33.3%
MKT 1 100.0% - - - - - - 1 100.0% - - - - - -
MTH 172 22.8% 191 25.3% 150 19.9% 85 11.3% 598 79.2% 108 14.30% 49 6.5% 157 20.8%
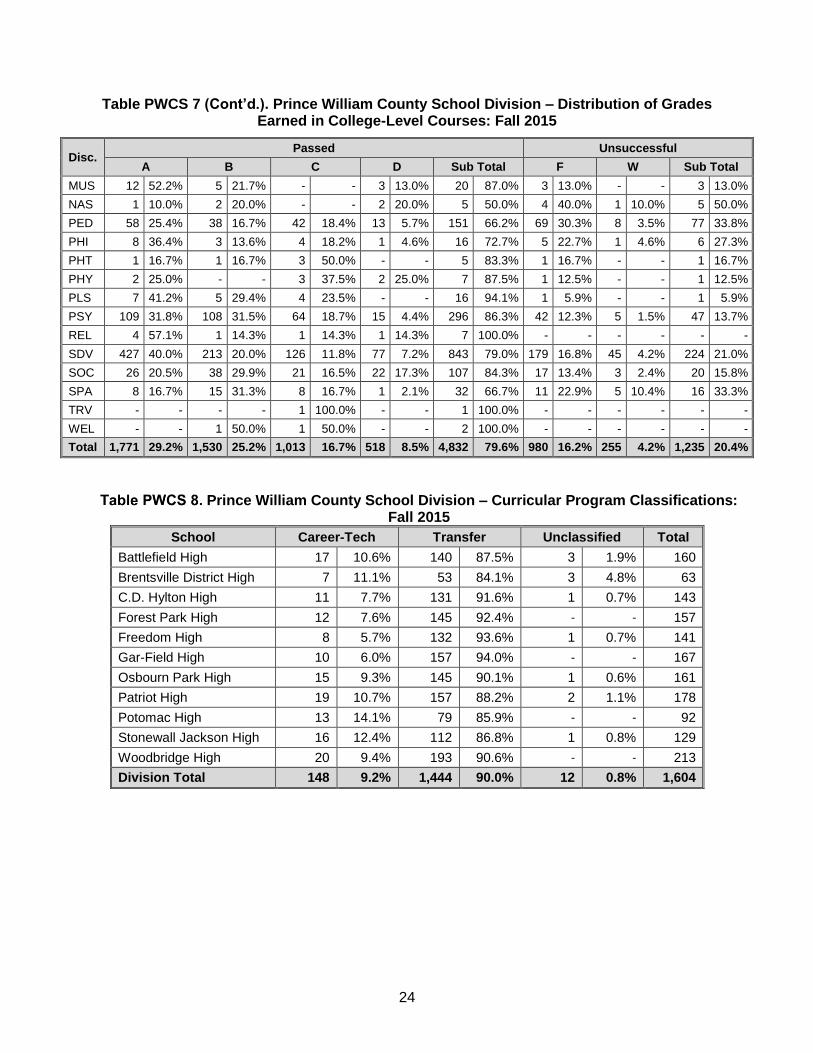
24
Table PWCS 7 (Cont’d.). Prince William County School Division – Distribution of Grades Earned in College-Level Courses: Fall 2015
Disc. Passed Unsuccessful
A B C D Sub Total F W Sub Total
MUS 12 52.2% 5 21.7% - - 3 13.0% 20 87.0% 3 13.0% - - 3 13.0%
NAS 1 10.0% 2 20.0% - - 2 20.0% 5 50.0% 4 40.0% 1 10.0% 5 50.0%
PED 58 25.4% 38 16.7% 42 18.4% 13 5.7% 151 66.2% 69 30.3% 8 3.5% 77 33.8%
PHI 8 36.4% 3 13.6% 4 18.2% 1 4.6% 16 72.7% 5 22.7% 1 4.6% 6 27.3%
PHT 1 16.7% 1 16.7% 3 50.0% - - 5 83.3% 1 16.7% - - 1 16.7%
PHY 2 25.0% - - 3 37.5% 2 25.0% 7 87.5% 1 12.5% - - 1 12.5%
PLS 7 41.2% 5 29.4% 4 23.5% - - 16 94.1% 1 5.9% - - 1 5.9%
PSY 109 31.8% 108 31.5% 64 18.7% 15 4.4% 296 86.3% 42 12.3% 5 1.5% 47 13.7%
REL 4 57.1% 1 14.3% 1 14.3% 1 14.3% 7 100.0% - - - - - -
SDV 427 40.0% 213 20.0% 126 11.8% 77 7.2% 843 79.0% 179 16.8% 45 4.2% 224 21.0%
SOC 26 20.5% 38 29.9% 21 16.5% 22 17.3% 107 84.3% 17 13.4% 3 2.4% 20 15.8%
SPA 8 16.7% 15 31.3% 8 16.7% 1 2.1% 32 66.7% 11 22.9% 5 10.4% 16 33.3%
TRV - - - - 1 100.0% - - 1 100.0% - - - - - -
WEL - - 1 50.0% 1 50.0% - - 2 100.0% - - - - - -
Total 1,771 29.2% 1,530 25.2% 1,013 16.7% 518 8.5% 4,832 79.6% 980 16.2% 255 4.2% 1,235 20.4%
Prince William County School Division – Curricular Program Classifications: Fall 2015
School Career-Tech Transfer Unclassified Total
Battlefield High 17 10.6% 140 87.5% 3 1.9% 160
Brentsville District High 7 11.1% 53 84.1% 3 4.8% 63
C.D. Hylton High 11 7.7% 131 91.6% 1 0.7% 143
Forest Park High 12 7.6% 145 92.4% - - 157
Freedom High 8 5.7% 132 93.6% 1 0.7% 141
Gar-Field High 10 6.0% 157 94.0% - - 167
Osbourn Park High 15 9.3% 145 90.1% 1 0.6% 161
Patriot High 19 10.7% 157 88.2% 2 1.1% 178
Potomac High 13 14.1% 79 85.9% - - 92
Stonewall Jackson High 16 12.4% 112 86.8% 1 0.8% 129
Woodbridge High 20 9.4% 193 90.6% - - 213
Division Total 148 9.2% 1,444 90.0% 12 0.8% 1,604

25
Prince William County School Division: Battlefield High School – Curricular Program Selections: Fall 2015
HS = Battlefield
Curriculum Students Percent
Administration of Justice 2 1.3%
Arts & Sciences 1 0.6%
Automotive 1 0.6%
Business Administration 25 15.6%
Career Studies 2 1.3%
Computer Science 14 8.8%
Cybersecurity 2 1.3%
Engineering 11 6.9%
Fine Arts 4 2.5%
General Engineering Technology 2 1.3%
General Studies 45 28.1%
Health Sciences 1 0.6%
Information Systems Technology 1 0.6%
Information Technology 3 1.9%
Liberal Arts 15 9.4%
Management 4 2.5%
Music 1 0.6%
Paralegal Studies 1 0.6%
Science 12 7.5%
Social Sciences 10 6.3%
Unclassified 3 1.9%
HS Total 160 100.0%
Prince William County School Division: Brentsville District High School – Curricular Program Selections: Fall 2015
HS = Brentsville District
Curriculum Students Percent
Administration of Justice 1 1.6%
Biotechnology 1 1.6%
Business Administration 6 9.5%
Computer Science 2 3.2%
Cybersecurity 1 1.6%
Engineering 1 1.6%
Fine Arts 2 3.2%
General Engineering Technology 1 1.6%
General Studies 21 33.3%
Information Technology 2 3.2%
Interior Design 1 1.6%
Liberal Arts 6 9.5%
Music 1 1.6%
Music Recording Technology 1 1.6%
Science 4 6.4%
Social Sciences 9 14.3%
Unclassified 3 4.8%
HS Total 63 100.0%
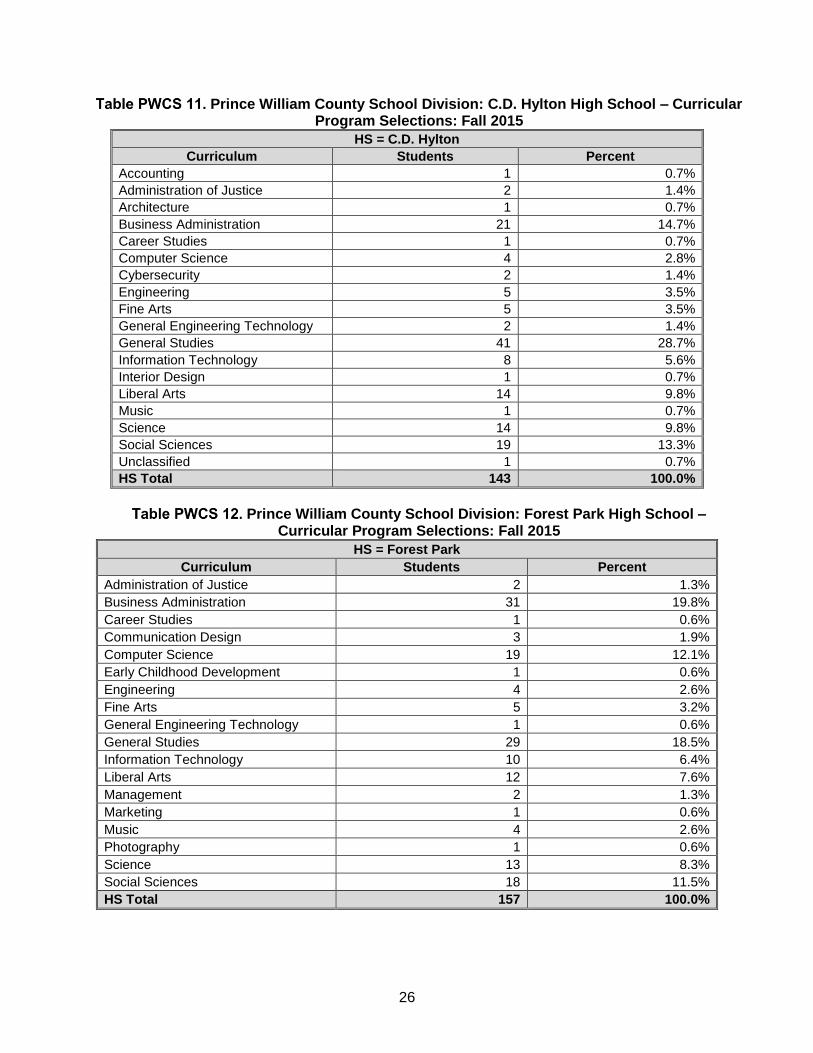
26
Prince William County School Division: C.D. Hylton High School – Curricular Program Selections: Fall 2015
HS = C.D. Hylton
Curriculum Students Percent
Accounting 1 0.7%
Administration of Justice 2 1.4%
Architecture 1 0.7%
Business Administration 21 14.7%
Career Studies 1 0.7%
Computer Science 4 2.8%
Cybersecurity 2 1.4%
Engineering 5 3.5%
Fine Arts 5 3.5%
General Engineering Technology 2 1.4%
General Studies 41 28.7%
Information Technology 8 5.6%
Interior Design 1 0.7%
Liberal Arts 14 9.8%
Music 1 0.7%
Science 14 9.8%
Social Sciences 19 13.3%
Unclassified 1 0.7%
HS Total 143 100.0%
Prince William County School Division: Forest Park High School –
Curricular Program Selections: Fall 2015
HS = Forest Park
Curriculum Students Percent
Administration of Justice 2 1.3%
Business Administration 31 19.8%
Career Studies 1 0.6%
Communication Design 3 1.9%
Computer Science 19 12.1%
Early Childhood Development 1 0.6%
Engineering 4 2.6%
Fine Arts 5 3.2%
General Engineering Technology 1 0.6%
General Studies 29 18.5%
Information Technology 10 6.4%
Liberal Arts 12 7.6%
Management 2 1.3%
Marketing 1 0.6%
Music 4 2.6%
Photography 1 0.6%
Science 13 8.3%
Social Sciences 18 11.5%
HS Total 157 100.0%

27
Prince William County School Division: Freedom High School – Curricular Program Selections: Fall 2015
HS = Freedom
Curriculum Students Percent
Administration of Justice 1 0.7%
Automotive 1 0.7%
Business Administration 18 12.8%
Communication Design 1 0.7%
Computer Science 4 2.8%
Culinary Arts 1 0.7%
Cybersecurity 2 1.4%
Diagnostic Medical Sonography 1 0.7%
Engineering 11 7.8%
Fine Arts 3 2.1%
General Studies 39 27.7%
Information Technology 6 4.3%
Liberal Arts 6 4.3%
Marketing 1 0.7%
Science 22 15.6%
Social Sciences 23 16.3%
Unclassified 1 0.7%
HS Total 141 100.0%
Prince William County School Division: Gar-Field High School – Curricular Program Selections: Fall 2015
HS = Gar-Field
Curriculum Students Percent
Automotive 3 1.8%
Business Administration 18 10.8%
Career Studies 1 0.6%
Computer Science 7 4.2%
Cybersecurity 2 1.2%
Engineering 7 4.2%
Fine Arts 5 3.0%
General Engineering Technology 2 1.2%
General Studies 50 29.9%
Information Technology 7 4.2%
Liberal Arts 6 3.6%
Music 1 0.6%
Photography 1 0.6%
Police Science 1 0.6%
Science 23 13.8%
Social Sciences 33 19.8%
HS Total 167 100.0%

28
Prince William County School Division: Osbourn Park High School – Curricular Program Selections: Fall 2015
HS = Osbourn Park
Curriculum Students Percent
Administration of Justice 2 1.2%
Air Conditioning and Refrigeration 1 0.6%
Architecture 1 0.6%
Automotive 3 1.9%
Business Administration 24 14.9%
Career Studies 3 1.9%
Communication Design 1 0.6%
Computer Science 6 3.7%
Cybersecurity 1 0.6%
Dental Assisting 1 0.6%
Engineering 10 6.2%
Fine Arts 5 3.1%
General Studies 36 22.4%
Information Technology 5 3.1%
Liberal Arts 15 9.3%
Management 1 0.6%
Paralegal Studies 1 0.6%
Science 29 18.0%
Social Sciences 15 9.3%
Unclassified 1 0.6%
HS Total 161 100.0%
Prince William County School Division: Patriot High School – Curricular
Program Selections: Fall 2015
HS = Patriot
Curriculum Students Percent
Accounting 1 0.6%
Administration of Justice 3 1.7%
American Sign Language 1 0.6%
Architecture 1 0.6%
Business Administration 25 14.0%
Career Studies 4 2.3%
Computer Science 11 6.2%
Culinary Arts 2 1.1%
Early Childhood Development 1 0.6%
Engineering 10 5.6%
Fine Arts 4 2.3%
General Studies 38 21.4%
Information Systems Technology 2 1.1%
Information Technology 4 2.3%
Interior Design 1 0.6%
Liberal Arts 20 11.2%
Management 2 1.1%
Music 4 2.3%
Science 16 9.0%
Social Sciences 26 14.6%
Unclassified 2 1.1%
HS Total 178 100.0%

29
Prince William County School Division: Potomac High School – Curricular Program Selections: Fall 2015
HS = Potomac
Curriculum Students Percent
Air Conditioning and Refrigeration 1 1.1%
Business Administration 13 14.1%
Career Studies 2 2.2%
Computer Science 3 3.3%
Cybersecurity 5 5.4%
Education 1 1.1%
Engineering 4 4.4%
Fine Arts 6 6.5%
General Studies 22 23.9%
Hospitality Management 1 1.1%
Information Systems Technology 1 1.1%
Information Technology 3 3.3%
Interior Design 1 1.1%
Liberal Arts 6 6.5%
Management 1 1.1%
Science 8 8.7%
Social Sciences 14 15.2%
HS Total 92 100.0%
Prince William County School Division: Stonewall Jackson High School –
Curricular Program Selections: Fall 2015
HS = Stonewall Jackson
Curriculum Students Percent
Administration of Justice 2 1.6%
Arts & Sciences 1 0.8%
Automotive 4 3.1%
Business Administration 13 10.1%
Career Studies 4 3.1%
Computer Science 10 7.8%
Construction Management Technology 1 0.8%
Cybersecurity 1 0.8%
Early Childhood Development 2 1.6%
Engineering 7 5.4%
Fine Arts 2 1.6%
General Engineering Technology 1 0.8%
General Studies 41 31.8%
Information Technology 4 3.1%
Liberal Arts 6 4.7%
Music 1 0.8%
Science 11 8.5%
Social Sciences 17 13.2%
Unclassified 1 0.8%
HS Total 129 100.0%

30
Prince William County School Division: Woodbridge Senior High School – Curricular Program Selections: Fall 2015
HS = Woodbridge
Curriculum Students Percent
Accounting 2 0.9%
Air Conditioning and Refrigeration 1 0.5%
American Sign Language 1 0.5%
Automotive 4 1.9%
Automotive Technology 1 0.5%
Business Administration 19 8.9%
Computer Science 10 4.7%
Construction Management Technology 1 0.5%
Cybersecurity 3 1.4%
Engineering 9 4.2%
Fine Arts 15 7.0%
General Engineering Technology 2 0.9%
General Studies 58 27.2%
Information Systems Technology 1 0.5%
Information Technology 4 1.9%
Liberal Arts 22 10.3%
Management 1 0.5%
Music 1 0.5%
Photography 1 0.5%
Science 20 9.4%
Social Sciences 37 17.4%
HS Total 213 100.0%
Prince William County School Division – Number of Graduates by High
School: 2010-11 to 2014-15
School 2010-11 2011-12 2012-13 2013-14 2014-15 Total
Battlefield High 706 700 669 604 578 3,257
Brentsville District High 401 381 205 157 202 1,346
C.D. Hylton High 541 539 505 539 536 2,660
Forest Park High 544 497 514 584 561 2,700
Freedom High 371 416 419 433 464 2,103
Gar-Field High 564 644 556 561 532 2,857
Osbourn Park High 605 601 651 675 609 3,141
Patriot High - 1 313 520 729 1,563
Potomac High 407 426 370 388 354 1,945
Stonewall Jackson High 509 539 584 516 489 2,637
Woodbridge High 542 578 598 615 656 2,989
Division Total 5,190 5,322 5,384 5,592 5,710 27,198

31
Prince William County School Division – Entering Fall Number of Students Who Were Dual Enrolled in High School: Five-Year Aggregation Fall 2011 through Fall 2015
School Formerly Dual
Enrolled Not Formerly Dual
Enrolled Total
Battlefield High 79 665 744
Brentsville District High 21 372 393
C.D. Hylton High 7 712 719
Forest Park High 32 616 648
Freedom High 104 486 590
Gar-Field High 41 732 773
Osbourn Park High 21 753 774
Patriot High 16 381 397
Potomac High 6 532 538
Stonewall Jackson High 8 649 657
Woodbridge High 8 857 865
Division Total 343 6,755 7,098
Prince William County School Division – English VPT Placement Results for Test Participants Only: Fall 2013 through Fall 20153
School English
Adult Literacy ENF 1 ENF 2 ENF 3 College Ready
Battlefield High 2 1% 3 1% 22 6% 55 16% 268 77%
Brentsville District High - - 3 2% 6 5% 16 12% 107 81%
C.D. Hylton High - - 5 1% 22 6% 47 12% 319 81%
Forest Park High - - 7 2% 11 3% 50 14% 300 82%
Freedom High 1 0% 3 1% 23 7% 58 17% 253 75%
Gar-Field High - - 6 1% 22 5% 71 17% 318 76%
Osbourn Park High - - 3 1% 19 5% 64 16% 315 79%
Patriot High 1 0% 10 3% 15 4% 45 13% 271 79%
Potomac High - - 4 1% 21 8% 60 22% 189 69%
Stonewall Jackson High 1 0% 3 1% 18 5% 71 19% 277 75%
Woodbridge High - - 5 1% 18 4% 63 13% 397 82%
3Due to recent changes to placement testing, these tables display less than five-year aggregates. VPT English
aggregate results are for Fall 2013 through Fall 2015, while VPT math aggregate results are for Fall 2012 through Fall 2015.

32
Prince William County School Division – Math VPT Placement Results for Test Participants Only: Fall 2012 through Fall 20154
School Math
Proficient at 1-3 Proficient at 1-5 Proficient at 1-9
Battlefield High 415 75% 399 72% 334 60%
Brentsville District High 172 69% 162 65% 125 50%
C.D. Hylton High 357 66% 346 64% 295 55%
Forest Park High 362 72% 339 67% 277 55%
Freedom High 273 58% 253 54% 208 44%
Gar-Field High 377 65% 358 62% 291 51%
Osbourn Park High 391 67% 365 63% 313 54%
Patriot High 275 75% 263 71% 225 61%
Potomac High 209 54% 185 47% 153 39%
Stonewall Jackson High 299 58% 280 55% 220 43%
Woodbridge High 458 69% 441 66% 363 54%
Prince William County School Division – Distribution of Fall Term GPA Ranges: Five-Year Aggregation Fall 2011 through Fall 2015
School 0.0 to .49 0.5 to 1.4 1.5 to 2.4 2.5 to 3.4 3.5 to 4.0 N
Battlefield High 120 16.1% 76 10.2% 157 21.1% 243 32.7% 148 19.9% 744
Brentsville District High 63 16.0% 44 11.2% 72 18.3% 140 35.6% 74 18.8% 393
C.D. Hylton High 107 14.9% 91 12.7% 164 22.8% 219 30.5% 138 19.2% 719
Forest Park High 110 17.0% 74 11.4% 125 19.3% 206 31.8% 133 20.5% 648
Freedom High 107 18.1% 71 12.0% 152 25.8% 177 30.0% 83 14.1% 590
Gar-Field High 124 16.0% 96 12.4% 181 23.4% 233 30.1% 139 18.0% 773
Osbourn Park High 101 13.0% 72 9.3% 139 18.0% 277 35.8% 185 23.9% 774
Patriot High 45 11.3% 38 9.6% 79 19.9% 139 35.0% 96 24.2% 397
Potomac High 92 17.1% 79 14.7% 129 24.0% 172 32.0% 66 12.3% 538
Stonewall Jackson High 99 15.1% 56 8.5% 140 21.3% 241 36.7% 121 18.4% 657
Woodbridge High 143 16.5% 86 9.9% 190 22.0% 288 33.3% 158 18.3% 865
Division Total 1,111 15.7% 783 11.0% 1,528 21.5% 2,335 32.9% 1,341 18.9% 7,098
4Due to recent changes to placement testing, these tables display less than five-year aggregates. VPT English
aggregate results are for Fall 2013 through Fall 2015, while VPT math aggregate results are for Fall 2012 through Fall 2015.
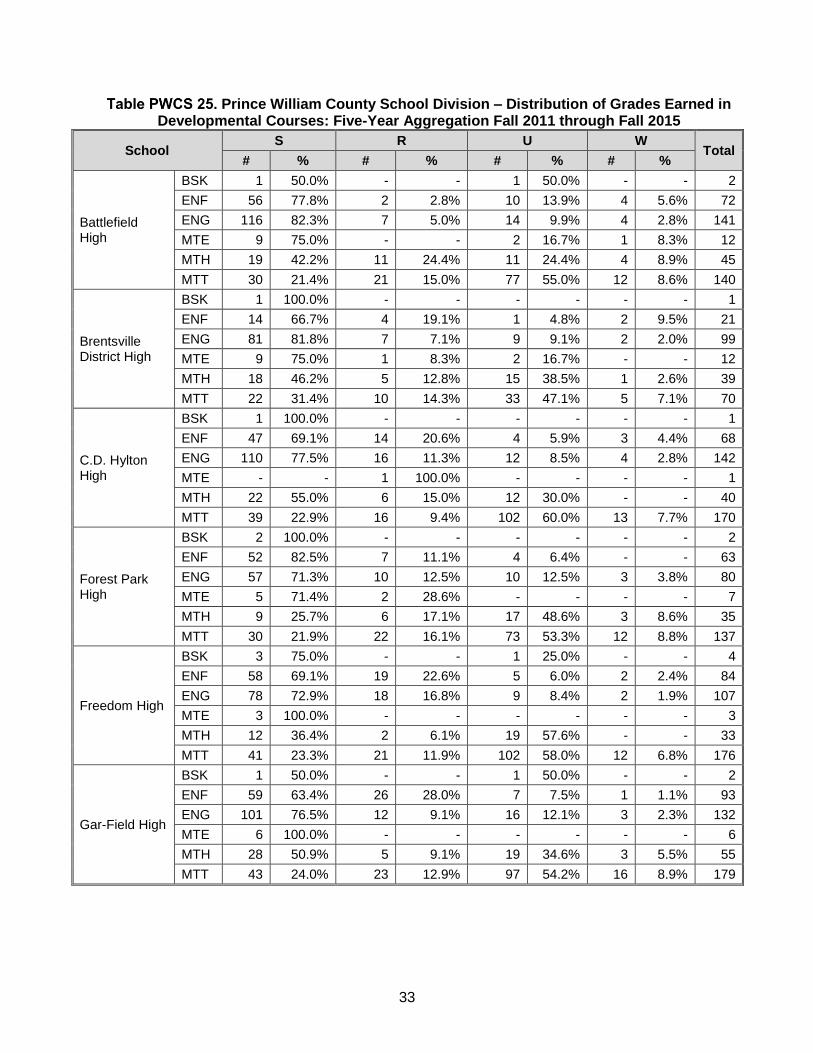
33
Prince William County School Division – Distribution of Grades Earned in Developmental Courses: Five-Year Aggregation Fall 2011 through Fall 2015
School S R U W
Total # % # % # % # %
Battlefield High
BSK 1 50.0% - - 1 50.0% - - 2
ENF 56 77.8% 2 2.8% 10 13.9% 4 5.6% 72
ENG 116 82.3% 7 5.0% 14 9.9% 4 2.8% 141
MTE 9 75.0% - - 2 16.7% 1 8.3% 12
MTH 19 42.2% 11 24.4% 11 24.4% 4 8.9% 45
MTT 30 21.4% 21 15.0% 77 55.0% 12 8.6% 140
Brentsville District High
BSK 1 100.0% - - - - - - 1
ENF 14 66.7% 4 19.1% 1 4.8% 2 9.5% 21
ENG 81 81.8% 7 7.1% 9 9.1% 2 2.0% 99
MTE 9 75.0% 1 8.3% 2 16.7% - - 12
MTH 18 46.2% 5 12.8% 15 38.5% 1 2.6% 39
MTT 22 31.4% 10 14.3% 33 47.1% 5 7.1% 70
C.D. Hylton High
BSK 1 100.0% - - - - - - 1
ENF 47 69.1% 14 20.6% 4 5.9% 3 4.4% 68
ENG 110 77.5% 16 11.3% 12 8.5% 4 2.8% 142
MTE - - 1 100.0% - - - - 1
MTH 22 55.0% 6 15.0% 12 30.0% - - 40
MTT 39 22.9% 16 9.4% 102 60.0% 13 7.7% 170
Forest Park High
BSK 2 100.0% - - - - - - 2
ENF 52 82.5% 7 11.1% 4 6.4% - - 63
ENG 57 71.3% 10 12.5% 10 12.5% 3 3.8% 80
MTE 5 71.4% 2 28.6% - - - - 7
MTH 9 25.7% 6 17.1% 17 48.6% 3 8.6% 35
MTT 30 21.9% 22 16.1% 73 53.3% 12 8.8% 137
Freedom High
BSK 3 75.0% - - 1 25.0% - - 4
ENF 58 69.1% 19 22.6% 5 6.0% 2 2.4% 84
ENG 78 72.9% 18 16.8% 9 8.4% 2 1.9% 107
MTE 3 100.0% - - - - - - 3
MTH 12 36.4% 2 6.1% 19 57.6% - - 33
MTT 41 23.3% 21 11.9% 102 58.0% 12 6.8% 176
Gar-Field High
BSK 1 50.0% - - 1 50.0% - - 2
ENF 59 63.4% 26 28.0% 7 7.5% 1 1.1% 93
ENG 101 76.5% 12 9.1% 16 12.1% 3 2.3% 132
MTE 6 100.0% - - - - - - 6
MTH 28 50.9% 5 9.1% 19 34.6% 3 5.5% 55
MTT 43 24.0% 23 12.9% 97 54.2% 16 8.9% 179

34
Table PWCS 25 (Cont’d.). Prince William County School Division – Distribution of Grades Earned in Developmental Courses: Five-Year Aggregation Fall 2011 through Fall 2015
School S R U W
Total # % # % # % # %
Osbourn Park
BSK 1 50.0% - - 1 50.0% - - 2
ENF 53 70.7% 9 12.0% 11 14.7% 2 2.7% 75
ENG 99 79.8% 12 9.7% 3 2.4% 10 8.1% 124
MTE 7 77.8% - - 2 22.2% - - 9
MTH 13 41.9% 2 6.5% 14 45.2% 2 6.5% 31
MTT 68 35.1% 35 18.0% 83 42.8% 8 4.1% 194
Patriot High
BSK 2 100.0% - - - - - - 2
ENF 37 60.7% 8 13.1% 14 23.0% 2 3.3% 61
MTE 1 25.0% 1 25.0% 2 50.0% - - 4
MTT 27 27.8% 22 22.7% 45 46.4% 3 3.1% 97
Potomac High
BSK 2 100.0% - - - - - - 2
ENF 54 71.1% 14 18.4% 5 6.6% 3 4.0% 76
ENG 108 79.4% 13 9.6% 12 8.8% 3 2.2% 136
MTE 7 77.8% - - 2 22.2% - - 9
MTH 25 52.1% 5 10.4% 16 33.3% 2 4.2% 48
MTT 32 19.8% 31 19.1% 86 53.1% 13 8.0% 162
Stonewall Jackson High
BSK 2 50.0% - - 2 50.0% - - 4
ENF 53 68.8% 5 6.5% 13 16.9% 6 7.8% 77
ENG 79 72.5% 9 8.3% 15 13.8% 6 5.5% 109
MTE 2 50.0% - - 2 50.0% - - 4
MTH 17 39.5% 5 11.6% 16 37.2% 5 11.6% 43
MTT 58 28.4% 45 22.1% 89 43.6% 12 5.9% 204
Woodbridge High
BSK 1 50.0% - - 1 50.0% - - 2
ENF 53 65.4% 20 24.7% 6 7.4% 2 2.5% 81
ENG 87 71.9% 9 7.4% 16 13.2% 9 7.4% 121
MTE 9 81.8% 2 18.2% - - - - 11
MTH 15 36.6% 4 9.8% 19 46.3% 3 7.3% 41
MTT 56 28.7% 27 13.9% 94 48.2% 18 9.2% 195
Division Total 2,151 51.2% 572 13.6% 1,254 29.9% 221 5.3% 4,198
S = Satisfactory, R = Reenroll, U = Unsatisfactory, W = Withdraw

35
Prince William County School Division – Distribution of Grades Earned in College-Level Courses: Five-Year Aggregation Fall 2011 through Fall 2015
Disc. Passed Unsuccessful
A B C D Sub Total F W Sub Total
ACC 31 25.0% 20 16.1% 20 16.1% 9 7.3% 80 64.5% 26 21.0% 18 14.5% 44 35.5%
ADJ 77 32.0% 76 31.5% 52 21.6% 19 7.9% 224 93.0% 12 5.0% 5 2.1% 17 7.1%
AIR - - 6 46.2% 2 15.4% 4 30.8% 12 92.3% 1 7.7% - - 1 7.7%
AMT - - 6 100.0% - - - - 6 100.0% - - - - - -
ARA 11 55.0% 4 20.0% 1 5.0% 1 5.0% 17 85.0% 2 10.0% 1 5.0% 3 15.0%
ARC 2 15.4% 3 23.1% 4 30.8% 3 23.1% 12 92.3% - - 1 7.7% 1 7.7%
ART 175 33.3% 137 26.1% 80 15.2% 41 7.8% 433 82.5% 77 14.7% 15 2.9% 92 17.5%
ASL 4 23.5% 4 23.5% 1 5.9% 4 23.5% 13 76.5% 2 11.8% 2 11.8% 4 23.5%
AST - - 1 12.5% 3 37.5% - - 4 50.0% 4 50.0% - - 4 50.0%
AUB 1 50.0% - - - - - - 1 50.0% - - 1 50.0% 1 50.0%
AUT 25 28.7% 29 33.3% 12 13.8% 5 5.8% 71 81.6% 12 13.8% 4 4.6% 16 18.4%
BIO 227 20.8% 298 27.3% 245 22.5% 117 10.7% 887 81.4% 118 10.8% 85 7.8% 203 18.6%
BUS 173 33.2% 135 25.9% 78 15.0% 36 6.9% 422 81.0% 76 14.6% 23 4.4% 99 19.0%
CAD 4 57.1% 2 28.6% 1 14.3% - - 7 100.0% - - - - - -
CHD 2 9.1% 6 27.3% 5 22.7% 3 13.6% 16 72.7% 6 27.3% - - 6 27.3%
CHI 1 25.0% - - 1 25.0% - - 2 50.0% 2 50.0% - - 2 50.0%
CHM 54 17.1% 82 26.0% 61 19.3% 38 12.0% 235 74.4% 56 17.7% 25 7.9% 81 25.6%
CIV 1 50.0% 1 50.0% - - - - 2 100.0% - - - - - -
CON - - - - - - - - - - 1 50.0% 1 50.0% 2 100.0%
CSC 110 29.0% 88 23.2% 61 16.1% 23 6.1% 282 74.2% 65 17.1% 33 8.7% 98 25.8%
CST 489 34.8% 379 26.9% 213 15.1% 78 5.5% 1,159 82.4% 198 14.1% 50 3.6% 248 17.6%
DIT 1 33.3% - - 1 33.3% - - 2 66.7% - - 1 33.3% 1 33.3%
DMS 5 83.3% 1 16.7% - - - - 6 100.0% - - - - - -
DSL - - 1 33.3% 1 33.3% - - 2 66.7% 1 33.3% - - 1 33.3%
ECO 71 25.4% 47 16.8% 68 24.3% 25 8.9% 211 75.4% 50 17.9% 19 6.8% 69 24.6%
EDU 1 50.0% - - - - - - 1 50.0% - - 1 50.0% 1 50.0%
EGR 26 35.6% 22 30.1% 10 13.7% 3 4.1% 61 83.6% 7 9.6% 5 6.9% 12 16.4%
EMS 4 28.6% 2 14.3% 8 57.1% - - 14 100.0% - - - - - -
ENG 1,469 30.0% 1,362 27.8% 785 16.1% 347 7.1% 3,963 81.0% 747 15.3% 182 3.7% 929 19.0%
ENV 5 17.9% 6 21.4% 6 21.4% 6 21.4% 23 82.1% 4 14.3% 1 3.6% 5 17.9%
FIN 3 42.9% 1 14.3% - - - - 4 57.1% 3 42.9% - - 3 42.9%
FNS - - - - - - - - - - 1 100.0% - - 1 100.0%
FRE 14 24.6% 13 22.8% 8 14.0% 7 12.3% 42 73.7% 10 17.5% 5 8.8% 15 26.3%
FST 3 23.1% 2 15.4% 1 7.7% 1 7.7% 7 53.9% 6 46.2% - - 6 46.2%
GEO 15 31.9% 11 23.4% 8 17.0% 4 8.5% 38 80.9% 6 12.8% 3 6.4% 9 19.2%
GER 4 40.0% 2 20.0% 1 10.0% 1 10.0% 8 80.0% 1 10.0% 1 10.0% 2 20.0%
GOL 4 10.5% 11 29.0% 9 23.7% 5 13.2% 29 76.3% 7 18.4% 2 5.3% 9 23.7%
HIM 1 14.3% 3 42.9% - - - - 4 57.1% 3 42.9% - - 3 42.9%
HIS 580 24.3% 629 26.4% 524 22.0% 234 9.8% 1,967 82.4% 320 13.4% 99 4.2% 419 17.6%
HLT 24 23.1% 26 25.0% 17 16.4% 9 8.7% 76 73.1% 20 19.2% 8 7.7% 28 26.9%
HRI 7 41.2% 2 11.8% 2 11.8% 1 5.9% 12 70.6% 4 23.5% 1 5.9% 5 29.4%
HRT - - 1 14.3% 1 14.3% - - 2 28.6% 4 57.1% 1 14.3% 5 71.4%
HUM 7 23.3% 7 23.3% 5 16.7% 4 13.3% 23 76.7% 4 13.3% 3 10.0% 7 23.3%

36
Table PWCS 26 (Cont’d). Prince William County School Division – Distribution of Grades Earned in College-Level Courses: Five-Year Aggregation Fall 2011 through Fall 2015
Disc. Passed Unsuccessful
A B C D Sub Total F W Sub Total
INT - - - - - - - - - - 1 100.0% - - 1 100.0%
ITA 2 18.2% 1 9.1% 3 27.3% 1 9.1% 7 63.6% 2 18.2% 2 18.2% 4 36.4%
ITD 5 35.7% 4 28.6% 2 14.3% - - 11 78.6% 3 21.4% - - 3 21.4%
ITE 227 18.2% 274 21.9% 195 15.6% 163 13.0% 859 68.7% 326 26.1% 65 5.2% 391 31.3%
ITN 11 19.6% 11 19.6% 12 21.4% 5 8.9% 39 69.6% 9 16.1% 8 14.3% 17 30.4%
ITP 8 24.2% 4 12.1% 8 24.2% 6 18.2% 26 78.8% 4 12.1% 3 9.1% 7 21.2%
JPN 3 23.1% 1 7.7% 3 23.1% - - 7 53.9% 5 38.5% 1 7.7% 6 46.2%
KOR 1 100.0% - - - - - - 1 100.0% - - - - - -
LAT - - - - - - - - - - - - 1 100.0% 1 100.0%
LGL - - 1 33.3% - - 1 33.3% 2 66.7% 1 33.3% - - 1 33.3%
MKT 4 23.5% 2 11.8% 5 29.4% 2 11.8% 13 76.5% 4 23.5% - - 4 23.5%
MSC - - 3 50.0% 3 50.0% - - 6 100.0% - - - - - -
MTH 559 19.3% 703 24.3% 611 21.1% 340 11.7% 2,213 76.4% 463 16.0% 221 7.6% 684 23.6%
MUS 52 49.5% 20 19.1% 8 7.6% 9 8.6% 89 84.8% 9 8.6% 7 6.7% 16 15.2%
NAS 10 11.6% 23 26.7% 16 18.6% 9 10.5% 58 67.4% 18 20.9% 10 11.6% 28 32.6%
NUR 7 63.6% 3 27.3% 1 9.1% - - 11 100.0% - - - - - -
PED 344 34.0% 192 19.0% 140 13.8% 60 5.9% 736 72.7% 223 22.0% 53 5.2% 276 27.3%
PHI 31 34.1% 16 17.6% 21 23.1% 3 3.3% 71 78.0% 17 18.7% 3 3.3% 20 22.0%
PHT 9 24.3% 10 27.0% 4 10.8% 2 5.4% 25 67.6% 8 21.6% 4 10.8% 12 32.4%
PHY 4 10.5% 11 29.0% 9 23.7% 9 23.7% 33 86.8% 5 13.2% - - 5 13.2%
PLS 17 23.9% 16 22.5% 21 29.6% 4 5.6% 58 81.7% 10 14.1% 3 4.2% 13 18.3%
PSY 342 24.6% 409 29.5% 282 20.3% 143 10.3% 1,176 84.7% 168 12.1% 45 3.2% 213 15.3%
RAD - - 1 33.3% - - - - 1 33.3% 1 33.3% 1 33.3% 2 66.7%
REA 1 100.0% - - - - - - 1 100.0% - - - - - -
REL 13 32.5% 10 25.0% 4 10.0% 5 12.5% 32 80.0% 5 12.5% 3 7.5% 8 20.0%
RPK 6 85.7% - - - - - - 6 85.7% - - 1 14.3% 1 14.3%
RUS 1 50.0% 1 50.0% - - - - 2 100.0% - - - - - -
SDV 1,552 37.5% 796 19.2% 540 13.0% 320 7.7% 3,208 77.5% 766 18.5% 167 4.0% 933 22.5%
SOC 144 26.7% 134 24.9% 98 18.2% 67 12.4% 443 82.2% 74 13.7% 22 4.1% 96 17.8%
SPA 36 17.9% 51 25.4% 36 17.9% 15 7.5% 138 68.7% 40 19.9% 23 11.4% 63 31.3%
SSC 1 25.0% 1 25.0% 2 50.0% - - 4 100.0% - - - - - -
TRV - - - - 1 100.0% - - 1 100.0% - - - - - -
WEL 2 25.0% 4 50.0% 1 12.5% 1 12.5% 8 100.0% - - - - - -
Total 7,023 28.2% 6,128 24.6% 4,321 17.3% 2,193 8.8% 19,665 78.9% 4,018 16.1% 1,239 5.0% 5,257 21.1%

37
Prince William County School Division – Curricular Program Classifications: Five-Year Aggregation Fall 2011 through Fall 2015
School Career-Tech Transfer Unclassified Total
Battlefield High 122 16.4% 589 79.2% 33 4.4% 744
Brentsville District High 69 17.6% 294 74.8% 30 7.6% 393
C.D. Hylton High 104 14.5% 599 83.3% 16 2.2% 719
Forest Park High 85 13.1% 547 84.4% 16 2.5% 648
Freedom High 49 8.3% 534 90.5% 7 1.2% 590
Gar-Field High 83 10.7% 681 88.1% 9 1.2% 773
Osbourn Park High 109 14.1% 639 82.6% 26 3.4% 774
Patriot High 60 15.1% 329 82.9% 8 2.0% 397
Potomac High 94 17.5% 439 81.6% 5 0.9% 538
Stonewall Jackson High 103 15.7% 540 82.2% 14 2.1% 657
Woodbridge High 120 13.9% 735 85.0% 10 1.2% 865
Division Total 998 14.1% 5,926 83.5% 174 2.5% 7,098
Prince William County School Division: Battlefield High School – Curricular
Program Selections: Five-Year Aggregation Fall 2011 through Fall 2015
HS = Battlefield
Curriculum Students Percent
Accounting 4 0.5%
Administration of Justice 11 1.5%
Architectural Drafting 1 0.1%
Architecture 7 0.9%
Arts & Sciences 3 0.4%
Automotive 8 1.1%
Biotechnology 1 0.1%
Business Administration 82 11.0%
Career Studies 17 2.3%
Communication Design 3 0.4%
Computer Science 37 5.0%
Cybersecurity 2 0.3%
Early Childhood Development 4 0.5%
Education 1 0.1%
Engineering 41 5.5%
Fine Arts 16 2.2%
Fire Science Technology 2 0.3%
General Engineering Technology 12 1.6%
General Studies 189 25.4%
Health Sciences 2 0.3%
Hospitality Management 1 0.1%
Information Systems Technology 4 0.5%
Information Technology 19 2.6%
Interior Design 2 0.3%
Liberal Arts 81 10.9%
Management 28 3.8%
Marketing 5 0.7%
Multimedia Design 1 0.1%
Music 7 0.9%
Music Recording Technology 2 0.3%
Paralegal Studies 2 0.3%
Photography 1 0.1%
Science 59 7.9%
Social Sciences 56 7.5%
Unclassified 33 4.4%
HS Total 744 100.0%

38
Prince William County School Division: Brentsville District High School – Curricular Program Selections: Five-Year Aggregation Fall 2011 through Fall 2015
HS = Brentsville District
Curriculum Students Percent
Accounting 2 0.5%
Administration of Justice 7 1.8%
Air Conditioning and Refrigeration 1 0.3%
Arts & Sciences 2 0.5%
Automotive 6 1.5%
Biotechnology 2 0.5%
Business Administration 34 8.7%
Career Studies 18 4.6%
Communication Design 2 0.5%
Computer Science 12 3.1%
Cybersecurity 1 0.3%
Early Childhood Development 3 0.8%
Engineering 7 1.8%
Fine Arts 11 2.8%
Fire Science Technology 3 0.8%
General Education 1 0.3%
General Engineering Technology 3 0.8%
General Studies 96 24.4%
Health Sciences 1 0.3%
Information Technology 6 1.5%
Interior Design 3 0.8%
Liberal Arts 40 10.2%
Management 12 3.1%
Marketing 1 0.3%
Music 3 0.8%
Music Recording Technology 1 0.3%
Science 30 7.6%
Social Sciences 55 14.0%
Unclassified 30 7.6%
HS Total 393 100.0%

39
Prince William County School Division: C.D. Hylton High School – Curricular Program Selections: Five-Year Aggregation Fall 2011 through Fall 2015
HS = C.D. Hylton
Curriculum Students Percent
Accounting 6 0.8%
Administration of Justice 16 2.2%
Air Conditioning and Refrigeration 2 0.3%
American Sign Language 1 0.1%
Architecture 2 0.3%
Arts & Sciences 1 0.1%
Automotive 6 0.8%
Biotechnology 1 0.1%
Business Administration 83 11.5%
Career Studies 11 1.5%
Communication Design 2 0.3%
Computer Science 24 3.3%
Cybersecurity 2 0.3%
Diagnostic Medical Sonography 2 0.3%
Early Childhood Development 1 0.1%
Engineering 31 4.3%
Fine Arts 21 2.9%
General Engineering Technology 9 1.3%
General Studies 184 25.6%
Horticulture 1 0.1%
Hospitality Management 3 0.4%
Information Technology 39 5.4%
Interior Design 1 0.1%
Liberal Arts 73 10.2%
Management 24 3.3%
Marketing 2 0.3%
Multimedia Design 2 0.3%
Music 7 1.0%
Nursing 1 0.1%
Paralegal Studies 1 0.1%
Photography 1 0.1%
Science 55 7.7%
Social Sciences 88 12.2%
Unclassified 16 2.2%
HS Total 719 100.0%
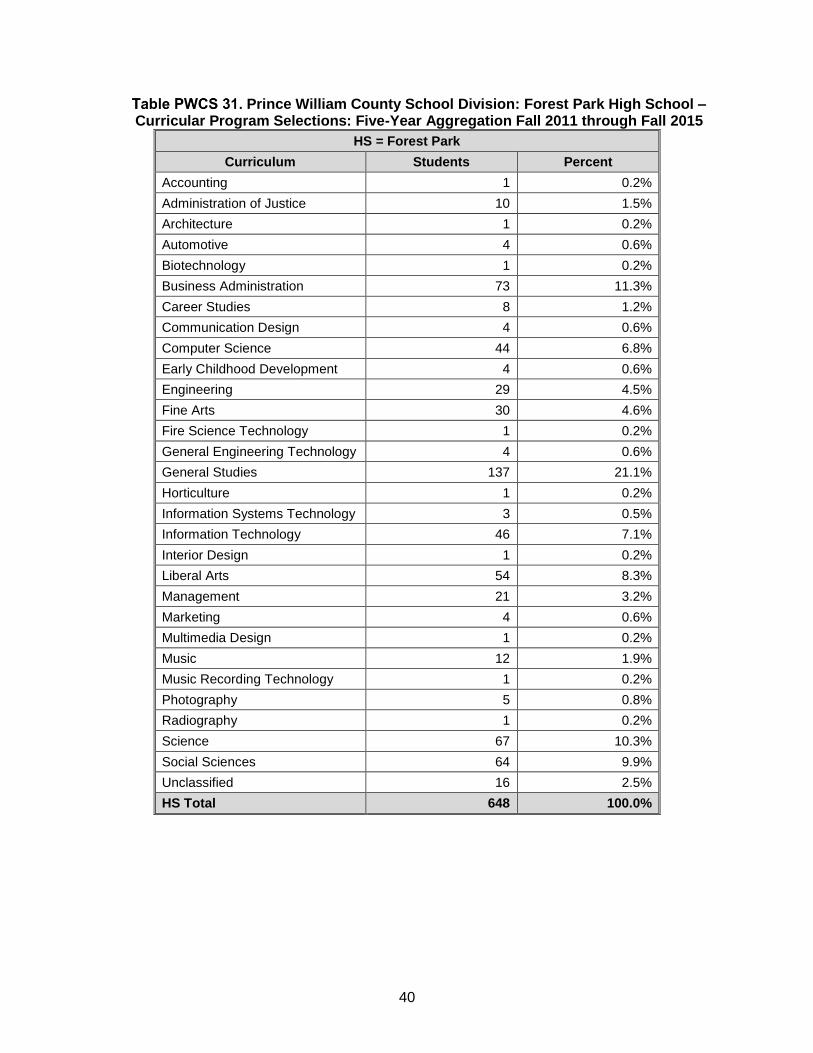
40
Prince William County School Division: Forest Park High School – Curricular Program Selections: Five-Year Aggregation Fall 2011 through Fall 2015
HS = Forest Park
Curriculum Students Percent
Accounting 1 0.2%
Administration of Justice 10 1.5%
Architecture 1 0.2%
Automotive 4 0.6%
Biotechnology 1 0.2%
Business Administration 73 11.3%
Career Studies 8 1.2%
Communication Design 4 0.6%
Computer Science 44 6.8%
Early Childhood Development 4 0.6%
Engineering 29 4.5%
Fine Arts 30 4.6%
Fire Science Technology 1 0.2%
General Engineering Technology 4 0.6%
General Studies 137 21.1%
Horticulture 1 0.2%
Information Systems Technology 3 0.5%
Information Technology 46 7.1%
Interior Design 1 0.2%
Liberal Arts 54 8.3%
Management 21 3.2%
Marketing 4 0.6%
Multimedia Design 1 0.2%
Music 12 1.9%
Music Recording Technology 1 0.2%
Photography 5 0.8%
Radiography 1 0.2%
Science 67 10.3%
Social Sciences 64 9.9%
Unclassified 16 2.5%
HS Total 648 100.0%

41
Prince William County School Division: Freedom High School – Curricular Program Selections: Five-Year Aggregation Fall 2011 through Fall 2015
HS = Freedom
Curriculum Students Percent
Accounting 1 0.2%
Administration of Justice 9 1.5%
Air Conditioning and Refrigeration 3 0.5%
Architecture 3 0.5%
Automotive 6 1.0%
Biotechnology 1 0.2%
Business Administration 56 9.5%
Career Studies 8 1.4%
Communication Design 3 0.5%
Computer Science 31 5.3%
Culinary Arts 3 0.5%
Cybersecurity 2 0.3%
Diagnostic Medical Sonography 1 0.2%
Early Childhood Development 1 0.2%
Emergency Medical Services 1 0.2%
Engineering 46 7.8%
Fine Arts 14 2.4%
General Engineering Technology 1 0.2%
General Studies 159 27.0%
Information Technology 20 3.4%
Interior Design 1 0.2%
Liberal Arts 42 7.1%
Management 2 0.3%
Marketing 1 0.2%
Music 3 0.5%
Photography 1 0.2%
Science 91 15.4%
Social Sciences 73 12.4%
Unclassified 7 1.2%
HS Total 590 100.0%
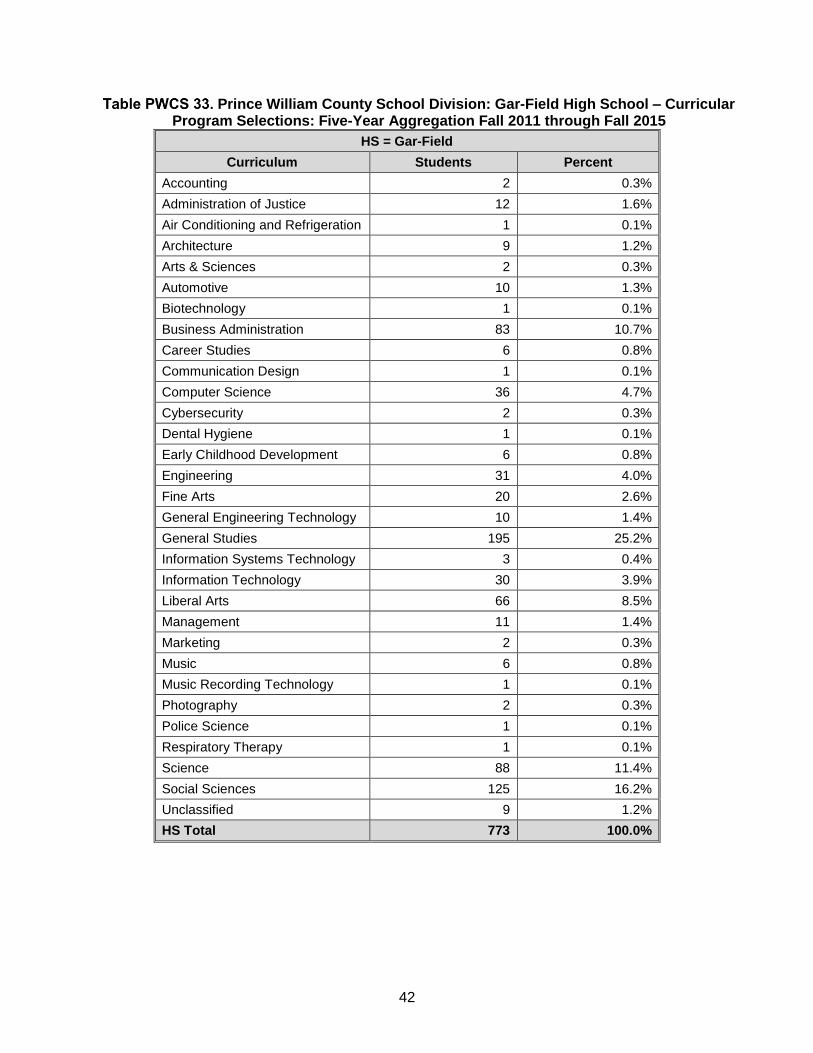
42
Prince William County School Division: Gar-Field High School – Curricular Program Selections: Five-Year Aggregation Fall 2011 through Fall 2015
HS = Gar-Field
Curriculum Students Percent
Accounting 2 0.3%
Administration of Justice 12 1.6%
Air Conditioning and Refrigeration 1 0.1%
Architecture 9 1.2%
Arts & Sciences 2 0.3%
Automotive 10 1.3%
Biotechnology 1 0.1%
Business Administration 83 10.7%
Career Studies 6 0.8%
Communication Design 1 0.1%
Computer Science 36 4.7%
Cybersecurity 2 0.3%
Dental Hygiene 1 0.1%
Early Childhood Development 6 0.8%
Engineering 31 4.0%
Fine Arts 20 2.6%
General Engineering Technology 10 1.4%
General Studies 195 25.2%
Information Systems Technology 3 0.4%
Information Technology 30 3.9%
Liberal Arts 66 8.5%
Management 11 1.4%
Marketing 2 0.3%
Music 6 0.8%
Music Recording Technology 1 0.1%
Photography 2 0.3%
Police Science 1 0.1%
Respiratory Therapy 1 0.1%
Science 88 11.4%
Social Sciences 125 16.2%
Unclassified 9 1.2%
HS Total 773 100.0%
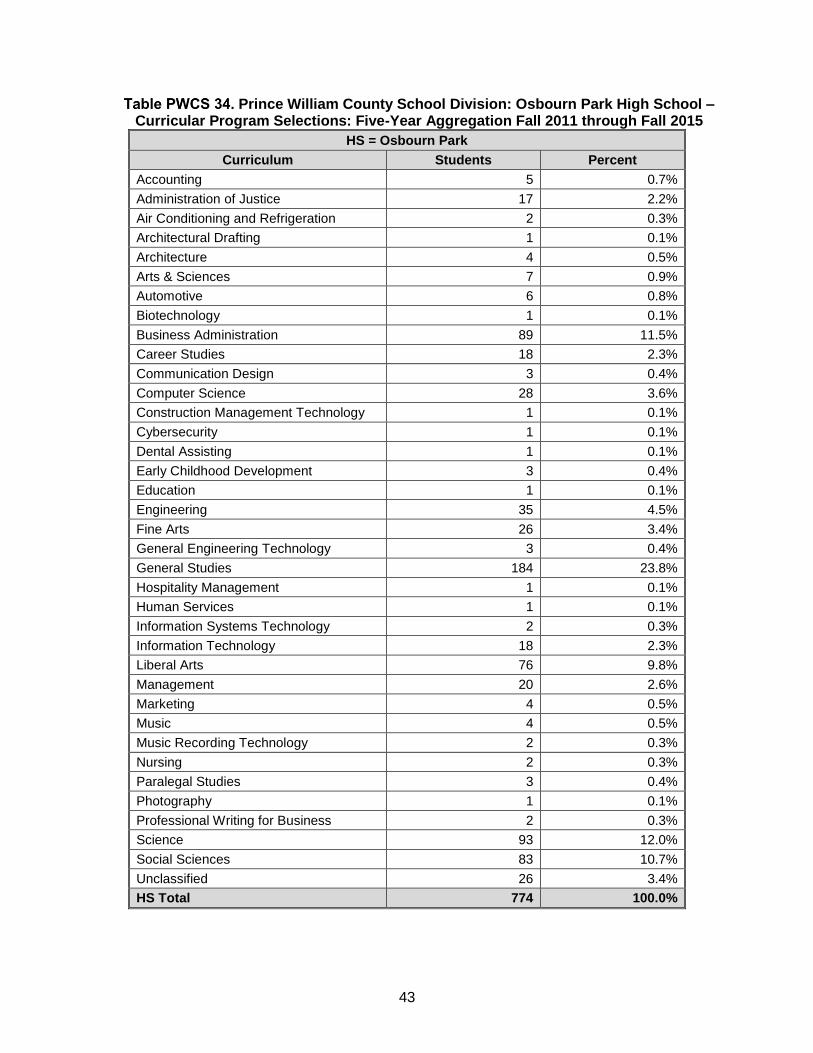
43
Prince William County School Division: Osbourn Park High School – Curricular Program Selections: Five-Year Aggregation Fall 2011 through Fall 2015
HS = Osbourn Park
Curriculum Students Percent
Accounting 5 0.7%
Administration of Justice 17 2.2%
Air Conditioning and Refrigeration 2 0.3%
Architectural Drafting 1 0.1%
Architecture 4 0.5%
Arts & Sciences 7 0.9%
Automotive 6 0.8%
Biotechnology 1 0.1%
Business Administration 89 11.5%
Career Studies 18 2.3%
Communication Design 3 0.4%
Computer Science 28 3.6%
Construction Management Technology 1 0.1%
Cybersecurity 1 0.1%
Dental Assisting 1 0.1%
Early Childhood Development 3 0.4%
Education 1 0.1%
Engineering 35 4.5%
Fine Arts 26 3.4%
General Engineering Technology 3 0.4%
General Studies 184 23.8%
Hospitality Management 1 0.1%
Human Services 1 0.1%
Information Systems Technology 2 0.3%
Information Technology 18 2.3%
Liberal Arts 76 9.8%
Management 20 2.6%
Marketing 4 0.5%
Music 4 0.5%
Music Recording Technology 2 0.3%
Nursing 2 0.3%
Paralegal Studies 3 0.4%
Photography 1 0.1%
Professional Writing for Business 2 0.3%
Science 93 12.0%
Social Sciences 83 10.7%
Unclassified 26 3.4%
HS Total 774 100.0%

44
Prince William County School Division: Patriot High School – Curricular Program Selections: Five-Year Aggregation Fall 2011 through Fall 2015
HS = Patriot
Curriculum Students Percent
Accounting 2 0.5%
Administration of Justice 8 2.0%
American Sign Language 1 0.3%
Architecture 2 0.5%
Automotive 2 0.5%
Biotechnology 2 0.5%
Business Administration 50 12.6%
Career Studies 11 2.8%
Communication Design 1 0.3%
Computer Science 18 4.5%
Culinary Arts 3 0.8%
Dental Hygiene 1 0.3%
Early Childhood Development 1 0.3%
Engineering 21 5.3%
Fine Arts 10 2.5%
General Engineering Technology 2 0.5%
General Studies 77 19.4%
Health Sciences 1 0.3%
Hospitality Management 2 0.5%
Information Systems Technology 3 0.8%
Information Technology 10 2.5%
Interior Design 1 0.3%
Liberal Arts 44 11.1%
Management 12 3.0%
Marketing 1 0.3%
Music 9 2.3%
Paralegal Studies 1 0.3%
Physical Therapist Assistant 1 0.3%
Science 42 10.6%
Social Sciences 50 12.6%
Unclassified 8 2.0%
HS Total 397 100.0%
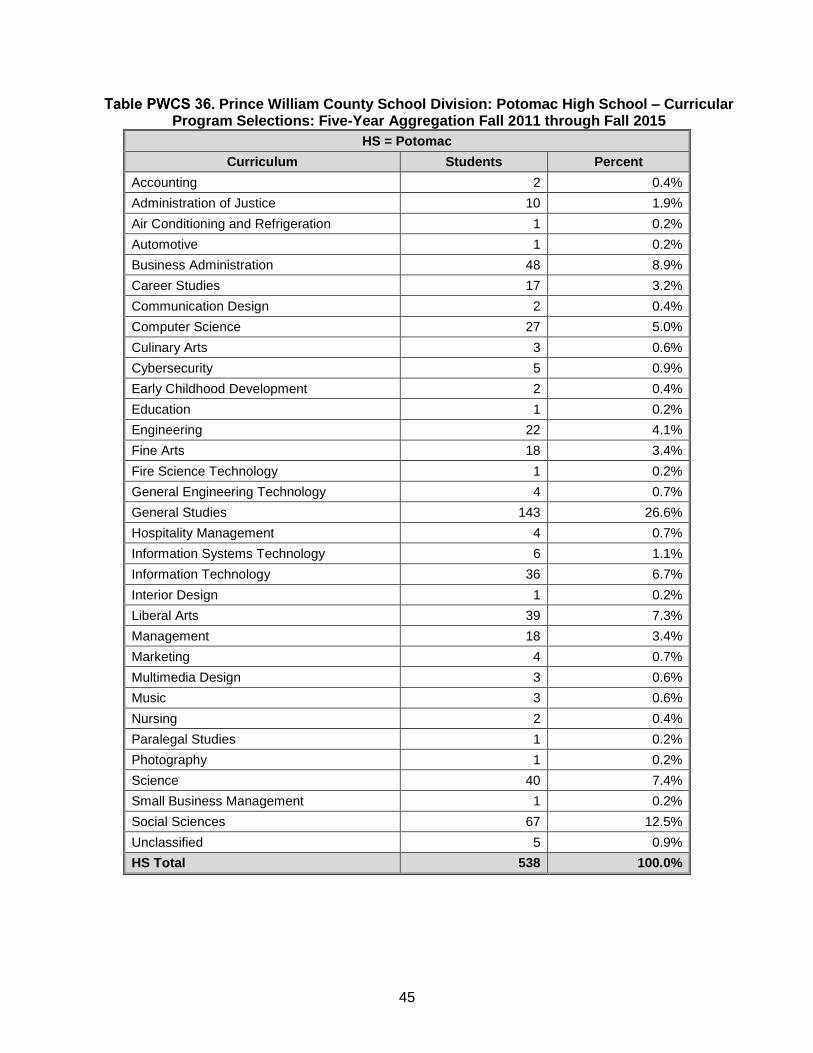
45
Prince William County School Division: Potomac High School – Curricular Program Selections: Five-Year Aggregation Fall 2011 through Fall 2015
HS = Potomac
Curriculum Students Percent
Accounting 2 0.4%
Administration of Justice 10 1.9%
Air Conditioning and Refrigeration 1 0.2%
Automotive 1 0.2%
Business Administration 48 8.9%
Career Studies 17 3.2%
Communication Design 2 0.4%
Computer Science 27 5.0%
Culinary Arts 3 0.6%
Cybersecurity 5 0.9%
Early Childhood Development 2 0.4%
Education 1 0.2%
Engineering 22 4.1%
Fine Arts 18 3.4%
Fire Science Technology 1 0.2%
General Engineering Technology 4 0.7%
General Studies 143 26.6%
Hospitality Management 4 0.7%
Information Systems Technology 6 1.1%
Information Technology 36 6.7%
Interior Design 1 0.2%
Liberal Arts 39 7.3%
Management 18 3.4%
Marketing 4 0.7%
Multimedia Design 3 0.6%
Music 3 0.6%
Nursing 2 0.4%
Paralegal Studies 1 0.2%
Photography 1 0.2%
Science 40 7.4%
Small Business Management 1 0.2%
Social Sciences 67 12.5%
Unclassified 5 0.9%
HS Total 538 100.0%
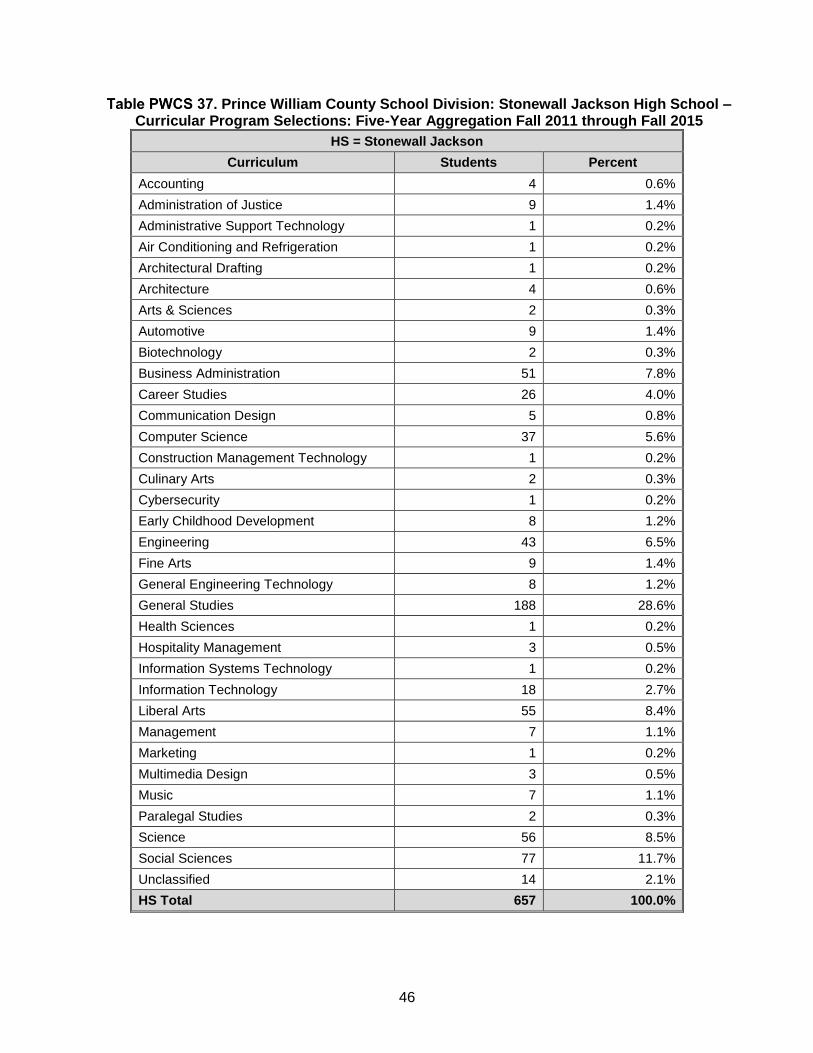
46
Prince William County School Division: Stonewall Jackson High School – Curricular Program Selections: Five-Year Aggregation Fall 2011 through Fall 2015
HS = Stonewall Jackson
Curriculum Students Percent
Accounting 4 0.6%
Administration of Justice 9 1.4%
Administrative Support Technology 1 0.2%
Air Conditioning and Refrigeration 1 0.2%
Architectural Drafting 1 0.2%
Architecture 4 0.6%
Arts & Sciences 2 0.3%
Automotive 9 1.4%
Biotechnology 2 0.3%
Business Administration 51 7.8%
Career Studies 26 4.0%
Communication Design 5 0.8%
Computer Science 37 5.6%
Construction Management Technology 1 0.2%
Culinary Arts 2 0.3%
Cybersecurity 1 0.2%
Early Childhood Development 8 1.2%
Engineering 43 6.5%
Fine Arts 9 1.4%
General Engineering Technology 8 1.2%
General Studies 188 28.6%
Health Sciences 1 0.2%
Hospitality Management 3 0.5%
Information Systems Technology 1 0.2%
Information Technology 18 2.7%
Liberal Arts 55 8.4%
Management 7 1.1%
Marketing 1 0.2%
Multimedia Design 3 0.5%
Music 7 1.1%
Paralegal Studies 2 0.3%
Science 56 8.5%
Social Sciences 77 11.7%
Unclassified 14 2.1%
HS Total 657 100.0%

47
Prince William County School Division: Woodbridge Senior High School – Curricular Program Selections: Five-Year Aggregation Fall 2011 through Fall 2015
HS = Woodbridge
Curriculum Students Percent
Accounting 5 0.6%
Administration of Justice 2 0.2%
Air Conditioning and Refrigeration 1 0.1%
American Sign Language 4 0.5%
Architecture 2 0.2%
Arts & Sciences 5 0.6%
Automotive 13 1.5%
Automotive Technology 1 0.1%
Aviation Maintenance Technology 1 0.1%
Business Administration 73 8.4%
Career Studies 21 2.4%
Communication Design 2 0.2%
Computer Science 30 3.5%
Construction Management Technology 1 0.1%
Culinary Arts 2 0.2%
Cybersecurity 3 0.4%
Early Childhood Development 2 0.2%
Engineering 36 4.2%
Fine Arts 45 5.2%
Fire Science Technology 2 0.2%
General Engineering Technology 11 1.3%
General Studies 214 24.7%
Horticulture 2 0.2%
Information Systems Technology 2 0.2%
Information Technology 28 3.2%
Interior Design 3 0.4%
Liberal Arts 114 13.2%
Management 20 2.3%
Marketing 1 0.1%
Music 9 1.0%
Nursing 4 0.5%
Paralegal Studies 2 0.2%
Photography 1 0.1%
Science 84 9.7%
Social Sciences 108 12.5%
Travel & Tourism 1 0.1%
Unclassified 10 1.2%
HS Total 865 100.0%

NOVA Mission and Strategic Goals
Mission With commitment to the values of access, opportunity, student success, and excellence, the mission of Northern Virginia Community College is to deliver world-class in-person and online post-secondary teaching, learning, and workforce development to ensure our region and the Commonwealth of Virginia have an educated population and globally competitive workforce.
Strategic Goals
I. STUDENT SUCCESS – Northern Virginia Community College will move into the top tier
of community colleges with respect to the college readiness, developmental course completion, retention, graduation, transfer, and career placement of its students.
II. ACCESS – Northern Virginia Community College will increase the number and diversity
of students being served to mirror the population growth of the region.
III. TEACHING AND LEARNING – Northern Virginia Community College will focus on student success by creating an environment of world-class teaching and learning.
IV. EXCELLENCE – Northern Virginia Community College will develop ten focal points of
excellence in its educational programs and services that will be benchmarked to the best in the nation and strategic to building the College's overall reputation for quality.
V. LEADERSHIP – Northern Virginia Community College will serve as a catalyst and a
leader in developing educational and economic opportunities for all Northern Virginians and in maintaining the quality of life and economic competitiveness of the region.
VI. PARTNERSHIPS – Northern Virginia Community College will develop strategic partnerships to create gateways of opportunity and an integrated educational system for Northern Virginians who are pursuing the American Dream.
VII. RESOURCES – Northern Virginia Community College will increase its annual funding by
$100 million and expand its physical facilities by more than one million square feet in new and renovated space. This includes the establishment of two additional campuses at epicenters of the region’s population growth, as well as additional education and training facilities in or near established population centers.
VIII. EMERGENCY PREPAREDNESS AND CONTINUITY OF OPERATIONS – Northern
Virginia Community College will be recognized as a leader among institutions of higher education in Virginia for its development and testing of emergency response and continuity of operation plans.

703–323–3000 | www.nvcc.edu