college-level examination program® validity study for ... · validity study for sample university...
TRANSCRIPT

ACES (ADMITTED CLASS EVALUATION SERVICE™)
College-Level Examination
Program® Validity Study for Sample
University
Data in this report are not representative of any institution. All data are hypothetical and were generated for the sole purpose of creating this sample report.
DATE: 2018-01-26
SUBMISSION ID: EEEE1234

2
COLLEGEBOARD.ORG/ACES

3

4
Table of Contents College-Level Examination Program® Validity Study for Sample University ..................................................................................... 1
Introduction ...................................................................................................................................................................................... 5
Limitations and considerations concerning this information ..................................................................................................... 5
CLEP study design .......................................................................................................................................................................... 6
The comparison groups .............................................................................................................................................................. 6
Rules for forming the comparison groups ................................................................................................................................. 6
COLLEGE TRIG/MATH110: CLEP College Algebra ..................................................................................................................... 8
Section 1: Summary of student performance in MATH110 ...................................................................................................... 8
Section 2: Statistical comparison of student performance in MATH110 ................................................................................. 9
Section 3: Summary of student performance in the CLEP-equivalent course(s) for MATH110 .......................................... 10
Section 4: Characteristics of students in MATH110 ................................................................................................................ 11
Following up on your placement decisions .................................................................................................................................. 13
5
Introduction
The purpose of this College-Level Examination Program (CLEP®) Validity Study is to assist you in evaluating the success of your institution's CLEP placement policies. It provides you with information on how well your current policies for granting CLEP credit for introductory courses are working for each higher-level course you selected to study. To assess whether a particular policy is working as intended, the study compares the performance of students who entered the higher-level course through CLEP credit to the performance of students who entered the course by completing the introductory CLEP-equivalent course(s) at your institution.
CLEP Placement Validity Studies are organized by higher-level course and contain several sections.
CLEP study design specifies the higher-level courses you selected to study and explains how the study uses the
course and policy information you supplied to form the comparison groups for the study.
Course Title/Course Label: CLEP Exam(s)(results appear in up to four sections for each higher-level course in
your study):
♦ Section 1: Summary of student performance provides descriptive information on how well students
with and without CLEP credit for the CLEP-equivalent course(s) performed in the higher-level course.
For each comparison group, this section presents the number of students in the group and the percent
who earned a grade of C- or higher in the course. It also presents the distribution of CLEP Exam scores
for students who entered the higher-level course with CLEP credit.
♦ Section 2: Statistical comparison of student performance in the higher-level course assesses whether
the performance of students who entered the higher-level course with CLEP credit for the introductory
course(s) differs significantly from the performance of students who entered the course without CLEP
credit.
♦ Section 3: Summary of student performance in the CLEP-equivalent course(s) provides descriptive
information on how well students who took the CLEP-equivalent course(s) at your institution performed
in the course(s). For each CLEP-equivalent course, it presents the number of students who completed
the course, the mean and standard deviation of their grades in the course, and the percent who earned a
grade of C- or higher in the course.
♦ Section 4: Summary of student characteristics in the higher-level course presents a descriptive
summary of the gender and racial/ethnic make-up of the comparison groups included in the study if you
supplied that information in your data-file. For each comparison group, the tables display the number of
students in each gender and race/ethnicity category and the mean and standard deviation of their
grades in the higher-level course.
Following up on your placement decisions provides you with resources to consult if you have any questions
about the study.
A supplementary infograph HTML document for this CLEP Validity Study can be downloaded from the ACES website. It contains dynamic versions of the tables and graphs in this study that can be viewed, manipulated, and exported using a browser. Instances in which the dynamic version of a table or graph contains more information than the version appearing in this PDF document are noted in the text.
Limitations and considerations concerning this information
The College Board makes every effort to ensure that the information provided in this report is accurate. Inaccurate findings may be the result of missing or inaccurate data provided by the institution.

6
CLEP study design
When requesting the report, you indicated that you wished to study your placement decisions in relation to CLEP Exam scores for 1 higher-level course(s). You specified that you were interested in examining:
Performance in MATH110 as it relates to scores on the CLEP College Algebra Exam and CLEP credit for
MATH100.
To evaluate the success of your placement policies, the study of each higher-level course compares the performance of students who entered the course through CLEP credit to the performance of students who entered the course by completing the introductory CLEP-equivalent course(s) at your institution. To make the comparisons, each study assigns the individual students in your sample to groups corresponding to their path of entry into the higher-level course. The assignments take into account your institution's policy for granting CLEP credit, a student's course-taking history, and a student's CLEP Exam scores.
The comparison groups
In most cases, a study will assign students to two groups or paths of entry:
Students who earned CLEP credit for the introductory course(s)
Students without CLEP credit who completed the introductory course(s) at your institution
If your policy requires a single introductory course for entry and gives students the option of choosing between two introductory courses to satisfy the requirement, the study will assign students to three groups:
Students who earned CLEP credit for the introductory course
Students without CLEP credit who chose to complete a particular one of the two introductory courses at your
institution
Students without CLEP credit who chose to complete the other one of the two introductory courses at your
institution
If you opted to include a group of students who qualified for entry into the higher-level course through another path, such as dual enrollment or AP® Exam scores, the study will also include that group if it consists of at least 15 students.
Only groups that include at least 15 students will be included in your study.
Rules for forming the comparison groups
The procedure for forming the comparison groups relies on a set of rules to infer a student's path of entry into a higher-level course from the student's course-taking record and CLEP Exam scores, and your institution's policy for granting CLEP credit for the introductory course(s). To be assigned to a group, students must have a valid grade (A-F) in the higher-level course the first term they took the course and a course-taking record that is consistent with their CLEP Exam scores.
For students who entered the higher-level course by completing the introductory course(s), the rules also consider the term(s) in which the students completed the introductory course(s) and the grade(s) they received the last time they took the introductory course(s) at your institution.
In line with these considerations, the procedure assigns students to the group who entered the higher-level course with CLEP credit for the introductory course(s) if they have:
A CLEP Exam score at or above the cut-off score for CLEP credit for the introductory course(s) and below the
cut-off score for CLEP credit for the higher-level course (if a cut off for the higher-level course exists)
No record of taking the introductory CLEP-equivalent course(s) at your institution
The procedure assigns students to the group who entered the higher-level course by completing the introductory course(s) if they have:

7
No CLEP Exam score or a score below the cut-off score for CLEP credit for the introductory course(s)
A valid grade in the introductory course(s) the last time they took the course(s) at your institution
A record of completing the introductory course(s) at least one term before the first term they completed the
higher-level course
When a policy requires a single introductory course and offers students without CLEP credit a choice of taking one of two courses to satisfy that requirement, the procedure assigns students to a group corresponding to the particular course they took if they have:
No CLEP Exam score or a score below the cut-off score for CLEP credit for the introductory course
A record of taking one but not the other introductory course at your institution
A valid grade in the introductory course they chose to take the last time they took the course at your institution
A record of completing that introductory course at least one term before they completed the higher-level course
Students whose course-taking history and CLEP Exam scores do not follow one of the patterns described above are not included in the study of a higher-level course unless you have indicated that they entered the course through another path such as dual enrollment or AP Exam scores.
Notes:
For purposes of this study, CLEP-equivalent courses are defined as introductory courses that students earn credit
for with CLEP Exam scores and that students without qualifying CLEP Exam scores complete to gain entry into a
higher-level course.
Valid course grades are defined as grades that contribute to a student's GPA. Pass/fail and
satisfactory/unsatisfactory grades do not qualify as valid grades nor do withdrawals or incompletes.
Course grades were converted to numeric values according to the grading policy your institution specified during
the submission of the datafile.
The procedure does not consider CLEP parallel courses in the assignment of students to comparison groups. This
means that students who took a course parallel to the CLEP-equivalent course for which they earned CLEP credit,
such as an honors version of the course, will be assigned to the group who entered the higher-level course with
CLEP credit even though they completed an introductory course.
If a student took a CLEP Exam more than once or your placement policy relies on two interchangeable CLEP
Exams to award CLEP credit, the assignments consider the highest score earned by the student on the CLEP
Exam(s).
In general, the larger the size of the groups in your study, the more accurate the results of the study will be and
the more power the statistical tests will have to detect differences in the performance of the groups when a true
difference exists.

8
COLLEGE TRIG/MATH110: CLEP College Algebra
Section 1: Summary of student performance in MATH110
This section presents a descriptive summary of student performance in MATH110 for each group in the study with at least 15 students in your sample. It shows how well students who entered the course with CLEP-credit performed relative to students who entered the course by completing the introductory course(s) at your institution.
For each comparison group included in the study, the table below displays the number of students in the group. If you indicated that you were interested in examining the performance of students who entered the higher-level course through another path, such as dual enrollment or AP Exam scores, this section will also include that group of students if it consists of at least 15 students. In order to make appropriate comparisons, this group should consist of only one type of alternate pathway, such as all dual enrollment credit holders.
Students in MATH110 by their path of entry
Path of Entry Number of Students
CLEP Credit 243
CLEP-equivalent course(s) 882
A way to examine the success of your placement decisions is to look at the percent of students who performed at or above a criterion of success. For purposes of this report, the criterion of success is a final grade of C- or higher in MATH110 the first time students took the course. The bar chart shows the percent of students in each group who performed at or above that criterion of success in MATH110. [The dynamic version of this chart available for download from the ACES website allows you to select any grade between C- and B+ as the criterion of success and view the percent of students in each group who earned a grade at or above the selected criterion.]
Percent of students who received a grade of C- or higher in MATH110 by path of entry into the course
Note:

9
If your study includes a group who entered the higher-level course through another path, such as dual enrollment
or AP Exam scores, the bar chart will refer to that group as "Other."
The next chart in this section displays the CLEP Exam scores of students who received CLEP credit for all CLEP-equivalent courses required for entry into MATH110. [The infograph document available for download from the ACES website includes this chart as well as a table showing the distribution of CLEP Exam scores in the CLEP credit group.]
Graphic display of exam scores in the CLEP credit group
Note:
The CLEP credit group includes students who scored at or above the cut-off score for entering the higher-level
course with CLEP credit and below the cut-off score for CLEP credit for the higher-level course (if a cut off for the
higher-level course exists).
Section 2: Statistical comparison of student performance in MATH110
This section of the report presents the results of a statistical analysis of the performance of students in MATH110. The analysis assesses whether the mean course grade of students who entered MATH110 with CLEP credit differs significantly from the mean course grade(s) of students who entered the course without CLEP credit. The analysis may provide you with valuable information on your policy for granting CLEP credit:
If the mean course grade of CLEP-credit holders is not statistically different (p > 0.05) from the mean course
grade(s) of the other group(s), this indicates that the CLEP credit-holding students are performing as well as
students without credit who took the introductory course(s) at your institution. This result supports the use of
your current CLEP credit and placement policy at your institution.
If the mean course grade of CLEP-credit holders is statistically lower than the mean course grade(s) of the other
group(s), the result would suggest that CLEP credit-holders are not performing as well as their classmates who
took the introductory course(s) at your institution and your cut point for awarding CLEP credit may be too low.
If the mean course grade of CLEP-credit holders is statistically higher than the mean course grade(s) of the other
group(s), the result would suggest your CLEP policy is awarding credit to students who are significantly better
prepared for the next course than their classmates who took the introductory course(s) at your institution. If your

10
cut score is above the ACE-recommended credit-granting score of 50, this result suggests your cut score may be
too high.
To perform the comparisons, the statistical analysis relies on two methods commonly used to test for significant differences between means, a t-test and an F-test from an analysis of variance (ANOVA). A t-test is designed to compare the means of two groups. An ANOVA is routinely used to compare the means of three or more groups.
In the context of this study, a statistically significant result from a t-test will indicate that the difference between the mean course grades of the two groups is larger than expected by chance. A statistically significant result from an ANOVA (as the method is applied in this report) will indicate that the differences among the mean course grades of the groups are larger than expected by chance.
If this study includes two paths of entry into the higher-level course, this section will report the finding from the t-test. If this study includes more than two paths, this section will report the finding from the F-test. If the F-test indicates that the differences among the mean course grades are statistically significant, then this section will also report findings from t-tests that look for significant mean course grade differences between pairs of the comparison groups.
The table below displays the number of students in each comparison group included in this study, the mean and standard deviation (SD) of their final course grades in MATH110, and the results of the statistical test. The statistical test indicates that the mean course grades of these groups are significantly different.
Performance of the comparison groups in MATH110
Path of Entry Number of Students Mean Course Grade (SD)
Test of Statistical Difference
in Means
CLEP Credit 243 2.47 (1.19) t(389.68) = 3.84, p = 0.00,
statistically significant
CLEP-equivalent course(s) 882 2.14 (1.21)
Note:
All tests relied on a significance level of 0.05 for the means to be identified as statistically different.
The American Council on Education (ACE) recommends a CLEP Exam score of at least 50 for granting college
credit. A CLEP score of 50 is a scaled score equivalent to earning a C in the CLEP-equivalent course.
Section 3: Summary of student performance in the CLEP-equivalent course(s) for MATH110
This section of the report provides you with information on how well students who took the CLEP-equivalent course(s) at your institution to enter MATH110 performed in the introductory course(s). For each CLEP-equivalent course associated with entry into MATH110, the table displays the number of students who took the CLEP-equivalent course and the mean and standard deviation (SD) of their final grades in the course the last time they completed the course at your institution. The graph displays the percent of students in each CLEP-equivalent course who earned a grade of C- or higher in that course. [The dynamic version of this chart available for download from the ACES website allows you to select any grade between C- and B+ as the criterion of success and view the percent of students in each group who earned a grade at or above the selected criterion.]

11
Summary of student performance in the CLEP-equivalent courses
CLEP-equivalent Course Number of Students Mean Course Grade (SD)
MATH100 882 3.15 (0.72)
Percent of students who received a grade of C- or higher in each CLEP-equivalent course
Section 4: Characteristics of students in MATH110
Using the information derived from the sample of students included in this study, you will want to generalize to a larger population of students. It is important that the characteristics of the sample of students included in this study are similar to the characteristics of the students you wish to generalize to in ways that are and are not measured by CLEP Exam scores. Two examples of such characteristics are gender and race/ethnicity.
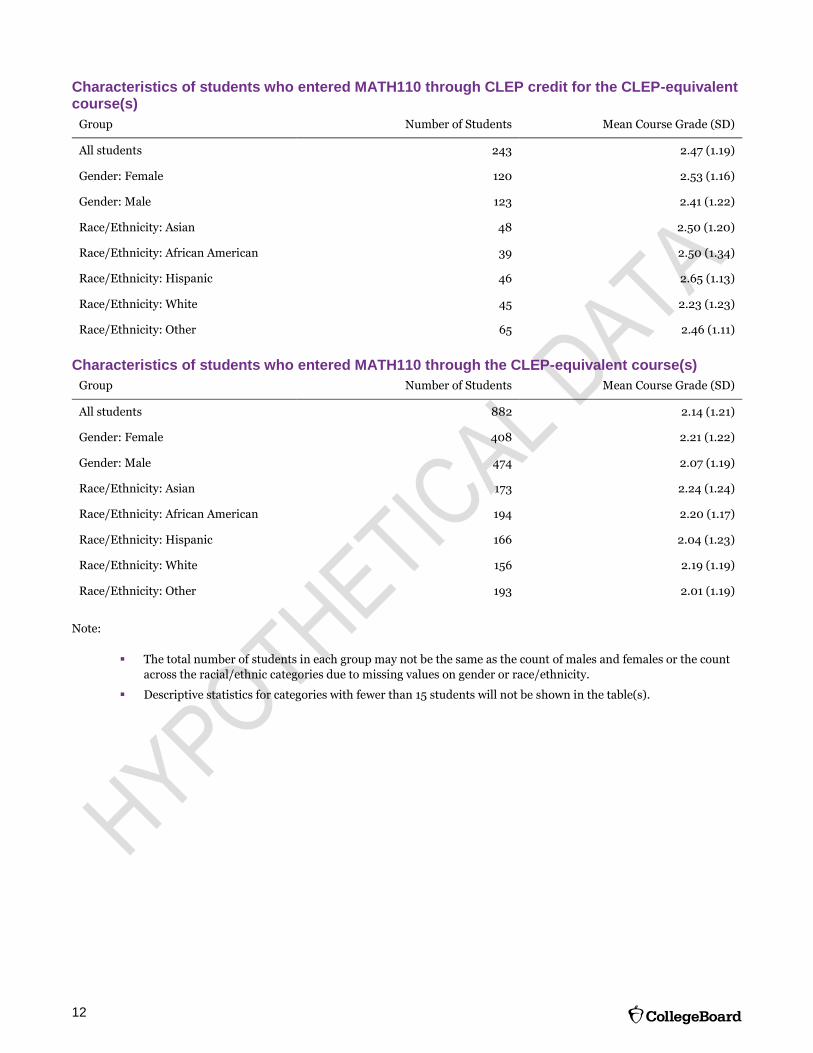
The tables below display the gender and racial/ethnic make-up of each group of students included in your study by their path of entry into MATH110. Each table displays the number of students in each gender and race/ethnicity category and the mean and standard deviation (SD) of their final grades in MATH110 the first time they took the course.
12
Characteristics of students who entered MATH110 through CLEP credit for the CLEP-equivalent course(s)
Group Number of Students Mean Course Grade (SD)
All students 243 2.47 (1.19)
Gender: Female 120 2.53 (1.16)
Gender: Male 123 2.41 (1.22)
Race/Ethnicity: Asian 48 2.50 (1.20)
Race/Ethnicity: African American 39 2.50 (1.34)
Race/Ethnicity: Hispanic 46 2.65 (1.13)
Race/Ethnicity: White 45 2.23 (1.23)
Race/Ethnicity: Other 65 2.46 (1.11)
Characteristics of students who entered MATH110 through the CLEP-equivalent course(s)
Group Number of Students Mean Course Grade (SD)
All students 882 2.14 (1.21)
Gender: Female 408 2.21 (1.22)
Gender: Male 474 2.07 (1.19)
Race/Ethnicity: Asian 173 2.24 (1.24)
Race/Ethnicity: African American 194 2.20 (1.17)
Race/Ethnicity: Hispanic 166 2.04 (1.23)
Race/Ethnicity: White 156 2.19 (1.19)
Race/Ethnicity: Other 193 2.01 (1.19)
Note:
The total number of students in each group may not be the same as the count of males and females or the count
across the racial/ethnic categories due to missing values on gender or race/ethnicity.
Descriptive statistics for categories with fewer than 15 students will not be shown in the table(s).

13
Following up on your placement decisions
This report provides you with documentation you may use to support CLEP placement decisions at your institution. For additional help in understanding the study, follow this link to the ACES website: https://aces.collegeboard.org/
For more information on the American Council of Education's recommendations for granting college credit for CLEP Exam scores visit:
http://www2.acenet.edu/credit/?fuseaction=browse.getOrganizationDetail&FICE=300172
https://clep.collegeboard.org/develop-your-clep-program/create-a-clep-policy/ace-credit-recommendations
ACES staff is also available to assist you with any questions you may have about the study. The complete statistical output for this report is available upon request by contacting ACES. To contact ACES staff:
Call: 1-800-439-8309
Email: [email protected]