college bound and images - iowa
TRANSCRIPT
1
dg/h/aa/sfa/15-16/14-15 report
12/7/2015@9:39:40 AM
BOARD OF REGENTS REPORT TO THE GENERAL ASSEMBLY
COLLEGE BOUND AND IMAGES (IOWA MINORITY ACADEMIC GRANTS FOR ECONOMIC SUCCESS)
2014 – 2015 Annual Report
JANUARY 2016
UNIVERSITY OF IOWA COLLEGE BOUND/IMAGES ANNUAL REPORT
2014-2015
2
dg/h/aa/sfa/15-16/14-15 report
12/7/2015@9:39:40 AM
Introduction The University of Iowa is committed to a climate that respects and values diversity, to the recruitment and retention of students, faculty and staff who contribute to diversity, and to administrative procedures and programs that support this diversity. Renewing the Iowa Promise: “Great Opportunities – Bold Expectations,” the Strategic Plan for the University of Iowa, 2010-2016, recognizes diversity as a core value of the UI that sets us on the path towards promoting excellence in education by increasing the diversity of the faculty, staff and students and providing a welcoming and inclusive climate for all members of our community. The College Bound and IMAGES programs foster the University’s diversity goals by supporting outreach to Iowa minority students. The purpose of this outreach is to encourage them to pursue opportunities in higher education and to provide financial support to help them realize their goals. The College Bound and IMAGES programs are important to the University’s wider efforts to promote and maintain a culturally diverse learning environment. Additional University programs of community outreach, financial aid and scholarships, cultural centers, academic support programs, cultural studies courses and curricula, multicultural campus organizations and performance groups, cultural events and celebrations, and other resources are used to support these outreach efforts and create a welcoming and supportive campus environment for all students, faculty and staff. At the University of Iowa, the Executive Vice President and Provost, through the Chief Diversity Officer and Associate Vice President, oversees and coordinates many of the University’s diversity efforts and administers, with assistance from the Office of Admissions, the College Bound Program, and with the Office of Student Financial Aid, the IMAGES program. This report summarizes College Bound activities and IMAGES scholarships awarded during the 2014-2015 academic cycle. Information for the report has been compiled from data available July 1, 2015.
COLLEGE BOUND
Purpose and Funding Allocation (Table B) - College Bound and IMAGES were established by the Iowa Legislature. These programs are intended to provide Iowa minority students with information and experiences relating to opportunities offered at the Regents universities. Consistent with these purposes, the University of Iowa has developed a range of programs for elementary, middle, and secondary students and their families that include academic enrichment, encouragement to consider attending a post-secondary institution, and admissions information. Funds are allocated annually from the University of Iowa General Education Fund to support the College Bound program. In 2014-2015, $118,000 was allocated to support these efforts, and $128,485 was expended. Some of the most successful programs are the Pen Pal Project with West Liberty Elementary School, Multicultural Visit Day, and the Teen Summit. Additional details and specific outreach and recruitment activities in 2014-2015 conducted under the College Bound Program are listed and described in the Appendix.
UNIVERSITY OF IOWA COLLEGE BOUND/IMAGES ANNUAL REPORT
2014-2015
3
dg/h/aa/sfa/15-16/14-15 report
12/7/2015@9:39:40 AM
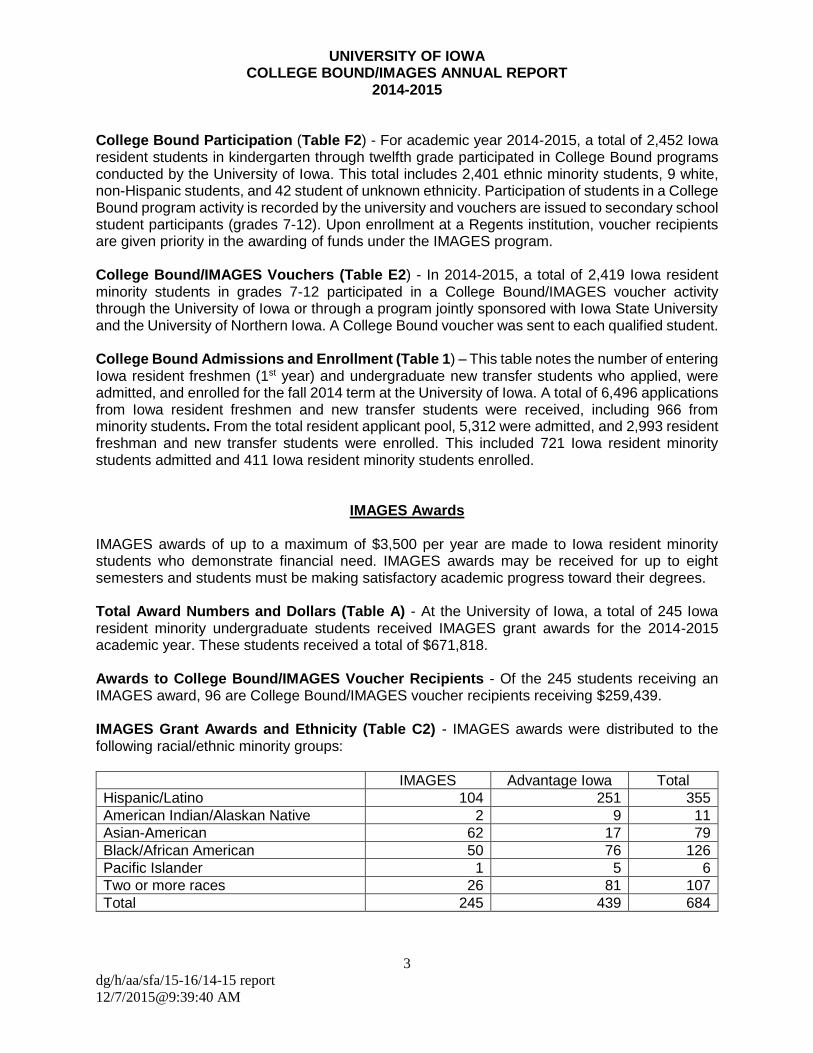
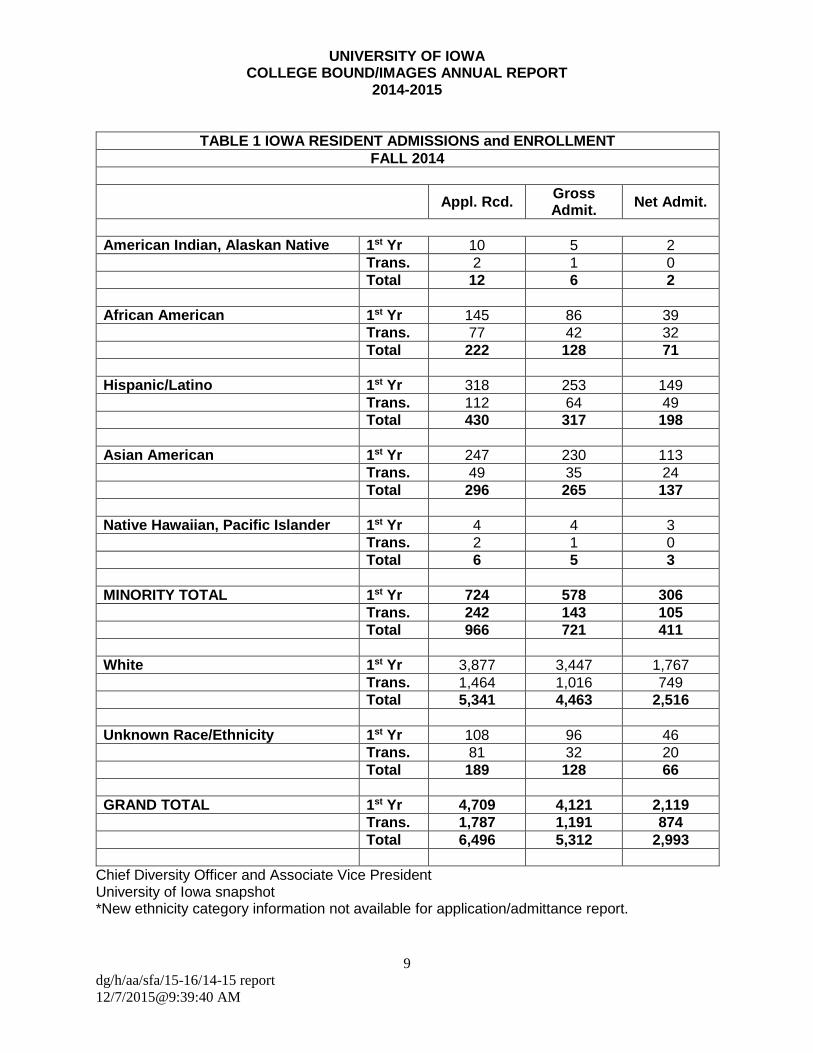
College Bound Participation (Table F2) - For academic year 2014-2015, a total of 2,452 Iowa resident students in kindergarten through twelfth grade participated in College Bound programs conducted by the University of Iowa. This total includes 2,401 ethnic minority students, 9 white, non-Hispanic students, and 42 student of unknown ethnicity. Participation of students in a College Bound program activity is recorded by the university and vouchers are issued to secondary school student participants (grades 7-12). Upon enrollment at a Regents institution, voucher recipients are given priority in the awarding of funds under the IMAGES program. College Bound/IMAGES Vouchers (Table E2) - In 2014-2015, a total of 2,419 Iowa resident minority students in grades 7-12 participated in a College Bound/IMAGES voucher activity through the University of Iowa or through a program jointly sponsored with Iowa State University and the University of Northern Iowa. A College Bound voucher was sent to each qualified student. College Bound Admissions and Enrollment (Table 1) – This table notes the number of entering Iowa resident freshmen (1st year) and undergraduate new transfer students who applied, were admitted, and enrolled for the fall 2014 term at the University of Iowa. A total of 6,496 applications from Iowa resident freshmen and new transfer students were received, including 966 from minority students. From the total resident applicant pool, 5,312 were admitted, and 2,993 resident freshman and new transfer students were enrolled. This included 721 Iowa resident minority students admitted and 411 Iowa resident minority students enrolled.
IMAGES Awards
IMAGES awards of up to a maximum of $3,500 per year are made to Iowa resident minority students who demonstrate financial need. IMAGES awards may be received for up to eight semesters and students must be making satisfactory academic progress toward their degrees. Total Award Numbers and Dollars (Table A) - At the University of Iowa, a total of 245 Iowa resident minority undergraduate students received IMAGES grant awards for the 2014-2015 academic year. These students received a total of $671,818. Awards to College Bound/IMAGES Voucher Recipients - Of the 245 students receiving an IMAGES award, 96 are College Bound/IMAGES voucher recipients receiving $259,439. IMAGES Grant Awards and Ethnicity (Table C2) - IMAGES awards were distributed to the following racial/ethnic minority groups:
IMAGES Advantage Iowa Total
Hispanic/Latino 104 251 355
American Indian/Alaskan Native 2 9 11
Asian-American 62 17 79
Black/African American 50 76 126
Pacific Islander 1 5 6
Two or more races 26 81 107
Total 245 439 684
UNIVERSITY OF IOWA COLLEGE BOUND/IMAGES ANNUAL REPORT
2014-2015
4
dg/h/aa/sfa/15-16/14-15 report
12/7/2015@9:39:40 AM
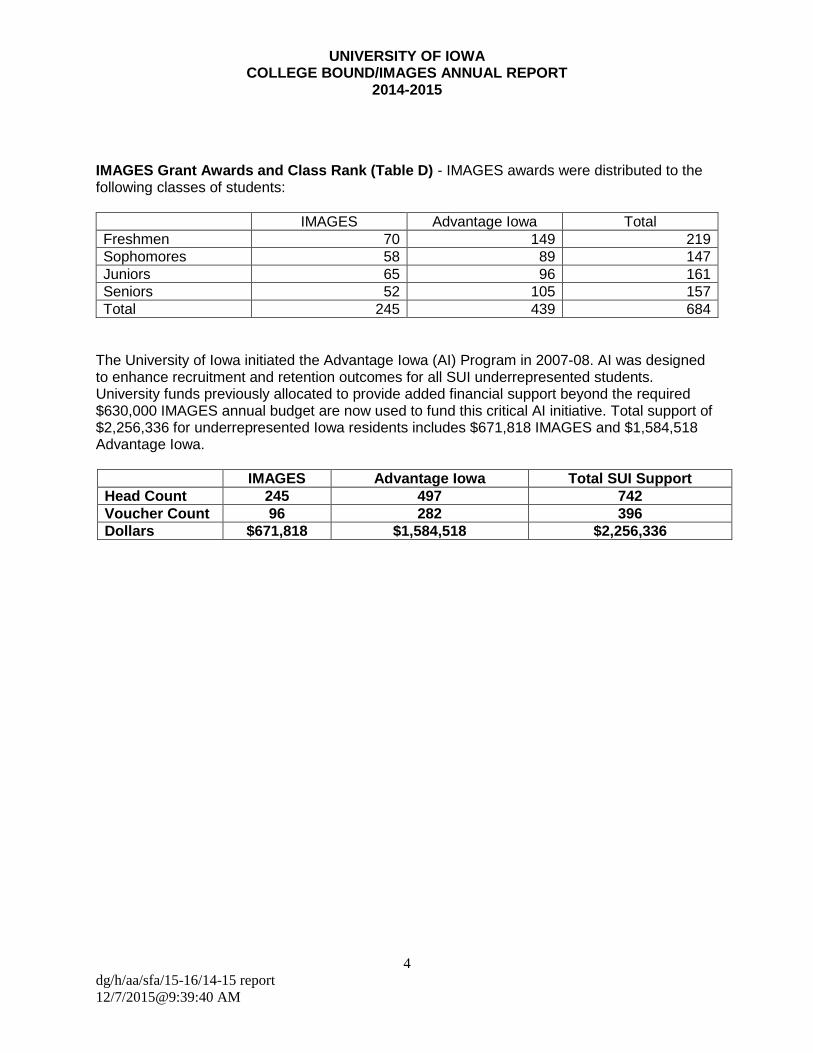
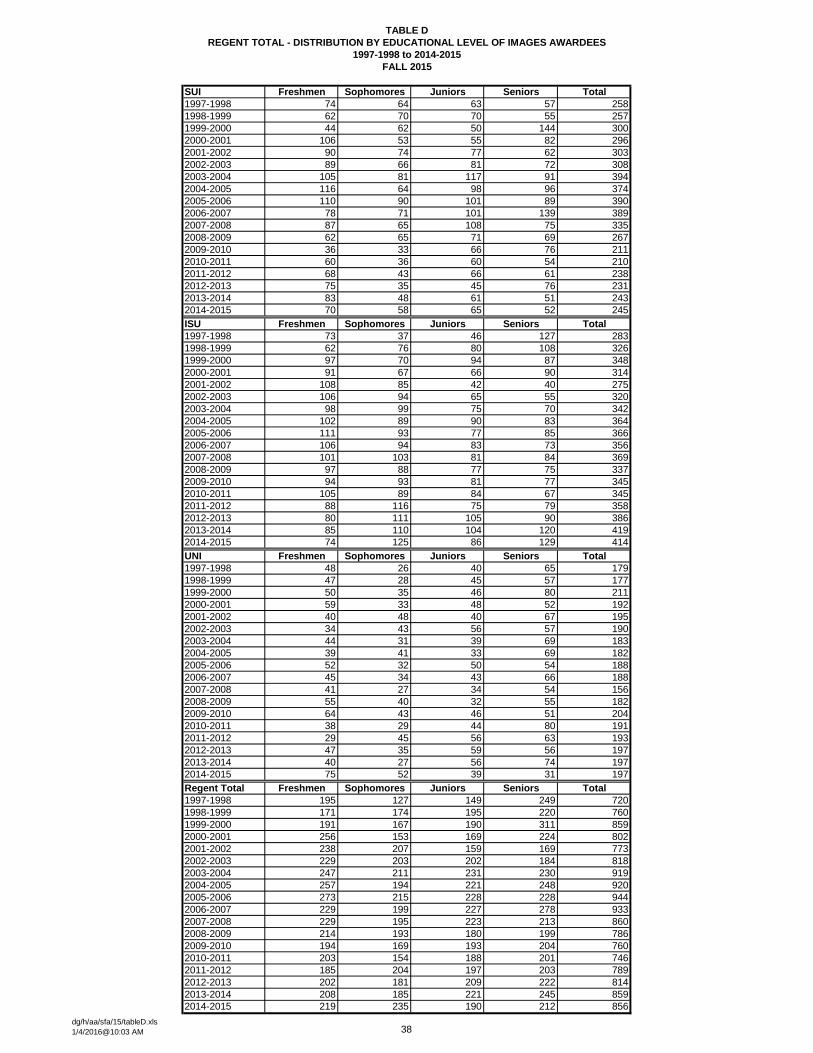
IMAGES Grant Awards and Class Rank (Table D) - IMAGES awards were distributed to the following classes of students:
IMAGES Advantage Iowa Total
Freshmen 70 149 219
Sophomores 58 89 147
Juniors 65 96 161
Seniors 52 105 157
Total 245 439 684
The University of Iowa initiated the Advantage Iowa (AI) Program in 2007-08. AI was designed to enhance recruitment and retention outcomes for all SUI underrepresented students. University funds previously allocated to provide added financial support beyond the required $630,000 IMAGES annual budget are now used to fund this critical AI initiative. Total support of $2,256,336 for underrepresented Iowa residents includes $671,818 IMAGES and $1,584,518 Advantage Iowa.
IMAGES Advantage Iowa Total SUI Support
Head Count 245 497 742
Voucher Count 96 282 396
Dollars $671,818 $1,584,518 $2,256,336
UNIVERSITY OF IOWA COLLEGE BOUND/IMAGES ANNUAL REPORT
2014-2015
5
dg/h/aa/sfa/15-16/14-15 report
12/7/2015@9:39:40 AM
APPENDIX
COLLEGE BOUND ACTIVITIES Background Reporting to the Chief Diversity Officer and Associate Vice President, the Center for Diversity and Enrichment (CDE) brings together under one umbrella a variety of programs and services that help create a welcoming climate for students, staff, and faculty from communities underrepresented in higher education. The Office of Admissions along with CDE provides leadership and coordination for K-12 outreach and service to underserved UI students from diverse backgrounds, including students of color, first-generation students whose parents have not received a baccalaureate degree, and students from low-income families. These efforts emphasize focused school and community partner contacts. CDE is also the home of Upward Bound, a TRIO program funded by the U.S. Department of Education. In existence for 50 years, Upward Bound works extensively with underserved students and families during the academic year and invites them to a summer academy each summer of their high school year. In 2014-2015, the communities served by Upward Bound were Muscatine, West Liberty, and Columbus Junction.
Campus Visits
College Bound Campus Visits: The Office of Admissions organizes and conducts the Special Group Campus Visit Program that brings minority and first generation student groups to campus. High school students meet with staff from the Offices of Admissions, Financial Aid, Center for Diversity and Enrichment, and a student panel. An additional academic component consists of group visits with faculty from various disciplines. Students also receive a campus tour and have the option to eat in one of our dining centers. Several campus visits are designed for family participation in order to encourage parents to learn about the University of Iowa. Where appropriate, efforts are made to provide Spanish translation.
GEAR UP (Gaining Early Awareness and Readiness for Undergraduate Programs): The Mission of GEAR UP is to significantly increase the number of students who are prepared to enter and succeed in postsecondary education. Beginning in the 2006-2007 academic year, the University of Iowa began a partnership with seventh graders from middle/high schools throughout Iowa, and this partnership continues today. The university provides campus visit opportunities for students and their families several times a year. Campus visits are organized around students’ career interests. GEAR UP just received a new seven year grant and we have agreed to partner with them to help support their college outreach efforts and bring their students to our campus.
Multicultural Visit Day: The Office of Admissions and CDE host a Multicultural Visit Day in the fall for prospective students and their families. During this day different departments, offices and colleges throughout the campus community are involved to help educate the students on all the different programs, majors and services we provide. Information about admission, housing, financial aid, student life, cultural centers, campus tours, and other diverse opportunities are shared. They also have conversations with current students of color and explore academic opportunities Iowa offers.
UNIVERSITY OF IOWA COLLEGE BOUND/IMAGES ANNUAL REPORT
2014-2015
6
dg/h/aa/sfa/15-16/14-15 report
12/7/2015@9:39:40 AM
Advantage Iowa Students Campus Visits: Admitted Iowa high school students who received the Advantage Iowa scholarship and had not visited the campus were invited to visit campus in the spring with mileage reimbursed.
College Fairs: The Office of Admissions attended college fairs throughout the state to provide minority students information about the University of Iowa. Students were provided information on admission requirements, scholarships, programs and majors, cost of attendance, and what it’s like to be a student at the University of Iowa.
Pen Pals
Pen Pal Partnerships with West Liberty Elementary School: West Liberty elementary students in fourth grade are matched with University of Iowa student pen pals. The goals of this program are to provide students with positive role models, to increase their motivation for academic success and to help them see that college is possible. The West Liberty participants visited campus on September 26, 2014 and on April 27, 2015 to meet with their pen pals.
Summer Programs
Iowa First Nations: In July 2014, the Iowa First Nations program provided 18 Native American students the opportunity to live on campus and experience the university setting, explore majors, and gain an appreciation for the variety of opportunities on the University of Iowa campus and higher education in general. Participants attend structured classroom seminars and field trips to various campus departments, enjoy hands on classroom experiences, and have the opportunity to get involved in social and recreational activities on campus and in the community. This program occurs annually.
Pre-College Summer Programs: Iowa resident minority students participated in many of the different summer workshops or programs supported by the Center for Diversity and Enrichment. In summer programs, students live on campus for two to six weeks, allowing them to explore the campus, meet college students, and work closely with faculty and staff. The Chief Diversity Office provides support to summer programs to increase their minority participation as well as the administering of the Iowa First Nations listed above.
Upward Bound: The University of Iowa Upward Bound Project held a 6 week residential summer program for 66 students from West Liberty, Columbus Community and Muscatine High Schools. Rising students were placed in enrichment classes to delve into subjects with greater detail than is offered by most public schools. Senior students that recently graduated from high school were enrolled in a University of Iowa course that could be later transferred to their institution of choice. Students also participated in cultural activities and a field trip to Chicago called “Week of Learning on the Road.” The fieldtrip involved a tour of three college campuses, museum visits, and cultural attractions.
UNIVERSITY OF IOWA COLLEGE BOUND/IMAGES ANNUAL REPORT
2014-2015
7
dg/h/aa/sfa/15-16/14-15 report
12/7/2015@9:39:40 AM
On-Campus Programs
CDE Graduation Reception: Approximately 300 individuals, including prospective students and their families, attend this annual event hosted by CDE. This reception is designed to recognize diverse students receiving professional, graduate, and undergraduate degrees from the University of Iowa and inspire younger students to pursue college and persist to graduation. Collegiate deans and department directors present awards to the outstanding students from their units. In addition, students confer an award on a faculty or staff member who has worked to enhance diversity in all aspects of campus life.
Multi-Ethnic Engineering and Science Association (MESA): UI College of Engineering students assist in on-campus tutoring of minority students in the Iowa City Community School District (ICCSD). Dr. Tonya Peeples, UI College of Engineering, administers this program through the ICCSD.
Storm Lake Scholars: The Storm Lake Scholars Program is designed to help qualified students realize their potential and find a home at the University of Iowa. During the fall 2014, staff from the Center for Diversity and Enrichment, Office of Financial Aid, Center for Student Involvement and Leadership, and Admissions met parents and students to discuss the application process and financial aid options. The goal was to have 10 students from Storm Lake come to the University of Iowa in the fall of 2015. The following activities took place during the reporting year: October 30-31, 2014: Storm Lake High School Campus Visit in partnership with the Juntos Program reduces the risk of non-college matriculation by bringing together middle school youth and their parents to support each other as they enter high school and prepare together for higher education. Twelve students and 6 parents attended this campus visit. November 13, 2014: University of Iowa Preview Program at Storm Lake High School with parents and students meant to help provide early orientation for potential Storm Lake Scholars to the University of Iowa. May 7-8, 2015: Administrators High School Campus Visit the University of Iowa Campus to familiarize Storm Lake administrative partners with the campus as well as with Center for Diversity and Enrichment staff.
African American Achievement Program (AAAP): Nearly 200 middle school students from Cedar Rapids, Iowa traveled to the University of Iowa campus to learn about the college experience and contribute to a book discussion. This program is in collaboration with the Belin-Blank Center, College of Education, and the Center for Diversity and Enrichment.
Off-Campus Programs
PreView Iowa – Storm Lake: Students and their families were invited to PreView Iowa in Storm Lake, IA to learn more about the diverse opportunities students from Iowa and across the country experience every day at the University of Iowa. Opportunities were available to meet current students and both Admissions and CDE staff as well as learn about admissions, scholarships, financial aid, housing, student life, and services from CDE.
UNIVERSITY OF IOWA COLLEGE BOUND/IMAGES ANNUAL REPORT
2014-2015
8
dg/h/aa/sfa/15-16/14-15 report
12/7/2015@9:39:40 AM
Co-sponsored Programs:
Latino/a Youth Leadership Development Summit: “Strengthening and Valuing Latino/a Communities in Iowa”: This event is sponsored by Center for Diversity & Enrichment, UI School of Social Work, Kit Gerken with College of Education, and the Office of Admissions. It provides an opportunity to explore the changing demographics and dynamics of the Iowa Latino/a community. The Summit is an opportunity for Latino/a high school students to gain essential leadership skills. Consuelo Castillo-Kickbusch delivered the keynote “Going Forward without Forgetting- Avanzando y No Olvidando,” reflecting on ones traditions and values of times past and their importance in our development and growth today. Appreciation of diverse cultures and their contributions to today’s society was emphasized.
Teen Summit: The Teen Summit was developed by the Alumnae Chapter of Delta Sigma Theta sorority to help African American high school students in the Iowa City-Cedar Rapids community acquire the tools necessary for personal and professional success. Through a series of workshops on topics including strategies for building healthy relationships, improving self-esteem, etiquette training, and college preparation, the program focuses on developing interest in college among participants. The Teen Summit took place in late October 2014.
I’ll Make Me a World in Iowa: This diverse collaboration of Iowans highlights African American arts, culture and contributions through education, awareness and preservation and presents an annual enrichment celebration as well as continual educational outreach. The Office of Admissions and CDE participate in Education Day and Celebration Day events during this festival. The most recent program occurred on January 23, 2015.
Other College Bound Activities
Publications: The Office of Admissions and the Center for Diversity and Enrichment publications provide additional resources for individuals interested in the University of Iowa. Some of these updates include the websites (http://diversity.uiowa.edu/cde), (http://admissions.uiowa.edu/diversity) and information sheets in college preparedness and Regents Admissions Standards. Prospective minority students receive the “Opportunity + Community” brochure that highlights current minority student, faculty and staff experiences at the University of Iowa and includes a message from our Chief Diversity Officer. We also provide Latino, African American, Asian, Native American, and LGBT students with a one page flier for each group which highlights diversity, academic, and support resources on campus for those students.
Electronic Communications: Multiple emails are sent to pre-college students from both the Center for Diversity and Enrichment and Admissions in the spring that focus on campus diversity resources, information about student life, FAFSA completion, housing application submission deadlines, admission acceptance processes, applying for scholarships, and encouraging campus visits.
****
UNIVERSITY OF IOWA COLLEGE BOUND/IMAGES ANNUAL REPORT
2014-2015
9
dg/h/aa/sfa/15-16/14-15 report
12/7/2015@9:39:40 AM
TABLE 1 IOWA RESIDENT ADMISSIONS and ENROLLMENT
FALL 2014
Appl. Rcd.
Gross Admit.
Net Admit.
American Indian, Alaskan Native 1st Yr 10 5 2
Trans. 2 1 0
Total 12 6 2
African American 1st Yr 145 86 39
Trans. 77 42 32
Total 222 128 71
Hispanic/Latino 1st Yr 318 253 149
Trans. 112 64 49
Total 430 317 198
Asian American 1st Yr 247 230 113
Trans. 49 35 24
Total 296 265 137
Native Hawaiian, Pacific Islander 1st Yr 4 4 3
Trans. 2 1 0
Total 6 5 3
MINORITY TOTAL 1st Yr 724 578 306
Trans. 242 143 105
Total 966 721 411
White 1st Yr 3,877 3,447 1,767
Trans. 1,464 1,016 749
Total 5,341 4,463 2,516
Unknown Race/Ethnicity 1st Yr 108 96 46
Trans. 81 32 20
Total 189 128 66
GRAND TOTAL 1st Yr 4,709 4,121 2,119
Trans. 1,787 1,191 874
Total 6,496 5,312 2,993
Chief Diversity Officer and Associate Vice President University of Iowa snapshot *New ethnicity category information not available for application/admittance report.
IOWA STATE UNIVERSITY COLLEGE BOUND/IMAGES ANNUAL REPORT
2014-2015
10
dg/h/aa/sfa/15-16/14-15 report
12/7/2015@9:39:40 AM
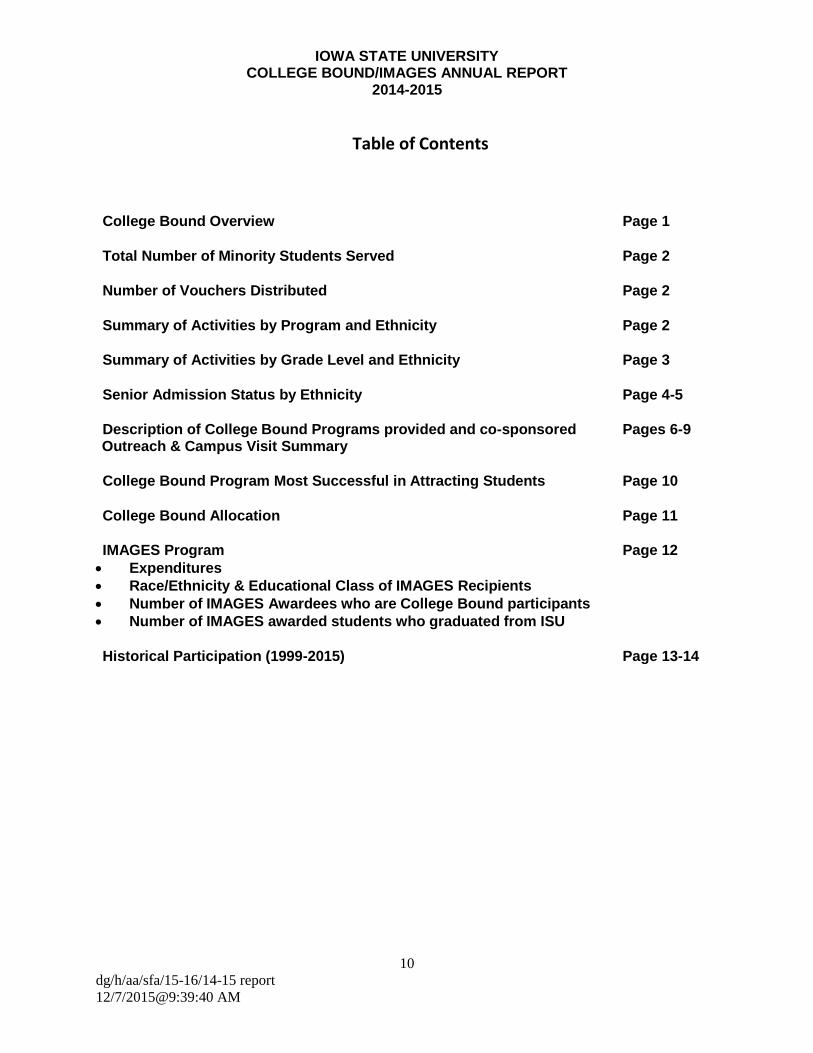
Table of Contents
College Bound Overview Page 1
Total Number of Minority Students Served Page 2
Number of Vouchers Distributed Page 2
Summary of Activities by Program and Ethnicity Page 2
Summary of Activities by Grade Level and Ethnicity Page 3
Senior Admission Status by Ethnicity Page 4-5
Description of College Bound Programs provided and co-sponsored Pages 6-9 Outreach & Campus Visit Summary
College Bound Program Most Successful in Attracting Students Page 10
College Bound Allocation Page 11
IMAGES Program Page 12
Expenditures
Race/Ethnicity & Educational Class of IMAGES Recipients
Number of IMAGES Awardees who are College Bound participants
Number of IMAGES awarded students who graduated from ISU
Historical Participation (1999-2015) Page 13-14
IOWA STATE UNIVERSITY COLLEGE BOUND/IMAGES ANNUAL REPORT
2014-2015
11
dg/h/aa/sfa/15-16/14-15 report
12/7/2015@9:39:40 AM
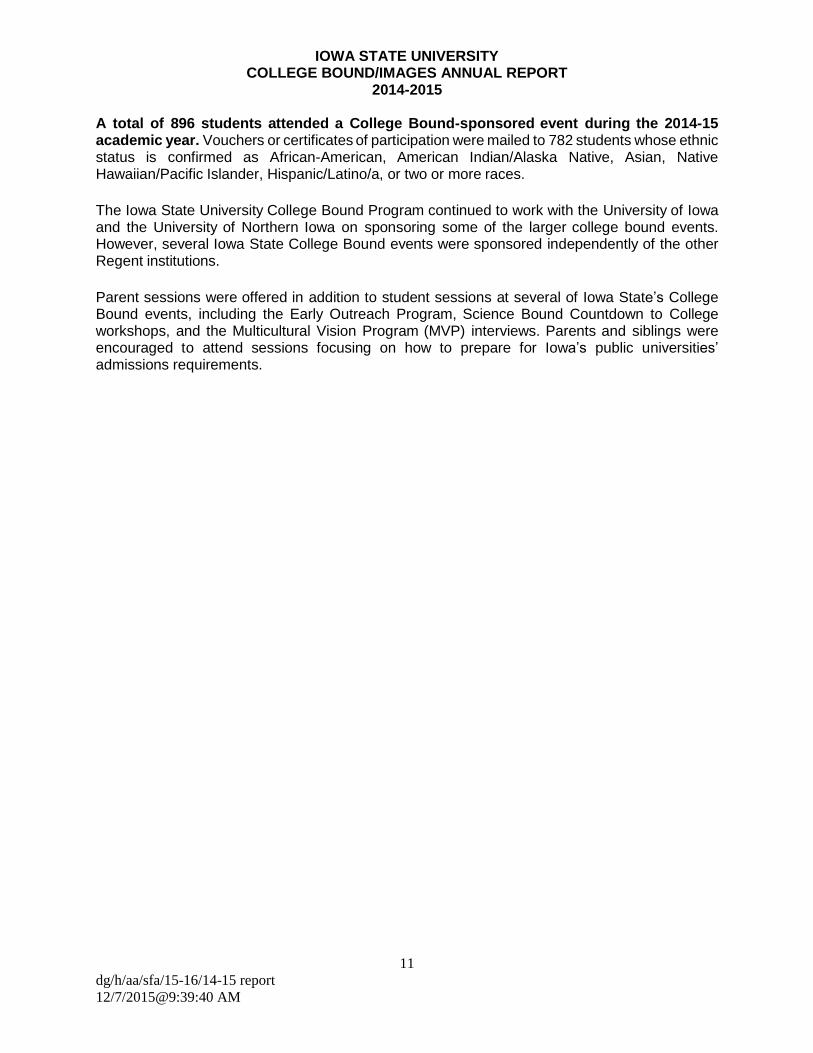
A total of 896 students attended a College Bound-sponsored event during the 2014-15 academic year. Vouchers or certificates of participation were mailed to 782 students whose ethnic status is confirmed as African-American, American Indian/Alaska Native, Asian, Native Hawaiian/Pacific Islander, Hispanic/Latino/a, or two or more races.
The Iowa State University College Bound Program continued to work with the University of Iowa and the University of Northern Iowa on sponsoring some of the larger college bound events. However, several Iowa State College Bound events were sponsored independently of the other Regent institutions.
Parent sessions were offered in addition to student sessions at several of Iowa State’s College Bound events, including the Early Outreach Program, Science Bound Countdown to College workshops, and the Multicultural Vision Program (MVP) interviews. Parents and siblings were encouraged to attend sessions focusing on how to prepare for Iowa’s public universities’ admissions requirements.
IOWA STATE UNIVERSITY COLLEGE BOUND/IMAGES ANNUAL REPORT
2014-2015
12
dg/h/aa/sfa/15-16/14-15 report
12/7/2015@9:39:40 AM
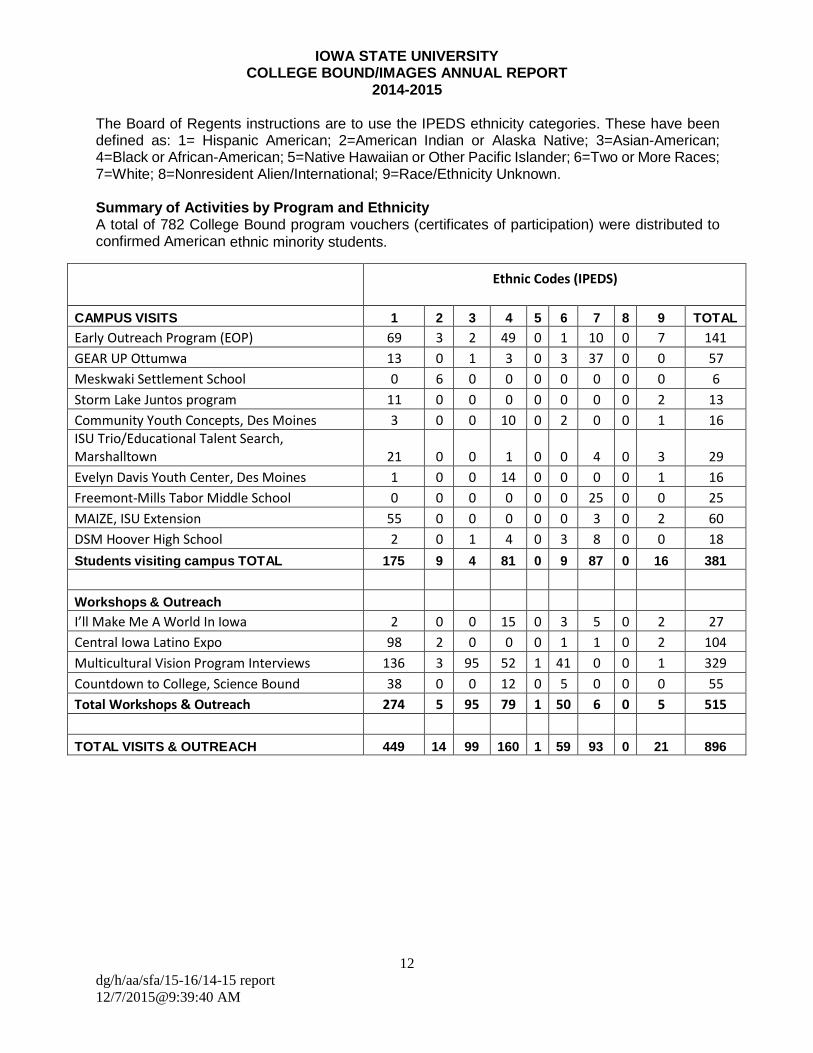
The Board of Regents instructions are to use the IPEDS ethnicity categories. These have been defined as: 1= Hispanic American; 2=American Indian or Alaska Native; 3=Asian-American; 4=Black or African-American; 5=Native Hawaiian or Other Pacific Islander; 6=Two or More Races; 7=White; 8=Nonresident Alien/International; 9=Race/Ethnicity Unknown. Summary of Activities by Program and Ethnicity A total of 782 College Bound program vouchers (certificates of participation) were distributed to confirmed American ethnic minority students.
Ethnic Codes (IPEDS)
CAMPUS VISITS 1 2 3 4 5 6 7 8 9 TOTAL
Early Outreach Program (EOP) 69 3 2 49 0 1 10 0 7 141
GEAR UP Ottumwa 13 0 1 3 0 3 37 0 0 57
Meskwaki Settlement School 0 6 0 0 0 0 0 0 0 6
Storm Lake Juntos program 11 0 0 0 0 0 0 0 2 13
Community Youth Concepts, Des Moines 3 0 0 10 0 2 0 0 1 16 ISU Trio/Educational Talent Search, Marshalltown
21
0
0
1
0
0
4
0
3
29
Evelyn Davis Youth Center, Des Moines 1 0 0 14 0 0 0 0 1 16
Freemont-Mills Tabor Middle School 0 0 0 0 0 0 25 0 0 25
MAIZE, ISU Extension 55 0 0 0 0 0 3 0 2 60
DSM Hoover High School 2 0 1 4 0 3 8 0 0 18
Students visiting campus TOTAL 175 9 4 81 0 9 87 0 16 381
Workshops & Outreach
I’ll Make Me A World In Iowa 2 0 0 15 0 3 5 0 2 27
Central Iowa Latino Expo 98 2 0 0 0 1 1 0 2 104
Multicultural Vision Program Interviews 136 3 95 52 1 41 0 0 1 329
Countdown to College, Science Bound 38 0 0 12 0 5 0 0 0 55
Total Workshops & Outreach 274 5 95 79 1 50 6 0 5 515
TOTAL VISITS & OUTREACH 449 14 99 160 1 59 93 0 21 896
IOWA STATE UNIVERSITY COLLEGE BOUND/IMAGES ANNUAL REPORT
2014-2015
13
dg/h/aa/sfa/15-16/14-15 report
12/7/2015@9:39:40 AM
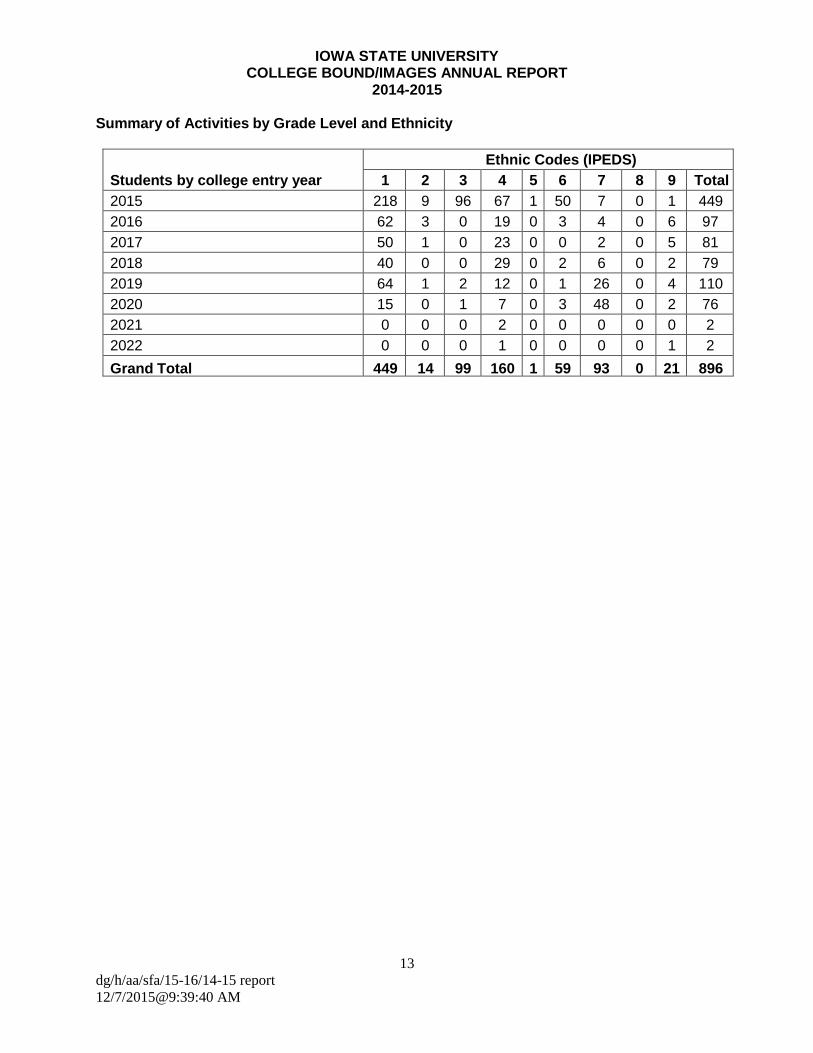
Summary of Activities by Grade Level and Ethnicity
Students by college entry year
Ethnic Codes (IPEDS)
1 2 3 4 5 6 7 8 9 Total
2015 218 9 96 67 1 50 7 0 1 449
2016 62 3 0 19 0 3 4 0 6 97
2017 50 1 0 23 0 0 2 0 5 81
2018 40 0 0 29 0 2 6 0 2 79
2019 64 1 2 12 0 1 26 0 4 110
2020 15 0 1 7 0 3 48 0 2 76
2021 0 0 0 2 0 0 0 0 0 2
2022 0 0 0 1 0 0 0 0 1 2
Grand Total 449 14 99 160 1 59 93 0 21 896
IOWA STATE UNIVERSITY COLLEGE BOUND/IMAGES ANNUAL REPORT
2014-2015
14
dg/h/aa/sfa/15-16/14-15 report
12/7/2015@9:39:40 AM
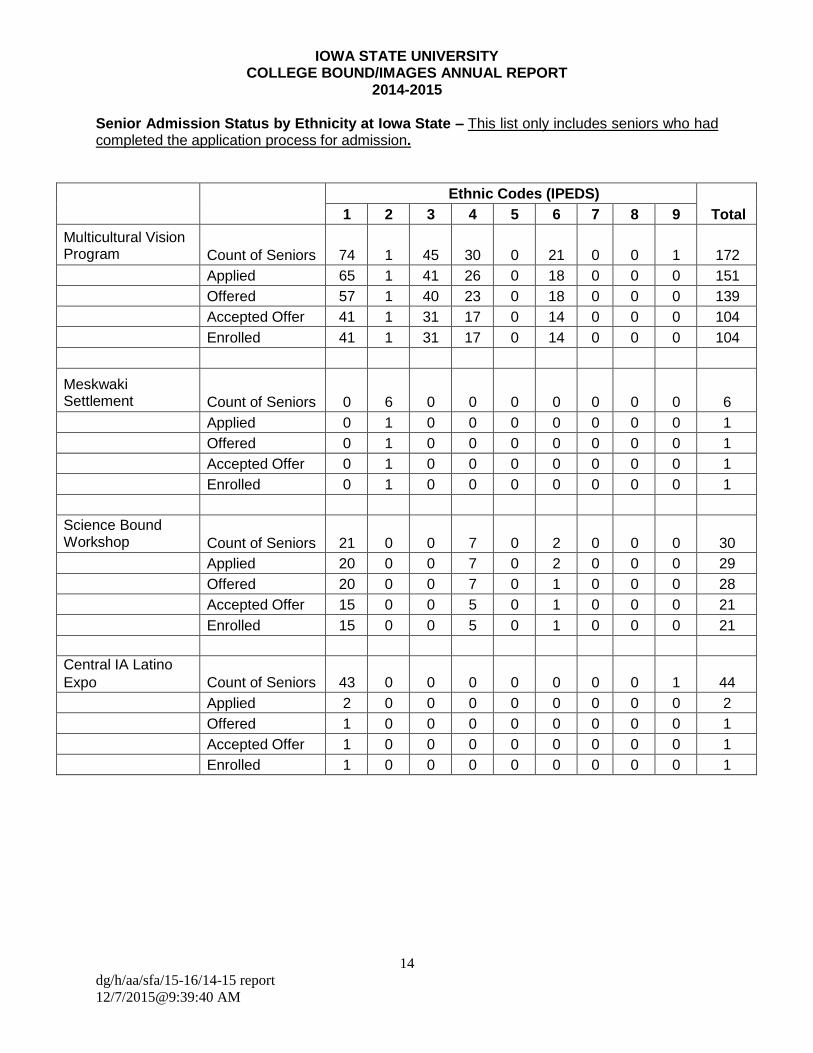
Senior Admission Status by Ethnicity at Iowa State – This list only includes seniors who had completed the application process for admission.
Ethnic Codes (IPEDS)
Total 1 2 3 4 5 6 7 8 9
Multicultural Vision Program
Count of Seniors
74
1
45
30
0
21
0
0
1
172
Applied 65 1 41 26 0 18 0 0 0 151
Offered 57 1 40 23 0 18 0 0 0 139
Accepted Offer 41 1 31 17 0 14 0 0 0 104
Enrolled 41 1 31 17 0 14 0 0 0 104
Meskwaki Settlement School
Count of Seniors
0
6
0
0
0
0
0
0
0
6
Applied 0 1 0 0 0 0 0 0 0 1
Offered 0 1 0 0 0 0 0 0 0 1
Accepted Offer 0 1 0 0 0 0 0 0 0 1
Enrolled 0 1 0 0 0 0 0 0 0 1
Science Bound Workshop
Count of Seniors
21
0
0
7
0
2
0
0
0
30
Applied 20 0 0 7 0 2 0 0 0 29
Offered 20 0 0 7 0 1 0 0 0 28
Accepted Offer 15 0 0 5 0 1 0 0 0 21
Enrolled 15 0 0 5 0 1 0 0 0 21
Central IA Latino
Expo Count of Seniors
43
0
0
0
0
0
0
0
1
44
Applied 2 0 0 0 0 0 0 0 0 2
Offered 1 0 0 0 0 0 0 0 0 1
Accepted Offer 1 0 0 0 0 0 0 0 0 1
Enrolled 1 0 0 0 0 0 0 0 0 1
IOWA STATE UNIVERSITY COLLEGE BOUND/IMAGES ANNUAL REPORT
2014-2015
15
dg/h/aa/sfa/15-16/14-15 report
12/7/2015@9:39:40 AM
Ethnic Codes (IPEDS)
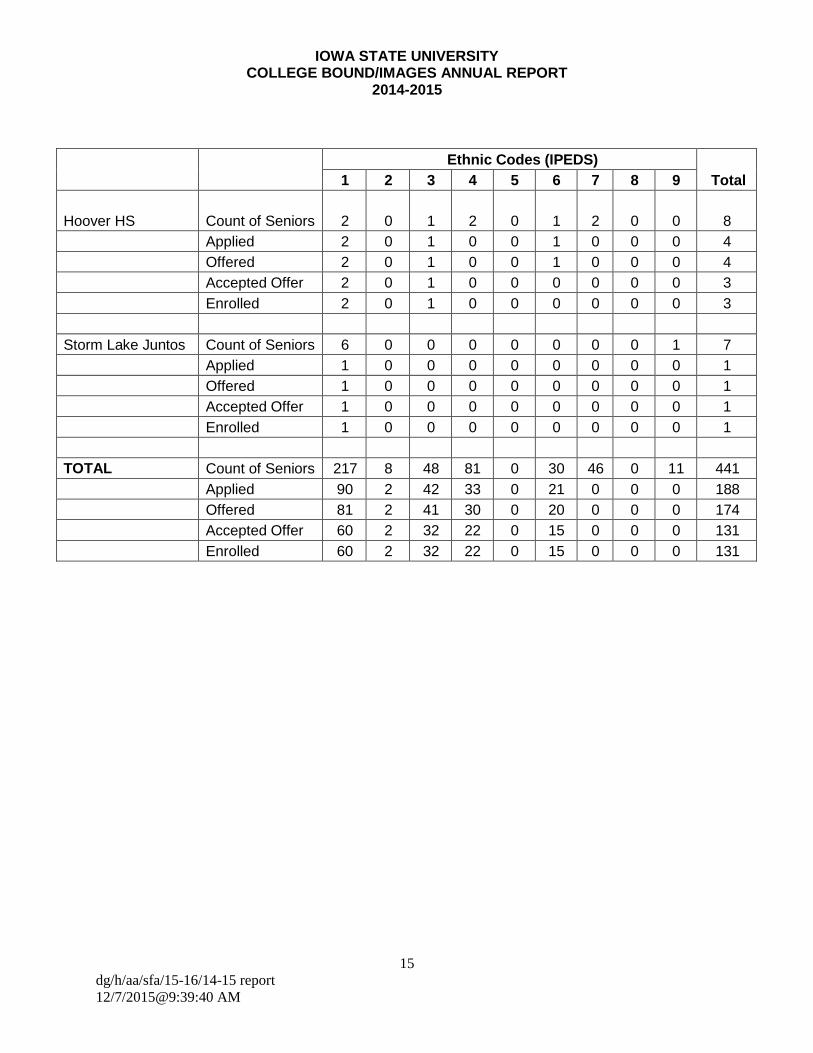
Total 1 2 3 4 5 6 7 8 9 Hoover HS
Count of Seniors
2
0
1
2
0
1
2
0
0
8
Applied 2 0 1 0 0 1 0 0 0 4
Offered 2 0 1 0 0 1 0 0 0 4
Accepted Offer 2 0 1 0 0 0 0 0 0 3
Enrolled 2 0 1 0 0 0 0 0 0 3
Storm Lake Juntos Count of Seniors 6 0 0 0 0 0 0 0 1 7
Applied 1 0 0 0 0 0 0 0 0 1
Offered 1 0 0 0 0 0 0 0 0 1
Accepted Offer 1 0 0 0 0 0 0 0 0 1
Enrolled 1 0 0 0 0 0 0 0 0 1
TOTAL Count of Seniors 217 8 48 81 0 30 46 0 11 441
Applied 90 2 42 33 0 21 0 0 0 188
Offered 81 2 41 30 0 20 0 0 0 174
Accepted Offer 60 2 32 22 0 15 0 0 0 131
Enrolled 60 2 32 22 0 15 0 0 0 131
IOWA STATE UNIVERSITY COLLEGE BOUND/IMAGES ANNUAL REPORT
2014-2015
16
dg/h/aa/sfa/15-16/14-15 report
12/7/2015@9:39:40 AM
Outreach & Campus Visit Summary The common goal of each program is to prepare multicultural students for college admission, inform them of their college options, and assist them with application processes and financial aid. This is a list of programs that took place during the 2014-2015 academic year with a summary of activities by grade and followed by ethnic code.
Campus Visits Several schools and agencies were contacted and encouraged to schedule a campus visit to Iowa State University. Visits were coordinated with the Offices of Admissions, Multicultural Student Affairs, Student Financial Aid, Student Support Services, and various academic departments and student organizations. Students interacted with college student mentors and staff.
GEAR UP partnership programming statewide. The College Bound Program continues to work with the GEAR UP Iowa schools to provide campus visits, in school and after school activities, and career information to students and their families. In 2014-15, the Iowa State College Bound program hosted Storm Lake Juntos, the Evelyn Davis Youth Center from Des Moines, Des Moines Hoover HS, and Ottumwa HS. The College Bound program also hosted the Iowa State University Educational Talent Search Program (ISU TRIO), Meskwaki Settlement School, Community Youth Concepts, Freemont-Mills Tabor Middle School and MAIZE, an ISU extension outreach program.
EOP @ ISU, Iowa State University College Bound, in cooperation with several Iowa State departments, hosted summer enrichment camps for high school students. These one-week, summer residential programs provided learning and exploring opportunities for students while they participated in a college environment. Two one-week programs grouping 9th/10th and 11th/12th grade students were offered. Parents and siblings were invited to attend opening/closing ceremonies and received information related to college admissions, appropriate pre-college curriculum choices, and financial aid procedures.
Outreach Events These events provided students and parents an opportunity to discuss college admission requirements, scholarships, and academic life. Speakers and college representatives were available to counsel students and families about the college selection process. College Bound co-sponsors these events and made presentations with Iowa State students serving on a student panel or in a college fair setting.
Central Iowa Latino College Expo, location rotates among Central College, Simpson, DMACC & Iowa State Latino high school students from central Iowa attended a conference designed to address the needs of Latino student populations, providing information regarding academic and personal preparation for success, and motivating students. Iowa State University and the College Bound Program will host and sponsor the fall 2017 program.
IOWA STATE UNIVERSITY COLLEGE BOUND/IMAGES ANNUAL REPORT
2014-2015
17
dg/h/aa/sfa/15-16/14-15 report
12/7/2015@9:39:40 AM
Multicultural Vision Program, Iowa State University The Multicultural Vision Program (MVP) was created to provide up to 100 in-state multicultural students with demonstrated need, the opportunity to receive a renewable tuition grant provided they demonstrate potential in ways that go beyond class ranking or test scores. The program targets 100 students to receive the grant. Students are encouraged to attend programs and participate in interviews in order to be selected. Iowa State staff visited with each candidate and the candidate’s family regarding their options at Iowa State University through the Multicultural Vision Program.
I’ll Make Me A World In Iowa (IMMAWII), Des Moines IMMAWII is a diverse collaboration of Iowans, which highlights African-American arts, culture and contributions through education, awareness and preservation during an annual enrichment celebration and with continual educational outreach. The Iowa State College Bound Program co-sponsors and contributes to Education Day by providing sessions on college preparation, assists in facilitating the Black History Game Show and collaborating with faculty to present educational sessions for middle and high school students, teachers and families.
Countdown to College, Science Bound Program Science Bound is Iowa State University's premier pre-college program to increase the number of ethnically diverse Iowa students who pursue ASTEM (agricultural, scientific, technical, engineering and mathematics) degrees. The program draws students with potential from middle and high schools in Des Moines, Denison and Marshalltown, Iowa. The College Bound program collaborates with the Science Bound staff to facilitate the Countdown to College workshop series for 12th grade students in each of the three districts. Workshops are presented to students and family members related to applying for college, filing the Free Application for Federal Student Aid (FAFSA) and financing college, students services, and academic support.
IOWA STATE UNIVERSITY COLLEGE BOUND/IMAGES ANNUAL REPORT
2014-2015
18
dg/h/aa/sfa/15-16/14-15 report
12/7/2015@9:39:40 AM
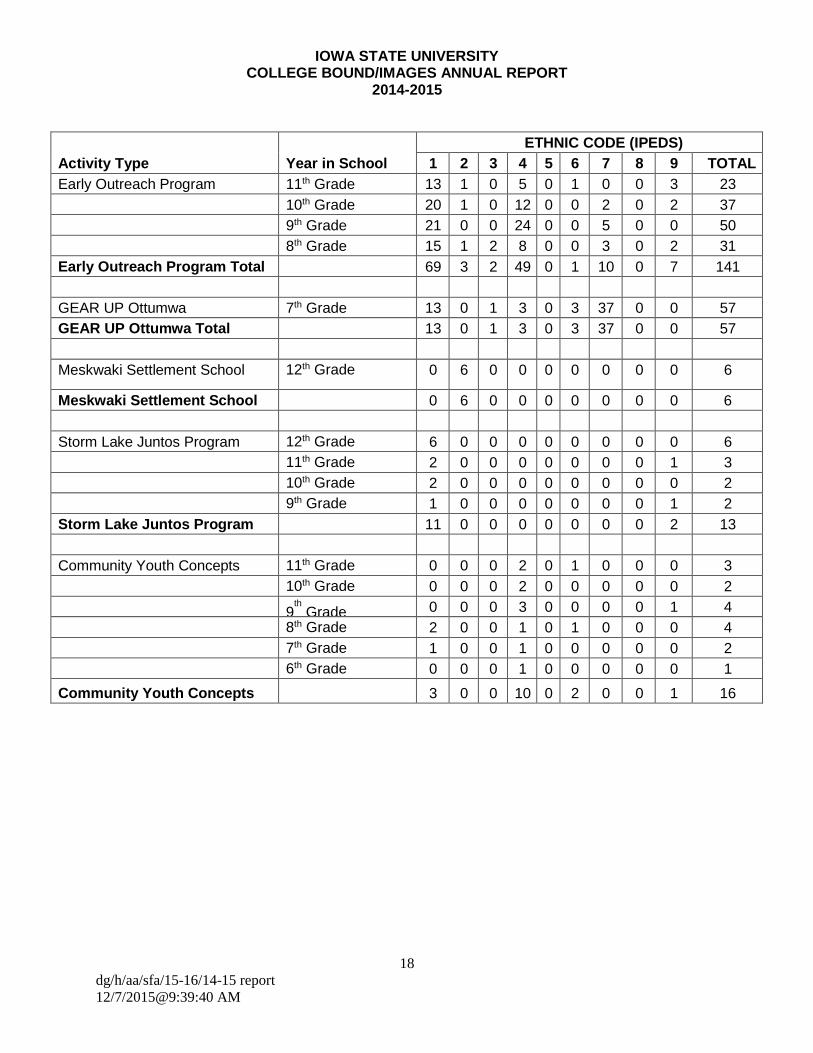
Activity Type
Year in School
ETHNIC CODE (IPEDS)
1 2 3 4 5 6 7 8 9 TOTAL
Early Outreach Program 11th Grade 13 1 0 5 0 1 0 0 3 23
10th Grade 20 1 0 12 0 0 2 0 2 37
9th Grade 21 0 0 24 0 0 5 0 0 50
8th Grade 15 1 2 8 0 0 3 0 2 31
Early Outreach Program Total 69 3 2 49 0 1 10 0 7 141
GEAR UP Ottumwa 7th Grade 13 0 1 3 0 3 37 0 0 57
GEAR UP Ottumwa Total 13 0 1 3 0 3 37 0 0 57
Meskwaki Settlement School 12th Grade 0 6 0 0 0 0 0 0 0 6
Meskwaki Settlement School Total
0 6 0 0 0 0 0 0 0 6
Storm Lake Juntos Program 12th Grade 6 0 0 0 0 0 0 0 0 6
11th Grade 2 0 0 0 0 0 0 0 1 3
10th Grade 2 0 0 0 0 0 0 0 0 2
9th Grade 1 0 0 0 0 0 0 0 1 2
Storm Lake Juntos Program Total
11 0 0 0 0 0 0 0 2 13
Community Youth Concepts 11th Grade 0 0 0 2 0 1 0 0 0 3
10th Grade 0 0 0 2 0 0 0 0 0 2
9th Grade 0 0 0 3 0 0 0 0 1 4
8th Grade 2 0 0 1 0 1 0 0 0 4
7th Grade 1 0 0 1 0 0 0 0 0 2
6th Grade 0 0 0 1 0 0 0 0 0 1
Community Youth Concepts Total
3 0 0 10 0 2 0 0 1 16
IOWA STATE UNIVERSITY COLLEGE BOUND/IMAGES ANNUAL REPORT
2014-2015
19
dg/h/aa/sfa/15-16/14-15 report
12/7/2015@9:39:40 AM
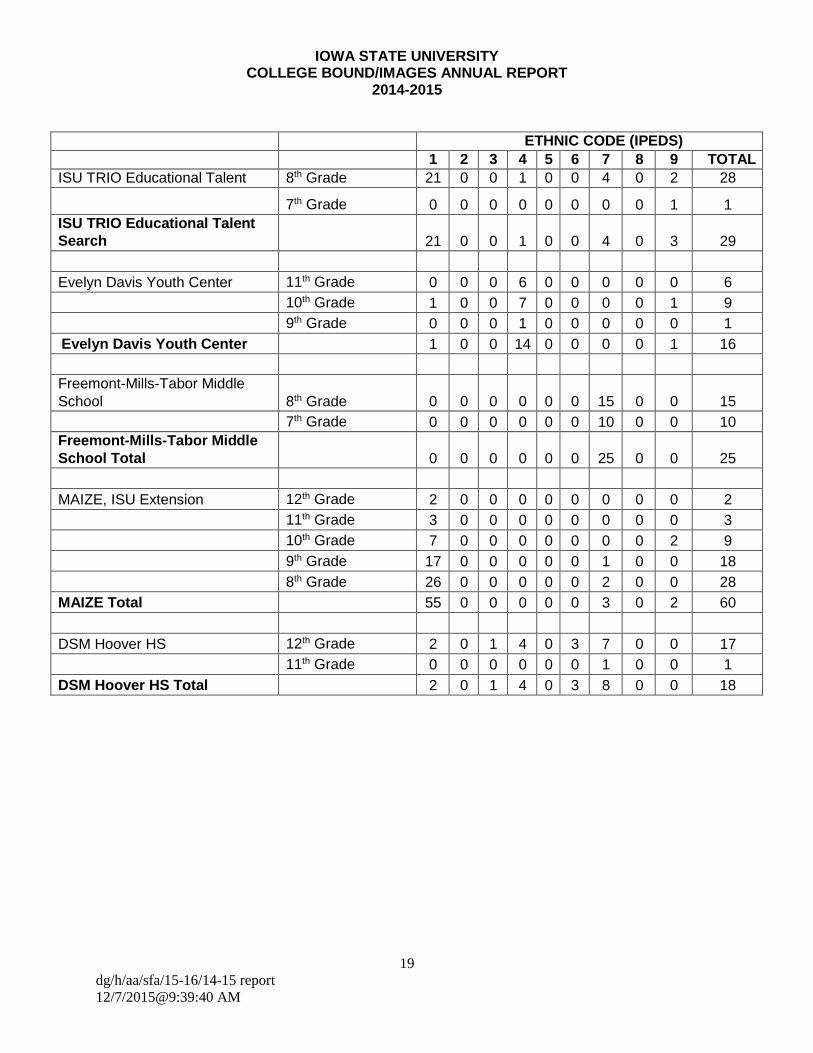
ETHNIC CODE (IPEDS)
1 2 3 4 5 6 7 8 9 TOTAL
ISU TRIO Educational Talent
Search
8th Grade 21 0 0 1 0 0 4 0 2 28
7th Grade
0
0
0
0
0
0
0
0
1
1
ISU TRIO Educational Talent
Search TOTAL
21
0
0
1
0
0
4
0
3
29
Evelyn Davis Youth Center 11th Grade 0 0 0 6 0 0 0 0 0 6
10th Grade 1 0 0 7 0 0 0 0 1 9
9th Grade 0 0 0 1 0 0 0 0 0 1
Evelyn Davis Youth Center Total
1 0 0 14 0 0 0 0 1 16
Freemont-Mills-Tabor Middle
School 8th Grade
0
0
0
0
0
0
15
0
0
15
7th Grade 0 0 0 0 0 0 10 0 0 10
Freemont-Mills-Tabor Middle School Total
0
0
0
0
0
0
25
0
0
25
MAIZE, ISU Extension 12th Grade 2 0 0 0 0 0 0 0 0 2
11th Grade 3 0 0 0 0 0 0 0 0 3
10th Grade 7 0 0 0 0 0 0 0 2 9
9th Grade 17 0 0 0 0 0 1 0 0 18
8th Grade 26 0 0 0 0 0 2 0 0 28
MAIZE Total 55 0 0 0 0 0 3 0 2 60
DSM Hoover HS 12th Grade 2 0 1 4 0 3 7 0 0 17
11th Grade 0 0 0 0 0 0 1 0 0 1
DSM Hoover HS Total 2 0 1 4 0 3 8 0 0 18
IOWA STATE UNIVERSITY COLLEGE BOUND/IMAGES ANNUAL REPORT
2014-2015
20
dg/h/aa/sfa/15-16/14-15 report
12/7/2015@9:39:40 AM
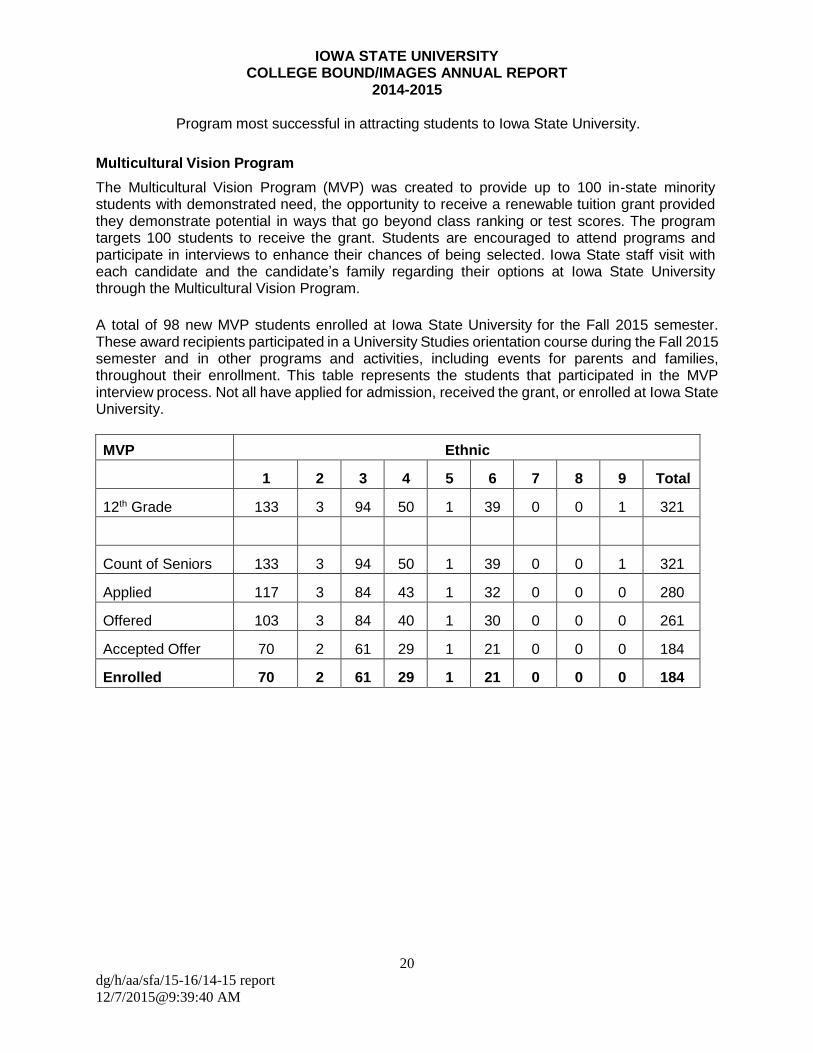
Program most successful in attracting students to Iowa State University. Multicultural Vision Program The Multicultural Vision Program (MVP) was created to provide up to 100 in-state minority students with demonstrated need, the opportunity to receive a renewable tuition grant provided they demonstrate potential in ways that go beyond class ranking or test scores. The program targets 100 students to receive the grant. Students are encouraged to attend programs and participate in interviews to enhance their chances of being selected. Iowa State staff visit with each candidate and the candidate’s family regarding their options at Iowa State University through the Multicultural Vision Program.
A total of 98 new MVP students enrolled at Iowa State University for the Fall 2015 semester. These award recipients participated in a University Studies orientation course during the Fall 2015 semester and in other programs and activities, including events for parents and families, throughout their enrollment. This table represents the students that participated in the MVP interview process. Not all have applied for admission, received the grant, or enrolled at Iowa State University. MVP
Ethnic Codes
1
2
3
4
5
6
7
8
9
Total 12th Grade
133
3
94
50
1
39
0
0
1
321
Count of Seniors
133
3
94
50
1
39
0
0
1
321
Applied
117
3
84
43
1
32
0
0
0
280
Offered
103
3
84
40
1
30
0
0
0
261
Accepted Offer
70
2
61
29
1
21
0
0
0
184
Enrolled
70
2
61
29
1
21
0
0
0
184
IOWA STATE UNIVERSITY COLLEGE BOUND/IMAGES ANNUAL REPORT
2014-2015
21
dg/h/aa/sfa/15-16/14-15 report
12/7/2015@9:39:40 AM
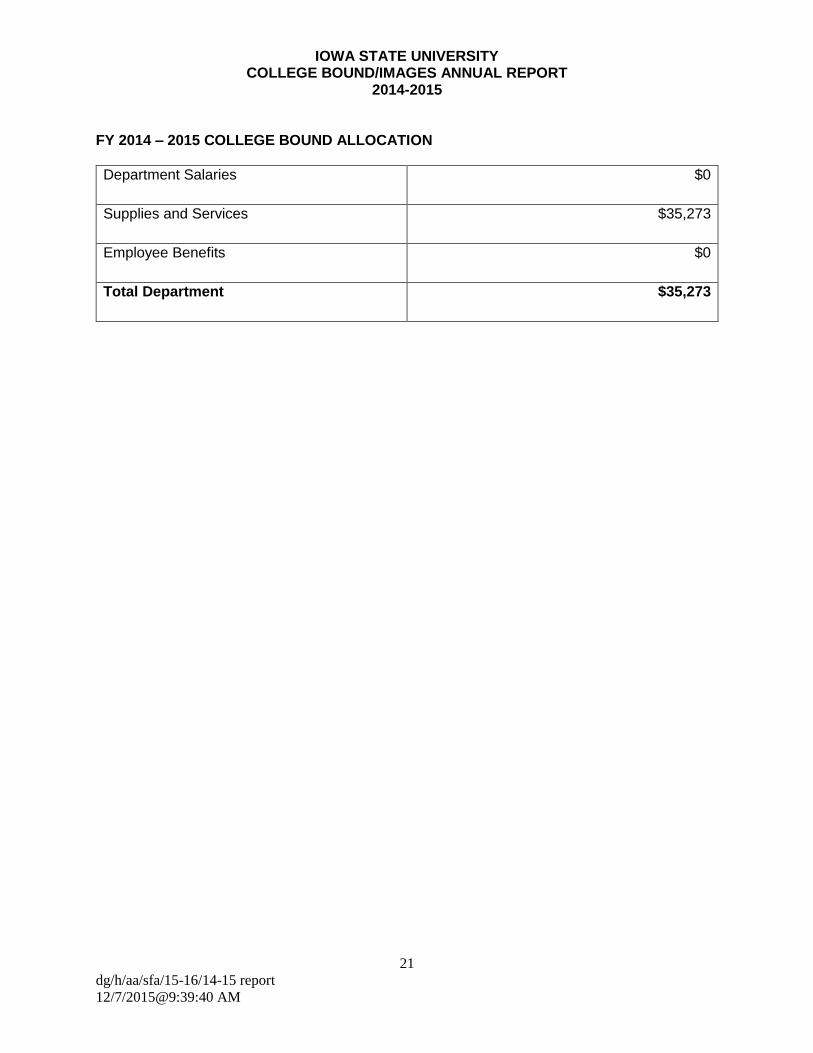
FY 2014 – 2015 COLLEGE BOUND ALLOCATION
Department Salaries $0
Supplies and Services $35,273
Employee Benefits $0
Total Department $35,273
IOWA STATE UNIVERSITY COLLEGE BOUND/IMAGES ANNUAL REPORT
2014-2015
22
dg/h/aa/sfa/15-16/14-15 report
12/7/2015@9:39:40 AM
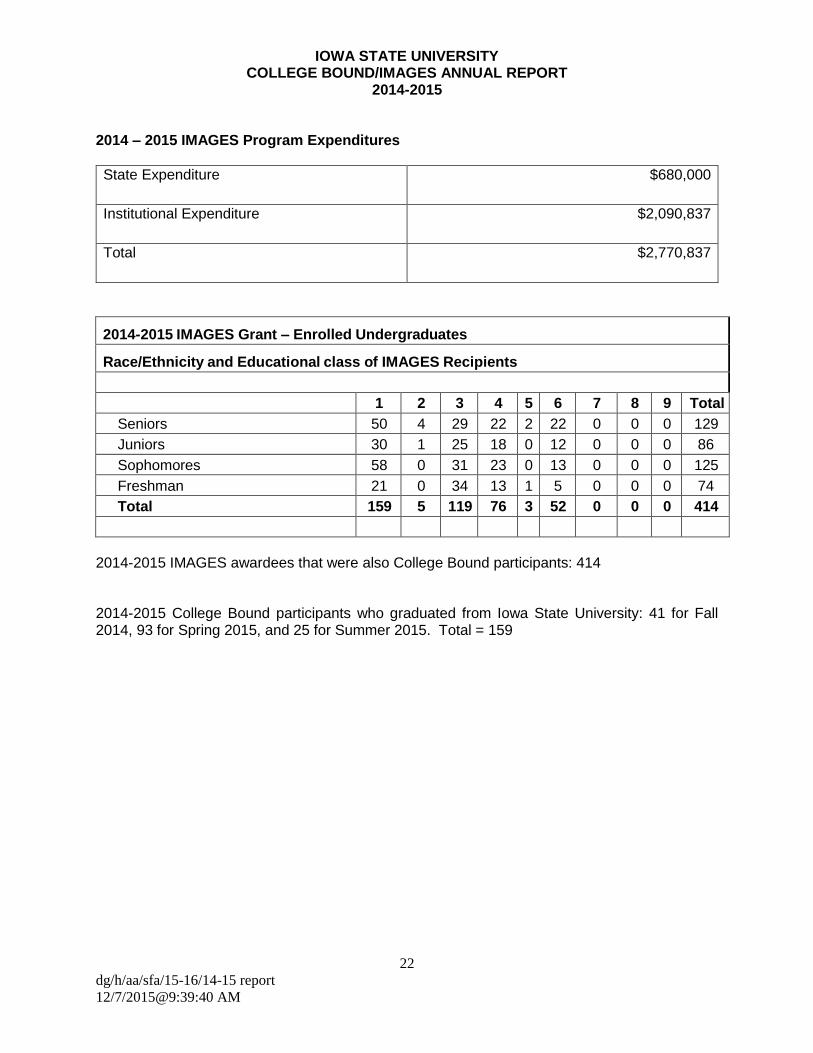
2014 – 2015 IMAGES Program Expenditures
State Expenditure $680,000
Institutional Expenditure $2,090,837
Total $2,770,837
2014-2015 IMAGES Grant – Enrolled Undergraduates
Race/Ethnicity and Educational class of IMAGES Recipients
1 2 3 4 5 6 7 8 9 Total
Seniors 50 4 29 22 2 22 0 0 0 129
Juniors 30 1 25 18 0 12 0 0 0 86
Sophomores 58 0 31 23 0 13 0 0 0 125
Freshman 21 0 34 13 1 5 0 0 0 74
Total 159 5 119 76 3 52 0 0 0 414
2014-2015 IMAGES awardees that were also College Bound participants: 414 2014-2015 College Bound participants who graduated from Iowa State University: 41 for Fall 2014, 93 for Spring 2015, and 25 for Summer 2015. Total = 159
IOWA STATE UNIVERSITY COLLEGE BOUND/IMAGES ANNUAL REPORT
2014-2015
23
dg/h/aa/sfa/15-16/14-15 report
12/7/2015@9:39:40 AM
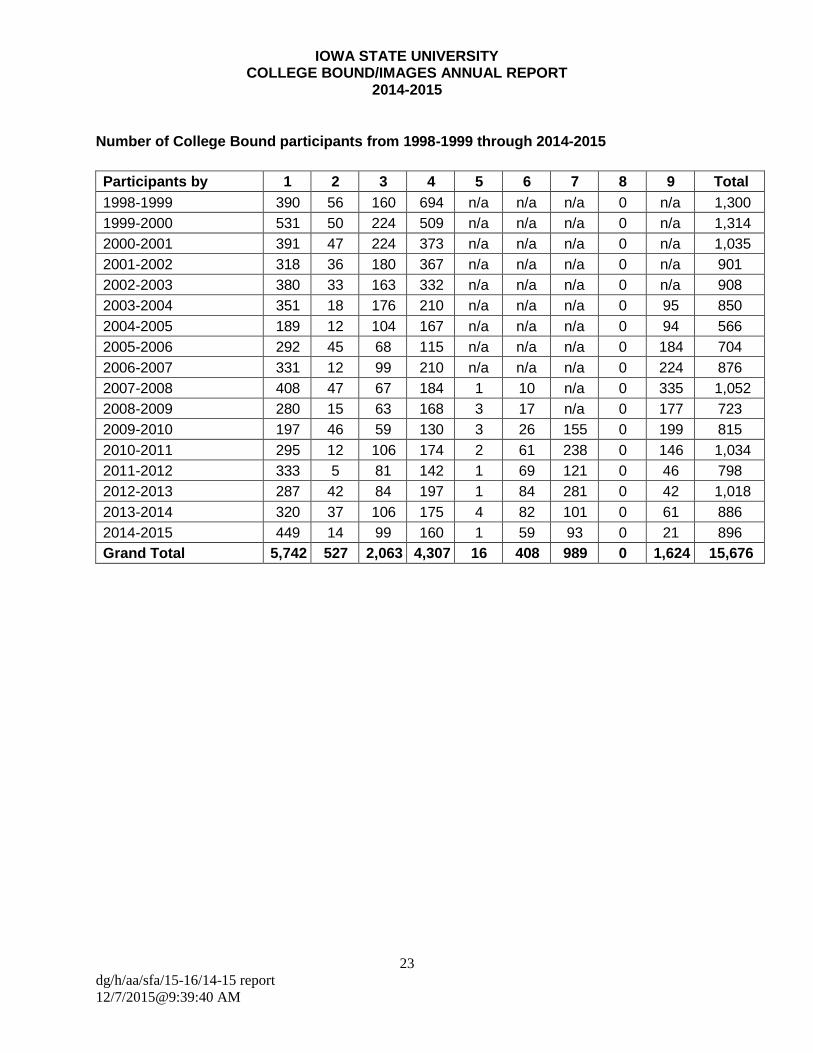
Number of College Bound participants from 1998-1999 through 2014-2015
Participants by Ethnicity
1 2 3 4 5 6 7 8 9 Total
1998-1999 390 56 160 694 n/a n/a n/a 0 n/a 1,300
1999-2000 531 50 224 509 n/a n/a n/a 0 n/a 1,314
2000-2001 391 47 224 373 n/a n/a n/a 0 n/a 1,035
2001-2002 318 36 180 367 n/a n/a n/a 0 n/a 901
2002-2003 380 33 163 332 n/a n/a n/a 0 n/a 908
2003-2004 351 18 176 210 n/a n/a n/a 0 95 850
2004-2005 189 12 104 167 n/a n/a n/a 0 94 566
2005-2006 292 45 68 115 n/a n/a n/a 0 184 704
2006-2007 331 12 99 210 n/a n/a n/a 0 224 876
2007-2008 408 47 67 184 1 10 n/a 0 335 1,052
2008-2009 280 15 63 168 3 17 n/a 0 177 723
2009-2010 197 46 59 130 3 26 155 0 199 815
2010-2011 295 12 106 174 2 61 238 0 146 1,034
2011-2012 333 5 81 142 1 69 121 0 46 798
2012-2013 287 42 84 197 1 84 281 0 42 1,018
2013-2014 320 37 106 175 4 82 101 0 61 886
2014-2015 449 14 99 160 1 59 93 0 21 896
Grand Total 5,742 527 2,063 4,307 16 408 989 0 1,624 15,676
IOWA STATE UNIVERSITY COLLEGE BOUND/IMAGES ANNUAL REPORT
2014-2015
24
dg/h/aa/sfa/15-16/14-15 report
12/7/2015@9:39:40 AM
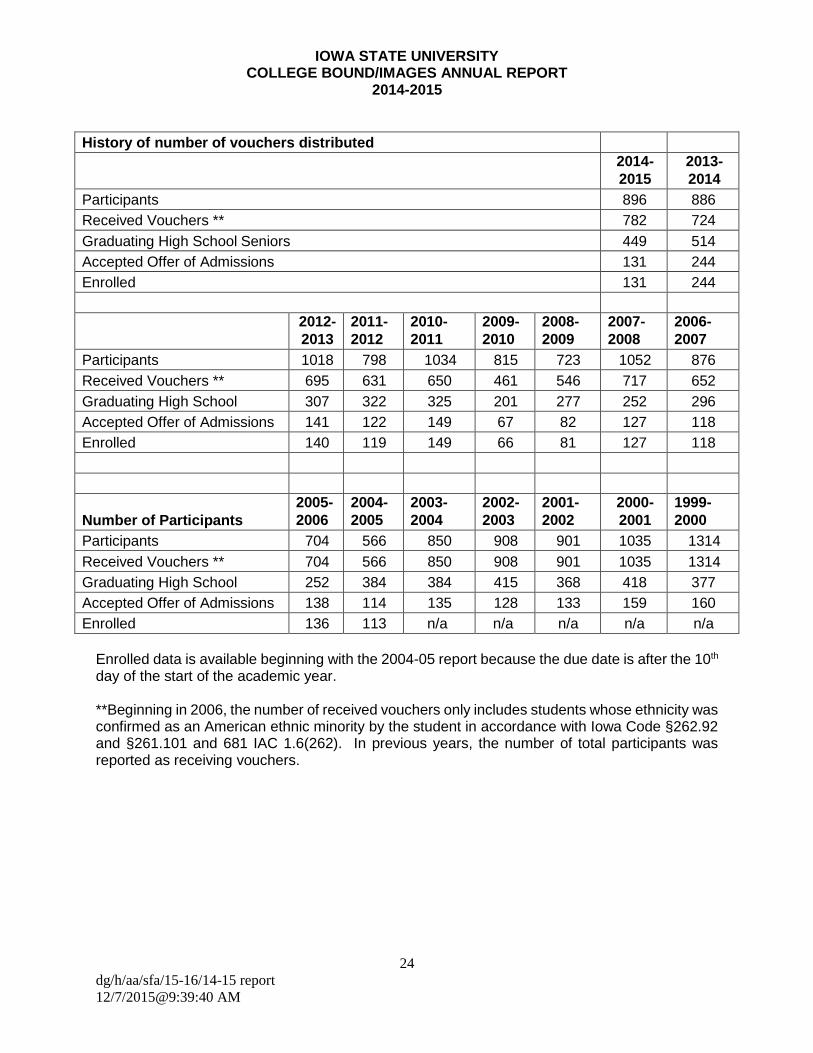
History of number of vouchers distributed
2014- 2015
2013- 2014
Participants 896 886
Received Vouchers ** 782 724
Graduating High School Seniors 449 514
Accepted Offer of Admissions 131 244
Enrolled 131 244
2012- 2013
2011- 2012
2010- 2011
2009- 2010
2008- 2009
2007- 2008
2006- 2007
Participants 1018 798 1034 815 723 1052 876
Received Vouchers ** 695 631 650 461 546 717 652
Graduating High School Seniors
307 322 325 201 277 252 296
Accepted Offer of Admissions 141 122 149 67 82 127 118
Enrolled 140 119 149 66 81 127 118
Number of Participants (cont'd)
2005- 2006
2004- 2005
2003- 2004
2002- 2003
2001- 2002
2000- 2001
1999- 2000
Participants 704 566 850 908 901 1035 1314
Received Vouchers ** 704 566 850 908 901 1035 1314
Graduating High School Seniors
252 384 384 415 368 418 377
Accepted Offer of Admissions 138 114 135 128 133 159 160
Enrolled 136 113 n/a n/a n/a n/a n/a
Enrolled data is available beginning with the 2004-05 report because the due date is after the 10th day of the start of the academic year. **Beginning in 2006, the number of received vouchers only includes students whose ethnicity was confirmed as an American ethnic minority by the student in accordance with Iowa Code §262.92 and §261.101 and 681 IAC 1.6(262). In previous years, the number of total participants was reported as receiving vouchers.
UNIVERSITY OF NORTHERN IOWA COLLEGE BOUND/IMAGES ANNUAL REPORT
2014-2015
25
dg/h/aa/sfa/15-16/14-15 report
12/7/2015@9:39:40 AM
The University of Northern Iowa’s Office of Admissions, in support of the College Bound Program, incorporates recruitment efforts of traditional and non-traditional activities designed to inform and encourage students of color to pursue higher education. Students identified in high school visits, various visitation programs, co-sponsored programs, community outreach programs, activities conducted by the university, and referrals from faculty, alumni, and community members are entered into the university’s student information system (SIS). The Customer Relations Management module of the SIS system is utilized to provide on-going informational mailings and other communications to students and parents from initial inquiry to actual enrollment at UNI. The assistant director of multicultural recruitment position in the Office of Admissions oversees the College Bound Program. Responsibilities include coordinating efforts with the strategic plan, working with other admissions staff and campus partners to coordinate campus programs, and visiting high schools across the state to increase the number of College Bound participants served by UNI. An admissions counselor assists with delivery of multicultural recruitment initiatives. An Outreach Team consisting of recruiters from the academic colleges and led by the assistant director meets monthly to maintain a centralized focus on multicultural recruitment efforts across the university and to share the different efforts being implemented to recruit students of color from each college. The Ethnic Student Promoters (ESP) is a group of current UNI students from culturally diverse backgrounds who work with the Office of Admissions’ multicultural recruitment efforts. These students assist with campus visits, community programs, provide campus tours, host visitors for lunch, and participate in panels which allow them to share their perspective on college life at UNI. ESP students are role models, excellent representatives of the university and serve as connections to their home communities, high schools and/or community colleges. Campus Visits Campus visit programs are conducted throughout the year for college bound students. Programs include information on admission requirements, application process, applying for scholarships, financial aid, student support services, Jump Start Orientation, campus tour, lunch, and question and answer time with an ESP student panel. Program formats include:
Individual Campus Visits Individual campus visits include an appointment with an admissions counselor, campus tour and lunch in the dining center. Individual appointments cover admission requirements, financial aid information, major requirements, answers to posed questions, and, when requested, a visit with faculty. These visits are personalized to the students.
Group Visits Opportunities are provided throughout the year for TRiO, Gear Up, AVID, IJAG, high school groups and community-based organizations to bring groups to visit campus. Students are provided a presentation on admissions, financial aid, housing, student life, tour and lunch. Agendas are adapted to accommodate each group’s travel schedule.
UNIVERSITY OF NORTHERN IOWA COLLEGE BOUND/IMAGES ANNUAL REPORT
2014-2015
26
dg/h/aa/sfa/15-16/14-15 report
12/7/2015@9:39:40 AM
Multicultural Panther Open House Day Staff from UNI’s Office of Admissions, four academic colleges, financial aid and department of residence collaborates for this campus visit day that introduces students in grades 9-12 to UNI’s academic programs, living opportunities, admission and financial aid processes. Ethnic student organizations provide a browse session for visitors to become acquainted with ways to connect with others who have similar interests and backgrounds. The Ethnic Student Promoters provide escorts, tour guides, student panels, and the much needed connection to the prospective students of color.
Job Shadowing UNI’s Center for Urban Education (UNI-CUE) Talent Search Program brings students to campus to shadow faculty and staff. Students are matched with occupational interests to experience a typical job day. Examples include baking in the department of residence, being a department director, Physics faculty, and working in admissions. Students have set questions to ask while shadowing to help them understand what skills are needed for a given profession. While on campus students are given an admissions presentation, tour, and lunch. Up Close Multicultural Breakfast UNI holds two Up Close events for admitted seniors and transfers in February. Admitted multicultural students and their parents are invited to a breakfast where UNI faculty and staff talk with them individually. This campus-wide open house provides opportunities to learn more about individual majors and participate in interactive activities within academic departments. Students and parents may also meet with financial aid staff, contract for campus housing and sign up for summer orientation. College Fairs Each year UNI staff participates in college fairs across Iowa. Students have the opportunity to visit with an admissions or academic college representative and fill out a contact card which allows them to go into our student information system. These fairs are sponsored by the Iowa Association for College Admission Counseling, educational institutions and community-based organizations throughout the state. In 2014-2015 the assistant director for multicultural recruitment attended college fairs designed to recruit students of color from Polk County, one of Iowa’s most diverse counties. Community Outreach Events
I’ll Make Me a World in Iowa UNI is a Gold sponsor for this annual event in Des Moines, Iowa. In 2014-2015, UNI participated in the festival’s two-day activities. The first day was an education day which included a college fair, Black History Month trivia competition and numerous sessions on academic and career areas. The next day consisted of an all-day tabling opportunity where the Ethnic Student Promoters were the only multicultural student organization represented and much community outreach was achieved. The assistant director of multicultural recruitment, along with the support of the coordinator of orientation and ESP students, participated in all facets of both days including the college fair and successfully conducted the only completely student-led academic session.
UNIVERSITY OF NORTHERN IOWA COLLEGE BOUND/IMAGES ANNUAL REPORT
2014-2015
27
dg/h/aa/sfa/15-16/14-15 report
12/7/2015@9:39:40 AM
TRiO UNI actively works with TRiO programs throughout the state. Admissions collaborated with the UNI-sponsored TRiO programs at the UNI Center for Urban Education (UNI-CUE). The assistant director spoke to classes with Educational Talent Search about making good decisions as they prepare to attend college, participated on a multi-school panel representing UNI and developed relationships with the participants by attending their multiple internal student development activities and lunches. The assistant director also spoke to the Upward Bound Summer Bridge program about preparation for college. In 2014-2015, new initiatives were created to deliberately recruit these participants. A program that consisted of several college focused workshops, using the Admissions Office staff, was conducted to expose students to unfamiliar areas of campus while teaching many significant lessons about college preparation. That event’s conclusion gave the participants the rare opportunity to meet all of the admissions staff. For the first time, the admissions staff was invited to the Upward Bound picnic. Close contact is maintained with the program directors at UNI-CUE. This year, frequent meetings were held with the directors and assistant director to collaborate the facilitation of the more purposeful recruitment efforts. There was participation in celebratory events such as the Equal Opportunity Center’s luncheon for the high achievement of its non-traditional students and the Upward Bound graduation dinner. The assistant director also presented at TRIO’s 2014 Student Leadership Conference where ESP students served as escorts and tour guides for TRIO groups across Iowa. Gear Up UNI is a Gear Up partner in the new state grant. We provide on-campus visits for partner schools throughout the state of Iowa. The visit includes college readiness, financial aid, college majors, student panel, campus tour and optional academic activity and lunch in a dining center.
Hispanic/Latino Parent Outreach In efforts to reach the Hispanic/Latino parents, the admissions counselor for multicultural recruitment delivered an admissions presentation in Spanish to Hispanic/Latino parents at South Tama High School in fall 2014. This session was to inform the parents about the admissions process, academic programs, scholarship opportunities, and upcoming deadlines. The admissions counselor returned in spring 2015 with the assistance of a bilingual UNI financial aid specialist and UNI faculty to inform the parents of the Free Application for Federal Student Aid (FAFSA), local scholarship opportunities, how to understand a financial aid award, among other things. The same event will be done next year at South Tama High School as well as West Liberty High School. The UNI “Path to Financial Aid” brochure was translated to Spanish with collaboration from the UNI financial aid specialist, admissions counselor for multicultural recruitment, and the UNI Spanish department in order to reach Hispanic/Latino parents who do not necessarily read or comprehend English.

UNIVERSITY OF NORTHERN IOWA COLLEGE BOUND/IMAGES ANNUAL REPORT
2014-2015
28
dg/h/aa/sfa/15-16/14-15 report
12/7/2015@9:39:40 AM
High School Visits Each year admissions representatives visit high schools to speak with prospective students about UNI. During these visits the admissions process, financial aid, scholarships, housing, and student life are discussed. Student contact information is collected and they are encouraged to visit campus. To serve our local community, members of the admissions staff visited Waterloo East and West High Schools on a monthly basis (during fall and spring) to speak with students about UNI. Cedar Falls High School initiated a Black Boys and Girls Group with monthly sessions. The assistant director met regularly with the group throughout the year to facilitate the student developed discussion topics. Also, the assistant director works with the lead counselors of that program to discuss the future presentation opportunities, goals and recruitment of these students to UNI. College Bound participants by race/ethnicity and grade level See Table F2. College Bound participants by race/ethnicity who received vouchers See Table E2. Promotion of College Bound activities to students and parents Events are promoted to students in a variety of ways based upon the type of event and who is sponsoring it. When student information is collected from the various programs and activities it is entered into the university student information system database and is used to identify prospective students for future college bound and recruitment events. Students are sent information to indicate when counselors will visit their specific high schools, attend a college fair in their area, and invite them to visit campus. We work closely with community programs such as TRiO and Gear Up to bring groups of students to campus or to provide programs in interested communities. We are also working to develop a stronger presence in minority communities by co-sponsoring programs. Individual students and parents are sent personalized letters of invitation to attend community outreach programs, make individual campus visits, attend UNI Panther Open House Days and/or attend UNI Up Close for admitted students. Community leaders and high school personnel, working with multicultural students, are identified for assistance to encourage parental involvement in outreach programs. Parental involvement includes chaperoning groups that visit campus and co-sponsored events and participates in activities provided for visiting students. Parents also accompany students to community events and college fairs. Parents are encouraged to attend activities with their student. Specific sessions are conducted for parents regarding financial aid, options for students not meeting standard admission requirements, housing, etc. Budget The original allocation of College Bound money to the University of Northern Iowa was $80,000. See Table B.

UNIVERSITY OF NORTHERN IOWA COLLEGE BOUND/IMAGES ANNUAL REPORT
2014-2015
29
dg/h/aa/sfa/15-16/14-15 report
12/7/2015@9:39:40 AM
Effectiveness of the College Bound Activities
Number of students reached 453 of the 1,513 participants received vouchers. Only the grade 12 students were identified to receive vouchers. Younger students will receive the vouchers during their senior year of high school. See Table E
Number of College Bound participants who applied to Regent Universities A total of 492 minority College Bound participants applied to UNI. Number of College Bound participants who were accepted by Regent Universities A total of 366 minority College Bound participants were accepted by UNI. Number of College Bound participants who enrolled at Regent Universities A total of 163 College Bound participants enrolled UNI.
Students earned certificates from programs conducted, including programs prior to 2014-2015, from one of the three Regent institutions. Students who attended programs and received vouchers from the other Regent institutions have been identified and noted in the numbers above.
Number of College Bound participants who graduated from UNI A total of 27 College Bound participants graduated from UNI
Successful Activities Campus Visit For college bound students, the campus visit is the most important element in the decision making process. During a campus visit, prospective students learn about the admissions and financial aid processes. They also have the opportunity to tour the campus to see residence halls, classrooms, and the dining facilities. UNI Ethnic Student Promoters assist in these visits by guiding prospective students, parents, and counselors on campus tours, accompanying them to lunch in a dining center, and presenting ‘life as a UNI student.’ The focus of each visit is to provide students with adequate information on UNI while helping them understand the importance of pursuing higher education. Multicultural Panther Open House Day and group visits by TRIO and Gear Up programs are effective visit efforts.
UNI Up Close Multicultural Breakfast During the February UNI Up Close Program for admitted seniors, the multicultural students and parents are invited to a multicultural breakfast that precedes the campus open house. Faculty and staff members from throughout campus provide information on financial aid, Student Support Services, and Jumpstart Orientation Program. A brochure is given with information concerning on-campus multicultural support networks. The Ethnic Student Promoters attend the breakfast to make students feel welcome. Prospective students and parents have the opportunity to meet and network with some of the minority faculty and staff members and current students throughout the campus.
UNIVERSITY OF NORTHERN IOWA COLLEGE BOUND/IMAGES ANNUAL REPORT
2014-2015
30
dg/h/aa/sfa/15-16/14-15 report
12/7/2015@9:39:40 AM
Community College Transfers Community colleges with substantial minority enrollments are targeted for special minority visits. Contact is made with the minority advisors (when available) or designated counselors to inform them of upcoming events. Students identified are entered into the enrollment tracking system which ensures they receive appropriate information.
Multicultural Recruitment Guide The multicultural recruitment guide is a supplemental piece the students receive once they are entered into UNI’s student information system. This piece includes minority specific information regarding scholarship and grants, orientation, diversity programs, and student support. IMAGES
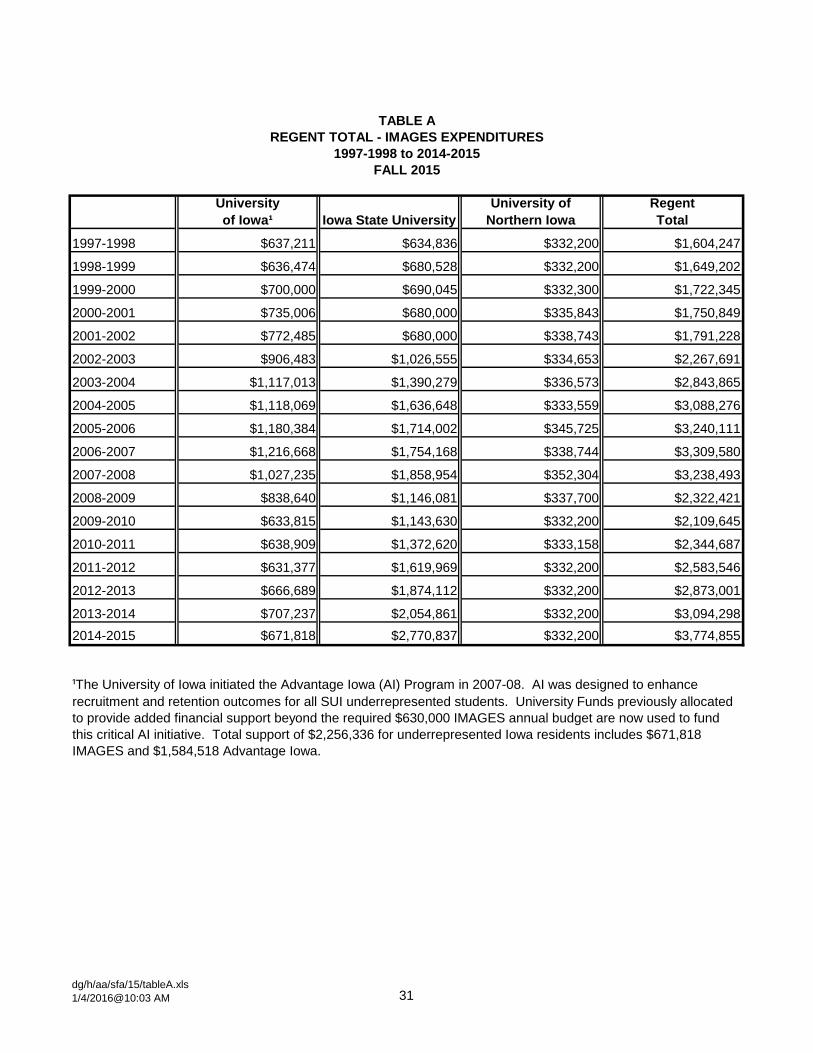
2014-2015 IMAGES expenditures for UNI (See Table A)
There are 29 IMAGES awardees that are also College Bound Voucher recipients
The total expenditures for IMAGES awardees that were College Bound recipients are $50,351
Number of IMAGES recipients by race/ethnicity and by educational level (See Tables C2 and D)
University
of Iowa¹ Iowa State University
University of
Northern Iowa
Regent
Total
1997-1998 $637,211 $634,836 $332,200 $1,604,247
1998-1999 $636,474 $680,528 $332,200 $1,649,202
1999-2000 $700,000 $690,045 $332,300 $1,722,345
2000-2001 $735,006 $680,000 $335,843 $1,750,849
2001-2002 $772,485 $680,000 $338,743 $1,791,228
2002-2003 $906,483 $1,026,555 $334,653 $2,267,691
2003-2004 $1,117,013 $1,390,279 $336,573 $2,843,865
2004-2005 $1,118,069 $1,636,648 $333,559 $3,088,276
2005-2006 $1,180,384 $1,714,002 $345,725 $3,240,111
2006-2007 $1,216,668 $1,754,168 $338,744 $3,309,580
2007-2008 $1,027,235 $1,858,954 $352,304 $3,238,493
2008-2009 $838,640 $1,146,081 $337,700 $2,322,421
2009-2010 $633,815 $1,143,630 $332,200 $2,109,645
2010-2011 $638,909 $1,372,620 $333,158 $2,344,687
2011-2012 $631,377 $1,619,969 $332,200 $2,583,546
2012-2013 $666,689 $1,874,112 $332,200 $2,873,001
2013-2014 $707,237 $2,054,861 $332,200 $3,094,298
2014-2015 $671,818 $2,770,837 $332,200 $3,774,855
TABLE A
REGENT TOTAL - IMAGES EXPENDITURES
1997-1998 to 2014-2015
¹The University of Iowa initiated the Advantage Iowa (AI) Program in 2007-08. AI was designed to enhance
recruitment and retention outcomes for all SUI underrepresented students. University Funds previously allocated
to provide added financial support beyond the required $630,000 IMAGES annual budget are now used to fund
this critical AI initiative. Total support of $2,256,336 for underrepresented Iowa residents includes $671,818
IMAGES and $1,584,518 Advantage Iowa.
FALL 2015
dg/h/aa/sfa/15/tableA.xls
1/4/2016@10:03 AM 31

University
of Iowa
Iowa State
University
University of
Northern Iowa
Regent
Total
1997-1998 $80,000 $80,000
1998-1999 $80,000 $80,000
1999-2000 $100,000 $92,066 $80,000 $272,066
2000-2001 $110,000 $95,526 $80,000 $285,526
2001-2002 $110,000 $94,734 $80,000 $284,734
2002-2003 $110,000 $82,846 $80,000 $272,846
2003-2004 $119,000 $35,273 $80,000 $234,273
2004-2005 $121,000 $35,273 $80,000 $236,273
2005-2006 $124,000 $35,273 $80,000 $239,273
2006-2007 $121,000 $35,273 $80,000 $236,273
2007-2008 $123,855 $35,273 $80,000 $239,128
2008-2009 $119,944 $35,273 $80,000 $235,217
2009-2010 $121,235 $35,273 $80,000 $236,508
2010-2011 $118,607 $35,273 $80,000 $233,880
2011-2012 $113,120 $35,273 $80,000 $228,393
2012-2013 $113,493 $35,273 $80,000 $228,766
2013-2014 $115,130 $35,273 $80,000 $230,403
2014-2015 $128,485 $35,273 $80,000 $243,758
TABLE B
REGENT TOTAL - COLLEGE BOUND EXPENDITURES
1997-1998 to 2014-2015
FALL 2015
dg/h/aa/sfa/15/tableB.xls
1/4/2016@10:03 AM 35
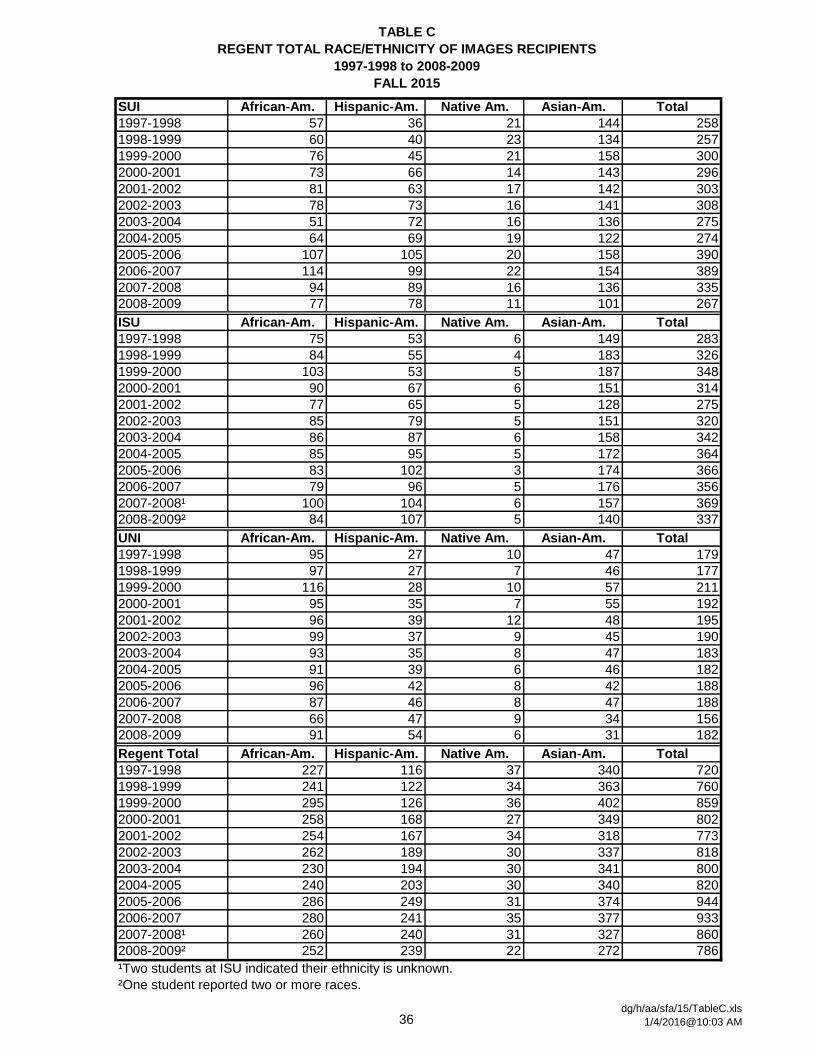
TABLE C
REGENT TOTAL RACE/ETHNICITY OF IMAGES RECIPIENTS
1997-1998 to 2008-2009
FALL 2015
SUI African-Am. Hispanic-Am. Native Am. Asian-Am. Total
1997-1998 57 36 21 144 258
1998-1999 60 40 23 134 257
1999-2000 76 45 21 158 300
2000-2001 73 66 14 143 296
2001-2002 81 63 17 142 303
2002-2003 78 73 16 141 308
2003-2004 51 72 16 136 275
2004-2005 64 69 19 122 274
2005-2006 107 105 20 158 390
2006-2007 114 99 22 154 389
2007-2008 94 89 16 136 335
2008-2009 77 78 11 101 267
ISU African-Am. Hispanic-Am. Native Am. Asian-Am. Total
1997-1998 75 53 6 149 283
1998-1999 84 55 4 183 326
1999-2000 103 53 5 187 348
2000-2001 90 67 6 151 314
2001-2002 77 65 5 128 275
2002-2003 85 79 5 151 320
2003-2004 86 87 6 158 342
2004-2005 85 95 5 172 364
2005-2006 83 102 3 174 366
2006-2007 79 96 5 176 356
2007-2008¹ 100 104 6 157 369
2008-2009² 84 107 5 140 337
UNI African-Am. Hispanic-Am. Native Am. Asian-Am. Total
1997-1998 95 27 10 47 179
1998-1999 97 27 7 46 177
1999-2000 116 28 10 57 211
2000-2001 95 35 7 55 192
2001-2002 96 39 12 48 195
2002-2003 99 37 9 45 190
2003-2004 93 35 8 47 183
2004-2005 91 39 6 46 182
2005-2006 96 42 8 42 188
2006-2007 87 46 8 47 188
2007-2008 66 47 9 34 156
2008-2009 91 54 6 31 182
Regent Total African-Am. Hispanic-Am. Native Am. Asian-Am. Total
1997-1998 227 116 37 340 720
1998-1999 241 122 34 363 760
1999-2000 295 126 36 402 859
2000-2001 258 168 27 349 802
2001-2002 254 167 34 318 773
2002-2003 262 189 30 337 818
2003-2004 230 194 30 341 800
2004-2005 240 203 30 340 820
2005-2006 286 249 31 374 944
2006-2007 280 241 35 377 933
2007-2008¹ 260 240 31 327 860
2008-2009² 252 239 22 272 786
¹Two students at ISU indicated their ethnicity is unknown.
²One student reported two or more races.
36dg/h/aa/sfa/15/TableC.xls
1/4/2016@10:03 AM
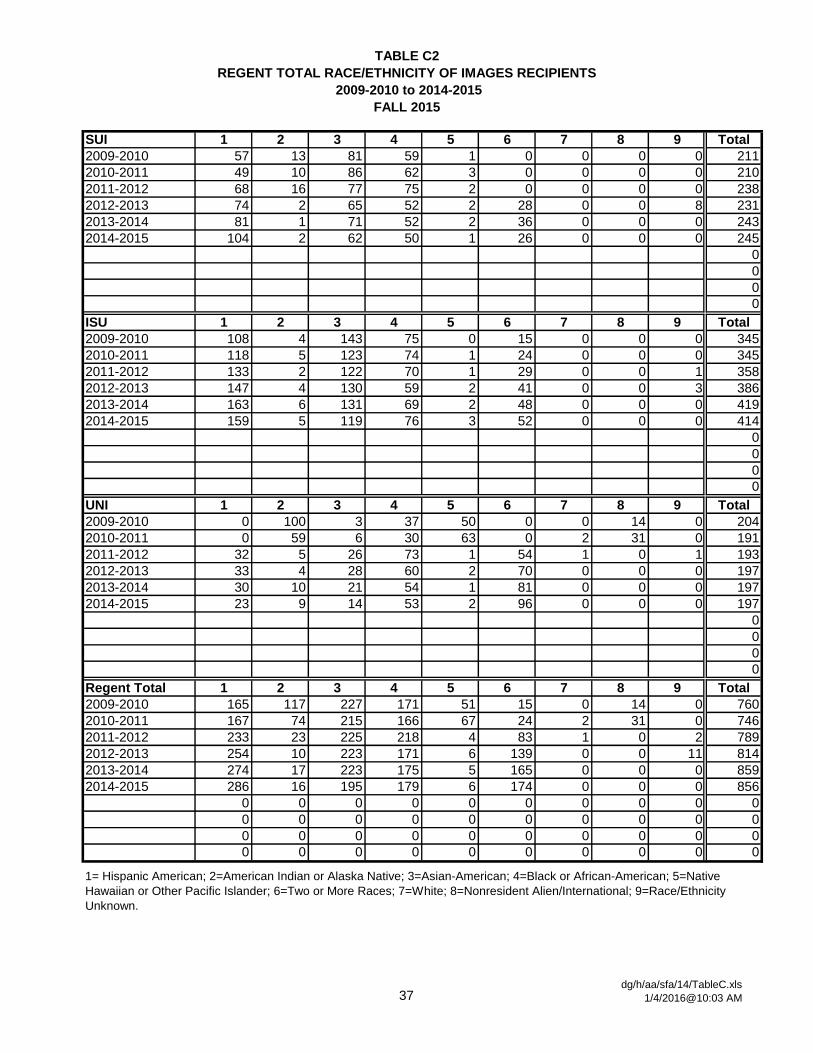
TABLE C2
REGENT TOTAL RACE/ETHNICITY OF IMAGES RECIPIENTS
2009-2010 to 2014-2015
FALL 2015
SUI 1 2 3 4 5 6 7 8 9 Total
2009-2010 57 13 81 59 1 0 0 0 0 211
2010-2011 49 10 86 62 3 0 0 0 0 210
2011-2012 68 16 77 75 2 0 0 0 0 238
2012-2013 74 2 65 52 2 28 0 0 8 231
2013-2014 81 1 71 52 2 36 0 0 0 243
2014-2015 104 2 62 50 1 26 0 0 0 245
0
0
0
0
ISU 1 2 3 4 5 6 7 8 9 Total
2009-2010 108 4 143 75 0 15 0 0 0 345
2010-2011 118 5 123 74 1 24 0 0 0 345
2011-2012 133 2 122 70 1 29 0 0 1 358
2012-2013 147 4 130 59 2 41 0 0 3 386
2013-2014 163 6 131 69 2 48 0 0 0 419
2014-2015 159 5 119 76 3 52 0 0 0 414
0
0
0
0
UNI 1 2 3 4 5 6 7 8 9 Total
2009-2010 0 100 3 37 50 0 0 14 0 204
2010-2011 0 59 6 30 63 0 2 31 0 191
2011-2012 32 5 26 73 1 54 1 0 1 193
2012-2013 33 4 28 60 2 70 0 0 0 197
2013-2014 30 10 21 54 1 81 0 0 0 197
2014-2015 23 9 14 53 2 96 0 0 0 197
0
0
0
0
Regent Total 1 2 3 4 5 6 7 8 9 Total
2009-2010 165 117 227 171 51 15 0 14 0 760
2010-2011 167 74 215 166 67 24 2 31 0 746
2011-2012 233 23 225 218 4 83 1 0 2 789
2012-2013 254 10 223 171 6 139 0 0 11 814
2013-2014 274 17 223 175 5 165 0 0 0 859
2014-2015 286 16 195 179 6 174 0 0 0 856
0 0 0 0 0 0 0 0 0 0
0 0 0 0 0 0 0 0 0 0
0 0 0 0 0 0 0 0 0 0
0 0 0 0 0 0 0 0 0 0
1= Hispanic American; 2=American Indian or Alaska Native; 3=Asian-American; 4=Black or African-American; 5=Native
Hawaiian or Other Pacific Islander; 6=Two or More Races; 7=White; 8=Nonresident Alien/International; 9=Race/Ethnicity
Unknown.
37dg/h/aa/sfa/14/TableC.xls
1/4/2016@10:03 AM
SUI Freshmen Sophomores Juniors Seniors Total
1997-1998 74 64 63 57 258
1998-1999 62 70 70 55 257
1999-2000 44 62 50 144 300
2000-2001 106 53 55 82 296
2001-2002 90 74 77 62 303
2002-2003 89 66 81 72 308
2003-2004 105 81 117 91 394
2004-2005 116 64 98 96 374
2005-2006 110 90 101 89 390
2006-2007 78 71 101 139 389
2007-2008 87 65 108 75 335
2008-2009 62 65 71 69 267
2009-2010 36 33 66 76 211
2010-2011 60 36 60 54 210
2011-2012 68 43 66 61 238
2012-2013 75 35 45 76 231
2013-2014 83 48 61 51 243
2014-2015 70 58 65 52 245
ISU Freshmen Sophomores Juniors Seniors Total
1997-1998 73 37 46 127 283
1998-1999 62 76 80 108 326
1999-2000 97 70 94 87 348
2000-2001 91 67 66 90 314
2001-2002 108 85 42 40 275
2002-2003 106 94 65 55 320
2003-2004 98 99 75 70 342
2004-2005 102 89 90 83 364
2005-2006 111 93 77 85 366
2006-2007 106 94 83 73 356
2007-2008 101 103 81 84 369
2008-2009 97 88 77 75 337
2009-2010 94 93 81 77 345
2010-2011 105 89 84 67 345
2011-2012 88 116 75 79 358
2012-2013 80 111 105 90 386
2013-2014 85 110 104 120 419
2014-2015 74 125 86 129 414
UNI Freshmen Sophomores Juniors Seniors Total
1997-1998 48 26 40 65 179
1998-1999 47 28 45 57 177
1999-2000 50 35 46 80 211
2000-2001 59 33 48 52 192
2001-2002 40 48 40 67 195
2002-2003 34 43 56 57 190
2003-2004 44 31 39 69 183
2004-2005 39 41 33 69 182
2005-2006 52 32 50 54 188
2006-2007 45 34 43 66 188
2007-2008 41 27 34 54 156
2008-2009 55 40 32 55 182
2009-2010 64 43 46 51 204
2010-2011 38 29 44 80 191
2011-2012 29 45 56 63 193
2012-2013 47 35 59 56 197
2013-2014 40 27 56 74 197
2014-2015 75 52 39 31 197
Regent Total Freshmen Sophomores Juniors Seniors Total
1997-1998 195 127 149 249 720
1998-1999 171 174 195 220 760
1999-2000 191 167 190 311 859
2000-2001 256 153 169 224 802
2001-2002 238 207 159 169 773
2002-2003 229 203 202 184 818
2003-2004 247 211 231 230 919
2004-2005 257 194 221 248 920
2005-2006 273 215 228 228 944
2006-2007 229 199 227 278 933
2007-2008 229 195 223 213 860
2008-2009 214 193 180 199 786
2009-2010 194 169 193 204 760
2010-2011 203 154 188 201 746
2011-2012 185 204 197 203 789
2012-2013 202 181 209 222 814
2013-2014 208 185 221 245 859
2014-2015 219 235 190 212 856
REGENT TOTAL - DISTRIBUTION BY EDUCATIONAL LEVEL OF IMAGES AWARDEES
1997-1998 to 2014-2015
TABLE D
FALL 2015
dg/h/aa/sfa/15/tableD.xls
1/4/2016@10:03 AM 38
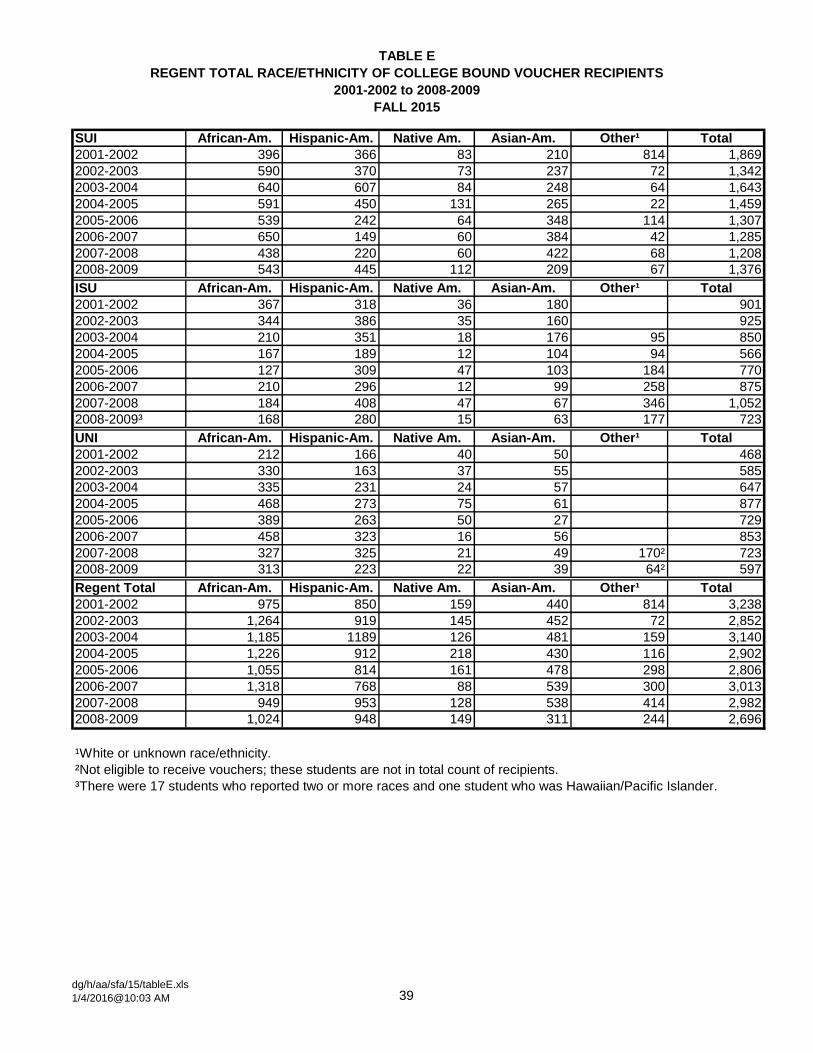
TABLE E
REGENT TOTAL RACE/ETHNICITY OF COLLEGE BOUND VOUCHER RECIPIENTS
2001-2002 to 2008-2009
FALL 2015
SUI African-Am. Hispanic-Am. Native Am. Asian-Am. Other¹ Total
2001-2002 396 366 83 210 814 1,869
2002-2003 590 370 73 237 72 1,342
2003-2004 640 607 84 248 64 1,643
2004-2005 591 450 131 265 22 1,459
2005-2006 539 242 64 348 114 1,307
2006-2007 650 149 60 384 42 1,285
2007-2008 438 220 60 422 68 1,208
2008-2009 543 445 112 209 67 1,376
ISU African-Am. Hispanic-Am. Native Am. Asian-Am. Other¹ Total
2001-2002 367 318 36 180 901
2002-2003 344 386 35 160 925
2003-2004 210 351 18 176 95 850
2004-2005 167 189 12 104 94 566
2005-2006 127 309 47 103 184 770
2006-2007 210 296 12 99 258 875
2007-2008 184 408 47 67 346 1,052
2008-2009³ 168 280 15 63 177 723
UNI African-Am. Hispanic-Am. Native Am. Asian-Am. Other¹ Total
2001-2002 212 166 40 50 468
2002-2003 330 163 37 55 585
2003-2004 335 231 24 57 647
2004-2005 468 273 75 61 877
2005-2006 389 263 50 27 729
2006-2007 458 323 16 56 853
2007-2008 327 325 21 49 170² 723
2008-2009 313 223 22 39 64² 597
Regent Total African-Am. Hispanic-Am. Native Am. Asian-Am. Other¹ Total
2001-2002 975 850 159 440 814 3,238
2002-2003 1,264 919 145 452 72 2,852
2003-2004 1,185 1189 126 481 159 3,140
2004-2005 1,226 912 218 430 116 2,902
2005-2006 1,055 814 161 478 298 2,806
2006-2007 1,318 768 88 539 300 3,013
2007-2008 949 953 128 538 414 2,982
2008-2009 1,024 948 149 311 244 2,696
¹White or unknown race/ethnicity.
²Not eligible to receive vouchers; these students are not in total count of recipients.
³There were 17 students who reported two or more races and one student who was Hawaiian/Pacific Islander.
dg/h/aa/sfa/15/tableE.xls
1/4/2016@10:03 AM 39
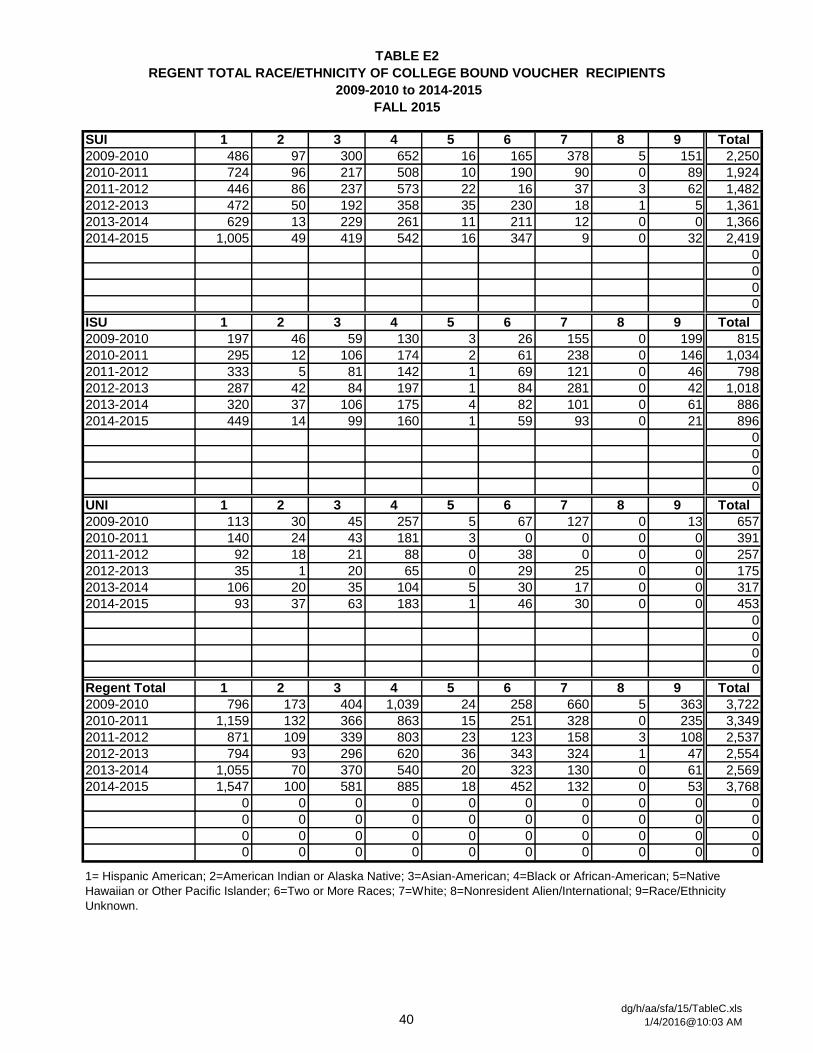
TABLE E2
REGENT TOTAL RACE/ETHNICITY OF COLLEGE BOUND VOUCHER RECIPIENTS
2009-2010 to 2014-2015
FALL 2015
SUI 1 2 3 4 5 6 7 8 9 Total
2009-2010 486 97 300 652 16 165 378 5 151 2,250
2010-2011 724 96 217 508 10 190 90 0 89 1,924
2011-2012 446 86 237 573 22 16 37 3 62 1,482
2012-2013 472 50 192 358 35 230 18 1 5 1,361
2013-2014 629 13 229 261 11 211 12 0 0 1,366
2014-2015 1,005 49 419 542 16 347 9 0 32 2,419
0
0
0
0
ISU 1 2 3 4 5 6 7 8 9 Total
2009-2010 197 46 59 130 3 26 155 0 199 815
2010-2011 295 12 106 174 2 61 238 0 146 1,034
2011-2012 333 5 81 142 1 69 121 0 46 798
2012-2013 287 42 84 197 1 84 281 0 42 1,018
2013-2014 320 37 106 175 4 82 101 0 61 886
2014-2015 449 14 99 160 1 59 93 0 21 896
0
0
0
0
UNI 1 2 3 4 5 6 7 8 9 Total
2009-2010 113 30 45 257 5 67 127 0 13 657
2010-2011 140 24 43 181 3 0 0 0 0 391
2011-2012 92 18 21 88 0 38 0 0 0 257
2012-2013 35 1 20 65 0 29 25 0 0 175
2013-2014 106 20 35 104 5 30 17 0 0 317
2014-2015 93 37 63 183 1 46 30 0 0 453
0
0
0
0
Regent Total 1 2 3 4 5 6 7 8 9 Total
2009-2010 796 173 404 1,039 24 258 660 5 363 3,722
2010-2011 1,159 132 366 863 15 251 328 0 235 3,349
2011-2012 871 109 339 803 23 123 158 3 108 2,537
2012-2013 794 93 296 620 36 343 324 1 47 2,554
2013-2014 1,055 70 370 540 20 323 130 0 61 2,569
2014-2015 1,547 100 581 885 18 452 132 0 53 3,768
0 0 0 0 0 0 0 0 0 0
0 0 0 0 0 0 0 0 0 0
0 0 0 0 0 0 0 0 0 0
0 0 0 0 0 0 0 0 0 0
1= Hispanic American; 2=American Indian or Alaska Native; 3=Asian-American; 4=Black or African-American; 5=Native
Hawaiian or Other Pacific Islander; 6=Two or More Races; 7=White; 8=Nonresident Alien/International; 9=Race/Ethnicity
Unknown.
40dg/h/aa/sfa/15/TableC.xls
1/4/2016@10:03 AM
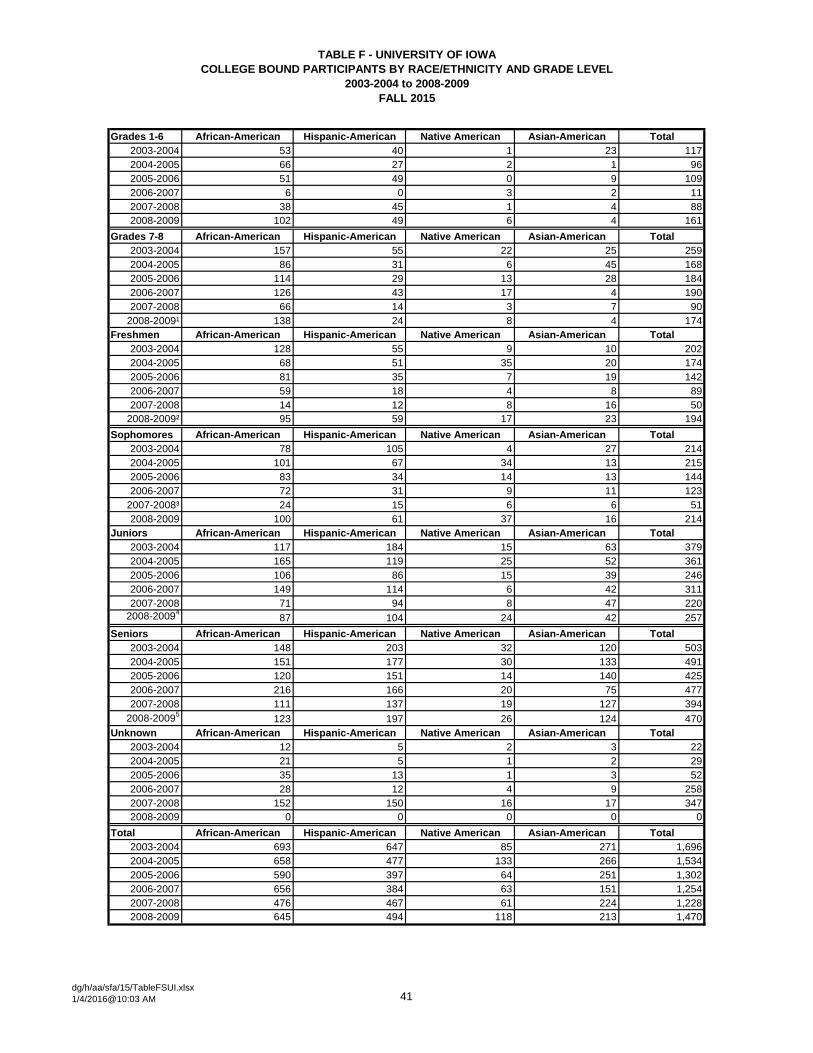
TABLE F - UNIVERSITY OF IOWA
COLLEGE BOUND PARTICIPANTS BY RACE/ETHNICITY AND GRADE LEVEL
2003-2004 to 2008-2009
FALL 2015
Grades 1-6 African-American Hispanic-American Native American Asian-American Total
2003-2004 53 40 1 23 117
2004-2005 66 27 2 1 96
2005-2006 51 49 0 9 109
2006-2007 6 0 3 2 11
2007-2008 38 45 1 4 88
2008-2009 102 49 6 4 161
Grades 7-8 African-American Hispanic-American Native American Asian-American Total
2003-2004 157 55 22 25 259
2004-2005 86 31 6 45 168
2005-2006 114 29 13 28 184
2006-2007 126 43 17 4 190
2007-2008 66 14 3 7 90
2008-2009¹ 138 24 8 4 174
Freshmen African-American Hispanic-American Native American Asian-American Total
2003-2004 128 55 9 10 202
2004-2005 68 51 35 20 174
2005-2006 81 35 7 19 142
2006-2007 59 18 4 8 89
2007-2008 14 12 8 16 50
2008-2009² 95 59 17 23 194
Sophomores African-American Hispanic-American Native American Asian-American Total
2003-2004 78 105 4 27 214
2004-2005 101 67 34 13 215
2005-2006 83 34 14 13 144
2006-2007 72 31 9 11 123
2007-2008³ 24 15 6 6 51
2008-2009 100 61 37 16 214
Juniors African-American Hispanic-American Native American Asian-American Total
2003-2004 117 184 15 63 379
2004-2005 165 119 25 52 361
2005-2006 106 86 15 39 246
2006-2007 149 114 6 42 311
2007-2008 71 94 8 47 220
2008-20094
87 104 24 42 257
Seniors African-American Hispanic-American Native American Asian-American Total
2003-2004 148 203 32 120 503
2004-2005 151 177 30 133 491
2005-2006 120 151 14 140 425
2006-2007 216 166 20 75 477
2007-2008 111 137 19 127 394
2008-20095
123 197 26 124 470
Unknown African-American Hispanic-American Native American Asian-American Total
2003-2004 12 5 2 3 22
2004-2005 21 5 1 2 29
2005-2006 35 13 1 3 52
2006-2007 28 12 4 9 258
2007-2008 152 150 16 17 347
2008-2009 0 0 0 0 0
Total African-American Hispanic-American Native American Asian-American Total
2003-2004 693 647 85 271 1,696
2004-2005 658 477 133 266 1,534
2005-2006 590 397 64 251 1,302
2006-2007 656 384 63 151 1,254
2007-2008 476 467 61 224 1,228
2008-2009 645 494 118 213 1,470
dg/h/aa/sfa/15/TableFSUI.xlsx
1/4/2016@10:03 AM 41

TABLE F2 - UNIVERSITY OF IOWA
COLLEGE BOUND PARTICIPANTS BY RACE/ETHNICITY AND GRADE LEVEL
2009-2010 to 2014-2015
FALL 2015
Grades 1-6 1 2 3 4 5 6 7 8 9 Total
2009-2010 35 5 22 73 1 9 67 0 0 212
2010-2011 73 10 31 19 0 28 60 0 0 221
2011-2012 93 2 2 120 0 7 60 0 1 285
2012-2013 39 0 3 13 1 4 38 0 0 98
2013-2014 61 0 1 4 0 0 29 0 12 107
2014-2015 14 0 3 3 0 3 0 0 10 33
Grades 7-8 1 2 3 4 5 6 7 8 9 Total
2009-2010 69 20 30 164 5 12 152 2 36 490
2010-2011 120 14 16 111 2 15 1 0 15 294
2011-2012 34 4 19 162 2 0 2 0 18 241
2012-2013 40 1 7 55 1 39 0 0 1 144
2013-2014 19 0 7 7 0 1 0 0 10 44
2014-2015 59 5 11 47 1 21 0 0 16 160
Freshmen 1 2 3 4 5 6 7 8 9 Total
2009-2010 17 2 16 65 2 10 29 1 13 155
2010-2011 31 40 14 24 0 13 15 0 9 146
2011-2012 17 0 22 16 1 3 0 0 7 66
2012-2013 17 0 6 21 2 5 1 0 0 52
2013-2014 15 0 11 8 0 2 1 0 3 40
2014-2015 28 2 9 21 3 15 0 0 11 89
Sophomores 1 2 3 4 5 6 7 8 9 Total
2009-2010 30 8 19 121 0 55 52 2 57 344
2010-2011 69 17 18 72 0 14 12 0 8 210
2011-2012 61 16 29 112 0 6 10 0 9 243
2012-2013 19 4 4 18 0 3 0 0 0 48
2013-2014 30 0 14 13 1 2 2 0 4 66
2014-2015 44 10 22 63 0 27 0 0 4 170
Juniors 1 2 3 4 5 6 7 8 9 Total
2009-2010 95 27 61 140 1 39 86 0 33 482
2010-2011 168 13 47 136 1 49 32 0 28 474
2011-2012 69 13 36 81 2 2 15 0 12 230
2012-2013 89 10 56 61 1 50 17 1 1 286
2013-2014 84 0 33 55 2 46 8 0 2 230
2014-2015 264 15 101 134 3 77 6 0 1 601
Seniors 1 2 3 4 5 6 7 8 9 Total
2009-2010 275 40 174 162 8 49 59 0 12 779
2010-2011 336 12 122 165 7 99 30 0 29 800
2011-2012 265 53 131 202 17 5 10 3 16 702
2012-2013 273 34 110 159 2 109 0 0 1 688
2013-2014 374 11 141 135 6 136 0 0 0 803
2014-2015 566 14 230 227 8 182 3 0 0 1,230
Unknown 1 2 3 4 5 6 7 8 9 Total
2009-2010 0 0 0 0 0 0 0 0 0 0
2010-2011 0 0 0 0 0 0 0 0 0 0
2011-2012 0 0 0 0 0 0 0 0 0 0
2012-2013 34 1 9 44 29 24 0 0 2 143
2013-2014 107 2 23 43 2 24 1 0 0 202
2014-2015 44 3 46 50 1 25 0 0 0 169
Total 1 2 3 4 5 6 7 8 9 Total
2009-2010 521 102 322 725 17 174 445 5 151 2,462
2010-2011 797 106 248 527 10 218 150 0 89 2,145
2011-2012 539 88 239 693 22 23 97 3 63 1,767
2012-2013 511 50 195 371 36 234 56 1 5 1,459
2013-2014 690 13 230 265 11 211 41 0 31 1,492
2014-2015 1019 49 422 545 16 350 9 0 42 2,452
1= Hispanic American; 2=American Indian or Alaska Native; 3=Asian-American; 4=Black or African-American; 5=Native Hawaiian or Other Pacific
Islander; 6=Two or More Races; 7=White; 8=Nonresident Alien/International; 9=Race/Ethnicity Unknown.
1/4/2016@10:03 AM 42 dg/h/aa/sfa15/tableIFSUI.xls
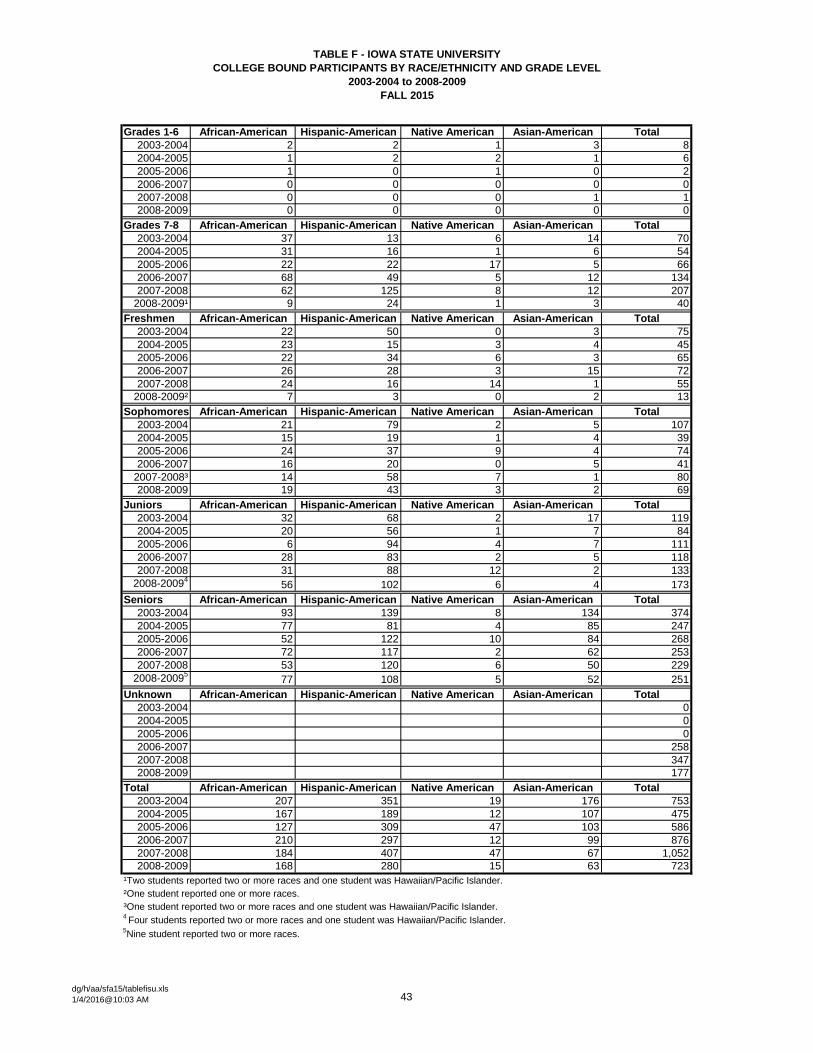
TABLE F - IOWA STATE UNIVERSITY
COLLEGE BOUND PARTICIPANTS BY RACE/ETHNICITY AND GRADE LEVEL
2003-2004 to 2008-2009
FALL 2015
Grades 1-6 African-American Hispanic-American Native American Asian-American Total
2003-2004 2 2 1 3 8
2004-2005 1 2 2 1 6
2005-2006 1 0 1 0 2
2006-2007 0 0 0 0 0
2007-2008 0 0 0 1 1
2008-2009 0 0 0 0 0
Grades 7-8 African-American Hispanic-American Native American Asian-American Total
2003-2004 37 13 6 14 70
2004-2005 31 16 1 6 54
2005-2006 22 22 17 5 66
2006-2007 68 49 5 12 134
2007-2008 62 125 8 12 207
2008-2009¹ 9 24 1 3 40
Freshmen African-American Hispanic-American Native American Asian-American Total
2003-2004 22 50 0 3 75
2004-2005 23 15 3 4 45
2005-2006 22 34 6 3 65
2006-2007 26 28 3 15 72
2007-2008 24 16 14 1 55
2008-2009² 7 3 0 2 13
Sophomores African-American Hispanic-American Native American Asian-American Total
2003-2004 21 79 2 5 107
2004-2005 15 19 1 4 39
2005-2006 24 37 9 4 74
2006-2007 16 20 0 5 41
2007-2008³ 14 58 7 1 80
2008-2009 19 43 3 2 69
Juniors African-American Hispanic-American Native American Asian-American Total
2003-2004 32 68 2 17 119
2004-2005 20 56 1 7 84
2005-2006 6 94 4 7 111
2006-2007 28 83 2 5 118
2007-2008 31 88 12 2 133
2008-20094
56 102 6 4 173
Seniors African-American Hispanic-American Native American Asian-American Total
2003-2004 93 139 8 134 374
2004-2005 77 81 4 85 247
2005-2006 52 122 10 84 268
2006-2007 72 117 2 62 253
2007-2008 53 120 6 50 229
2008-20095
77 108 5 52 251
Unknown African-American Hispanic-American Native American Asian-American Total
2003-2004 0
2004-2005 0
2005-2006 0
2006-2007 258
2007-2008 347
2008-2009 177
Total African-American Hispanic-American Native American Asian-American Total
2003-2004 207 351 19 176 753
2004-2005 167 189 12 107 475
2005-2006 127 309 47 103 586
2006-2007 210 297 12 99 876
2007-2008 184 407 47 67 1,052
2008-2009 168 280 15 63 723
4 Four students reported two or more races and one student was Hawaiian/Pacific Islander.
5Nine student reported two or more races.
²One student reported one or more races.
³One student reported two or more races and one student was Hawaiian/Pacific Islander.
¹Two students reported two or more races and one student was Hawaiian/Pacific Islander.
dg/h/aa/sfa15/tablefisu.xls
1/4/2016@10:03 AM 43
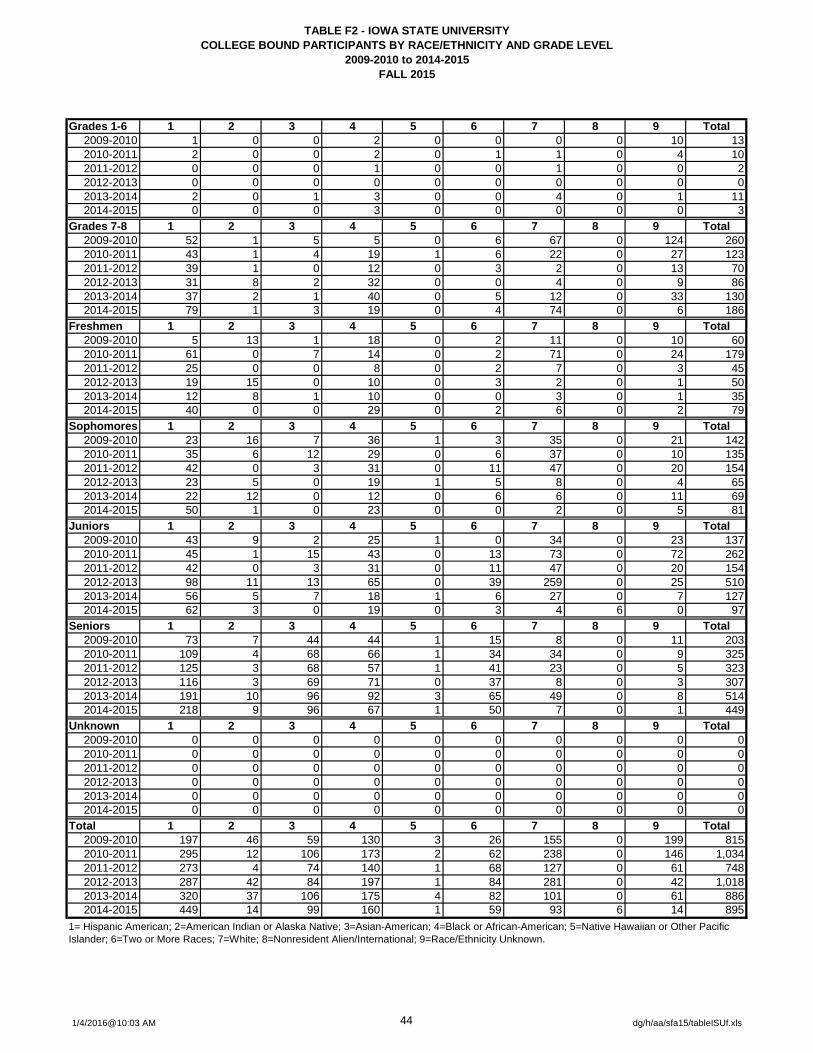
TABLE F2 - IOWA STATE UNIVERSITY
COLLEGE BOUND PARTICIPANTS BY RACE/ETHNICITY AND GRADE LEVEL
2009-2010 to 2014-2015
FALL 2015
Grades 1-6 1 2 3 4 5 6 7 8 9 Total
2009-2010 1 0 0 2 0 0 0 0 10 13
2010-2011 2 0 0 2 0 1 1 0 4 10
2011-2012 0 0 0 1 0 0 1 0 0 2
2012-2013 0 0 0 0 0 0 0 0 0 0
2013-2014 2 0 1 3 0 0 4 0 1 11
2014-2015 0 0 0 3 0 0 0 0 0 3
Grades 7-8 1 2 3 4 5 6 7 8 9 Total
2009-2010 52 1 5 5 0 6 67 0 124 260
2010-2011 43 1 4 19 1 6 22 0 27 123
2011-2012 39 1 0 12 0 3 2 0 13 70
2012-2013 31 8 2 32 0 0 4 0 9 86
2013-2014 37 2 1 40 0 5 12 0 33 130
2014-2015 79 1 3 19 0 4 74 0 6 186
Freshmen 1 2 3 4 5 6 7 8 9 Total
2009-2010 5 13 1 18 0 2 11 0 10 60
2010-2011 61 0 7 14 0 2 71 0 24 179
2011-2012 25 0 0 8 0 2 7 0 3 45
2012-2013 19 15 0 10 0 3 2 0 1 50
2013-2014 12 8 1 10 0 0 3 0 1 35
2014-2015 40 0 0 29 0 2 6 0 2 79
Sophomores 1 2 3 4 5 6 7 8 9 Total
2009-2010 23 16 7 36 1 3 35 0 21 142
2010-2011 35 6 12 29 0 6 37 0 10 135
2011-2012 42 0 3 31 0 11 47 0 20 154
2012-2013 23 5 0 19 1 5 8 0 4 65
2013-2014 22 12 0 12 0 6 6 0 11 69
2014-2015 50 1 0 23 0 0 2 0 5 81
Juniors 1 2 3 4 5 6 7 8 9 Total
2009-2010 43 9 2 25 1 0 34 0 23 137
2010-2011 45 1 15 43 0 13 73 0 72 262
2011-2012 42 0 3 31 0 11 47 0 20 154
2012-2013 98 11 13 65 0 39 259 0 25 510
2013-2014 56 5 7 18 1 6 27 0 7 127
2014-2015 62 3 0 19 0 3 4 6 0 97
Seniors 1 2 3 4 5 6 7 8 9 Total
2009-2010 73 7 44 44 1 15 8 0 11 203
2010-2011 109 4 68 66 1 34 34 0 9 325
2011-2012 125 3 68 57 1 41 23 0 5 323
2012-2013 116 3 69 71 0 37 8 0 3 307
2013-2014 191 10 96 92 3 65 49 0 8 514
2014-2015 218 9 96 67 1 50 7 0 1 449
Unknown 1 2 3 4 5 6 7 8 9 Total
2009-2010 0 0 0 0 0 0 0 0 0 0
2010-2011 0 0 0 0 0 0 0 0 0 0
2011-2012 0 0 0 0 0 0 0 0 0 0
2012-2013 0 0 0 0 0 0 0 0 0 0
2013-2014 0 0 0 0 0 0 0 0 0 0
2014-2015 0 0 0 0 0 0 0 0 0 0
Total 1 2 3 4 5 6 7 8 9 Total
2009-2010 197 46 59 130 3 26 155 0 199 815
2010-2011 295 12 106 173 2 62 238 0 146 1,034
2011-2012 273 4 74 140 1 68 127 0 61 748
2012-2013 287 42 84 197 1 84 281 0 42 1,018
2013-2014 320 37 106 175 4 82 101 0 61 886
2014-2015 449 14 99 160 1 59 93 6 14 895
1= Hispanic American; 2=American Indian or Alaska Native; 3=Asian-American; 4=Black or African-American; 5=Native Hawaiian or Other Pacific
Islander; 6=Two or More Races; 7=White; 8=Nonresident Alien/International; 9=Race/Ethnicity Unknown.
1/4/2016@10:03 AM 44 dg/h/aa/sfa15/tableISUf.xls
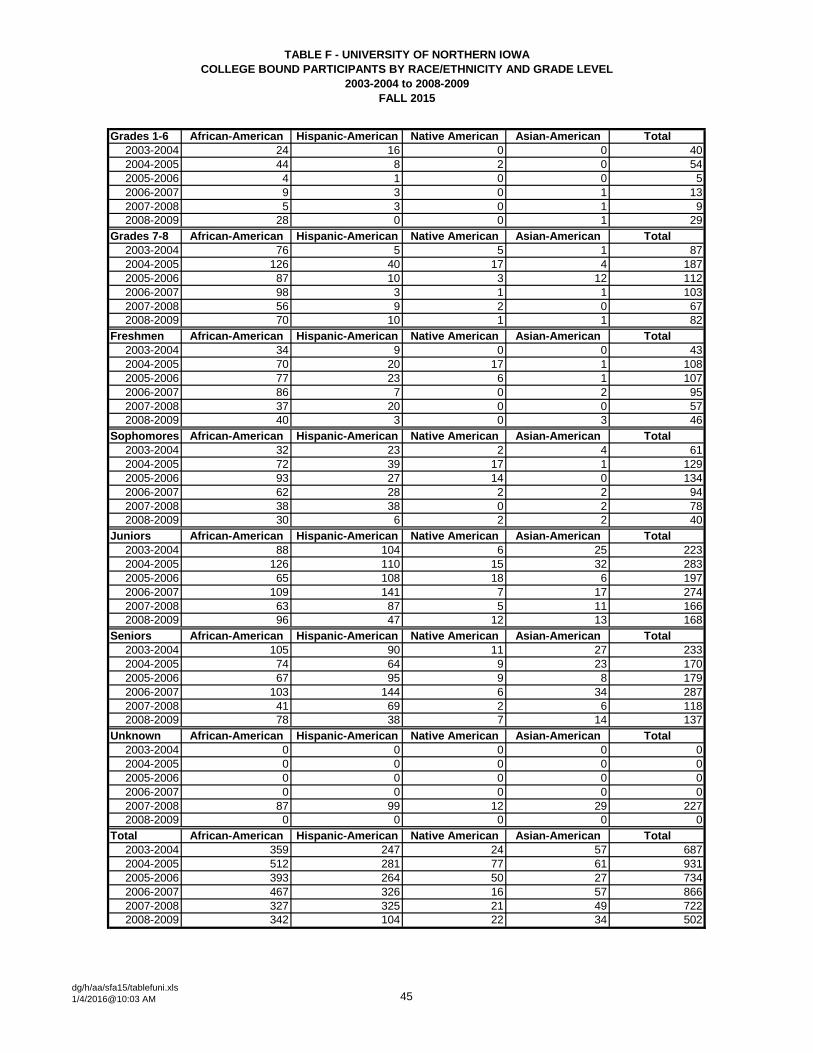
TABLE F - UNIVERSITY OF NORTHERN IOWA
COLLEGE BOUND PARTICIPANTS BY RACE/ETHNICITY AND GRADE LEVEL
2003-2004 to 2008-2009
FALL 2015
Grades 1-6 African-American Hispanic-American Native American Asian-American Total
2003-2004 24 16 0 0 40
2004-2005 44 8 2 0 54
2005-2006 4 1 0 0 5
2006-2007 9 3 0 1 13
2007-2008 5 3 0 1 9
2008-2009 28 0 0 1 29
Grades 7-8 African-American Hispanic-American Native American Asian-American Total
2003-2004 76 5 5 1 87
2004-2005 126 40 17 4 187
2005-2006 87 10 3 12 112
2006-2007 98 3 1 1 103
2007-2008 56 9 2 0 67
2008-2009 70 10 1 1 82
Freshmen African-American Hispanic-American Native American Asian-American Total
2003-2004 34 9 0 0 43
2004-2005 70 20 17 1 108
2005-2006 77 23 6 1 107
2006-2007 86 7 0 2 95
2007-2008 37 20 0 0 57
2008-2009 40 3 0 3 46
Sophomores African-American Hispanic-American Native American Asian-American Total
2003-2004 32 23 2 4 61
2004-2005 72 39 17 1 129
2005-2006 93 27 14 0 134
2006-2007 62 28 2 2 94
2007-2008 38 38 0 2 78
2008-2009 30 6 2 2 40
Juniors African-American Hispanic-American Native American Asian-American Total
2003-2004 88 104 6 25 223
2004-2005 126 110 15 32 283
2005-2006 65 108 18 6 197
2006-2007 109 141 7 17 274
2007-2008 63 87 5 11 166
2008-2009 96 47 12 13 168
Seniors African-American Hispanic-American Native American Asian-American Total
2003-2004 105 90 11 27 233
2004-2005 74 64 9 23 170
2005-2006 67 95 9 8 179
2006-2007 103 144 6 34 287
2007-2008 41 69 2 6 118
2008-2009 78 38 7 14 137
Unknown African-American Hispanic-American Native American Asian-American Total
2003-2004 0 0 0 0 0
2004-2005 0 0 0 0 0
2005-2006 0 0 0 0 0
2006-2007 0 0 0 0 0
2007-2008 87 99 12 29 227
2008-2009 0 0 0 0 0
Total African-American Hispanic-American Native American Asian-American Total
2003-2004 359 247 24 57 687
2004-2005 512 281 77 61 931
2005-2006 393 264 50 27 734
2006-2007 467 326 16 57 866
2007-2008 327 325 21 49 722
2008-2009 342 104 22 34 502
dg/h/aa/sfa15/tablefuni.xls
1/4/2016@10:03 AM 45
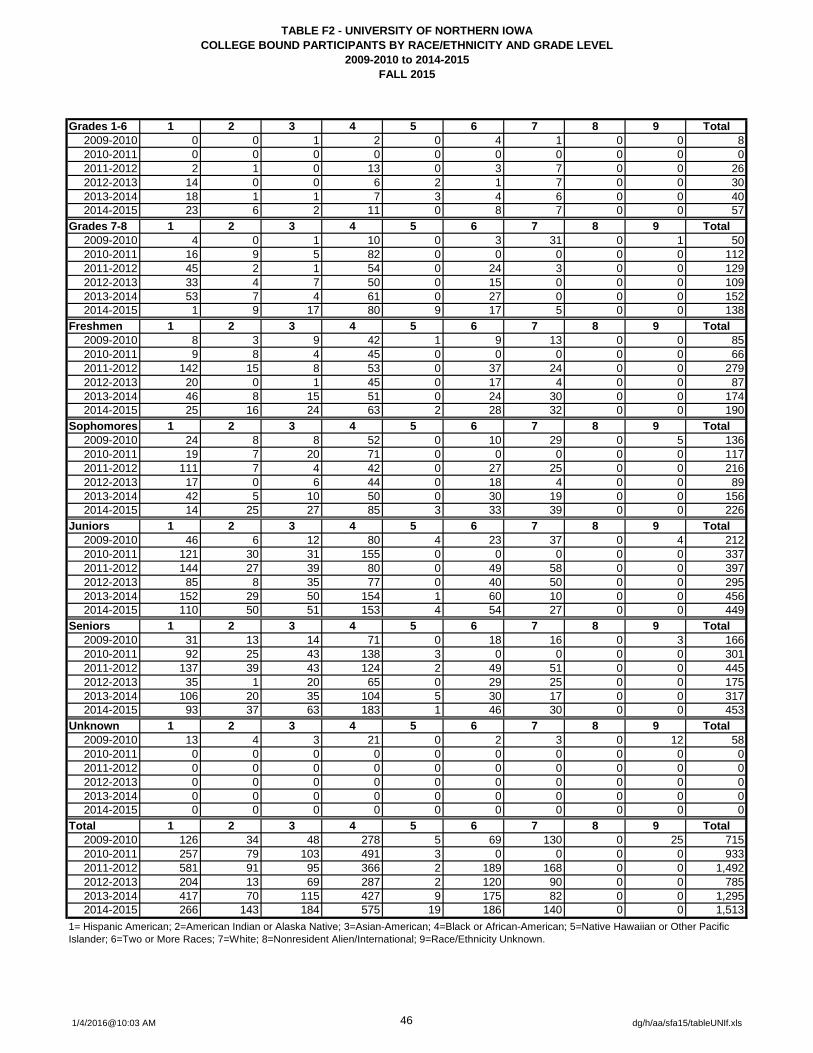
TABLE F2 - UNIVERSITY OF NORTHERN IOWA
COLLEGE BOUND PARTICIPANTS BY RACE/ETHNICITY AND GRADE LEVEL
2009-2010 to 2014-2015
FALL 2015
Grades 1-6 1 2 3 4 5 6 7 8 9 Total
2009-2010 0 0 1 2 0 4 1 0 0 8
2010-2011 0 0 0 0 0 0 0 0 0 0
2011-2012 2 1 0 13 0 3 7 0 0 26
2012-2013 14 0 0 6 2 1 7 0 0 30
2013-2014 18 1 1 7 3 4 6 0 0 40
2014-2015 23 6 2 11 0 8 7 0 0 57
Grades 7-8 1 2 3 4 5 6 7 8 9 Total
2009-2010 4 0 1 10 0 3 31 0 1 50
2010-2011 16 9 5 82 0 0 0 0 0 112
2011-2012 45 2 1 54 0 24 3 0 0 129
2012-2013 33 4 7 50 0 15 0 0 0 109
2013-2014 53 7 4 61 0 27 0 0 0 152
2014-2015 1 9 17 80 9 17 5 0 0 138
Freshmen 1 2 3 4 5 6 7 8 9 Total
2009-2010 8 3 9 42 1 9 13 0 0 85
2010-2011 9 8 4 45 0 0 0 0 0 66
2011-2012 142 15 8 53 0 37 24 0 0 279
2012-2013 20 0 1 45 0 17 4 0 0 87
2013-2014 46 8 15 51 0 24 30 0 0 174
2014-2015 25 16 24 63 2 28 32 0 0 190
Sophomores 1 2 3 4 5 6 7 8 9 Total
2009-2010 24 8 8 52 0 10 29 0 5 136
2010-2011 19 7 20 71 0 0 0 0 0 117
2011-2012 111 7 4 42 0 27 25 0 0 216
2012-2013 17 0 6 44 0 18 4 0 0 89
2013-2014 42 5 10 50 0 30 19 0 0 156
2014-2015 14 25 27 85 3 33 39 0 0 226
Juniors 1 2 3 4 5 6 7 8 9 Total
2009-2010 46 6 12 80 4 23 37 0 4 212
2010-2011 121 30 31 155 0 0 0 0 0 337
2011-2012 144 27 39 80 0 49 58 0 0 397
2012-2013 85 8 35 77 0 40 50 0 0 295
2013-2014 152 29 50 154 1 60 10 0 0 456
2014-2015 110 50 51 153 4 54 27 0 0 449
Seniors 1 2 3 4 5 6 7 8 9 Total
2009-2010 31 13 14 71 0 18 16 0 3 166
2010-2011 92 25 43 138 3 0 0 0 0 301
2011-2012 137 39 43 124 2 49 51 0 0 445
2012-2013 35 1 20 65 0 29 25 0 0 175
2013-2014 106 20 35 104 5 30 17 0 0 317
2014-2015 93 37 63 183 1 46 30 0 0 453
Unknown 1 2 3 4 5 6 7 8 9 Total
2009-2010 13 4 3 21 0 2 3 0 12 58
2010-2011 0 0 0 0 0 0 0 0 0 0
2011-2012 0 0 0 0 0 0 0 0 0 0
2012-2013 0 0 0 0 0 0 0 0 0 0
2013-2014 0 0 0 0 0 0 0 0 0 0
2014-2015 0 0 0 0 0 0 0 0 0 0
Total 1 2 3 4 5 6 7 8 9 Total
2009-2010 126 34 48 278 5 69 130 0 25 715
2010-2011 257 79 103 491 3 0 0 0 0 933
2011-2012 581 91 95 366 2 189 168 0 0 1,492
2012-2013 204 13 69 287 2 120 90 0 0 785
2013-2014 417 70 115 427 9 175 82 0 0 1,295
2014-2015 266 143 184 575 19 186 140 0 0 1,513
1= Hispanic American; 2=American Indian or Alaska Native; 3=Asian-American; 4=Black or African-American; 5=Native Hawaiian or Other Pacific
Islander; 6=Two or More Races; 7=White; 8=Nonresident Alien/International; 9=Race/Ethnicity Unknown.
1/4/2016@10:03 AM 46 dg/h/aa/sfa15/tableUNIf.xls