collapse analysis of the daikai station in kobe metropolitan · pdf filecollapse analysis of...
TRANSCRIPT

[1]
Collapse analysis of the Daikai station in Kobe Metropolitan
David Lourenço Brito
Department of Civil Engineering and Architecture, IST, Technical University of Lisbon
1. Introduction Generally, underground structures are characterized by the absence of important damages when
subjected to seismic action.
However, on 17 January 1995, Kobe earthquake occurs and a large part of the stations and underground
tunnels have suffered severe damage, including total collapse. One of the Kobe subway stations which
raised great interest and research was Daikai station, which suffered a total collapse of its central pillars
over a length of 80m, with settlements up to 2.5m at surface. The Kobe earthquake contributed to change
the way the scientific community view the vulnerability of these structures.
This work is focused on the analysis of the failure mechanism in Daikai station. Moreover, understand how
the influence of the construction process affects the static and dynamic response of the tunnel and the
surrounding soil.
The dissertation is divided into six chapters. After the introduction, the second chapter corresponds to a
general framework of the Kobe earthquake. It is done a literature review of damage in the underground
subway system of Kobe and then more specifically at the station Daikai. The damage evaluated and
defined analysis models to the underground station are described. On the third chapter is calibrated the
numerical model. The models for studying the phenomenon of wave propagation and cyclic behavior of
soils are described. In the fourth chapter numerical linear elastic analysis are conducted to evaluate the
mechanism failure of the central columns. Chapter five presents the results of the consideration of
construction phasing. A few parameters such as the variation of plastic zones, forces and relative
displacements in elements are analyzed. In the last chapter, conclusion remarks and future perspectives
are presented.
2. Daikai Station
The Hyogoken--Nanbu earthquake, also known
as the "Great Hanshin Earthquake", on 17
January 1995 had an extreme impact on
buildings and infrastructure in the Kobe region,
with a magnitude of 7.2 on the Richter scale.
Kobe is inserted in a zone of converging
tectonic plates 4 (Fig. 1), with intense activity.
The mechanism of failure was this type "strike
slip". Fig. 1 - Tectonic activity that caused the Kobe earthquake (adapted from Japan, EQ, 1995)
[2]
2.1 Damage in the Kobe subway system
More than 6400 people lost their lives during such seismic activity. Was affected not only the region of
Kobe, but also Osaka, which together are the second most industrialized and populated after Tokyo.
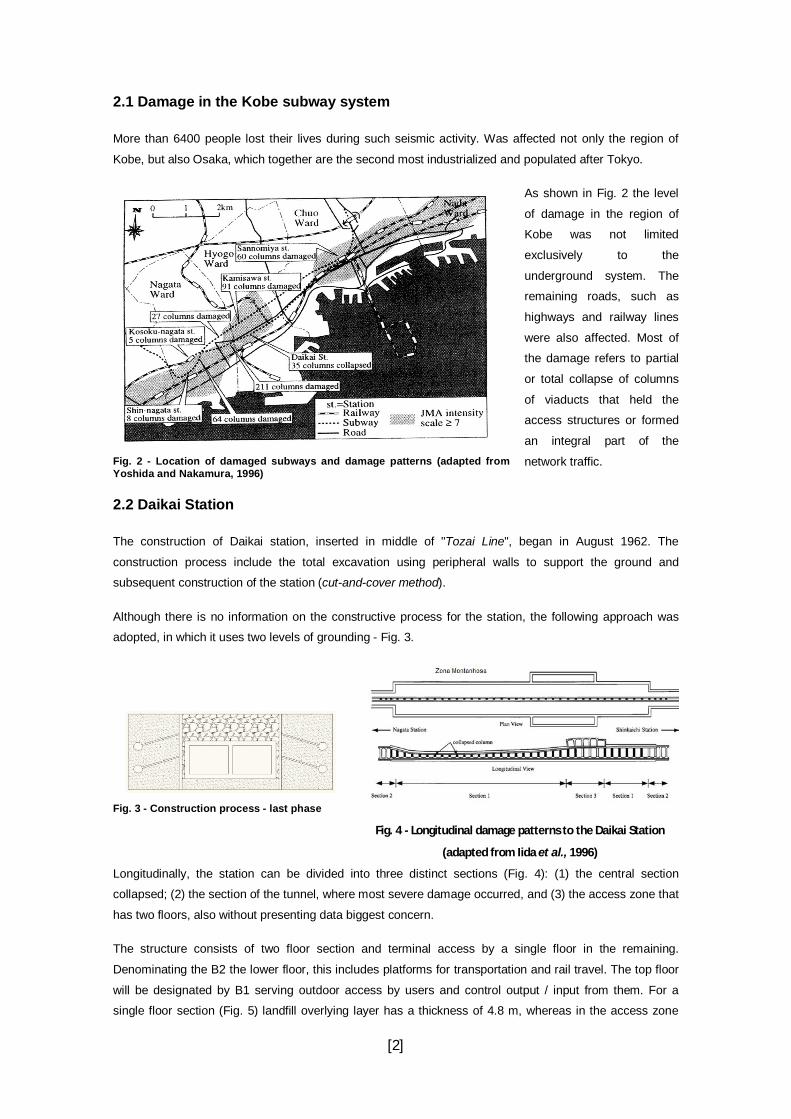
Fig. 2 - Location of damaged subways and damage patterns (adapted from Yoshida and Nakamura, 1996)
As shown in Fig. 2 the level
of damage in the region of
Kobe was not limited
exclusively to the
underground system. The
remaining roads, such as
highways and railway lines
were also affected. Most of
the damage refers to partial
or total collapse of columns
of viaducts that held the
access structures or formed
an integral part of the
network traffic.
2.2 Daikai Station
The construction of Daikai station, inserted in middle of "Tozai Line", began in August 1962. The
construction process include the total excavation using peripheral walls to support the ground and
subsequent construction of the station (cut-and-cover method).
Although there is no information on the constructive process for the station, the following approach was
adopted, in which it uses two levels of grounding - Fig. 3.
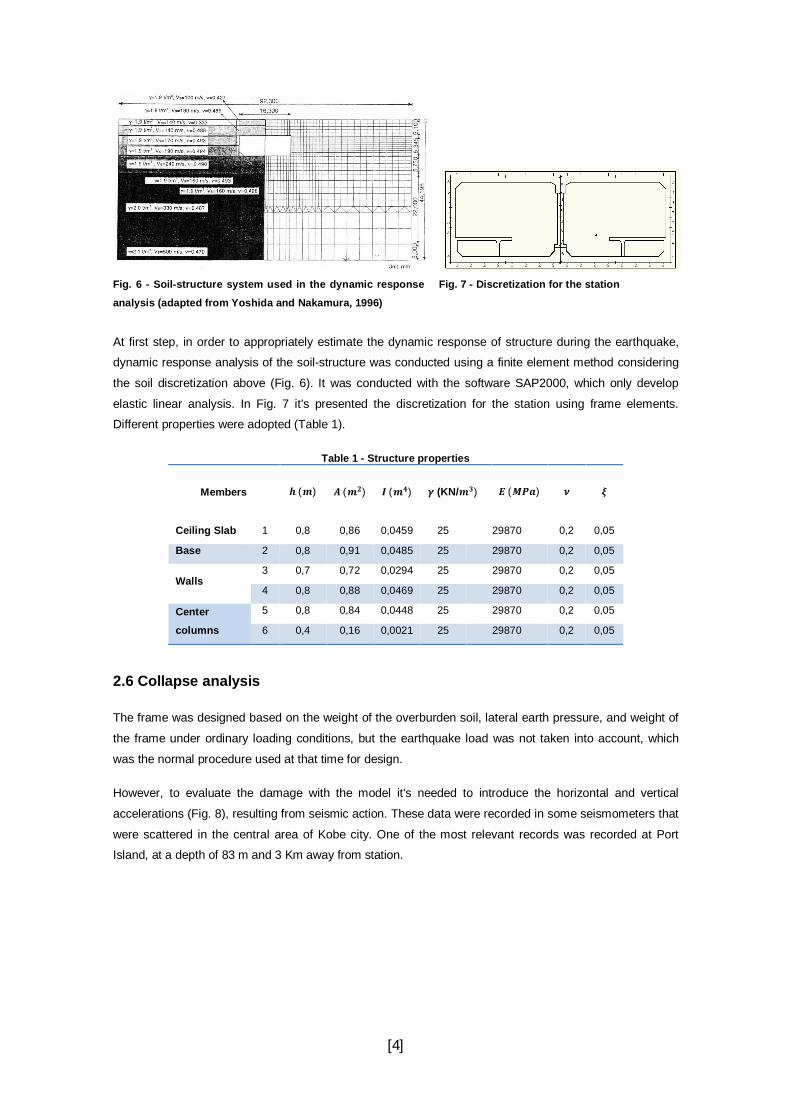
Fig. 3 - Construction process - last phase
Fig. 4 - Longitudinal damage patterns to the Daikai Station
(adapted from Iida et al., 1996)
Longitudinally, the station can be divided into three distinct sections (Fig. 4): (1) the central section
collapsed; (2) the section of the tunnel, where most severe damage occurred, and (3) the access zone that
has two floors, also without presenting data biggest concern.
The structure consists of two floor section and terminal access by a single floor in the remaining.
Denominating the B2 the lower floor, this includes platforms for transportation and rail travel. The top floor
will be designated by B1 serving outdoor access by users and control output / input from them. For a
single floor section (Fig. 5) landfill overlying layer has a thickness of 4.8 m, whereas in the access zone

[3]
are 1.9 meters above the ground structure. The area for the ground floor, which extends longitudinally of
120 m, is basically a rectangular structure with a closed cross section width of 17 m by 7.17 m long.
Fig. 5 - Cross section of the Daikai Station, dimensions in mm (Huo et al., 2005)
Round steel bars with diameters from 16 to 25 mm were used
as reinforcing for the walls and slabs, and 32 mm diameter
bars were used in the central column. A transverse hoop (9
mm diameter) was placed ate every 350 mm in the center
column.
2.3 Geological setting at Daikai station
The site of the Daikai station is essentially composed of soft Holocene alluvial deposits and dense
Pleistocene gravel, overlain by man-made fill.
The ground water table was located at a depth of 6-8m below the ground surface, which was 3-5m lower
than in 1959, prior to the construction of the station. Referring to another source, Kobe city (1980), the soil
depth of the base was deep on the west side and it consists of silty or clayey surface soil. It becomes
shallow toward east; the depth at the Daikai station site is about 15 m and that at the Shinkaichi station is
less than 10 m. In addition, sand becomes more predominant toward east.
2.4 Earthquake induced damages
The central columns collapsed in East area, resulting in significant settlement of the upper slab and the
surrounding soil. Many cracks were observed in the longitudinal walls as well as the transverse directions.
Damage was the most severe at section 1 (Fig. 5) in the Nagata side zone. Almost all the center columns
completely collapsed and the ceiling slab fell down. As a result, the original box frame structure distorted to
an M-shaped section. The ceiling slab kinks and cracks 150 to 250 mm wide appeared in the longitudinal
direction about 2.15 to 2.40 m from the center line of the columns. In addition, the separation of cover
concrete was observed over the almost entire area near the haunch and the intersection between the
ceiling slab and the lateral wall.
In the lateral wall, separation of the cover concrete was observed near both the top and bottom haunches.
Diagonal cracks were observed in all the walls in the transverse direction.
2.5 Numerical modelling
To study the dynamic soil structure interaction some simplifications were considered, such as:
• Evaluate a single transverse profile;
• Soil layers are horizontal, not taking into account the variation of longitudinal layers along the tunnel;
• The tunnel is modeled with finite element bar;
[4]
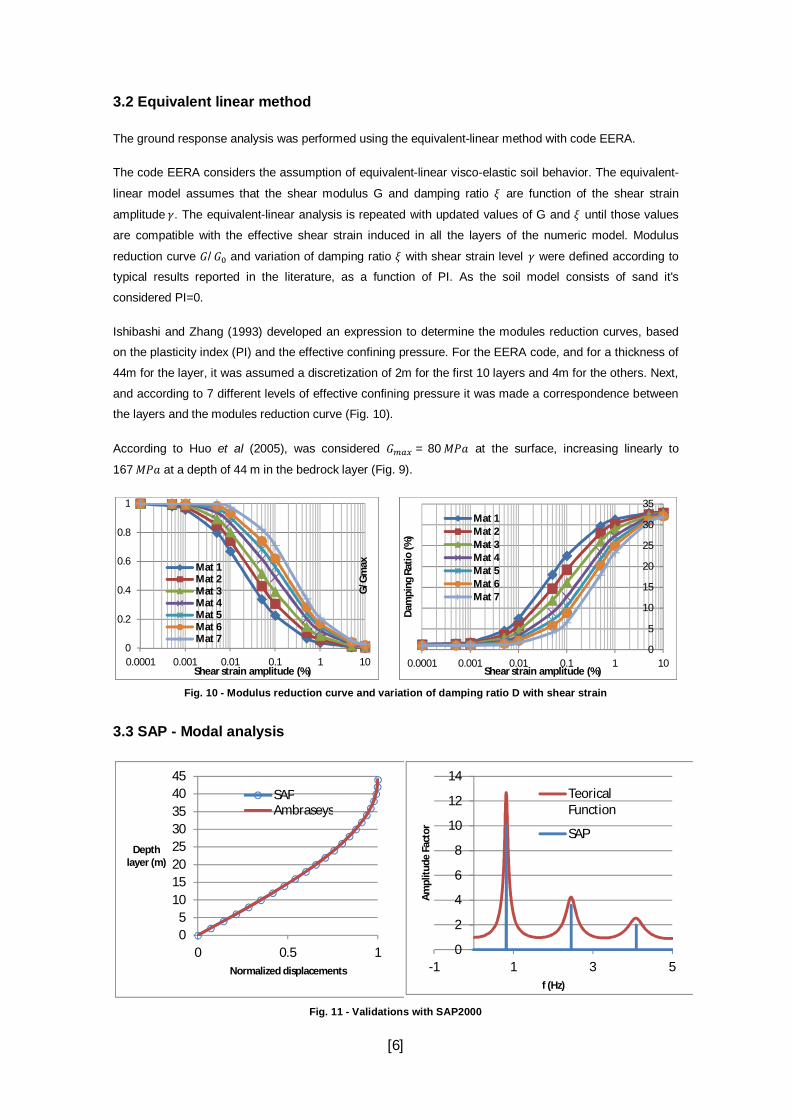
Fig. 6 - Soil-structure system used in the dynamic response
analysis (adapted from Yoshida and Nakamura, 1996)
Fig. 7 - Discretization for the station
At first step, in order to appropriately estimate the dynamic response of structure during the earthquake,
dynamic response analysis of the soil-structure was conducted using a finite element method considering
the soil discretization above (Fig. 6). It was conducted with the software SAP2000, which only develop
elastic linear analysis. In Fig. 7 it's presented the discretization for the station using frame elements.
Different properties were adopted (Table 1).
Table 1 - Structure properties
2.6 Collapse analysis
The frame was designed based on the weight of the overburden soil, lateral earth pressure, and weight of
the frame under ordinary loading conditions, but the earthquake load was not taken into account, which
was the normal procedure used at that time for design.
However, to evaluate the damage with the model it's needed to introduce the horizontal and vertical
accelerations (Fig. 8), resulting from seismic action. These data were recorded in some seismometers that
were scattered in the central area of Kobe city. One of the most relevant records was recorded at Port
Island, at a depth of 83 m and 3 Km away from station.
Members 풉(풎) 푨(풎ퟐ) 푰(풎ퟒ) 휸 (KN/풎ퟑ) 푬(푴푷풂) 흂 흃
Ceiling Slab 1 0,8 0,86 0,0459 25 29870 0,2 0,05
Base 2 0,8 0,91 0,0485 25 29870 0,2 0,05
Walls 3 0,7 0,72 0,0294 25 29870 0,2 0,05
4 0,8 0,88 0,0469 25 29870 0,2 0,05
Center
columns
5 0,8 0,84 0,0448 25 29870 0,2 0,05
6 0,4 0,16 0,0021 25 29870 0,2 0,05

[5]
Fig. 8 - Input accelerations
Based on the observation of the damage to these columns and walls, the mechanism of the damage of the
collapsed column in zone A is evaluated to be as follows (Yoshida and Nakamura, 1996): (1) - due to the
strong horizontal component, the central column has reached its maximum capacity in the presence of
bending moment and shear in the lower zone; the appearance and combination of these efforts is due to
earthquake transverse component of the structure. (2) - in turn, their load carrying capacity was greatly
reduced, so that the response to requests for vertical loads was nearly canceled entirely, unable to
withstand the gravitational action.
3. Calibration of numerical model
One of the most intriguing problems for the geotechnical engineering complexity that presents is the
prediction of the behavior and response of soil when subjected to seismic action.
3.1 Linear elastic analysis
These techniques are associated to the one-dimensional approach, considering that all layers are
horizontal and that the response is predominantly caused by vertically propagation shear waves (Kramer,
1996).
The transfer function for uniform, damped soil
on rigid rock is given by the next expression:
|퐹 (휔)| =( )
=
(1)
The frequencies that correspond to the local
maxima are the natural frequencies of the soil
deposit and its variable with the level of
damping.
Natural frequencies for the soil deposit can be
evaluated by:
푓 = ( ). (퐻푧)푛 = 1,2,3, … (2)
Fig. 9 - Profiles of the maximum shear stiffness and shear wave velocity
0
5
10
15
20
25
30
35
40
45
0 200
Dep
th (
m)
Gmax (MPa)
0
5
10
15
20
25
30
35
40
45
0 500
Dep
th (
m)
Shear wave velocities(m/s)
[6]
3.2 Equivalent linear method
The ground response analysis was performed using the equivalent-linear method with code EERA.
The code EERA considers the assumption of equivalent-linear visco-elastic soil behavior. The equivalent-
linear model assumes that the shear modulus G and damping ratio 휉 are function of the shear strain
amplitude훾. The equivalent-linear analysis is repeated with updated values of G and 휉 until those values
are compatible with the effective shear strain induced in all the layers of the numeric model. Modulus
reduction curve 퐺/퐺 and variation of damping ratio 휉 with shear strain level훾 were defined according to
typical results reported in the literature, as a function of PI. As the soil model consists of sand it's
considered PI=0.
Ishibashi and Zhang (1993) developed an expression to determine the modules reduction curves, based
on the plasticity index (PI) and the effective confining pressure. For the EERA code, and for a thickness of
44m for the layer, it was assumed a discretization of 2m for the first 10 layers and 4m for the others. Next,
and according to 7 different levels of effective confining pressure it was made a correspondence between
the layers and the modules reduction curve (Fig. 10).
According to Huo et al (2005), was considered 퐺 = 80푀푃푎 at the surface, increasing linearly to
167푀푃푎 at a depth of 44 m in the bedrock layer (Fig. 9).
Fig. 10 - Modulus reduction curve and variation of damping ratio D with shear strain
3.3 SAP - Modal analysis
Fig. 11 - Validations with SAP2000
0
0.2
0.4
0.6
0.8
1
0.0001 0.001 0.01 0.1 1 10
G/G
max
Shear strain amplitude (%)
Mat 1Mat 2Mat 3Mat 4Mat 5Mat 6Mat 7
0
5
10
15
20
25
30
35
0.0001 0.001 0.01 0.1 1 10
Dam
ping
Rat
io (%
)
Shear strain amplitude (%)
Mat 1Mat 2Mat 3Mat 4Mat 5Mat 6Mat 7
05
1015202530354045
0 0.5 1
Depth layer (m)
Normalized displacements
SAPAmbraseys
0
2
4
6
8
10
12
14
-1 1 3 5
Ampl
itude
Fac
tor
f (Hz)
Teorical Function
SAP

[7]
Two validations were performed using SAP2000. Firstly was compared for the first mode of vibration for
the uniform soil layer, the offsets provided by the calculation program and the SAP solution Ambraseys
(Fig. 11 - left). Second, it was tried to achieve whether there is a similarity between the theoretical model
based on the hypothesis of vertically propagation shear waves and the transfer function obtained
analytically from the response of the soil (Fig. 11 - right). Good agreement was achieved
3.4 Hardening Soil Model
The code PLAXIS was used and the Mohr-Coulomb failure criteria with
hardening was adopted: "Hardening Soil" model. This model calculates
the total strains using a stress-dependent stiffness, different for both
virgin loading and un-reloading. The plastic strains are calculated by
introducing a multi-surface yield criterion. Instead of using Hooke's
single stiffness model with linear elasticity in combination with an ideal
plasticity according to Mohr-Coulomb a new constitutive formulation
using a double-stiffness model for elasticity in combination with
isotropic strain hardening is presented.
Fig. 12 - Behavior of the Hardening Soil model
In contrast to the perfectly elastic-plastic model, the yield surface of the "Hardening Soil" is not fixed in
principal stress space, but it can expand due to plastic straining.
4. Modeling the station
The seismic soil-station interaction is studied in the time domain using the modal decomposition to seismic
recording Island Port, Kobe.
Table 2 - Natural frequencies obtained with the program SAP
Comparing the dynamic properties in
the case of model analysis
homogeneous and stratified, it appears
that the latter has much higher stiffness
because the frequency of the
fundamental mode is greater than twice
the homogeneous model. It is also
apparent that further modes of vibration
were to be evaluated to obtain a
summation of modal shares around
90% (Table 2).
Vibration mode
T f Mass participation in X direction
[s] [Hz] Individual (%) Acumulated (%)
1º 0,53 1,88 68,67% 68,67%
2º 0,24 4,23 9,63% 78,53%
3º 0,22 4,46 3,55% 82,07%
4º 0,14 7,38 2,10% 84,81%
5º 0,13 7,52 2,03% 86,84 %
6º 0,09 10,38 2,86% 90,07%
As reference criteria for forces and according to the work of other authors it's possible to validate these.
According to Huo et al (2005) the central column, due to static loads, has a level of axial force of 3700 KN
result of static equilibrium. During the seismic action the axial force will be 4200 KN considering only the
horizontal component of the action and 4900 KN taking into account both the horizontal and vertical action.
The increased load from the static level to the dynamics due to the distortion which the structure is
subjected by the vertical component and the inertial forces that are generated in the surrounding soil,
especially the one that lies above it (Huo et al, 2005).
[8]
Regarding the finite model achieved the axial force in the center column obtained is about 2799 KN and
3700 KN in the model developed by Huo et al (2005). This difference can be easily explained by the
different models existing in both cases. While in this work was adopted a model in which the properties of
mass and stiffness differ in each layer, these authors intended to vary the stiffness and admit always the
same density for the soil.
An et al (1997) indicates that the shear capacity and the ductility of the central column are the most
important parameters which influence the seismic performance.
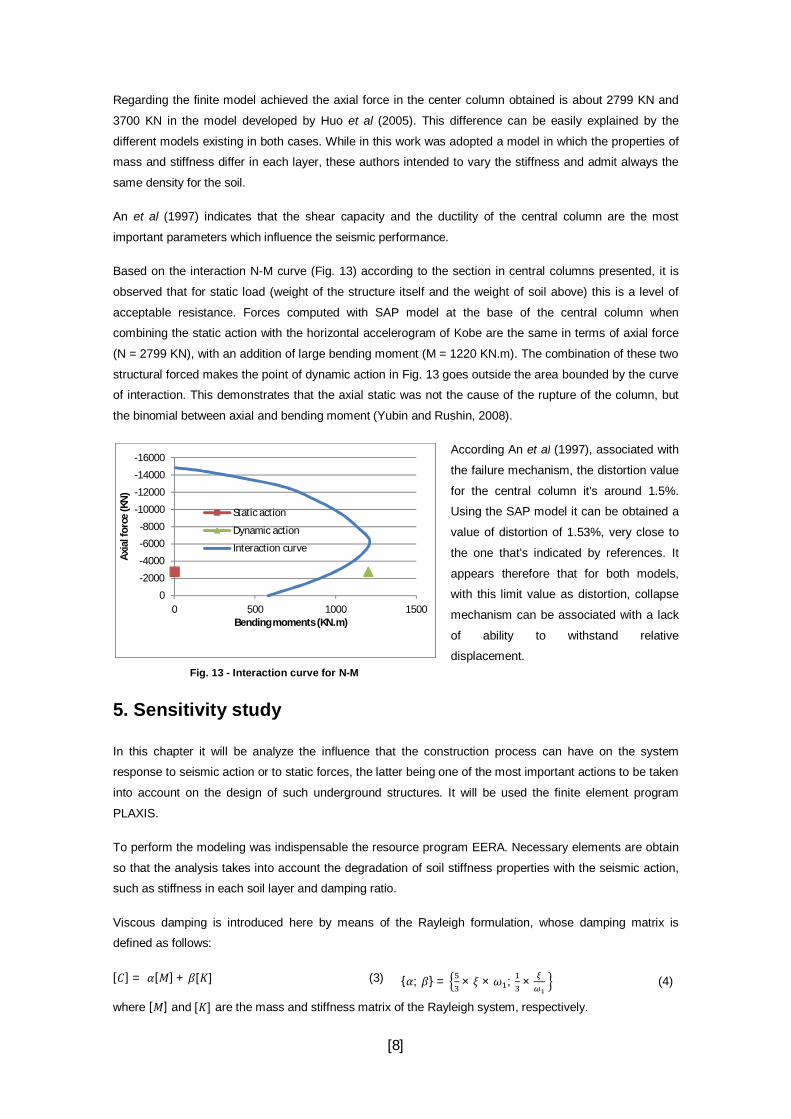
Based on the interaction N-M curve (Fig. 13) according to the section in central columns presented, it is
observed that for static load (weight of the structure itself and the weight of soil above) this is a level of
acceptable resistance. Forces computed with SAP model at the base of the central column when
combining the static action with the horizontal accelerogram of Kobe are the same in terms of axial force
(N = 2799 KN), with an addition of large bending moment (M = 1220 KN.m). The combination of these two
structural forced makes the point of dynamic action in Fig. 13 goes outside the area bounded by the curve
of interaction. This demonstrates that the axial static was not the cause of the rupture of the column, but
the binomial between axial and bending moment (Yubin and Rushin, 2008).
Fig. 13 - Interaction curve for N-M
According An et al (1997), associated with
the failure mechanism, the distortion value
for the central column it's around 1.5%.
Using the SAP model it can be obtained a
value of distortion of 1.53%, very close to
the one that's indicated by references. It
appears therefore that for both models,
with this limit value as distortion, collapse
mechanism can be associated with a lack
of ability to withstand relative
displacement.
5. Sensitivity study
In this chapter it will be analyze the influence that the construction process can have on the system
response to seismic action or to static forces, the latter being one of the most important actions to be taken
into account on the design of such underground structures. It will be used the finite element program
PLAXIS.
To perform the modeling was indispensable the resource program EERA. Necessary elements are obtain
so that the analysis takes into account the degradation of soil stiffness properties with the seismic action,
such as stiffness in each soil layer and damping ratio.
Viscous damping is introduced here by means of the Rayleigh formulation, whose damping matrix is
defined as follows:
[퐶] = 훼[푀] + 훽[퐾] (3) {훼; 훽} = × 휉 ×휔 ; × (4)
where [푀] and [퐾] are the mass and stiffness matrix of the Rayleigh system, respectively.
-16000
-14000
-12000
-10000
-8000
-6000
-4000
-2000
00 500 1000 1500
Axia
l for
ce (K
N)
Bending moments (KN.m)
Static action
Dynamic action
Interaction curve

[9]
Although, in case of visco-elastic layers the Rayleigh coefficients may be calibrated according to the ratio
damping and the angular frequency of the first vibration mode (8,85푟푎푑/푠) be the relation defined in (4).
The boundary conditions adopted for the static stages were the standard ones: nodes at the bottom of the
mesh were fixed in both vertical and horizontal direction. In the dynamic analyses, the bottom of the mesh
was assumed to be rigid and the lateral sides were characterized by the viscous boundaries proposed by
Lysmer and Kuhlmeyer, with parameters a=1.0 and b=0.25.
The mesh employed in the present study is reported in Fig. 14: it's characterized by a width (352m) equal
to eight times its height (44m), in order to minimize the influence of boundary conditions on the computed
results. The domain was discretised in a total of 1702 15-node plane strain triangular elements. In the
central part the mesh was refined to take account a more accurate model. Like the 1D ground response
analyses, the domain was partitioned into 16 layers to account variable stiffness and damping parameters
with the depth.
Fig. 14 - Mesh employed in the FE analyses
Three models were studied: model 1 – retaining walls but without simulation of construction; model 2 -
retaining walls with the simulation of construction; model 3 - without retaining walls.
The analyses of these models lead to the following conclusions:
the magnitude the displacements and bending moments diagram are larger in model 2;
plastic points appear in greater number in the model 2, at the base of the excavation and at the surface
level, near the walls;
due to seismic action, the residual displacements in the retaining wall are a slightly higher in model 2,
due to a large number of plastic points that occur in this model;
bending moments in the walls are 42% larger in model 2 comparing with model 1, for static action;
tie back walls change the forces that appeared in the station structure, comparing all models. For the
central column, higher bending moment ocurred in model 3. The presences of walls restrict the relative
movements of the station when the seismic action is activated.
6. Concluding remarks and future perspectives
Main conclusions:
was identified the mechanism of collapse for the station. Due to the strong horizontal shaking, the central
column has reached its maximum capacity in the presence of bending moment and shear in the lower
[10]
zone. The column was not designed to withstand the displacements imposed by the ground, denoting
lack of ductility and flexibility.
the application of code EERA was used to take into account the nonlinear behavior of soil due to seismic
action. The stiffness and damping computed for each layer was used in PLAXIS model.
With the modal analysis (SAP) was intended to characterize the seismic response of the system. It was
found that the failure in the central column occurs due to the presence of bending moment and axial
force.
In the sensitivity study various parameters were modeled in the observed models. The most notable
differences relate to design values and displacements in the structure elements (central column and
walls) and location of plastic points in the mesh according to the analyzed model.
There are some changes and studies that could be done to consolidate the tendencies here presented.
Comparison of available results in the literature obtained by simulating the station collapse in shaking
table;
Assess the influence of the geometry of the tunnel, depth and position of the columns in the seismic
response of the structure;
Analyze with the seismic rules implemented in Portugal if the Daikai station, before the collapse, was
well design.
7. Bibliography
"The January 17, 1995 Kobe Earthquake - An EQE Summary Report". San Francisco, USA.
Huo, H.; Bobet, A., Fernández, G., & Ramírez, J. (2004). "Load Transfer Mechanisms between Underground Structure and Surrounding Ground: Evaluation of the Failure of the Daikai Station" Journal of geotechnical and geoenvironmental enginnering, ASCE, Vol. 131, No. 12, pp.1522-1533.
Iida, H.; Hiroto, T.; Yoshida, N.; & Iwafuji, M.(1996). "Damage to Daikai Subway Station". Special Issue of Soils and Foundations, pp. 283-300.
Kobe City (1980). Ground in Kobe, Kobe city.
Yoshida, N.; Nakamura, S., (1996). "Damage to Daikai subway station during the 1995 Hyogoken-Nunbu earthquake and its investigation". Eleventh World Conference on Earthquake Engineering, Paper No. 2151.