collaboration paradox: ricardo b. duque - world sciworldsci.net/paradox.pdf · collaboration...
TRANSCRIPT

Collaboration Paradox:
Scientific Productivity, the Internet, and Problems of Research in Developing Areas
Ricardo B. Duque
Louisiana State University
Marcus Ynalvez
Louisiana State University
R. Sooryamoorthy
University of Natal
Paul Mbatia
University of Nairobi
Dan-Bright Dzorgbo
University of Ghana
Wesley Shrum
Louisiana State University
Acknowledgements
This essay presents first results from a series of studies conducted between 2000 and
2002 in India, Kenya and Ghana funded by the U.S. National Science Foundation
program in Information Technology Research. The national coordinators of the project
were R. Sooryamoorthy (Kerala), Paul Mbatia (Kenya) and Dan-Bright Dzorgbo
(Ghana). The approach taken in the analysis was developed in a series of meetings held
at the National Center for Ecological Analysis and Synthesis in Santa Barbara during this
same period of time. This group of ‘Bobcows’ was convened by Edward Hackett to
examine the process of scientific collaboration in a variety of forms. We based the
present work on similar analyses by Barry Bozeman, Sooho Lee, John Walsh and Nancy
Mahoney. However, our gratitude is first and foremost to the outstanding teams of
postgraduate interviewers from Loyola College of Social Sciences (Kerala), the
University of Nairobi (Kenya) and the University of Ghana (Legon), as well as to James
Opare, who led a team at the University of Cape Coast (Ghana). Correspondence may be
directed to Wesley Shrum, Department of Sociology, Louisiana State University, Baton
Rouge, LA 70803, [email protected].
Collaboration Paradox:
Scientific Productivity, the Internet, and Problems of Research in Developing Areas
Abstract
We examine the ways in which the research process differs in developed and developing areas
by focusing on two questions: First, is collaboration associated with productivity? Second, is
access to the Internet (specifically use of email), associated with reduced problems of
collaboration? Recent analyses by Lee and Bozeman (2004) and Walsh and Mahoney (2003)
suggest affirmative answers to these questions for U.S. scientists. Based on a comparative
analysis of scientists in Ghana, Kenya and the State of Kerala in southwestern India (n=918), we
find that (1) collaboration is not associated with any general increment in productivity, and (2)
while access to email does attenuate research problems, such difficulties are structured more by
social context than by the collaborative process itself. The interpretation of these results
suggests a paradox that raises issues for future studies: those conditions that unsettle the
relationship between collaboration and productivity in developing areas may undermine the
collaborative benefits of new information and communication technologies.

2
Is the process of knowledge production similar in the developed and developing worlds?
This paper seeks to address one particular aspect of this broad theoretical issue by focusing on
collaboration in three developing areas.1 We examine two basic questions about collaborative
research. These questions derive from concerns that are widespread in the literature, but our
approach is based specifically on analyses by Lee and Bozeman (2004) and Walsh and Mahoney
(2003). First, is collaboration associated with productivity? Second, is the use of information
and communication technologies associated with a reduction in problems faced by collaborators?
We do not attempt any direct replication of these studies, owing to differences in the population
of scientists from which samples were drawn, our methods of study, and survey instruments.
However, the general absence of studies that seek to address the similarity or dissimilarity of
research processes in developed and developing areas suggests that a parallel analysis could
begin to shed some light on issues that are at least as relevant to the scientific communities of
Africa, Latin America and Asia as those in the U.S and Europe. In addition, the connectivity
initiatives2 for universities and research institutes now underway in most of the developing world
lends timeliness to this particular set of questions.
1 ‘Collaboration’ is a concept with many meanings—from the ‘great collaboration’ of Thomas Jefferson and James Madison in shaping early American institutions (Ellis, 2000) to the great collaboration of the Internet two hundred years later. Katz and Martin (1996) review some of the most important concerns with reference to the research process. 2 The international policy focus on connectivity crystallized in the recent World Summit on the Information Society (phase I Geneva 2003, phase II Tunis 2005), which focused on reducing the digital divide between the First and Third Worlds, characterizing ICT infrastructures as a policy priority. The World Bank and USAID, among many international and bilateral aid agencies, have dedicated recent efforts to resolving this disparity in connectivity among developmental spheres. It is expected, optimistically, that by facilitating information gathering and dissemination, the Internet will have positive impacts on knowledge acquisition and local adaptations throughout the globe.

3
Throughout the last century, scientific collaboration has been increasing. Co-authored
publications, especially those involving three or more authors, were increasing at such a
“violent” rate through the mid-century that early speculations suggested that the single authored
paper would be extinct by the end of the 1980s (Price 1963). While the specific prediction
proved incorrect, the structural change has been well documented by bibliometric analyses
(Bordons and Gomez, 2000; Gaillard, 1991). Why has collaboration increased? Increasing
specialization across disciplines and fields, the complexity of research problems, the rising costs
of technological apparatus, the development of new information and communication
technologies, and lower travel costs themselves would have led to an increase in scientific
collaboration even if it were neutral in terms of its meaning for policy makers and funding
agencies.
Collaboration has become something more than a neutral scientific practice. During this
same time frame, it became a scientific value as well. The necessity and perceived success of
collaboration in basic scientific fields such as high energy physics, the desire of scientists for
larger and more complex instruments, and the importance of informal communication to the
research process led eventually to positive valuation of collaboration for its own sake.3 These
3 The above considerations do not exhaust the reasons for collaborating. Lee and Bozeman (2004) distinguish between the high and low output-oriented motivations of collaboration, citing Beaver and Rosen’s 1978 typology. Output-oriented or pragmatic reasons to collaborate (Melin 2000) include access to special equipment, special skills, unique materials, visibility, recognition, time efficiency, labor efficiency, gaining experience, training researchers, sponsoring a protégé, increase productivity, multiply proficiencies, avoid competition, surmount intellectual isolation, confirmation of a research problem, intellectual stimulation of cross-pollination, spatial propinquity, accident or serendipity. Social motivations (less output-oriented) include enjoying stimulating experiences and working with old colleagues. In addition, ‘the shadow of the future’ or the anticipation of future interaction (Bouas and Arrow 1995) is an underlying social motivation for positive interpersonal behavior and feelings in shared work. That collaboration occupies the status of social good approved by science policy makers and university administrators is a recent structural wrinkle that extends to the very formation of social organization. Distributed work across a spectrum of human endeavors has been treated empirically through a variety of constructs (for example, the ambiguity – disambiguation of information and convergence of practices over distances (King and Frost 2002). These investigations address human organization as fundamentally directed toward shared or

4
considerations by no means exhaust the reasons for collaboration. Long ago Derek Price noted
that the increase in publications by prolific scientists coupled with increasing numbers of
‘minimally prolific’ scientists led to a fractionalization of research behavior, whereby prolific
scientists maintained productivity levels by becoming research group leaders (1963). Writing in
the late 1970s, Frame and Carpenter contended that the rise of international institutional
collaboration has been influenced by the growth of basic research (more international in nature
than applied research), and relative scientific capacity (scientists in small nations look abroad for
collaborations and funding opportunities) (1979). The latter is of particular relevance to
developing nations, where research capacity lags behind that of the developed world. No longer
is it necessary to justify collaboration as productive for the generation of new knowledge.
Funding programs, conferences and policy frameworks adopted collaboration as a scientific
good.
A great deal of work in bibliometrics has focused on co-authorship. But throughout the
history of social studies of science, it has never been assumed that co-authorship and
collaboration are identical. Thirty years ago Nicholas Mullins treated co-authorship and
collaboration as different kinds of relationships, both important to the development of scientific
specialties (1970). Owing to the availability of data and the ease of analysis, co-authorship has
been preferred as an indicator of collaboration, though it represents only a limited kind of
collaborative relationship. Bibliometric studies are important in tracking the extent of co-
authorship globally, changes in the degree of co-authorship and differences among countries,
regions and sectors. However, the study of co-authorship neglects many important forms of
collaborative work that benefits from the disambiguation of information and common understanding of social practices as it promotes these two aspects of human organization (Kiesler and Cummings 2002).

5
collaboration and is notably inadequate in studies of developing areas given the differences in
publication outlets and practices (Shrum, 1997). Moreover, where the indicator of an activity
(collaboration) is the output of that activity (publication), it is not possible to examine the
relationship between these dimensions as an empirical question.
In recent years the advent of the Internet has led to a second group of issues bearing on
scientific collaboration. The role of new information and communication technologies (ICTs)
and their impact on science in the developing world has been of paramount importance to the
development community. Given the importance of the scientific community to the development
of the Internet4 in the First World, ICTs have been hailed as the much needed ‘elixir’ that will
free Third World science from its relative isolation, and integrate it successfully into the global
scientific community (Davidson et al., 2002). 5 One implication is that ICTs will not only unveil
collaborative opportunities beyond developing world borders. They will reduce the
organizational problems associated with the collaborative process within and among
developmental spheres (Walsh and Mahoney, 2003) and increase the productivity levels of
collaborators (Lee and Bozeman, 2004). Of the few studies that have investigated the
relationship between ICTs and scientific collaboration, none have been conducted in the
developing world (Quan-Haase and Wellman, 2002; Finholt and Olson, 1997; Abels et al., 1996;
Galimberti et al., 2001; Koku and Wellman, 2002).
4 The ‘Internet’ is often characterized dichotomously (though not accurately), as a combination of email technology for communicating and web technology for information gathering. The empirical analysis in this paper is limited to email technology. 5 ICTs represent a convergence of a variety of network communication and media devices with links to global information sources under conditions of relative low cost and ease of access, such that many scholars point to the possibility that these new technologies will be the global integrating mechanisms, or technological ‘elixir’, within and among First and Third Worlds in social, economic, political and cultural terms (DiMaggio et al., 2001; Castells, 2000; Escobar, 1994; Uimonen, 2001).

6
These concerns lead to the two questions addressed in what follows. First, what is the
relationship between patterns of collaboration and productivity in less developed areas? More
specifically, does the relationship between publication productivity and collaborative work hold
in Africa and Asia? In the context of our study, do scientists who are involved in collaborative
projects in Kenya, Ghana and Kerala publish more than scientists who work alone? In the
developed world, the central argument for collaboration is relatively straightforward: the benefits
of projects that incorporate a technical or intellectual division of labor are greater than the costs
involved in coordination.6 This argument is central, since alternative arguments for
collaboration—e.g., that some projects require multiple sources of expertise; that tacit knowledge
is best conveyed through informal social relations; that collaboration is an important means of
mentoring students and producing scientific capital—pertain only indirectly to publication
productivity. In other words, these may well be reasons to collaborate, and they may indeed
have positive consequences for the scientific enterprise, but they do not entail higher productivity
than other research activities, which would presumably result in some kind of publication outputs
as well.
In developing areas the argument is not nearly so clear. First, the costs associated with
collaboration are much higher than in the developed world.7 Nearly all activities related to
coordination require interaction, communication and information exchange that involve
6 This relationship is infrequently tested. As Lee and Bozeman demonstrate in their review of studies, few offer any genuine empirical confirmation that increases in collaboration is associated with increases in productivity even in the developed world (2004). 7 Our project team consists of individuals from Kenya, Ghana, Kerala, South Africa, and the U.S. For those of us who work in academic institutions, particularly in sub-Saharan Africa, it is quite clear that the transaction costs incurred by local scientists involved in data gathering, knowledge dissemination, travel and communication are much higher than those faced by those in the developed world. These inflated costs to knowledge work in the developing world are even more pronounced when seen within the context of meager domestic research funds and deteriorating infrastructure within and without the walls of research facilities.

7
significant expenditures of time and energy. Even small, co-located group work involves
memos, messages and meetings that are not effortless. Organizing projects that involve
individuals from multiple organizations is much worse. As one Kenyan IT specialist put it: ‘you
know, day to day living in Nairobi is just so difficult’. Second, collaboration in developing areas
is often subject to a process of ‘reagency’ (Shrum, 2003). Most collaborative projects in the
developing world are funded by multilateral and bilateral donors, particularly in sub-Saharan
Africa, where initiatives and programs originating in distant lands lead to chains of interaction
and resource distribution that often have little to do with the intent of the donors (Shrum, 2000).
In spite of the shift in the development paradigm towards participatory initiatives in the 1990s,
reagency implies that the effects of collaboration will be mediated by contextual effects that are
difficult to predict without knowledge of local institutional dynamics. Hence, we are less
sanguine than Lee and Bozeman (2004), who recognize that the relationship between
productivity and collaboration is not patent, but feel that the arguments for a positive association
are stronger than the arguments for a negative association.8
Second, does access to information and communication technologies reduce problems of
collaboration? A major concern of our project has been to determine, over time, the influence of
recent innovations in ICTs on research collaboration in the developing world. The literature
alludes to a positive impact of ICTs on global science and collaboration through decreasing
financial costs and increasing ease of communication (Bordons et al., 1996; Gailliard, 1991;
Ding, 1998; Adam and Wood, 1999; Koku et al., 2000; Koku and Wellman, 2002). Prior
research suggests that demographic factors such as age, gender and cosmopolitanism determine
8 This positive impact, while not strong, is completely consistent with their own empirical results, even controlling for a variety of factors that might account for the relationship (Lee and Bozeman, 2004).

8
ICT adoption rates in the developing world (Rogers, 1995) as well as do variations in ICT
policies among different nations (Mbarika et al., 2003). However, systematic research on the
impact of ICTs on developing world science is absent. Computer access, email capability and
web use have been widely viewed as offering unprecedented opportunities for interaction and
collaboration within and between countries, owing to the distances involved and the absence or
degradation of infrastructure. Still, this assumption is untested. Our own experience as a team
of collaborators in four countries suggests that many of the coordination costs that affect our own
productivity also affect the collaborative benefits of new information and communication
technologies. In the second part of the analysis we begin to fill this gap by addressing the
relationship between ICTs and research problems in Kerala, Kenya and Ghana. Our approach to
this relationship is based on a recent analysis by Walsh and Mahoney (2003) using a sample of
U.S. scientists. They find that email has a positive impact in overcoming problems of
coordination, but does not reduce problems of culture or security.
In the following section, we describe the three locations of the study. Next, we consider
the data collection process and sample. Following a description of the main variables, we seek to
determine (1) the extent to which collaboration is associated with publication productivity, and
(2) the extent to which new information and communication technologies are associated with
attenuation of research problems.
Context
Just as the developing world is not a unity, knowledge in Africa, Asia and Latin America
is not produced under the same circumstances. In addition to general questions involving

9
collaboration, its association with productivity, and the factors that affect research problems, we
seek to address the degree to which these relationships are consistent across local conditions.
The sample of scientists here was drawn from universities and research institutes in three areas
representing low (Ghana), medium (Kenya) and high (Kerala) levels of development in African
and Asian research systems9. This ranking is indicated by a variety of measures (e.g., self-
reported productivity and item count from international bibliographies) and was consistent with
the general level of socioeconomic development of the three locations when the study began in
1994 (Shrum and Beggs, 1997). 10
India possesses one of the oldest and most sophisticated research systems among
developing countries (Eisemon, 1982; Krishna, 1997). The Indian Council of Agricultural
Research, for example, operates one of the largest research structures in the world. It consists of
four multidisciplinary national institutes, 45 central research institutes, 30 national research
centers, four bureaus, ten project directorates and 84 All India Coordinated Research Programs
that constitute the primary link between ICAR and the 28 State Agricultural Universities. In
addition, twenty three general universities are involved in agricultural research (Mruthyunjaya
and Ranjitha, 1998). Both the central government of India and state governments have invested
actively in ICT and scientists, as elsewhere, are early adopters of Internet technology.
The size and complexity of India make it difficult to generalize about the country as a
whole. Our focus is the state of Kerala in southwestern India. Far from arguing that Kerala is
representative of India, many have claimed precisely the opposite. The ‘Kerala Model’ of
9 The basis for comparison of these three regions results from the common colonial legacy of British rule and their varied post-colonial development strategies and present statuses. The Kerala Model deviates from the economic development paradigms adopted by most Sub-Saharan nations after independence. 10 Originally these locations were selected by an agency of the Dutch government in late 1992 to represent these levels of development.

10
development refers to the fact that the level of social development within the state is much higher
than one would expect based on its level of economic development (Jeffrey, 1992; Franke and
Chasin, 1994; Parayil, 1996). With a reputation for labor militancy and a state government often
controlled by the Communist party, capital investment and economic growth in the state remain
low and unemployment is high, even for those with higher degrees (Mathew, 1995; EPW
Research Foundation, 1994). Yet indicators of social development, including literacy rates,
demographic trends, the presence of social programs, and the status of females suggest a state
that is similar to many developed countries. Most important for our purposes is the extremely
strong emphasis on literacy and education that pervades the state (Franke and Chasin, 1994; Iyer
and MacPherson, 2000). It is not surprising that the government of Kerala supports an
independent system of research institutes and state-wide programs to generate knowledge about
local conditions. Moreover, while the level of external investment might lead one to predict a
reduced rate of diffusion compared with the Indian average, the literacy and education of
Malayali scientists indicates just the opposite: high levels of awareness of and interest in
telecommunications technology. Kerala ranks first among Indian states and union territories in
the density of telephone connections, has the third highest rate of mobile phone usage in the
country and by late 2000, there were approximately 50,000 Internet connections in the state,
ranking it eighth among Indian states (Parthasarathy, 2001).
Kenya's ‘perpetual theme’, even in a decade where most sub-Saharan African countries
were moving towards democracy, is the response by a resistant government to international and
domestic pressure (Barkan and Ng'ethe, 1998). Tribal politics and widespread government
corruption persist in spite of steadfast efforts to stimulate reform by the donor community.

11
While these data were collected in 2001, it is important to note that the seeds of change may
have been sown with the 2002 elections. Kenya possesses one of the largest scientific
communities in Africa. After rapid expansion of its university system in the 1970s, its scientific
output continued to increase despite the economic downturn of the 1980s (Eisemon and Davis,
1992). Kenya is one of seven African countries with more than ten Internet service providers
and a high-speed national Internet backbone is under development.
Ghana was the first sub-Saharan country to gain independence, but also the first to
experience violent military coups and witness promising developmental prospects deteriorate
through economic depression (Dzorgbo, 2002). Still, the authoritarian rule of its military leader
made it possible to impose the stringent financial measures required to receive continuous
structural adjustment loans since the early 1980s. Ghana remains one of the leading countries in
sub-Saharan Africa in terms of economic progress (Jeong, 1996). Academic and state research
facilities were inherited from the colonial period, but economic and political difficulties
throughout the 1980s led to scientific out-migration and a significant decline in output. Ghana
trails Kenya on many indicators of development, but not Internet connectivity, with its
liberalized telecommunications sector and VSAT connection to the international Internet
backbone.
Methodology
Data for this analysis were collected during the period 2000-2002 from scientists at
universities and research institutes in Kerala (n= 303), Kenya (n= 315) and Ghana (n= 300). The
survey instrument and methods were based on a 1994 study of approximately 300 scientists in

12
the same locations, with the following major difference. The objective of the 1994 survey was to
achieve relatively comprehensive coverage of a broad range of researchers and organizational
entities. This entailed selecting scientists from a relatively large sample of research institutes,
universities, NGOs, and international research centres. However, owing to the effort, time and
expense involved, the sample was relatively small and only a few (generally two to four)
scientists could be interviewed at each organization. The objective of the 2000-2002 survey was
to achieve better coverage of fewer organizations, in order to maximize the sample that could be
generated with available resources. The questionnaire that generated the data for the analysis
below was based on the 1994 instrument, with several pages of new items on information and
communication technologies.
Since there is typically a clustering of research institutions in urban centers, we used the
capitol city (Nairobi, Accra, Thiruvananthapuram) as a base and selected organizations that were
interviewed for the original 1994 study. These were all located in the city or a region not more
than two hours by car from the center. In each case, we contacted the Director or department
Head for permission and then contacted researchers directly based on the letter of introduction.
We sought to interview all research scientists at each organization selected.11 This resulted in a
sample of 918 scientists, about half of whom were employed in universities and half of whom
were in governmental research institutes. Face to face interviews were conducted by
postgraduate students and recent graduate students. By field, these respondent scientists are
11 For purposes of sampling, and because staff size is often similar, we consider a university department as an organization in the same sense as a research institute, most of which are under a common administrative body. It is not possible to calculate a response rate in the conventional sense. Although a percentage figure could be generated, we are reluctant because we cannot interpret it ourselves. We did not experience any refusals in the usual sense, but owing to the conditions of conducting personal interviews in these areas, we defined the population of eligible respondents as those individuals who were physically present during the data collection interval at their institutions. Individuals who are on study leave, seconded to other areas, and so forth were not considered eligible members of the population.
13
predominantly in agriculture (31%), bioscience (28%), engineering, math, and IT (16%),
chemistry and physics (9%), geology (7%), and social science (8%).
As noted above, we sought to conduct our analysis with reference to two recent studies
based on U.S. data. We do not consider it a ‘replication’, but rather an attempt to examine a set
of issues equally relevant to developed and developing areas. Hence, it is important to keep in
mind the methodologies and samples used here, in contrast to Lee and Bozeman (2004) and
Walsh and Mahoney (2003). Lee and Bozeman analyzed a sample of 443 U.S. academic
scientists affiliated with either National Science Foundation or Department of Energy research
centres. Productivity measures in this study were taken directly from the curriculum vitae of the
individuals, while other measures are based on a mail survey (44% response rate). By field,
these scientists were predominantly in engineering (41%), bioscience (15%), computer science
(6%), chemistry (11%), and physics (10%). Walsh and Mahoney (2003) utilized a mail survey
of 399 U.S. scientists (51% response rate) generated from membership directories in
experimental biology, mathematics, physics, and sociology. This procedure yielded a sample of
respondents in a variety of institutions. They limit their analysis to 230 PhD or MA scientists
who report currently being involved in collaboration, that is, 58% of their original sample.
In sum, differences in these studies include the instruments themselves,12 the method
(face-to-face interviews in Kenya, Ghana and Kerala; mail surveys in the U.S. studies), and the
samples [stratified by field (Walsh) or program (Bozeman)], as well as elements of measurement
(CVs used for publication data in the Bozeman study). These differences are addressed in the
12 Although the 1994 RAWOO survey was used as the basis for the instrument, the Walsh survey was examined by Shrum in revising the 2000 questionnaire, such that the wording of some items is identical.

14
analysis, where possible, but in some cases (e.g., the difference between face-to-face and mail
surveys) the differences await future research.
In contrast with studies of scientific publication productivity that use bibliometric
techniques, we use self-reported publication productivity. Bibliometric measures are inadequate
as indicators of scientific productivity outside the developed world (Gaillard 1991, Shrum 1997).
Our dependent dimensions are the number of articles published in national and in foreign
journals. Interviewers asked each respondent scientists how many articles they have published in
foreign and in national journals during the last five years. An additive scale was used to measure
total publications for some analyses. Because the distribution of publications is positively
skewed, we employ natural logarithms of self-reported productivity in our analyses.
Collaboration was measured in two ways to allow for the difference between intra- and
inter-organizational relationships. To measure intra-organizational collaboration, we asked for
the number of individuals with whom the respondent ‘worked closely’. We defined this concept
as those with whom they ‘currently discuss projects on a regular basis’ within several distinct
categories of collaborators. To measure the inter-organizational dimension, we used the extent
to which the respondent’s main research projects were collaborative. We asked each scientist to
briefly describe up to three specific projects.13 These items were coded dichotomously in order
to indicate whether the project involved a collaboration. The degree of collaboration was
indicated by an additive scale measuring the number of collaborative projects (0 to 3).
Control variables for our analyses are derived from previous research on scientific
productivity and collaboration. For example, Garg and Padhi (2000) have shown the effect of
13 Our interviews confirmed the opinion of our research team that scientists in these areas are likely to mention collaborative projects first because they are seen as having greater prestige.

15
contextual factors on productivity. Many authors (Campion and Shrum, 2004; Goel, 2002;
Prpic, 2002.) have found gender differences in scientific publication while others found no
significant difference between productivity distributions of male and female scientists (Gupta et
al., 1999). Previous research on the effect of age structure on productivity has shown that age
has a depressing effect on productivity (Bonaccorsi and Daraio, 2003). Control variables in this
analysis include region (coded as a dummy variable with Ghana as the reference group), sector
(coded as a dummy variable with academics as the reference group), gender (1=male; 0=female),
age, marital status (1=married;0=not married), educational credential (1=doctorate; 0=non-
doctorate), possession of a degree from a developed country (1=yes;0=no) and professional
involvement (held an office in a professional association; the number of professional meetings
attended in the last year). Field was re-coded into six major areas, Agriculture, Biology/Bio-
Technology, Geology, Chemistry/Physics, Engineering/Information Technologies, and Social
Sciences. Dummy variables were created for five fields with Social Science as the reference
group.
In the section that follows, we use averages and percentage values to describe the
characteristics of scientists in Ghana, Kenya and Kerala. Next, we examine the association
between collaboration and productivity. Finally, we present multivariate models of the
relationship between the use of new information and communication technologies and typical
problems of collaboration.
Results

16
Table 1 presents basic demographic, educational, organizational and professional
indicators for each of the three research locations. Kerala, Kenya and Ghana show significant
differences along a variety of dimensions.14 The family backgrounds of developing world
scientists reflect the continuing importance of agriculture and tend to be different from scientists
in the West. In our sample, one third of all researchers come from farming backgrounds (line
1).15 The Indian scientists are more likely to be women (37%) than those in Africa (line 2), a
finding that is not surprising given the relatively higher status of women in Kerala.16 They are
also slightly older (line 3) and more likely to be married (line 4), but have fewer children (line 5).
On average, Malayali scientists have 1.72 children, as compared with 2.69 in Kenya and 2.75 in
Ghana. This is expected, as family size is a rough reflection of the level of development in these
locations. They are also much more likely to have a spouse who is not in the labor force (line 6),
although this status only characterizes men. Spouses of researchers work in a variety of different
fields, with education the most common: nearly one quarter of scientists in Ghana have a partner
in this sector (line 7).
Education and training of scientists in developing areas has been one of the most critical
research and policy areas since the post-colonial period (Shrum and Campion, 2000). The
‘Africanization’ of research systems in former colonies was a priority through the 1980s but is
now largely complete. Table 1 indicates the level and location of training in each country. Most
scientists have an advanced degree, at least equivalent to a Master’s, though about 15% of
14 A one-way Anova post hoc multiple means comparison LSD test determined the significant differences by region. 15 Gaillard found that a high proportion of scientists come from farming backgrounds, using an elite sample of researchers in a variety of developing areas (1992). 16 Unlike the 1994 study, in which we consciously attempted to interview women scientists, the process of sampling in this study simply included all scientists at the selected institutions, so the larger number of women is likely to reflect the population of scientists in these developing areas.

17
African researchers at universities and government institutes still lack even that qualification
(line 8). Differences between locations become clear at the Ph.D. level (line 9). While over
three quarters of scientists in Kerala have a doctoral degree, fewer than half are qualified at the
highest level in the African locations. Only 42% of Kenyan scientists and even fewer Ghanaians
(39%) possess the Ph.D.
Differences in the place of training are also quite evident in Table 1. Two thirds of
Kenyans and 57% of Ghanaians have a degree from an institution in a developed country, as
contrasted with only 5% of Malayali scientists (line 10). This difference is reflected in the
amount of experience abroad, with most South Indian scientists in our study never having left
their country, while most of the African scientists have spent several years in the developed
world. Kenyan scientists have experienced an average of three years abroad in developed
countries, while Ghanaians nearly double that duration (line 12). These differences between the
African and Indian scientists are explained by two primary factors. First, the opportunities for
higher education and training are much greater in India as a whole (not simply Kerala), with
many Malayali scientists traveling to Tamil Nadu, Karanataka, Delhi, Mumbai and other areas
for advanced education. Second, international donor attention has long favored Kenya and
Ghana as targets of multilateral and bilateral aid. One of the ways that the educational sector has
benefited from this aid has been through scholarships for Africans to study in universities in the
developed world, particularly in English-speaking locations.
Across the three contexts, as Table 1 shows, these scientists vary in the focus of their
work. Malayali scientists are most likely to report that research is their most important interest,
followed by Kenyans and then Ghanaians respectively (line 13). This perception is supported by

18
self-reported activities. The Indian scientists work more hours per week and spend more time on
research than their African counterparts by a significant amount (lines 14-15).17 This difference
is partly explained by the fact that some Indian institutions in our sample are subject to a six-day
workweek. However, it should be noted that scientists in all locations work in excess of their
prescribed 40 hour work week. Even Kenyans report spending more than 21 hours per week on
research activities (line 14-15). We measure professional involvement with indicators of
attendance at meetings and positions held. Line 16 shows that Kenyans are least likely to hold
an office in a professional association. The African scientists in this study attend significantly
fewer professional meetings than Malayali scientists (line 17).
Collaboration and Productivity
To what extent is collaboration associated with publication productivity? In this section
we examine this relationship, and compare our results with that of Lee and Bozeman. We
consider productivity as the dependent dimension, collaboration as the independent dimension,
and several important controls in a multivariate model.18
As their primary measure of productivity, Lee and Bozeman (2004) use the number of
papers published in the last five years.19 For their sample of U.S. academicians, they find an
17 Malayali scientists spend an average of 10 hours more on research each week than Kenyans. 18 To reiterate, the analysis cannot be considered a precise replication. Hence, it is important to keep in mind the methodologies and samples used here, in contrast to Lee and Bozeman (2004). 19 A key issue in the measurement of publication productivity is the use of ‘normal’ or ‘fractional’ counts. In the former method, all publications are counted equally regardless of the number of coauthors. In the latter, the number of publications is divided by the number of co-authors in an attempt to correct for the partial contributions implied by the division of labor in a multi-authored paper. Lee and Bozeman, using CV data on publications, find that (1) the correlation between normal and fractional count productivity is extremely high (.928), and (2) the association between normal count productivity and collaboration (.209) is even stronger than between fractional count productivity and collaboration (.147). Thus, the absence of a measure of fractional count productivity for our sample of scientists in developing areas is unlikely to be critical.
19
average ranging from 14.40 papers for assistant professors to 25.75 papers for full professors.20
While our study used self-report rather than CV data, the large difference in publication
productivity is apparent.21 In the developing context, the self-reported sum of articles in national
and foreign journals was 4.5 (line 18) for both academic and government researchers. While
self-report and CV data are not to be seen as equivalent measures, both the African and Indian
respondents in our study published at a significantly lower rate than Bozeman’s sample of U.S.
scientists. As a rough estimate, U.S. publication productivity is higher by a factor of four.22
Within developing areas, however, there are significant differences. The mean number of
total articles (foreign and national journals) ranges from 7 articles in Kerala, to 3.6 in Ghana and
2.5 in Kenya (line 18). The African averages are contrary to our expectations based on the
general level of development of these locations. Malayali scientists are generally higher on the
conventional measures of publication productivity (papers written in the past year, papers at
national workshops, articles in national journals, book chapters and total articles). Kenyans are
lowest on all measures of productivity except reports.23 However, Ghanaians attend more
international conferences, produce more reports and write more articles for international
journals.24 These reversals of productivity with levels of development may be indicative of the
attention that Ghana has received for its structural adjustment programs in the 1990s—at the
20 Bozeman (2003). Personal communication. 21 We asked a series of questions about the respondent’s productivity over the last five years (papers at state or national workshops, international conferences, reports (published or otherwise), bulletins for extension, articles in foreign journals, articles in national journals, chapters in books, and so forth). In addition, we asked directly how many research papers the respondent had written over the past 12 months (our measure did not distinguish between single and co-authored papers). In the present analysis we focus only on published articles. 22 Multiplying the Lee and Bozeman figures in their Table 3 (2004) to get an overall mean for the sample yields an average of 18.9 articles for a five year period, as compared to 4.5 for our sample of developing world scientists. 23 Our question on reports included unpublished items. 24 Data available from the authors.
20
same time that Kenya was receiving repeated sanctions from the international donor community
for corruption and mismanagement of national resources.
To what degree do scientists in developing areas collaborate? As described above, two
sets of questions provide indicators of collaboration within and outside the organization.25
Internal collaboration was measured by the number of individuals with whom the respondent
‘worked closely’, distinguishing between the following categories of individuals: professional
scientists and engineers, technicians and field workers, doctoral students, postgraduate students
(M.A., M.S., M. Phil., etc.) and non-technical staff. Table 1 shows that for all groups except
students, Ghanaians report more collaborators, followed by Kenyans (lines 21-25).26 However,
in training doctoral students, these interaction patterns are reversed (line 23). This is consistent
with the greater development of Ph.D. programs in India—as well as the above finding that the
African scientists in this study are much more likely than Malayali scientists to receive
postgraduate education abroad. Line 26 of Table 1 shows the results of combining student and
professional collaborators within the respondent’s organization. Differences between countries
diminish but do not disappear—internal collaboration is higher in the location often
characterized as having the lowest level of development.
However, the issue of scientific collaboration and productivity is not primarily about
intra-organizational processes, particularly in the context of development. Inter-organizational
collaboration reflects different dynamics in much of the developing world, including sub-
Saharan Africa. Because such a large proportion of resources for collaboration originate in other
25 Since Lee and Bozeman combine measures for internal and external collaboration (2004), none of our measures are directly comparable. However, we argue that these two forms of collaboration are not only analytically distinct but have quite different implications in developing areas where digital divide and reagency issues are important. 26 African university scientists work closely with over five other professionals in their organizations, as compared with only three for Malayali scientists.
21
lands, it is subject to a process of reagency: many collaborative projects are generated by
initiatives and programs from outside the local context. As line 27 of Table 1 shows, there are
large differences in the sheer number of reported projects by location. We asked respondents,
‘How many research projects are you involved in altogether?’ Malayali’s report more research
projects and Kenyans report the fewest, for both academic and governmental research sectors. In
the remainder of our analysis, we neglect the number of specific collaborators, which is
extremely difficult to estimate, even in our own research project. We measure, instead, the
extent to which a scientist’s main research projects are collaborative.
Our measure of external, or interorganizational, collaboration was coded from items in
which the respondent described up to three main research projects. Here we examine (1)
whether the scientist was involved in any collaboration, and (2) the degree of collaboration,
indicated by number of collaborative projects (maximum of three). The results show clear
differences among these social contexts: Kenyans lead in external collaborations, with Ghanaians
second and Malayali scientists last. Most African scientists are involved in projects that have
some degree of interorganizational collaboration. For Kenyan researchers, the vast majority
(86%) are engaged in collaboration, followed by three quarters of Ghanaians. This compares
with only 39% of scientists in Kerala (line 28). The difference is even more evident in the
average number of collaborations. Line 29 in Table 1 shows that Kenyan scientists have an
average of 1.71 collaborative projects, as compared with 1.37 for Ghanaians, while Malayali
scientists report fewer than one (.64).
These results are not what one would expect if there were a clear and straightforward
relationship between collaboration and publication productivity at the level of the national or
22
regional research system. Kenyan researchers have the lowest levels of productivity but the
highest levels of external collaboration, just the opposite of what we would expect if the benefits
of collaboration exceed its costs. We next examine this relationship at the individual level: Does
collaboration increase productivity in developing areas, net of other dimensions?
Table 2 shows the results of regressing the logarithm of productivity on collaboration
with several important control variables, including marital status, and organizational and
professional context. We considered a variety of more complex models, excluding variables
such as gender, location of graduate degree, years spent abroad in developed countries, and
domestic support that had weak or inconsistent relationships with the primary measures of
productivity.27 Column 1 provides standardized regression coefficients and levels of significance
for a model that explains nearly one quarter (.235) of the variation in total productivity for all
scientists in our sample with five factors, including the degree of interorganizational
collaboration. Marital status, education, professional involvement, and professional status are
significantly associated with publication productivity. Those who are married, with a doctorate
in their field and those who have held office in a professional association have higher rates of
publication than others. Further, attendance at professional meetings is associated with
productivity. For the full sample, however, the coefficient for collaboration is not statistically
significant: collaboration is unrelated to productivity.
Columns two and three in Table 2 show the results of estimating the model separately for
respondents in universities and governmental research institutes. In the first regression, for
academics only, collaboration is positively and significantly associated with productivity.
27 In addition to these factors, we tested a large number of variables that were uncorrelated with productivity and unrelated to the various measures of output in any of our regression models.
23
However, for scientists employed in research institutes (column 3) the coefficient for
collaboration is negative and statistically significant at the .05 level. Not only do collaborative
efforts fail to improve productivity for government scientists, but according to the evidence
provided in Model 3, they may actually hinder the production of written output. The final
models in Table 2 present the results of regressing total productivity on the same set of
independent variables, separately for each geographical context (columns 4 through 6). Here, the
coefficient of collaboration is significant and positive only for Kenya—for the Kerala and Ghana
models it is not. In one national context out of three, collaboration seems to aid publication
output. Separate consideration of organizational and sectoral context indicates that, at minimum,
collaboration is not consistently related to productivity.
In interpreting this result, we noted that our own social scientific collaboration
necessarily involved precisely the same locations as the scientists we study. In reflecting on the
differences between Kerala, Ghana and Kenya as well as the differences between our own local
institutions, it seemed obvious that collaboration was more difficult and costly in some locations
than others. Further, scientists in developing contexts face another issue, unknown to those in
other contexts. Do they strive for recognition in the international scientific community? In this
case, what matters is publication in international journals, the ‘gold standard’ for tenure in
universities or high performance evaluations in national research institutes. Or do they focus on
publication in local outlets, invisible to scientists in the international community, but important
for the dissemination of information in the regional context? Total productivity consists of the
sum of articles in foreign and national journals but yields little in terms of the overall
understanding of publication productivity in the developing world.
24
The regression analyses in Table 2, while relevant for a general consideration of the
collaboration-productivity relationship, does not adequately reflect contextual or productivity
differences. Hence, we distinguish between ‘foreign’ and ‘domestic’ productivity. Table 3
shows the results of estimating separate models for each location and research sector, using the
same set of independent variables as predictors of productivity. While the number of cases is
reduced, the primary interest here is in determining the specific sectoral and social contexts in
which there is evidence of a positive effect of collaboration. Rows 5 and 12 give the coefficient
of collaboration for each of the six contexts defined by the cross-classification of sector
(academic/state) and location (Kerala/Kenya/Ghana). Collaboration is associated with
publication productivity only for the sample of academic scientists in Kenya. The coefficient is
statistically significant for both international and local publications. For other locational and
sectoral contexts there is no evidence of a positive effect for productivity.28 For the five-factor
model, there is no evidence that Malayali or Ghanaian scientists benefit from collaboration,
regardless of whether they are employed in academic or government research contexts. We
return to these issues in the discussion.29
Email Use and Problems of Collaboration
28 The models that best predict foreign and domestic productivity are somewhat different for each context. However, our purpose here is to examine the effect of collaboration rather than explain productivity. 29 As one reviewer noted, the distribution of fields in the sample could affect the relationships discussed here, since scientific fields often differ in their organization and outputs. In the full sample, only one field of the six fields was associated with collaboration and only two fields differed in average productivity. Controlling for sector and location, two fields were associated with productivity at the .10 level, but not even these were significant with our standard control variables added. When separate models for productivity are estimated for each region and field, collaboration is only associated with productivity for two fields, both in Kenya: Agriculture and Biology/ Bio-Technology. Disaggregating by domestic and foreign publication, the results were not significant. No significant association was found for any other field in Kenya or any field in Kerala or Ghana. Thus, while there are some field differences, these do not affect our general conclusions. Tables demonstrating the relationships found in this study between collaboration and productivity by field and region are available upon request.
25
Collaboration leads to higher productivity in some contexts but not others. It has larger
and more consistent effects in Lee and Bozeman’s sample of U.S. scientists than in our sample of
scientists from Africa and India. The basic argument for collaboration is that the benefits of
projects incorporating an intellectual division of labor are greater than the costs involved in
coordination. Is it the case that these costs are greater in developing areas, such that there is no
net benefit in collaborating? Indeed, a cynical reading of Table 2 suggests that collaboration
actually retards total productivity for scientists in research institutes. The difficulties of
communication and coordination faced by scientists in the Third World are substantially greater
than those faced by collaborators in developed countries. This is true for collaboration between
developed and developing country scientists, and it is also true when collaborators are in the
same city, whether that city is Nairobi, Accra, or Thiruvananthapuram. Where costs of
coordination are high, the net benefits of collaboration may often be indeterminate.
In developed areas, the primary technology of collaboration is the Internet, and
particularly communication via email. While email technology is available globally, local
variation in connectivity is immense. Most scientists in developed areas function in a situation
characterized by permanent access and high bandwidth. Walsh and Mahoney’s analysis of U.S.
scientists suggests that access to information and communication technologies reduces problems
of coordination in collaboration (2003). If research processes are similar in developed and
developing countries, then we would expect access to email to attenuate coordination difficulties
there as well. But the conditions that render the relationship between collaboration and
productivity problematic may also undermine the collaborative benefits of the Internet. In this
section we address this question, following the logic of Walsh and Mahoney’s analysis: Do those

26
who make greater use of email report fewer problems of coordination? To reiterate, the analysis
cannot be considered a precise replication. Hence, it is important to keep in mind the
methodologies and samples used here, in contrast to Walsh and Mahoney.
Table 4 presents several measures of problems and Internet access for each research
location. Again, Kerala, Kenya and Ghana show significant differences along a variety of
dimensions. We asked respondents to indicate the extent to which each of ten issues was a major
problem, a minor problem, or not a problem in their current research. In general, the African
scientists examined here report more problems, from contacting people and coordinating
schedules, to information issues such as transmittal and security, to the division of work and
resolution of conflicts. Within the African sample, Kenyans report more problems than
Ghanaians on almost every issue, with only two exceptions.30
Though there are significant differences in every problem variable, we focus on the four
variables with the largest between-country differences: contacting people when needed,
transmitting information, keeping others informed and security of information. The first three
variables are similar to Walsh and Mahoney’s ‘coordination’ dimension, while the last variable is
similar to their ‘security’ dimension.31 The average score for each of these variables is lowest
for Kenyans, who report the most difficulty with coordination and security issues.32 These
factors are associated with collaboration in the expected direction, with more difficulties reported
by those who collaborate. Table 5 provides the results of an independent samples t-test for these
30 Neither of these mean differences is statistically significant. 31 Walsh and Mahoney (unpublished) use a factor analysis to reduce fifteen items to two primary dimensions. As is often the case with factor analysis, factors are difficult to interpret. Factor 2, called ‘cultural/security’, includes such diverse items as resolving conflicts, integrating other cultures, and security of information—items that are correlated in a principal components extraction, but are distinct conceptually. We tried a factor analysis as well, but opted to analyze several key items without any technique for data reduction. 32 Owing to the direction of coding, lower scores indicate larger problems.

27
four dimensions of research problems. In each case, scientists who report one or more project
collaborations are significantly more likely to report problems than those who do not collaborate.
In this sense, collaboration does imply the existence of more research problems.
Although we asked a variety of questions on email, web and computer use, one of the
best indicators is the simplest: ‘Do you have access to email?’ While this measure does not
distinguish frequency, location, or motivation for the use of Internet technology, it reveals
significant variation between African and Indian scientists in this study, as well as differences
between Kenyans and Ghanaians. A large majority (86%) of Malayali scientists report access to
email, as compared with two-thirds of Ghanaians (65%) and only half (51%) of Kenyan
scientists. The ranking is similar for both email access and research problems: the location with
the highest access to email reports the fewest difficulties in research. The issue that remains is
whether scientists with access to email report fewer problems of coordination, controlling for
other factors.
Table 6 shows the results of eight multivariate regression models, two for each of the four
research problems. A variety of other models were tested using the same control variables
presented in Table 2 but these produced no significant increment in fit. That is, the factors
associated with reported difficulties in research are largely different than those influencing
productivity. Models one, three, five and seven in Table 6 show that collaboration and access to
email are significantly associated with research problems. Since higher values on problem
variables represent fewer research problems,33 the positive (standardized) coefficients in line 1
indicate fewer research problems, while the negative coefficients in line 2 indicate greater
33 That is, a code of ‘1’ represents a ‘major problem; ‘2’ represents a ‘minor problem’’; ‘3’ is used for ‘not a problem’.

28
problems. Email has consistent positive effects, indicating that those with access to the Internet
are less likely to report problems contacting people, transmitting information, keeping others
informed and maintaining the security of information. Collaboration, as we expected, is
associated with these problems, even controlling for access to email.
The final series of models is reported in columns two, four, six and eight of Table 6.34
The difference between these four models and their simpler counterparts is the inclusion of
controls for sectoral and locational contexts. Dummy variables are included for Kerala and
Kenya (Ghana is used as the comparison category) to control for social context. To control for
organizational context, a dummy variable is included for research sector (universities are used as
the comparison category). What emerges from the even-numbered models in Table 6 is that the
coefficients for collaboration are no longer statistically significant. The reduction in impact is
primarily attributable to location. Locational controls have a significant impact for all models,
while organizational context is not a significant predictor of problems in three of the four
models.35 In sum, controlling for context, there is no evidence that collaboration is related to
research problems. Comparing pairs of models with and without controls for location, the
negative impact of collaboration disappears. In each of the four models, Kenyans are
significantly more likely to report difficulties in the conduct of research. For three of the four
models, Malayali scientists report significantly fewer difficulties.36
For the three indicators of coordination, email access continues to be significantly
associated with fewer problems, as indicated by the positive, standardized coefficients in row
one. Difficulties in contacting people when needed, transmitting information and keeping others
34 Negative coefficients indicate a positive relationship owing to the coding of the dependent variable. 35 Government scientists are more likely to experience difficulties with the security of information. 36 Ghanaians, as the baseline category, report more difficulties than scientists in Kerala, but fewer than Kenyans.
29
informed are less for those who report Internet availability. However, problems involving
security of information do not fit the pattern: access to email is unrelated to such reports.
Discussion
These results overcome several weaknesses of prior studies and shed light on the process
of scientific collaboration in developing areas. First, by focusing on self-reports of
collaborations we began to address some of the measurement problems resulting from the prior
focus on co-authorship. Not only are the bibliometric data bases typically used in co-authorship
studies inadequate indicators of collaboration, but a focus on published work confounds
indicators of independent and dependent dimensions that might otherwise be used to examine the
relationship between collaboration and productivity. Second, the distinction between publication
in domestic and foreign journals has not been sufficiently addressed in prior studies. Analytic
merger of these two kinds of productivity fails to distinguish an important source of meaning for
knowledge production in Africa, Latin America, and Asia and precludes consideration of the
ways that knowledge claims are shaped by local concerns. Third, by including scientists in both
governmental research centres and academic departments we began to address the differences in
institutional settings that have been important for the research process since the colonial era.
Finally, the comparative analysis of developing areas continues to be a rarity in social studies of
science.
In conjunction with papers by Lee and Bozeman (2004) and Walsh and Mahoney
(unpublished) these results suggest ways in which the research process differs in developed and
developing areas. We focused on two questions: First, is collaboration associated with
30
productivity, controlling for other factors? Second, does the Internet reduce problems associated
with collaboration? Most important, the results above suggest a paradox that raises a number of
questions for future studies: the very conditions that make the relationship between
collaboration and productivity problematic in developing areas also undermine the collaborative
benefits of new information and communication technologies.
Our general findings at the level of the regional scientific community show that scientists
from Kerala are the most productive, have the best access to email and report the fewest
problems in their research—they are also the least collaborative. At the other extreme, Kenyan
scientists are the least productive, have difficulty with email access and report the most research
problems, but they manage to collaborate a great deal. At the level of the individual scientist,
both developmental context and organizational sector are important contextual factors in
reference to the question of productivity, while only context matters for the question of research
problems. The patterns vary among the three sub-Saharan African and South Asian settings
examined here, and are significantly different from those observed in two recent studies of the
developed world.
In the first instance, Lee and Bozeman (2004) find that the number of collaborators has a
positive impact on publication productivity for academic scientists in the U.S. controlling for a
wide range of other factors. We find that the number of collaborations has no association with
total productivity for the sample as a whole, a limited association with the productivity of
academic scientists and, if anything, a negative association with the productivity of scientists in
government research centres. But such an analysis does not bear excessive weight in the
developing world, where an important career distinction is drawn between publication in local

31
and international outlets. When we controlled adequately for both institutional and locational
context, the association of collaboration with productivity was quite limited. Greater
collaboration was associated with improved productivity only for academic scientists in Kenya.
While we are not able to determine the reasons for this in the context of the present analysis, it is
likely that many of these collaborations occur under special conditions. University scientists in
the Nairobi area have significant opportunities for interaction with programs and scientists in a
variety of international agencies, including a number of major international research centres in
agriculture and the environment in the immediate area.37 The concentration of such international
organizations in Nairobi is rare, perhaps higher than any other city in the developing world, but
certainly greater than any in sub-Saharan Africa. It remains for further research to determine
whether these collaborations are responsible for the positive impact of collaboration on
productivity for Kenyan academics—as well as the reasons why such relationships are not
effective for state scientists.
In the second, Walsh and Mahoney (unpublished) provide convincing evidence that email
reduces problems of research coordination, a finding that implies concrete benefits for
connectivity for scientists in the developing world. Their analysis is limited to approximately
3/5 of the full sample who are currently involved in collaboration and does not address whether
collaboration itself leads to problems. To the extent that both our own sample of scientists and
Walsh and Mahoney’s sample are representative of their respective populations, the African
scientists we studied collaborate significantly more than U.S. scientists, while Indian scientists
collaborate less. This pattern is consistent with an interpretation of science in sub-Saharan
37 These include the International Centre for Insect Physiology and Ecology, the International Centre for Research in Agroforestry, the International Livestock Research Centre, and the United Nations Environmental Program, among others.

32
Africa that stresses the importation of initiatives and programs from afar that is the foundation of
reagentive processes. To the extent that less developed areas absorb and redirect action in ways
that are unintended and unpredictable, the problems experienced by scientists are not simply the
result of a different cost/benefit ratio of collaborative projects, though that is certainly true as
well. Since our analysis included both collaborators and non-collaborators, we are able to show
directly (Table 5) that collaboration is associated with research problems. Yet this is only part of
the story. Email access is associated with fewer difficulties, but problems of collaboration per se
are substantially an effect of local context. As we have seen, Kenyans are highly collaborative
but report greater difficulties—that is, controlling for location, collaborators report no greater
problems than non-collaborators.
It is dangerous to speculate about the effects of the Internet on the production and
dissemination of knowledge without close attention to the local context (represented by country
or region), and institutional context (represented by organizational type). Another finding that
merits further examination is the positive, though conditional, influence of the Internet. Not only
does email access reduce certain kinds of research difficulties, but the location with the highest
level of connectivity, Kerala, reports the fewest difficulties in research. We end with a
speculation regarding the observed pattern of relationships between context, email, research
problems, collaboration and productivity.
The Indian scientists in our study enjoy greater access to the Internet, which helps to
explain their lower levels of research problems. This paves the way for increased collaboration;
yet Malayali scientists do not take advantage of this, collaborating at less than half, while
producing at almost twice the level of their African counterparts. Does the source of the high

33
productivity of Malayali scientists lie in their use of the Internet to reduce research problems, at
the same time that they are structurally constrained from increasing their collaborative behavior?
This structural constraint involves their position within a larger national scientific system, their
higher levels of education and their relative isolation from the international research networks
that might be generated through education abroad. As a result, scientists in Kerala avoid
additional research problems, focus more on national than international productivity, and thus
enjoy the pure productivity benefits accruing to those who employ new ICTs.
African scientists make limited use of the Internet to reduce research problems. Given
the continual economic difficulties faced by professionals who are not politically connected, they
are encouraged to take up ‘collaborations for development’, regardless of their direct connection
with personal scientific interests. They search for consulting projects and teach additional
courses for needed familial income. As they brave the deadlines, hazards, and reporting
requirements of increased collaboration, they undermine gains in productivity by incurring
additional research problems.38 If this is the case, then collaborative projects are hardly the
productivity booster that is demonstrated by Lee and Bozeman for U.S. scientists. And while the
Internet may still prove to be an ‘elixir’ for developing world productivity, it may only be so for
those who take advantage of its problem-solving attributes while keeping their collaborative
behavior stable. If developing world scientists take advantage of the Internet to increase
collaboration, they may cancel out any productivity benefits by escalating the liabilities of shared
work as well. Such an interpretation would lend support for policy initiatives aimed at
38 For instance, one of our own teams undertook an investigation of crime and youth in urban areas that was so fraught with problems and so poorly funded he was required to supplement the project budget from scarce personal funds. Under the circumstances, publication of the results in a refereed journal was not a high priority at the end of the study.
34
promoting Internet connectivity in developing regions, but also a re-evaluation of assumption-
laden policies aimed at promoting collaboration for its own sake.
It is in this sense that research collaboration presents a paradox for less developed areas.
The research institutions of sub-Saharan Africa, for which collaboration has seemed to hold the
greatest promise, are the least equipped to benefit, since the very conditions that problematise the
relationship between collaboration and productivity also undermine the benefits of new
information and communication technologies. It is not collaboration, or collaboration alone, that
causes research problems, but poverty, corruption, family obligations—in short, the routine of
everyday life. That same routine may change the relationship between connectivity and
collaboration, between Internet access and use, between the advantages and costs of regular
efforts to coordinate activity. While collaboration may enhance productivity in the developed
world, this study suggests that no such relationship should be expected where collaborations are
introduced by donors from afar. Likewise, the balance of costs and benefits for new ICTs in
developing areas remains an open question, though our results suggest some reason for
optimism. This owes much to specific contextual and institutional processes and ultimately
implies that knowledge production in developing areas is in significant respects dissimilar to that
in the developed world. We have begun a new set of qualitative interviews in these locations,
hoping to learn more about the social processes that underpin and explain the differences
reported here.
It has not escaped our attention that the collaboration paradox introduced here bears some
resemblance to the productivity paradox observed at the national level in connection with ICTs
in developed countries. While evidence from the U.S. suggests that ICTs have had an important

35
impact on economic performance, such evidence is difficult to find in other nations. This deficit
does not simply refer to developing areas, but to Europe in particular—the social changes
wrought by ICTs surround us, but the benefits of investment in ICTs have simply been difficult
to observe in productivity, income, or welfare (Clarke, 2003). Productivity and collaboration
paradoxes allude to the puzzles generated by contextual conditions that shape differential or
negative impacts of new information and communication technologies. While one response to
the productivity paradox is simply that not enough has been invested in ICTs, it seems crucial for
students of science and technology to take a more critical view of collaboration and its
constraints.
36
References
Abels, Eileen G., Peter Liebscher, and Daniel Denman (1996) ‘Factors that Influence the Use of
Electronic Networks by Science and Engineering Faculty at Small Institutions’, Journal
of the American Society for Information Science 47: 146-58.
Adam, Lishan and Frances Wood (1999) ‘An Investigation of the Impact of Information and
Communication Technologies in Sub-Saharan Africa’, Journal of Information Science
25: 307-18.
Barkan, Joel D. and Njuguna Ng'ethe (1998) ‘Kenya Tries Again’, Journal of Democracy 9: 32-
48.
Beaver, D. and R. Rosen (1978) ‘Studies in scientific collaboration: Part I -- The professional
origins of scientific co-authorship.’ Scientometrics. 1:64-84.
Bouas, K. S. and H. Arrow (1996/1996) ‘The development of group identity in computer and
face-to-face groups with membership change.’ Computer Supported Cooperative Work,
4: 153-178.
Bonaccorzi, A. and C. Daraio (2003) ‘Age Effects in Scientific Productivity: The Case of the Italian
National Research Council.’ Scientometrics 58(1): 49-90.
Bordons, Maria, Isabel Gomez, M. Teresa Fernandez, M. Angeles Zulueta, Aida Mendez (1996)
‘Local, Domestic and International Scientific Collaboration in Biomedical Research’,
Scientometrics 37: 279-295.
Bordons, Maria and Isabel Gomez (2000) ‘Collaboration Networks in Science’, in Blasie Cronin
& Helen Barsky Atkins (eds) Information Today (Medford, N.J).

37
Campion, Patricia and Wesley Shrum (2004). ‘Gender and Science in Developing Areas.’
Science, Technology, and Human Values 28 (4): ??
Castells, Manual (2000) The Rise of the Network Society. 2nd ed. (Oxford: Blackwell Publishing).
Clarke, Matthew (2003) e-development: Development and the New Economy. United Nations
University: World Institute for Development Economics Research. Policy Brief #7.
Helskinki, Finland.
Cohen, Jon (2000) ‘Balancing the Collaboration Equation’ Science 23: 2155-2159.
Davidson, Theresa, R. Sooryamoorthy, Wesley Shrum (2002) ‘Kerala Connections: Will the
Internet Affect Science in Developing Areas?’ in Barry Wellman and Caroline
Haythornthwaite (eds), The Internet in Everyday Life (Oxford: Blackwell).
DiMaggio, Paul, Eszter Hargattai, W. Russell Neuman, and John Robinson (2001) ‘Social
Implications of the Internet’, Annual Review of Sociology : 307-36.
Ding, Ying. (1998) ‘Scholarly Communication and Bibliometrics: Part II. The Scholarly
Communication Process- Literature Review’, Information and Development 23/3: 3-19.
Eisemon, Thomas O. (1982) The Science Profession in the Third World: Studies from India and
Kenya (New York: Praeger).
Eisemon, Thomas O. and Charles H. Davis (1992) ‘Universities and Scientific Research
Capacity’ Journal of Asian and African Studies 27: 68-93.
Ellis, Joseph J. (2000) Founding Brothers: America’s Revolutionary Generation (New York:
Alfred Knopf).
EPW Research Foundation (1994) ‘Social Indicators of Development for India-II: Inter-State
Disparities’ Economic and Political Weekly 29 (21 May 1994): 1300-1308.
38
Escobar, Arturo (1994) ‘Welcome to Cyberia: Notes on the Anthropology of Cyberculture’,
Current Anthropology 35: 211-31.
Finholt, Thomas, and Gary M.Olson (1997) ‘From Laboratories to Collaboratories: A New
Organizational Form for Scientific Collaboration’, Psychological Science 8:28-36.
Frame J.D. and M.P. Carpenter (1979) ‘International research collaboration’, Social Studies of
Science, 9: 481-497.
Franke, Richard W. and Barbara H. Chasin (1994) Kerala: Radical Reform as Development in
an Indian State (Oakland, CA: Institute for Food and Development Policy).
Gailliard, Jacques (1991) Scientists in the Third World. (Lexington: University of Kentucky
Press).
Gaillard, Jacques (1992) ‘Use of Publication Lists to Study Scientific Production and Strategies
of Scientists in Developing Countries’, Scientometrics 23(1): 57-73.
Galimberti, C., S. Ignazi, P. Vercesi, and G. Riva (2001) ‘Communication and Cooperation in
Networked Environments: An Experimental Analysis’, Cyberpsychology and Behavior
4: 131-146
Garg, K. C. and P. Padhi (2000). ‘Scientometrics of Prolific and Non-Prolific Authors in Laser
Science and Technology.’ Scientometrics 49(3): 359-371.
Goel, K. (2002). ‘Gender Differences in Publication Productivity in Psychology in India.’
Scientometrics 55(2): 243-258.
Gupta B. M., S. Kumar, and B.S. Aggarwal (1999). ‘Comparison of Productivity of Male and
Female Scientists in CSIR.’ Scientometrics 45(2): 269-289.

39
Hicks, DM, Katz JS (1996) ‘Where is science going?’ Science, Technology & Human Values,
21: 379-406.
Iyer, Sundara Ramanatha and Stuart MacPherson (2000) Social Development in Kerala: Illusion
or Reality? (Aldershot: Ashgate).
Jeffrey, Robin (1992) Politics, Women, and Well Being: How Kerala Became a Model (London:
Macmillan).
Jeong, Ho-Won (1996) ‘Ghana: Lurching Toward Economic Rationality’, World Affairs 159: 64-
71.
Katz, J Sylvan and Ben R. Martin (1996) ‘What is Research Collaboration?’, Research Policy
26: 1-18.
Kiesler, Sara and Jonathon Cummings (2002) ‘What Do We Know about Proximity and Distance
in Work Groups? A Legacy of Research’ in Pamela Hinds and Sara Kiesler (Eds)
Distributed Work. Cambridge: MIT Press.
King, John L. and Robert L. Frost (2002) ‘Managing Distance over Time: The Evolution of
Technologies of Dis/Ambiguation’ in Pamela Hinds and Sara Kiesler (Eds) Distributed
Work. Cambridge: MIT Press.
Koku, Emmanuel, Nancy Nazer, Barry Welman (2000) ‘Netting Scholars: Online and Offline’,
American Behavioral Scientist 43:
Koku, Emmanuel F. and Barry Wellman (2002) ‘Scholarly Networks as Learning Communities:
The Case of TechNet’ in Sasha Barab and Rob Kling (eds), Designing Virtual
Communities in the Service of Learning (Cambridge: Cambridge University Press).

40
Krishna, V.V. (1997) 'A Portrait of the Scientific Community in India: Historical Growth and
Contemporary Problems', in J. Gaillard, V.V. Krishna and R. Waast (eds), Scientific
Communities in the Developing World (New Delhi: Sage): 236-80.
Lee, Sooho and Barry Bozeman (2004) ‘The Impact of Research Collaboration on Scientific
Productivity’. Manuscript under review at Social Studies of Science.
Mathew, E.T. (1995) ‘Educated Unemployment in Kerala: Some Socio-Economic Aspects’,
Economic and Political Weekly 30 (11 February 1995): 5-35.
Melin, G. (2000) ‘Pragmatism and self-organization Research collaboration on the individual
level.’ Research Policy, Vol. 29: 31-40.
Mbarika, Victor W. A., Mike Jensen, Peter N. Meso (2003) ‘Cyberspace Across Sub-Saharan
Africa: From Technological Desert Towards Emergent Sustainable Growth?’
Mruthyunjaya and P. Ranjitha (1998) ‘The Indian Agricultural Research System: Structure,
Current Policy Issues, and Future Orientation’, World Development 26: 1089-1101.
Mullins, Nicholas (1970) Theories and Theory Groups in Contemporary American Sociology.
New York: Harper.
Parayil, Govindan (1996) ‘The 'Kerala Model' of Development: Development and Sustainability
in the Third World’, Third World Quarterly 17: 941-57.
Parthasarathy, Anand (2001) ‘Between You and Me’, The Hindu (27 August 2001): 5.
Price, Derek J. de Solla (1963) Little Science, Big Science. New York: Columbia University
Press.
Ppric, K. (2002) ‘Gender and Productivity Differentials in Science’, Scientometrics 55(1): 27-58.
41
Quan-Haase, Anabel and Barry Wellman (2002) ‘How Does the Internet Affect Social Capital?’
Rogers, Everett M. (1995) Diffusion of Innovations. 5th ed. (New York: Free Press).
Sancho, R. (1992). ‘Misjudgements and Shortcomings in the Measurement of Scientific
Activities in Less Developed Countries’, Scientometrics 23: 221-233.
Sen, B. K. and V. V. Lakshmi (1992) ‘Indian Periodicals in the Science Citation Index’,
Scientometrics 23: 291-318.
Shrum, Wesley (1997) 'View From Afar: “Visible” Productivity of Scientists in the Developing
World', Scientometrics 40: 215-35.
Shrum, Wesley (2000) ‘Science and Story in Development’, Social Studies of Science 30: 95-
124.
Shrum, Wesley (2003) ‘Reagency of the Internet, or, How I Became a Guest for Science’.
Unpublished Manuscript.
Shrum, Wesley and Jack Beggs (1997) ‘Methodology for Studying Research Networks in the
Developing World: Generating Information for Science and Technology Policy’,
Knowledge and Policy 9: 62-85.
Shrum, Wesley and Patricia Campion (2000) ‘Are Scientists in Developing Countries Isolated?’
Science, Technology, and Society 5: 1-34.
Shrum, Wesley and Yehouda Shenhav (1995) 'Science and Technology in Less Developed
Countries', in Sheila Jasanoff, Gerald Markle, James Peterson, and Trevor Pinch (eds),
Handbook of Science, Technology, and Society (Newbury Park: Sage): 627-651.
Uimonen, Paula (2001) [email protected]: Internet, Modernization
and Globalization (Stockholm: Elanders Gotab).
42
Walsh, John P. and Nancy G. Mahoney (2003) ‘Problems in Scientific Collaboration: Does
Email Hinder or Help?’ Unpublished manuscript.
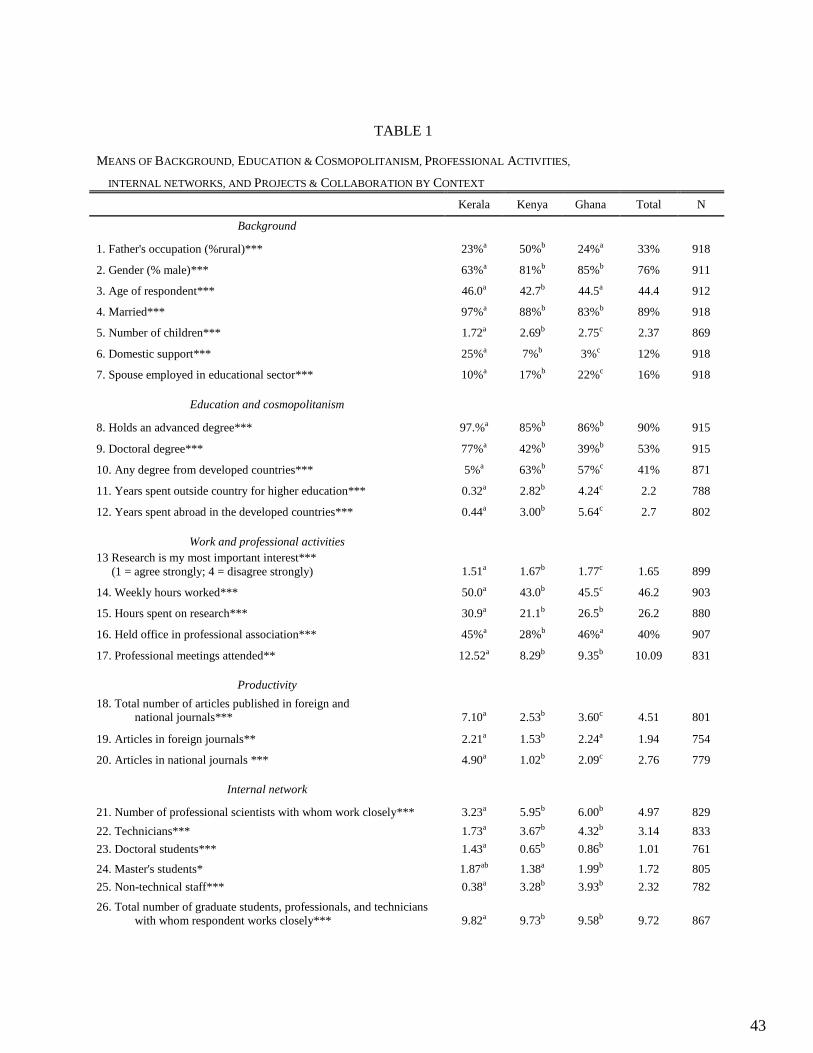
43
TABLE 1
MEANS OF BACKGROUND, EDUCATION & COSMOPOLITANISM, PROFESSIONAL ACTIVITIES,
INTERNAL NETWORKS, AND PROJECTS & COLLABORATION BY CONTEXT
Kerala Kenya Ghana Total N
Background
1. Father's occupation (%rural)*** 23%a 50%b 24%a 33% 918
2. Gender (% male)*** 63%a 81%b 85%b 76% 911
3. Age of respondent*** 46.0a 42.7b 44.5a 44.4 912
4. Married*** 97%a 88%b 83%b 89% 918
5. Number of children*** 1.72a 2.69b 2.75c 2.37 869
6. Domestic support*** 25%a 7%b 3%c 12% 918
7. Spouse employed in educational sector*** 10%a 17%b 22%c 16% 918
Education and cosmopolitanism
8. Holds an advanced degree*** 97.%a 85%b 86%b 90% 915
9. Doctoral degree*** 77%a 42%b 39%b 53% 915
10. Any degree from developed countries*** 5%a 63%b 57%c 41% 871
11. Years spent outside country for higher education*** 0.32a 2.82b 4.24c 2.2 788
12. Years spent abroad in the developed countries*** 0.44a 3.00b 5.64c 2.7 802
Work and professional activities 13 Research is my most important interest*** (1 = agree strongly; 4 = disagree strongly) 1.51a 1.67b 1.77c 1.65 899
14. Weekly hours worked*** 50.0a 43.0b 45.5c 46.2 903
15. Hours spent on research*** 30.9a 21.1b 26.5b 26.2 880
16. Held office in professional association*** 45%a 28%b 46%a 40% 907
17. Professional meetings attended** 12.52a 8.29b 9.35b 10.09 831
Productivity
18. Total number of articles published in foreign and national journals*** 7.10a 2.53b 3.60c 4.51 801
19. Articles in foreign journals** 2.21a 1.53b 2.24a 1.94 754
20. Articles in national journals *** 4.90a 1.02b 2.09c 2.76 779
Internal network
21. Number of professional scientists with whom work closely*** 3.23a 5.95b 6.00b 4.97 829
22. Technicians*** 1.73a 3.67b 4.32b 3.14 833
23. Doctoral students*** 1.43a 0.65b 0.86b 1.01 761
24. Master's students* 1.87ab 1.38a 1.99b 1.72 805
25. Non-technical staff*** 0.38a 3.28b 3.93b 2.32 782
26. Total number of graduate students, professionals, and technicians with whom respondent works closely*** 9.82a 9.73b 9.58b 9.72 867

44
TABLE 1 (continued)
Projects and collaborations
27. Total number of research projects*** 7.20a 3.05b 4.10c 4.81 885
28. Any current collaboration*** 39%a 86%b 75%c 66% 880
29. Number of current collaborations (3 maximum)*** 0.64a 1.71b 1.37c 1.23 880 Notes: numbers followed by different letters - a, b, and c - indicate significant differences. ***, **, * significant at the .01, .05, .1 levels respectively Significant differences reflect a one-way Anova multiple comparison test.

45
TABLE 2 REGRESSION OF TOTAL PUBLICATIONS ON COLLABORATION AND BACKGROUND FACTORS
1 2 3 4 5 6 Full Sample Academic Research Kerala Kenya Ghana 1. Married 0.131*** 0.121*** 0.168*** 0.081 0.048 0.323*** 2. Doctoral degree 0.358*** 0.331*** 0.328*** 0.239*** 0.357*** 0.336*** 3. Held office in professional association 0.148*** 0.114** 0.161*** 0.124** 0.124** 0.195*** 4. Professional meetings attended 0.126*** 0.152*** 0.117** 0.132** 0.033 0.136** 5. Number of collaborations 0.042 0.179*** -0.107** 0.084 0.182*** 0.093 6. R2 0.235 0.247 0.258 0.122 0.252 0.345 7. N 718 398 320 290 262 166 Notes: Dependent variable is expressed as a logarithmic transformation. ***, **, * significant at the .01, .05, .1 levels respectively.

46
TABLE 3
REGRESSION OF FOREIGN AND DOMESTIC PRODUCTIVITY ON COLLABORATION AND BACKGROUND FACTORS
ARTICLES IN FOREIGN JOURNALS
Kerala
Kenya
Ghana Academic Research Academic Research Academic Research 1. Married 0.035 0.108 0.055 0.085 0.296 ** 0.208 * 2. Doctoral degree 0.124 0.322 *** 0.266 *** 0.021 0.216 * 0.233 * 3. Held office in professional
association 0.202 ** -0.052 0.012 0.318 *** 0.187 0.217 *
4. Professional meetings attended 0.042 0.022 0.184 ** -0.010 0.262 ** 0.093
5. Number of collaborations 0.027 0.024 0.291 *** 0.074 0.074 0.052 6. R2 0.071 0.125 0.301 0.145 0.256 0.256 7. N 153 137 155 105 62 63 ARTICLES IN NATIONAL JOURNALS 8. Married 0.154 ** 0.024 0.007 0.140 0.429 *** 0.393 *** 9. Doctoral degree 0.249 *** 0.115 0.104 -0.029 0.350 *** 0.086 10. Held office in professional
association 0.041 0.259 *** 0.103 0.127 0.256 *** 0.066
11. Professional meetings attended
0.135 * 0.220 *** 0.104 0.012 0.029 0.113
12. Number of collaborations 0.102 0.013 0.203 ** 0.067 0.038 0.029 13. R2 0.142 0.137 0.123 0.048 0.393 0.215 14. N 152 137 155 104 81 71 Note: Dependent variables are expressed as natural logarithms. ***, **, * significant at the .01, .05, .1 levels respectively.

47
TABLE 4 MEANS OF PROBLEMS IN RESEARCH BY SECTOR
d
Kerala Kenya Ghana Total N
Problem with contacting people*** 2.44a 1.86b 2.13c 2.14 885 Problem with coordinating schedules*** 2.45a 2.09b 2.17b 2.24 885 Problem with length of time to get things done*** 1.92a 1.77b 1.74b 1.81 885
Problem with transmitting information*** 2.47a 1.82b 2.22c 2.17 882 Problem with getting others to see point*** 2.47a 2.31b 2.42a 2.40 878
Problem with security of information*** 2.68a 2.22b 2.46c 2.45 867 Problem with resolving conflicts** 2.53a 2.53a 2.65b 2.57 870 Problem with dividing work** 2.64a 2.51b 2.59a 2.58 871 Problem keeping others informed of progress*** 2.69a 2.22b 2.59c 2.50 884
Problem with too much information** 2.75a 2.66b 2.63b 2.68 853 Notes: numbers followed by different letters (a, b, c) indicate significant differences. ***, **, * significant at the .01, .05, .1 levels respectively Significant differences reflect a one-way Anova multiple comparison test. d. 1=a major problem, 2=minor problem, 3=no problem

48
TABLE 5 SELF-REPORTED RESEARCH PROBLEMS AND COLLABORATION d
One or more
collaborations No
collaboration Difference N Problem with contacting peopled 2.06 2.28 0.21*** 863 Problem with transmitting informationd 2.09 2.30 0.21*** 860 Problem with security of informationd 2.40 2.55 0.15*** 847 Problem keeping others informed of progressd 2.45 2.60 0.14*** 862
***, **, * significant at the .01, .05, .1 levels respectively. d. ‘Research problems’ coded as: 1=a major problem, 2=minor problem, 3=no problem
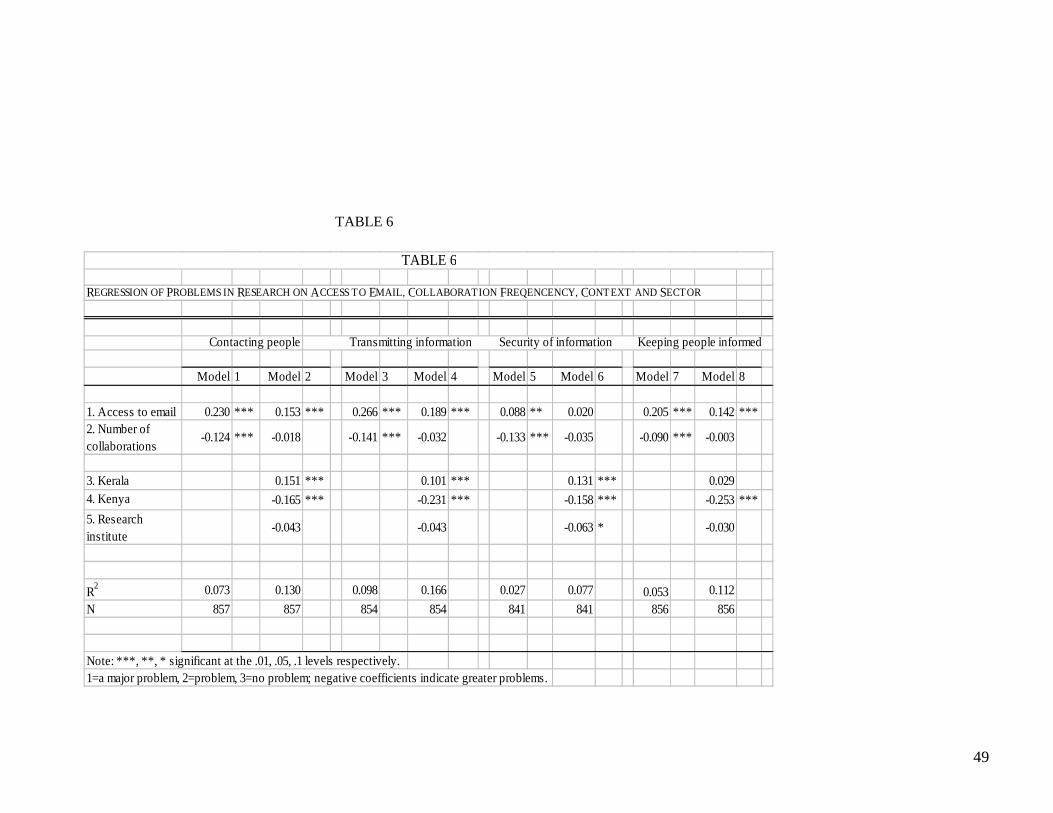
49
TABLE 6
REGRESSION OF PROBLEMS IN RESEARCH ON ACCESS TO EMAIL, COLLABORATION FREQENCENCY, CONTEXT AND SECTOR
Contacting people Transmitting information Security of information Keeping people informed
Model 1 Model 2 Model 3 Model 4 Model 5 Model 6 Model 7 Model 8
1. Access to email 0.230 *** 0.153 *** 0.266 *** 0.189 *** 0.088 ** 0.020 0.205 *** 0.142 ***2. Number of collaborations
-0.124 *** -0.018 -0.141 *** -0.032 -0.133 *** -0.035 -0.090*** -0.003
3. Kerala 0.151 *** 0.101 *** 0.131 *** 0.0294. Kenya -0.165 *** -0.231 *** -0.158 *** -0.253 ***
5. Research institute
-0.043 -0.043 -0.063 * -0.030
R2 0.073 0.130 0.098 0.166 0.027 0.077 0.053 0.112
N 857 857 854 854 841 841 856 856
Note: ***, **, * significant at the .01, .05, .1 levels respectively.1=a major problem, 2=problem, 3=no problem; negative coefficients indicate greater problems.
TABLE 6

50