coimbra sand influence of non-plastic fines in ... · report that a silty sand´s liquefaction...
TRANSCRIPT

Coimbra Sand – Influence of Non-Plastic Fines
In Liquefaction Resistance
F. Marques, J.A. Santos, R.C. Gomes Department of Civil Engineering, Architecture and Georesources, Instituto Superior Técnico,
Lisbon, Portugal
SUMMARY
The soil liquefaction is one of the most feared phenomena in geotechnical engineering. It is well known that the
presence of fines (silt and clay particles) affects the resistance of sand to liquefaction. However, recent studies
show that no clear conclusions can be drawn in what manner the fines content affects the liquefaction resistance
of sand under cyclic loading. This is particularly true for sands containing non-plastic fines. A set of undrained
monotonic triaxial compression tests and undrained cyclic torsional shear tests are performed on Coimbra clean
sand and Coimbra sand with 20% of non-plastic fines. It is shown that the presence of non-plastic fines in
Coimbra Sand can reduce the liquefaction resistance.
Keywords: Liquefaction; sands; non-plastic fines
1. INTRODUTION
It’s well known that non-plastic fines influence the liquefaction resistance of sandy soils. Recent
studies shown that this influence can either increase or reduce the sand´s liquefaction resistance (e.g.
Polito, 1999). According to Todo-Bom (2008), there are numerous studies that have produced
conflicting results. Some authors - e.g. Chang et al (1982) - based on laboratory and in-situ tests,
report that a silty sand´s liquefaction resistance increase with the increasing of the percentage of non-
plastic fines under cyclic loading, while there are authors that report the opposite – e.g. Shen et al
(1977). Some authors, like Koester (1994), claim that the sand´s liquefaction resistance initially
reduces with the increase of non-plastic fine, but begins to increase when a limit non-plastic fines
content or percentage is reached. Also, there are those - e.g. Tronsco el al (1985) - who claim that
sand´s cyclic resistance is more closely related to its skeleton void ratio - the void ratio that would
exist in the soil if all of the silt and clay particles were removed – than to its density index ( or the
non-plastic fines percentage. In general, for a given void ratio, the variation on a sand´s liquefaction
resistance is related to the non-plastic fines added, since those fines change significantly the sand´s
maximum ( and minimum ( void ratio and therefore change the sand´s .
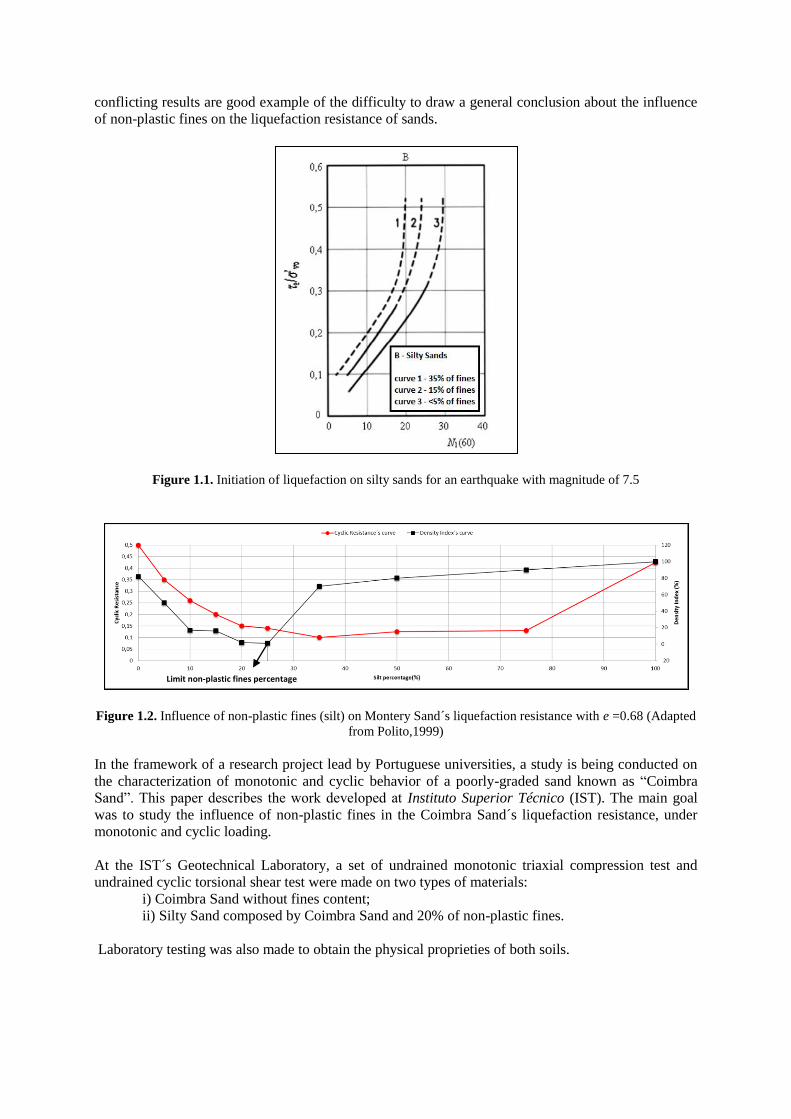
The Eurocode 8 (EC8) presents an empirical diagram (Figure 1.1) for the liquefaction susceptibility
evaluation of sandy soils, based on the SPT test. This diagram relates the corrected SPT blow count
( needed to achieve liquefaction with the liquefaction resistance, which is defined as a cyclic
stress ratio ( - ratio between the cyclic shear stress and the initial overburden pressure
. According to this diagram (Figure 1.1), for a given , increasing the fines content
increases the CSR and, therefore, increase the sand´s liquefaction resistance.
However, a study made by Polito (1999) showed the existence of a limit percentage of non-plastic
fines (silts) in which there is a change in the influence of those fines on the cyclic liquefaction
resistance (Figure 1.2). If the non-plastic fines percentage is lower than the limit percentage, the sand´s
reduces and, as consequence, the resistance also reduces. Conversely, if the sand´s increase,
then the sand´s resistance grows. In this case, when the percentage of non-plastic fines is high, the silty
sand´s cyclic liquefaction resistance can be higher or lower than the clean sand´s resistance. These
conflicting results are good example of the difficulty to draw a general conclusion about the influence
of non-plastic fines on the liquefaction resistance of sands.
Figure 1.1. Initiation of liquefaction on silty sands for an earthquake with magnitude of 7.5
Figure 1.2. Influence of non-plastic fines (silt) on Montery Sand´s liquefaction resistance with e =0.68 (Adapted
from Polito,1999)
In the framework of a research project lead by Portuguese universities, a study is being conducted on
the characterization of monotonic and cyclic behavior of a poorly-graded sand known as “Coimbra
Sand”. This paper describes the work developed at Instituto Superior Técnico (IST). The main goal
was to study the influence of non-plastic fines in the Coimbra Sand´s liquefaction resistance, under
monotonic and cyclic loading.
At the IST´s Geotechnical Laboratory, a set of undrained monotonic triaxial compression test and
undrained cyclic torsional shear test were made on two types of materials:
i) Coimbra Sand without fines content;
ii) Silty Sand composed by Coimbra Sand and 20% of non-plastic fines.
Laboratory testing was also made to obtain the physical proprieties of both soils.
Limit non-plastic fines percentage
2. PHYSICAL PROPERTIES OF THE MATERIALS IN THIS STUDY
2.1. Coimbra Sand
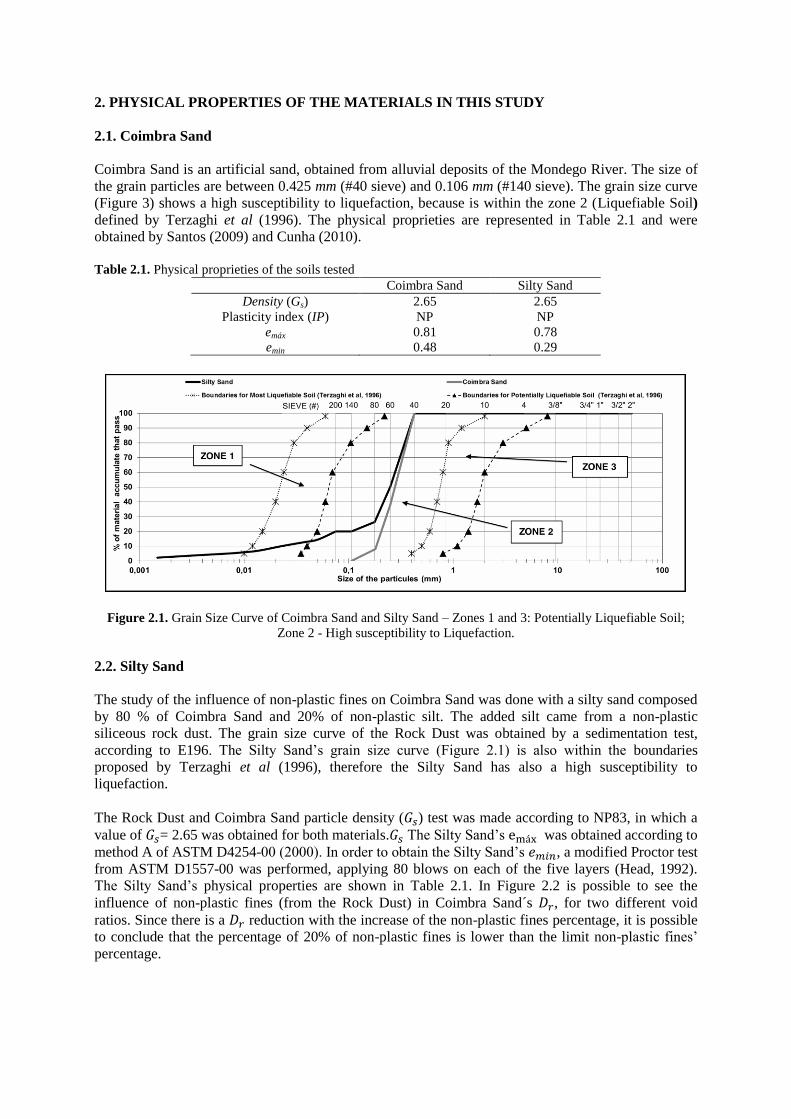
Coimbra Sand is an artificial sand, obtained from alluvial deposits of the Mondego River. The size of
the grain particles are between 0.425 mm (#40 sieve) and 0.106 mm (#140 sieve). The grain size curve
(Figure 3) shows a high susceptibility to liquefaction, because is within the zone 2 (Liquefiable Soil)
defined by Terzaghi et al (1996). The physical proprieties are represented in Table 2.1 and were
obtained by Santos (2009) and Cunha (2010).
Table 2.1. Physical proprieties of the soils tested
Coimbra Sand Silty Sand
Density (Gs) 2.65 2.65
Plasticity index (IP) NP NP
emáx 0.81 0.78
emin 0.48 0.29
Figure 2.1. Grain Size Curve of Coimbra Sand and Silty Sand – Zones 1 and 3: Potentially Liquefiable Soil;
Zone 2 - High susceptibility to Liquefaction.
2.2. Silty Sand
The study of the influence of non-plastic fines on Coimbra Sand was done with a silty sand composed
by 80 % of Coimbra Sand and 20% of non-plastic silt. The added silt came from a non-plastic
siliceous rock dust. The grain size curve of the Rock Dust was obtained by a sedimentation test,
according to E196. The Silty Sand’s grain size curve (Figure 2.1) is also within the boundaries
proposed by Terzaghi et al (1996), therefore the Silty Sand has also a high susceptibility to
liquefaction.
The Rock Dust and Coimbra Sand particle density ( ) test was made according to NP83, in which a
value of = 2.65 was obtained for both materials. The Silty Sand’s was obtained according to
method A of ASTM D4254-00 (2000). In order to obtain the Silty Sand’s , a modified Proctor test
from ASTM D1557-00 was performed, applying 80 blows on each of the five layers (Head, 1992).
The Silty Sand’s physical properties are shown in Table 2.1. In Figure 2.2 is possible to see the
influence of non-plastic fines (from the Rock Dust) in Coimbra Sand´s , for two different void
ratios. Since there is a reduction with the increase of the non-plastic fines percentage, it is possible
to conclude that the percentage of 20% of non-plastic fines is lower than the limit non-plastic fines’
percentage.
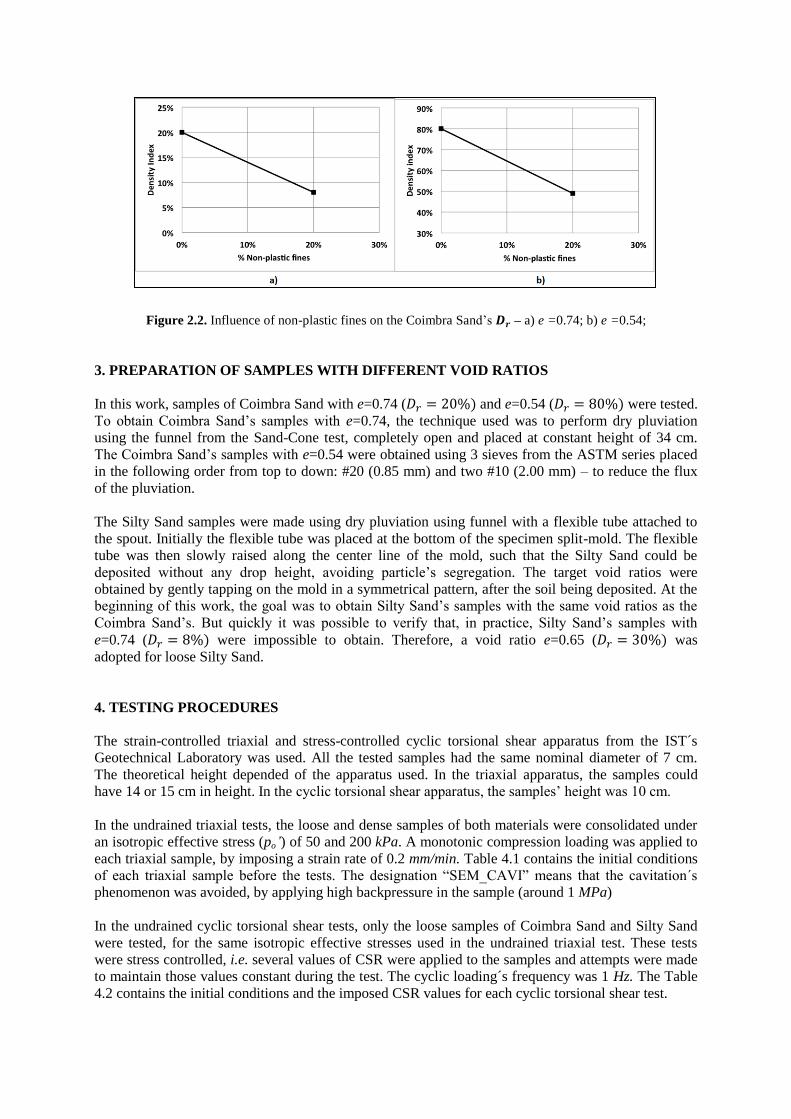
Figure 2.2. Influence of non-plastic fines on the Coimbra Sand’s – a) e =0.74; b) e =0.54;
3. PREPARATION OF SAMPLES WITH DIFFERENT VOID RATIOS
In this work, samples of Coimbra Sand with e=0.74 ( and e=0.54 ( were tested.
To obtain Coimbra Sand’s samples with e=0.74, the technique used was to perform dry pluviation
using the funnel from the Sand-Cone test, completely open and placed at constant height of 34 cm.
The Coimbra Sand’s samples with e=0.54 were obtained using 3 sieves from the ASTM series placed
in the following order from top to down: #20 (0.85 mm) and two #10 (2.00 mm) – to reduce the flux
of the pluviation.
The Silty Sand samples were made using dry pluviation using funnel with a flexible tube attached to
the spout. Initially the flexible tube was placed at the bottom of the specimen split-mold. The flexible
tube was then slowly raised along the center line of the mold, such that the Silty Sand could be
deposited without any drop height, avoiding particle’s segregation. The target void ratios were
obtained by gently tapping on the mold in a symmetrical pattern, after the soil being deposited. At the
beginning of this work, the goal was to obtain Silty Sand’s samples with the same void ratios as the
Coimbra Sand’s. But quickly it was possible to verify that, in practice, Silty Sand’s samples with
e=0.74 ( were impossible to obtain. Therefore, a void ratio e=0.65 ( was
adopted for loose Silty Sand.
4. TESTING PROCEDURES
The strain-controlled triaxial and stress-controlled cyclic torsional shear apparatus from the IST´s
Geotechnical Laboratory was used. All the tested samples had the same nominal diameter of 7 cm.
The theoretical height depended of the apparatus used. In the triaxial apparatus, the samples could
have 14 or 15 cm in height. In the cyclic torsional shear apparatus, the samples’ height was 10 cm.
In the undrained triaxial tests, the loose and dense samples of both materials were consolidated under
an isotropic effective stress (po’) of 50 and 200 kPa. A monotonic compression loading was applied to
each triaxial sample, by imposing a strain rate of 0.2 mm/min. Table 4.1 contains the initial conditions
of each triaxial sample before the tests. The designation “SEM_CAVI” means that the cavitation´s
phenomenon was avoided, by applying high backpressure in the sample (around 1 MPa)
In the undrained cyclic torsional shear tests, only the loose samples of Coimbra Sand and Silty Sand
were tested, for the same isotropic effective stresses used in the undrained triaxial test. These tests
were stress controlled, i.e. several values of CSR were applied to the samples and attempts were made
to maintain those values constant during the test. The cyclic loading´s frequency was 1 Hz. The Table
4.2 contains the initial conditions and the imposed CSR values for each cyclic torsional shear test.
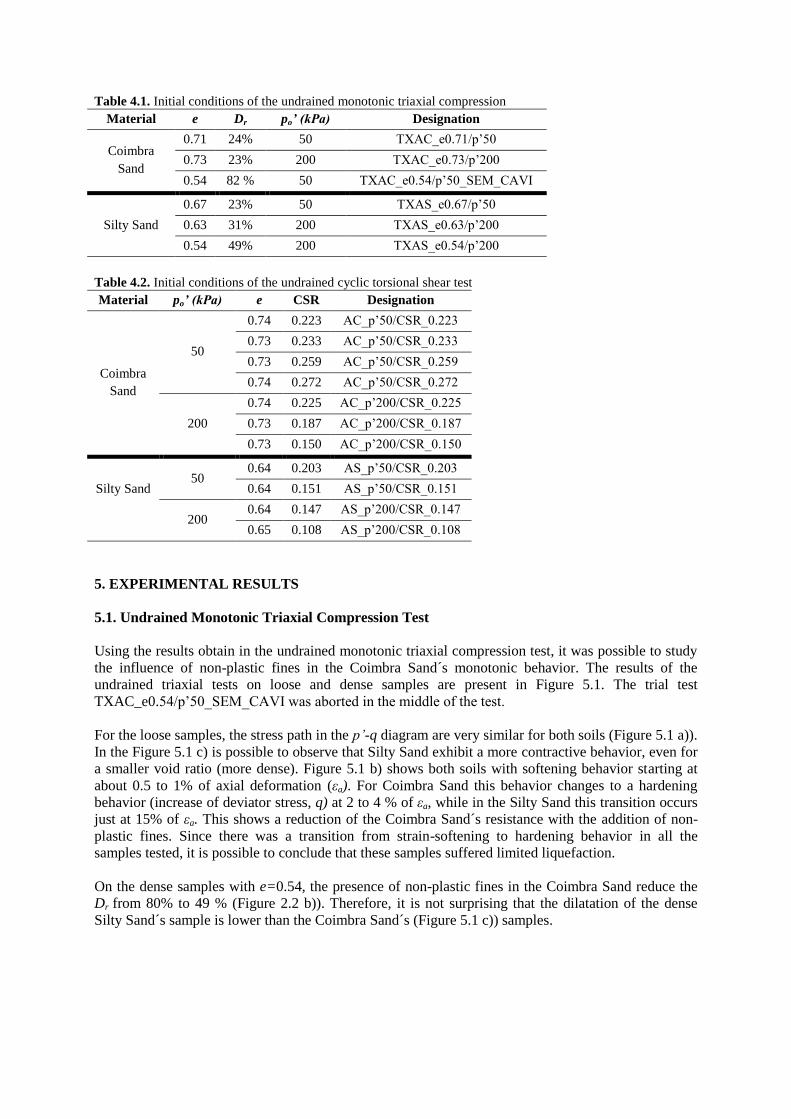
Table 4.1. Initial conditions of the undrained monotonic triaxial compression
Material e Dr po’ (kPa) Designation
Coimbra
Sand
0.71 24% 50 TXAC_e0.71/p’50
0.73 23% 200 TXAC_e0.73/p’200
0.54 82 % 50 TXAC_e0.54/p’50_SEM_CAVI
Silty Sand
0.67 23% 50 TXAS_e0.67/p’50
0.63 31% 200 TXAS_e0.63/p’200
0.54 49% 200 TXAS_e0.54/p’200
Table 4.2. Initial conditions of the undrained cyclic torsional shear test
Material po’ (kPa) e CSR Designation
Coimbra
Sand
50
0.74 0.223 AC_p’50/CSR_0.223
0.73 0.233 AC_p’50/CSR_0.233
0.73 0.259 AC_p’50/CSR_0.259
0.74 0.272 AC_p’50/CSR_0.272
200
0.74 0.225 AC_p’200/CSR_0.225
0.73 0.187 AC_p’200/CSR_0.187
0.73 0.150 AC_p’200/CSR_0.150
Silty Sand 50
0.64 0.203 AS_p’50/CSR_0.203
0.64 0.151 AS_p’50/CSR_0.151
200 0.64 0.147 AS_p’200/CSR_0.147
0.65 0.108 AS_p’200/CSR_0.108
5. EXPERIMENTAL RESULTS
5.1. Undrained Monotonic Triaxial Compression Test
Using the results obtain in the undrained monotonic triaxial compression test, it was possible to study
the influence of non-plastic fines in the Coimbra Sand´s monotonic behavior. The results of the
undrained triaxial tests on loose and dense samples are present in Figure 5.1. The trial test
TXAC_e0.54/p’50_SEM_CAVI was aborted in the middle of the test.
For the loose samples, the stress path in the p’-q diagram are very similar for both soils (Figure 5.1 a)).
In the Figure 5.1 c) is possible to observe that Silty Sand exhibit a more contractive behavior, even for
a smaller void ratio (more dense). Figure 5.1 b) shows both soils with softening behavior starting at
about 0.5 to 1% of axial deformation (εa). For Coimbra Sand this behavior changes to a hardening
behavior (increase of deviator stress, q) at 2 to 4 % of εa, while in the Silty Sand this transition occurs
just at 15% of εa. This shows a reduction of the Coimbra Sand´s resistance with the addition of non-
plastic fines. Since there was a transition from strain-softening to hardening behavior in all the
samples tested, it is possible to conclude that these samples suffered limited liquefaction.
On the dense samples with e=0.54, the presence of non-plastic fines in the Coimbra Sand reduce the
Dr from 80% to 49 % (Figure 2.2 b)). Therefore, it is not surprising that the dilatation of the dense
Silty Sand´s sample is lower than the Coimbra Sand´s (Figure 5.1 c)) samples.

a)
b)
c)
Figure 5.1. Results from undrained monotonic triaxial compression test – a) p’-q; b) εa- q; c) εa –Δu

For the estimation of the critical void ratio line (CVR) of both soils, it was considered that the final
state of the triaxial test reached the critical state, as a simplified hypothesis. The presence of non-
plastic fines on Coimbra Sand caused a translation and attenuated the slope in its CVR. As a result, the
critical stress of Coimbra Sand for a certain e (pc’) was reduced, e.g. for e=0.65, pc’ of Coimbra Sand
is 950 kPa, while for Silty Sand is 30 kPa (Figure 5.2).
Figure 5.2. Critical void ratio line (CVR) of the tested soils
The triaxial results show that the presence of non-plastic fines increases Coimbra Sand´s contractive
behavior, making it less resistant and more susceptible to liquefaction.
5.2. Undrained Cyclic Torsional Shear Test
There are several definitions for initiation of liquefaction. In this work it was assumed that the soil’s
liquefaction initiate when Δu= po’ or Δunorm= 1. A typical set of undrained cyclic torsional shear test
results for Coimbra Sand is shown in Figure 5.3 (test AC_p’50/CSR_0.223). Unfortunately, it wasn't
possible to maintain CSR constant during the tests. Possible reasons for this behavior include
apparatus’ technical issues or the loading frequency was too high and therefore not giving enough time
to the system to react. For both Coimbra Sand and Silty Sand, at the beginning of cyclic loading the
pore pressure increased gradually (Figure 5.3b) and stable hysteresis were formed (Figure 5.3a). When
Δunorm reached nearly 0.7, an almost sudden large increase of Δunorm occured, until Δunorm=1, and also
instable hysteresis started to form. In the test represented in Figure 5.3, 53 loading cycles (N) were
needed to achieve Coimbra Sand's liquefaction.

a)
b)
Figure 5.3. Undrained cyclic torsional shear test (AC_p50/CSR_0.223): a) γ - τ; b) N - Δunorm
Figure 5.4 a) shows the relation N - CSR from the undrained cyclic torsional shear test. Considering
CSR and po’ during the test, is possible to see that, for the range of CSR values tested, the Silty Sand´s
samples needed less loading cycles than Coimbra Sand's to achieve liquefaction. In other words, the
undrained cyclic torsional shear tests, with the initial conditions that were imposed on the samples,
proved that the presence of 20 % of non-plastic fines reduces Coimbra Sand's liquefaction resistance,
under cyclic loading. If the regression lines maintain the same tendency for CSR values outside the
range of values tested (dashed line), it is possible, for po’=200 kPa, that the Silty Sand´s liquefaction
resistance could be higher than the Coimbra Sand´s resistance, for CSR greater than 0.21 (Figure 5.4
b)). However, the Silty Sand´s regression line was obtained only with 2 points and therefore more tests
are needed to confirm this tendency.

a)
b)
Figure 5.4. Liquefaction curves – a) po’=50 kPa; b) po’=200 kPa

5. CONCLUSIONS
A set of undrained monotonic triaxial compression tests and undrained cyclic torsional shear tests
were performed on Coimbra clean sand and Coimbra sand with 20% of non-plastic fines.
It was proved that the presence of 20% of non-plastic fines has a major influence on Coimbra Sand's
monotonic and cyclic liquefaction resistance by:
increasing the contractive behavior, making the soil more susceptible to liquefaction under
monotonic loading;
reducing the number of cycles needed to achieve liquefaction, for a given and constant CSR
between the range of values studied in this work, i.e. it contributes for the reduction of
Coimbra Sand’s cyclic liquefaction resistance.
As this paper describes an ongoing research, the planned works include studies for higher non-plastic
fines content in order to get the whole evolution of Coimbra Sand´s liquefaction resistance with the
increase amount of non-plastic fines.
REFERENCES
Cunha, Inês (2010). “Coimbra Sand Behavior Under Cyclic Loading” (in portuguese). M.Sc. thesis, University
of Coimbra, FCTUC – Civil Engineering Department, Portugal.
Gomes, Rui (2009).”Numerical modelling of the seismic response of the ground and circular tunnels” (in
portuguese). Ph.D. thesis. Instituto Superior Técnico – Civil Engineering Department, Portugal
Marques, Francisco (2011). “Coimbra Sand – Influence of non plastic fine in liquefaction resitance” (in
portuguese). M.Sc. thesis. Instituto Superior Técnico – Civil Engineering Department, Portugal.
NP83 (1965). “Test Method for Particle Density of Soil” (in portuguese). Instituto Português da Qualidade,
Portugal.
E196 (1967).“Soils – Mechanical analysis” (in portuguese). Instituto Português da Qualidade, Portugal.
NP-EN 1998-5 (2010). “Eurocode 8 – Design of structures for earthquake resistance Part 5:Foundations,
retaining structures and geotechnical aspects” (in portuguese). Instituto Português da Qualidade,
Portugal.
Polito, C. P. (1999). “The effects of non-plastic and plastic fines on the liquefaction resistance of sandy soils.”
Ph.D. thesis, Virginia Polytechnic Institute and State University, USA.
Santos, Luís (2009). “Behaviour of Coimbra Sand Under Triaxial Compression” (in portuguese). M.Sc. thesis,
Universidade de Coimbra, FCTUC – Civil Engineering Department, Portugal.
Terzaghi, K.; Peck, R. and Mesri, G. (1996). “Soil Mechanics in Engineering Practice”. 3ª ed., New York, John
Wiley & Sons Inc, USA.
Todo-Bom, Luís (2008). “Soil Liquefaction: Influence of non-plastic fines in Liquefaction Resistance”. M.Sc.
thesis. Instituto Superior Técnico – Civil Engineering Department, Portugal