appendix a field coring datasheets sand 24-30 ~85% 2-4 mm fish scales 40cm sulphur dark gray 40cm...
TRANSCRIPT
APPENDIX A FIELD CORING DATASHEETS
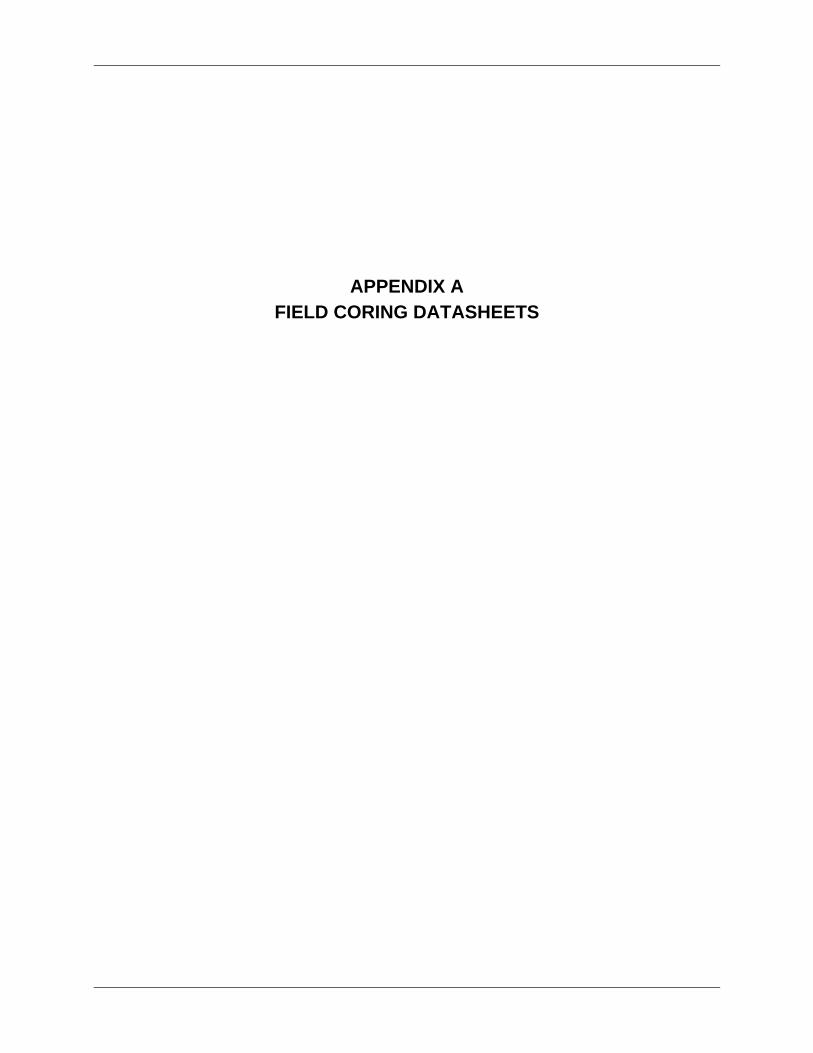
Visual Classification of Undisturbed SampleJob Orange County Coast Keeper - Rhine Channel Date 11/10/2004Job No. Sample Pushed By S. CappellinoExploration No. Sample Logged By D. KeithSample No. RS04-01 Type of Sample Shelby Vibrac PistonDepth of Sample 200 cm Diameter of Sample (inches) 3Sampled Length (feet; from log 200 cm Sample Quality Good Fair PoorSample Recovery (feet) 200 cm Average % Compaction =
20cm NO 20cm
gray
non-laminated silty mud40cm 40cm
60cm 0-60 60cm
80cm black 80cm
1M 1M
120cm60-120 120cm
dark gray
120-140cm 140 Increasing 140cm
Sulphur increasing fine sand & silt - "silty mud"
160cm 160cmmedium sand
gray180cm 180cm
2M 150-200 2M
DE
PTH
(
)
OD
OR
CO
LOR
Sample Interval
Sample Analytes Classification and Remarks
Core Sections
Depth ( cm )Th
eore
tical
Act
ual
x
x
Rhine Channel Sediment RemediationPrivileged and Confidential - Prepared in Furtherance of Joint Defense
A-1
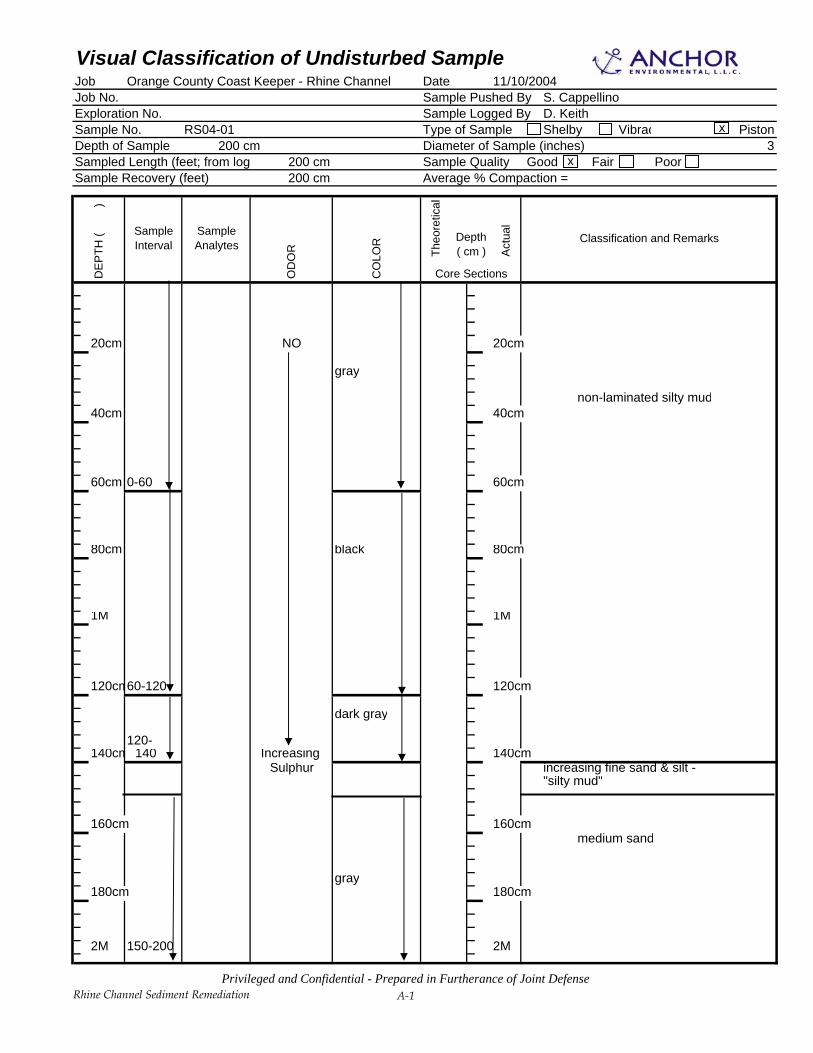
Visual Classification of Undisturbed SampleJob Orange County Coast Keeper - Rhine Channel Date 11/10/2004Job No. Sample Pushed By S. CappellinoExploration No. Sample Logged By D. KeithSample No. RS04-02 Type of Sample Shelby Vibrac PistonDepth of Sample Diameter of Sample (inches) 3Sampled Length (feet; from log 72 cm Sample Quality Good Fair PoorSample Recovery (feet) 72 cm Average % Compaction =
20cm 20cm
Fine Sand 24-30 ~85% 2-4 mm Fish Scales
40cm Sulphur dark gray 40cm Silty Mud w/45-50% Fish Scales
Silty Mud w/ ~30% Fish Scalesand whole clam
60cm 45-59 60cm
80cm 80cm
* This core is in front of cannery1M 1M scales probably associated with
Cannery operations
120cm 120cm
140cm 140cm
160cm 160cm
180cm 180cm
2M 2M
65-72
0-30
30-45
No sample
Classification and Remarks
Core Sections
Depth ( )Th
eore
tical
Act
ual
DE
PTH
(
)
OD
OR
CO
LOR
Sample Interval
Sample Analytes
x
x
Rhine Channel Sediment RemediationPrivileged and Confidential - Prepared in Furtherance of Joint Defense
A-2

Visual Classification of Undisturbed SampleJob Orange County Coast Keeper - Rhine Channel Date 11/10/2004Job No. Sample Pushed By S. CappellinoExploration No. Sample Logged By D. KeithSample No. RS04-03 Type of Sample Shelby Vibrac PistonDepth of Sample Diameter of Sample (inches) 3Sampled Length (feet; from log 86 cm Sample Quality Good Fair PoorSample Recovery (feet) 86 cm Average % Compaction =
silty fine sand20cm dark gray 20cm
0-30
black silty mud ~10 % organics some shells40cm 40cm
silty/muddy fine sand60cm Sulphur 60cm
dark gray38-68
80cm 80cm fine sand well sorted68-86
1M 1M
120cm 120cm
140cm 140cm
160cm 160cm
180cm 180cm
2M 2M
DE
PTH
(
)
OD
OR
CO
LOR
Sample Interval
Sample Analytes
30-38
Classification and Remarks
Core Sections
Depth ( )Th
eore
tical
Act
ual
x
x
Rhine Channel Sediment RemediationPrivileged and Confidential - Prepared in Furtherance of Joint Defense
A-3

Visual Classification of Undisturbed SampleJob Orange County Coast Keeper - Rhine Channel Date 11/10/2004Job No. Sample Pushed By S. CappellinoExploration No. Sample Logged By D. KeithSample No. RS04-04 Type of Sample Shelby Vibrac PistonDepth of Sample Diameter of Sample (inches) 3Sampled Length (feet; from log 99 cm Sample Quality Good Fair PoorSample Recovery (feet) 99 cm Average % Compaction =
silty fine sand20cm 20cm
0-25
dark gray silty fine sand40cm 40cm w/30-40 mm clam shells
and 10-20% fish scales0-50
Sulphur
60cm 60cm
fine sand gradingdownward tomedium sand
80cm lighter dark 80cmgray
50-991M 1M
120cm 120cm
140cm 140cm
160cm 160cm
180cm 180cm
2M 2M
Classification and Remarks
Core Sections
Depth ( )Th
eore
tical
Act
ual
DE
PTH
(
)
OD
OR
CO
LOR
Sample Interval
Sample Analytes
x
x
Rhine Channel Sediment RemediationPrivileged and Confidential - Prepared in Furtherance of Joint Defense
A-4
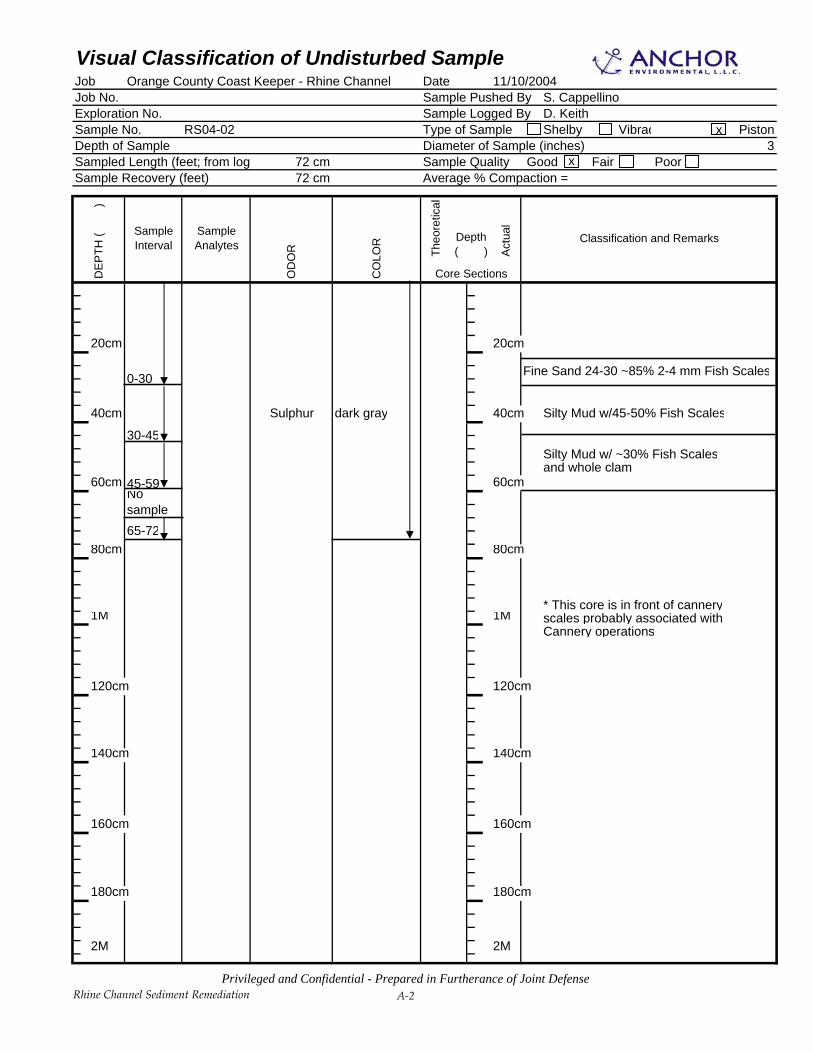
Visual Classification of Undisturbed SampleJob Orange County Coast Keeper - Rhine Channel Date 11/10/2004Job No. Sample Pushed By S. CappellinoExploration No. Sample Logged By D. KeithSample No. RS04-05 Type of Sample Shelby Vibrac PistonDepth of Sample Diameter of Sample (inches) 3Sampled Length (feet; from log 1.34 m Sample Quality Good Fair PoorSample Recovery (feet) 1.34 m Average % Compaction =
20cm 20cm
silty fine sand
40cm 40cmSulphur
60cm 0-60 dark gray 60cm
80cm 80cm
fine to medium sandwell sorted
1M 1M
120cm 120cm
60-134
140cm 140cm
160cm 160cm
180cm 180cm
2M 2M
DE
PTH
(
)
OD
OR
CO
LOR
Sample Interval
Sample Analytes Classification and Remarks
Core Sections
Depth ( )Th
eore
tical
Act
ual
x
x
Rhine Channel Sediment RemediationPrivileged and Confidential - Prepared in Furtherance of Joint Defense
A-5

Visual Classification of Undisturbed SampleJob Orange County Coast Keeper - Rhine Channel Date 11/10/2004Job No. Sample Pushed By S. CappellinoExploration No. Sample Logged By D. KeithSample No. RS04-06 Type of Sample Shelby Vibrac PistonDepth of Sample Diameter of Sample (inches) 3Sampled Length (feet; from log 2.0 m Sample Quality Good Fair PoorSample Recovery (feet) 2.0 m Average % Compaction =
20cm 20cm silty/fine-sand mud
40cm 0-40 40cm
60cm 60cm
80cm 80cm fine sand well sorted
1M Sulphur dark gray 1M
40-120120cm 120cm
140cm 140cm
160cm 160cm
180cm 180cm
2M 120-200 2M
Classification and Remarks
Core Sections
Depth ( )Th
eore
tical
Act
ual
DE
PTH
(
)
OD
OR
CO
LOR
Sample Interval
Sample Analytes
x
x
Rhine Channel Sediment RemediationPrivileged and Confidential - Prepared in Furtherance of Joint Defense
A-6

Visual Classification of Undisturbed SampleJob Orange County Coast Keeper - Rhine Channel Date 11/10/2004Job No. Sample Pushed By S. CappellinoExploration No. Sample Logged By D. KeithSample No. RS04-07 Type of Sample Shelby Vibrac PistonDepth of Sample Diameter of Sample (inches) 3Sampled Length (feet; from log 170 cm Sample Quality Good Fair PoorSample Recovery (feet) 170 cm Average % Compaction =
20cm 20cm
silty/fine sand mud
40cm 40cm
60cm 0-60 60cm
80cm 80cm
fine sand well sorted withsome shells
1M Sulphur dark gray 1M
120cm 120cm
140cm 140cm
160cm 160cm root zone in silty sand
60-170
180cm 180cm
2M 2M
DE
PTH
(
)
OD
OR
CO
LOR
Sample Interval
Sample Analytes Classification and Remarks
Core Sections
Depth ( )Th
eore
tical
Act
ual
x
x
Rhine Channel Sediment RemediationPrivileged and Confidential - Prepared in Furtherance of Joint Defense
A-7

Visual Classification of Undisturbed SampleJob Orange County Coast Keeper - Rhine Channel Date 11/10/2004Job No. Sample Pushed By S. CappellinoExploration No. Sample Logged By D. KeithSample No. RS04-08 Type of Sample Shelby Vibrac PistonDepth of Sample Diameter of Sample (inches) 3Sampled Length (feet; from log 90 cm Sample Quality Good Fair PoorSample Recovery (feet) 90 cm Average % Compaction =
silty muddy fine sand20cm 20cm
0-30
40cm 40cm
Sulphur dark gray
60cm 60cm fine to medium sand withshell fragments (< 5%)
80cm 80cm
30-90
1M 1M
120cm 120cm
140cm 140cm
160cm 160cm
180cm 180cm
2M 2M
Classification and Remarks
Core Sections
Depth ( )Th
eore
tical
Act
ual
DE
PTH
(
)
OD
OR
CO
LOR
Sample Interval
Sample Analytes
x
x
Rhine Channel Sediment RemediationPrivileged and Confidential - Prepared in Furtherance of Joint Defense
A-8

Visual Classification of Undisturbed SampleJob Orange County Coast Keeper - Rhine Channel Date 11/10/2004Job No. Sample Pushed By S. CappellinoExploration No. Sample Logged By D. KeithSample No. RS04-09 Type of Sample Shelby Vibrac PistonDepth of Sample Diameter of Sample (inches) 3Sampled Length (feet; from log 110 cm Sample Quality Good Fair PoorSample Recovery (feet) 110 cm Average % Compaction =
20cm 20cmnon-laminated silty mud
0-35
40cm 40cm
Sulphur dark gray
60cm 60cmmedium to coarse sand withwell rounded oblong pebbles (30-50 cm)
80cm 80cm
1M 1M35-110
120cm 120cm
140cm 140cm
160cm 160cm
180cm 180cm
2M 2M
DE
PTH
(
)
OD
OR
CO
LOR
Sample Interval
Sample Analytes Classification and Remarks
Core Sections
Depth ( )Th
eore
tical
Act
ual
x
x
Rhine Channel Sediment RemediationPrivileged and Confidential - Prepared in Furtherance of Joint Defense
A-9

Visual Classification of Undisturbed SampleJob Orange County Coast Keeper - Rhine Channel Date 11/10/2004Job No. Sample Pushed By S. CappellinoExploration No. Sample Logged By D. KeithSample No. RS04-10 Type of Sample Shelby Vibrac PistonDepth of Sample 83 cm Diameter of Sample (inches) 3Sampled Length (feet; from log 83 cm Sample Quality Good Fair PoorSample Recovery (feet) Average % Compaction =
None dark gray20cm grading to 20cm
olive green fine to medium silty sand with 10-15%shell fragments and whole clam shells
40cm 40cm
0-55
60cm 60cm
fine to medium sand with some shell fragments (<5%)
80cm 55-83 80cm
1M 1M
120cm 120cm
140cm 140cm
160cm 160cm
180cm 180cm
2M 2M
Classification and Remarks
Core Sections
Depth ( )Th
eore
tical
Act
ual
DE
PTH
(
)
OD
OR
CO
LOR
Sample Interval
Sample Analytes
x
x
Rhine Channel Sediment RemediationPrivileged and Confidential - Prepared in Furtherance of Joint Defense
A-10

Visual Classification of Undisturbed SampleJob Orange County Coast Keeper - Rhine Channel Date 11/10/2004Job No. Sample Pushed By S. CappellinoExploration No. Sample Logged By D. KeithSample No. RS04-11 Type of Sample Shelby Vibrac PistonDepth of Sample 63 cm Diameter of Sample (inches) 3Sampled Length (feet; from log 63 cm Sample Quality Good Fair PoorSample Recovery (feet) Average % Compaction =
None dark gray non-laminated silty mud20cm 20cm
40cm 0-43 40cm
fine to medium sand
60cm 43-63 60cm
80cm 80cm
1M 1M
120cm 120cm
140cm 140cm
160cm 160cm
180cm 180cm
2M 2M
DE
PTH
(
)
OD
OR
CO
LOR
Sample Interval
Sample Analytes Classification and Remarks
Core Sections
Depth ( )Th
eore
tical
Act
ual
x
x
Rhine Channel Sediment RemediationPrivileged and Confidential - Prepared in Furtherance of Joint Defense
A-11
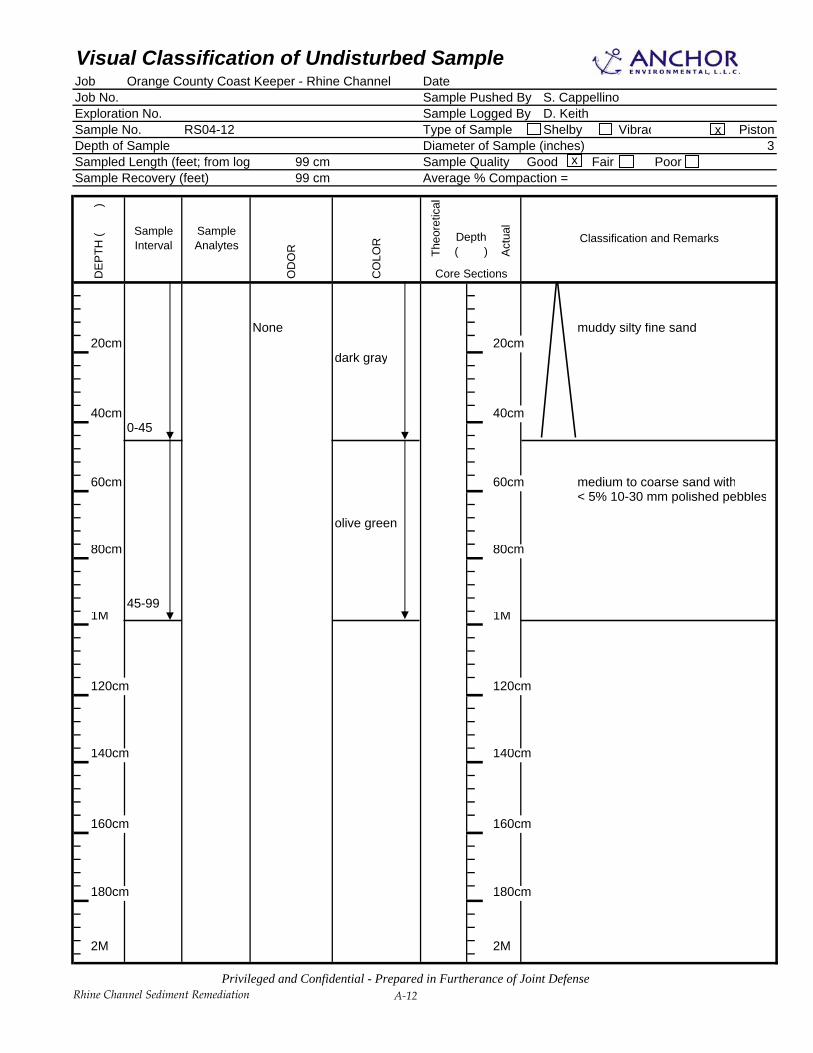
Visual Classification of Undisturbed SampleJob Orange County Coast Keeper - Rhine Channel DateJob No. Sample Pushed By S. CappellinoExploration No. Sample Logged By D. KeithSample No. RS04-12 Type of Sample Shelby Vibrac PistonDepth of Sample Diameter of Sample (inches) 3Sampled Length (feet; from log 99 cm Sample Quality Good Fair PoorSample Recovery (feet) 99 cm Average % Compaction =
None muddy silty fine sand20cm 20cm
dark gray
40cm 40cm0-45
60cm 60cm medium to coarse sand with< 5% 10-30 mm polished pebbles
olive green
80cm 80cm
45-991M 1M
120cm 120cm
140cm 140cm
160cm 160cm
180cm 180cm
2M 2M
Classification and Remarks
Core Sections
Depth ( )Th
eore
tical
Act
ual
DE
PTH
(
)
OD
OR
CO
LOR
Sample Interval
Sample Analytes
x
x
Rhine Channel Sediment RemediationPrivileged and Confidential - Prepared in Furtherance of Joint Defense
A-12

Visual Classification of Undisturbed SampleJob Orange County Coast Keeper - Rhine Channel Date 11/11/2004Job No. Sample Pushed By S. CappellinoExploration No. Sample Logged By D. KeithSample No. RS04-13 Type of Sample Shelby Vibrac PistonDepth of Sample Diameter of Sample (inches) 3Sampled Length (feet; from log 83 cm Sample Quality Good Fair PoorSample Recovery (feet) 83 cm Average % Compaction =
muddy silty fine sand20cm 20cm
None dark gray40cm 40cm
0-50
silty fine sand (5-10% mud)60cm 60cm
80cm 50-83 80cm
1M 1M
120cm 120cm
140cm 140cm
160cm 160cm
180cm 180cm
2M 2M
DE
PTH
(
)
OD
OR
CO
LOR
Sample Interval
Sample Analytes Classification and Remarks
Core Sections
Depth ( )Th
eore
tical
Act
ual
x
x
Rhine Channel Sediment RemediationPrivileged and Confidential - Prepared in Furtherance of Joint Defense
A-13
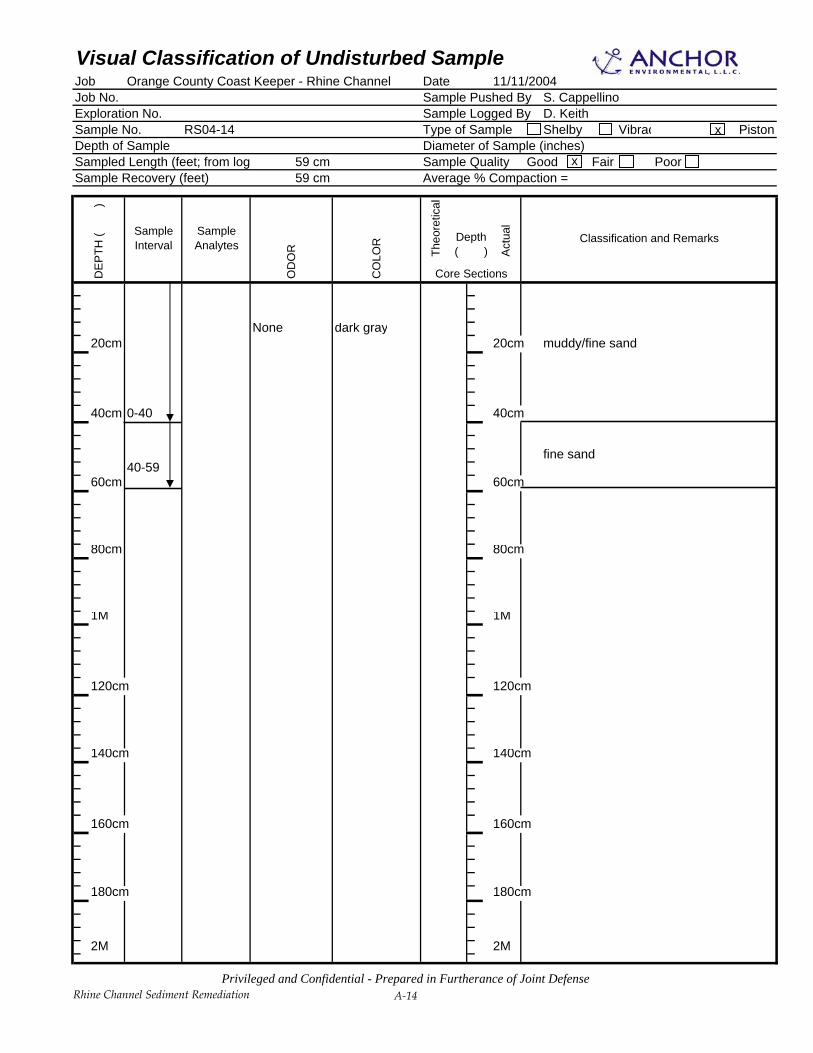
Visual Classification of Undisturbed SampleJob Orange County Coast Keeper - Rhine Channel Date 11/11/2004Job No. Sample Pushed By S. CappellinoExploration No. Sample Logged By D. KeithSample No. RS04-14 Type of Sample Shelby Vibrac PistonDepth of Sample Diameter of Sample (inches)Sampled Length (feet; from log 59 cm Sample Quality Good Fair PoorSample Recovery (feet) 59 cm Average % Compaction =
None dark gray20cm 20cm muddy/fine sand
40cm 0-40 40cm
fine sand40-59
60cm 60cm
80cm 80cm
1M 1M
120cm 120cm
140cm 140cm
160cm 160cm
180cm 180cm
2M 2M
Classification and Remarks
Core Sections
Depth ( )Th
eore
tical
Act
ual
DE
PTH
(
)
OD
OR
CO
LOR
Sample Interval
Sample Analytes
x
x
Rhine Channel Sediment RemediationPrivileged and Confidential - Prepared in Furtherance of Joint Defense
A-14

Visual Classification of Undisturbed SampleJob Orange County Coast Keeper - Rhine Channel DateJob No. Sample Pushed By S. CappellinoExploration No. Sample Logged By D. KeithSample No. RS04-15 Type of Sample Shelby Vibrac PistonDepth of Sample Diameter of Sample (inches) 3Sampled Length (feet; from log 153 cm Sample Quality Good Fair PoorSample Recovery (feet) 153 cm Average % Compaction =
None dark gray to20cm olive green 20cm
non-laminated silty/fine sand mud
40cm 0-40 40cm
60cm 60cm
80cm 40-80 80cm
1M 1M medium sand with shell fragments(10-15%)
120cm 120cm
140cm 140cm
80-153
160cm 160cm
180cm 180cm
2M 2M
Classification and Remarks
Core Sections
Depth ( )Th
eore
tical
Act
ual
DE
PTH
(
)
OD
OR
CO
LOR
Sample Interval
Sample Analytes
x
x
Rhine Channel Sediment RemediationPrivileged and Confidential - Prepared in Furtherance of Joint Defense
A-15

Visual Classification of Undisturbed SampleJob Orange County Coast Keeper - Rhine Channel Date 11/10/2004Job No. Sample Pushed By S. CappellinoExploration No. Sample Logged By D. KeithSample No. RS04-16 Type of Sample Shelby Vibrac PistonDepth of Sample Diameter of Sample (inches) 3Sampled Length (feet; from log 1.5 m Sample Quality Good Fair PoorSample Recovery (feet) 1.5 m Average % Compaction =
20cm 20cm
40cm 40cm
0-50 non-laminated silty/fine sand mud
60cm 60cm
80cm 80cm
1M 50-100 light Sulphur dark gray 1M
120cm 120cmfine to medium sandwith < 5% shell fragments
140cm 140cm
100-150
160cm 160cm
180cm 180cm
2M 2M
Classification and Remarks
Core Sections
Depth ( )Th
eore
tical
Act
ual
DE
PTH
(
)
OD
OR
CO
LOR
Sample Interval
Sample Analytes
x
x
Rhine Channel Sediment RemediationPrivileged and Confidential - Prepared in Furtherance of Joint Defense
A-16
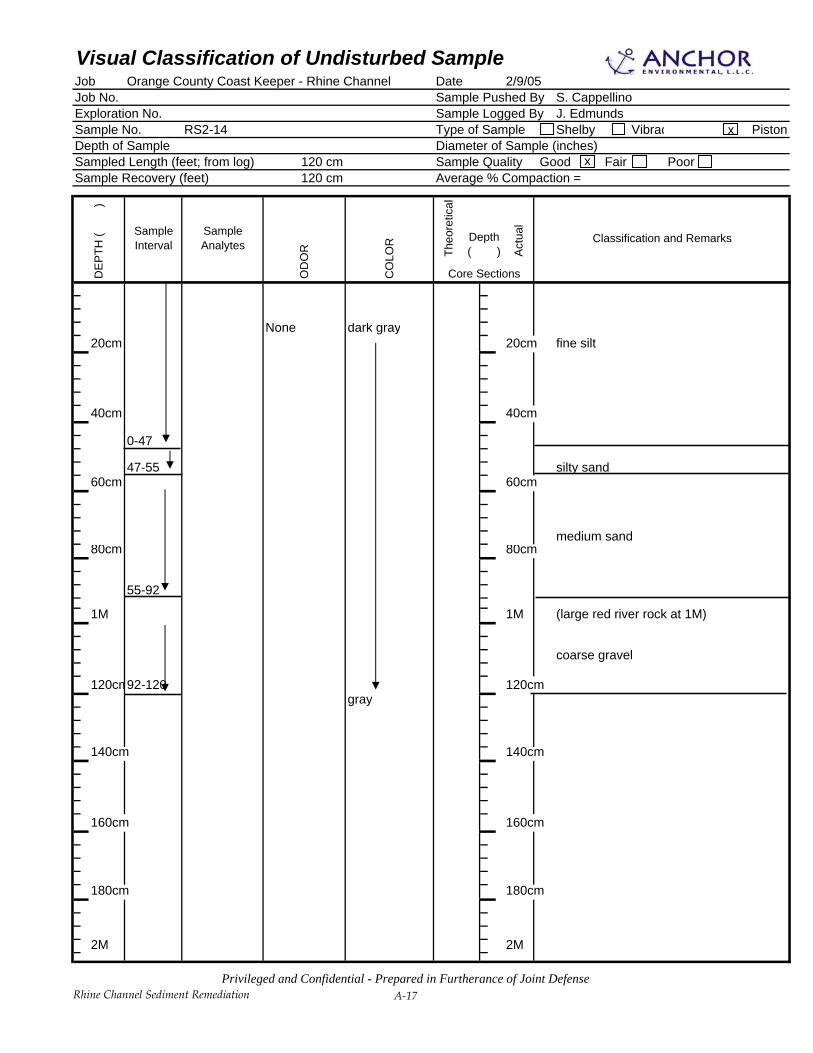
Visual Classification of Undisturbed SampleJob Orange County Coast Keeper - Rhine Channel Date 2/9/05Job No. Sample Pushed By S. CappellinoExploration No. Sample Logged By J. EdmundsSample No. RS2-14 Type of Sample Shelby Vibrac PistonDepth of Sample Diameter of Sample (inches)Sampled Length (feet; from log) 120 cm Sample Quality Good Fair PoorSample Recovery (feet) 120 cm Average % Compaction =
None dark gray20cm 20cm fine silt
40cm 40cm
0-47
47-55 silty sand60cm 60cm
medium sand80cm 80cm
55-92
1M 1M (large red river rock at 1M)
coarse gravel
120cm92-120 120cmgray
140cm 140cm
160cm 160cm
180cm 180cm
2M 2M
Classification and Remarks
Core Sections
Depth ( )Th
eore
tical
Act
ual
DE
PTH
(
)
OD
OR
CO
LOR
Sample Interval
Sample Analytes
x
x
Rhine Channel Sediment RemediationPrivileged and Confidential - Prepared in Furtherance of Joint Defense
A-17

Visual Classification of Undisturbed SampleJob Orange County Coast Keeper - Rhine Channel Date 2/9/05Job No. Sample Pushed By S. CappellinoExploration No. Sample Logged By J. EdmundsSample No. RS2-16 Type of Sample Shelby Vibrac PistonDepth of Sample Diameter of Sample (inches)Sampled Length (feet; from log) 140 cm Sample Quality Good Fair PoorSample Recovery (feet) 140 cm Average % Compaction =
None dark gray20cm 20cm fine silty sand
40cm 40cm
0-53
60cm 53-59 60cm silty sand
fine sand80cm 80cm
59-92
1M 92-99 1M clay lense
120cm 120cmfine to medium grain sand
140cm99-140 gray 140cm
160cm 160cm
180cm 180cm
2M 2M
DE
PTH
(
)
OD
OR
CO
LOR
Sample Interval
Sample Analytes Classification and Remarks
Core Sections
Depth ( )Th
eore
tical
Act
ual
x
x
Rhine Channel Sediment RemediationPrivileged and Confidential - Prepared in Furtherance of Joint Defense
A-18

APPENDIX B CHEMICAL ANALYSIS PROCEDURES

Draft Feasibility Study and Alternatives Evaluation April 2005 Rhine Channel Sediment Remediation B-1 040279-01
Determination of Mercury Speciation in Rhine Channel Sediments
Jennifer L. Parker, Research Scientist Studio Geochimica
4744 University Way NE, Seattle WA 98105 February 22, 2005
I. Scope
A total of 6 samples were submitted for the determination of total and methyl Hg analysis. II. Sample Receipt
Studio Geochimica received the sediment samples on February 10, 2005. Samples were frozen and were placed in a freezer upon receipt. Several of the sample containers were broken because the containers were filled too full upon collection. Cross contamination was not an issue because samples were individually bagged according to sampling location. III. Sample Analysis General. Samples were received and logged in according to Studio Geochimica protocols on the day of receipt. Samples were processed using ultra-clean sample handling techniques in a laboratory known to be low in atmospheric Hg. Reagents, gases, and DI water are all reagent or ultra-pure grade, and previously analyzed for Hg and trace metals to ensure very low blanks. Inorganic Hg (THg) standards are prepared by direct dilution of NIST certified NBS-3133 10.00 mg/mL Hg standard solution, and results are independently verified by the analysis of NIST-1641d (fresh water CRM, 200x dilution; 7,950 ng/L THg). Monomethyl mercury standards were made from the pure powder, diluted into a mixture of 5% acetic acid and 0.2% HCl, and then accurately calibrated for monomethyl mercury (equal to total Hg minus ionic Hg) against NBS-3133. Monomethyl mercury results were also cross-verified by daily analysis of NRCC DORM-2 (4,470 ± 370 ng/g MMHg).

Draft Feasibility Study and Alternatives Evaluation April 2005 Rhine Channel Sediment Remediation B-2 040279-01
All results have been corrected both for the mean reagent blank (a trivial fraction of most observed concentrations), and for instrumental drift throughout the day. This correction is made by taking the average recovery for adjacent continuing calibration verifications (CCVs), and using this value to correct all of the measured data points between those two CCVs. In general, this results in a correction in the range of 2-15% of the raw measured values, depending upon the room temperature range during the day (with CVAFS, instrumental sensitivity is somewhat influenced by the ambient temperature). Percent Moisture (Dry Fraction). Approximately 5-10 grams of soil was weighed to the nearest 1 mg into pre-weighed disposable aluminum pans. The samples were then heated to 105 oC for 12-15 hours in a vented convection oven, and then taken out and allowed to cool for 10 minutes to room temperature. The samples were again weighed to the nearest 1 mg. From these data, the dry fractions (net dry mass (g)/net wet mass (g)) were calculated. Monomethyl Mercury in Sediments. CH3Hg was determined using extraction of an approximately 0.5 gram sample aliquot, weighed to the nearest milligram, with 5 mL of an KBr/H2SO4/CuSO4 mixture. The CH3Hg as the bromide is extracted into 10 mL of methylene chloride. Finally, 2.0 mL of the solvent is back-extracted by evaporation into 57.6 mL of deionized water for analysis by aqueous phase ethylation, isothermal GC at 100 oC, pyrolytic decomposition, and CVAFS detection. The solvent extraction procedure overcomes the positive artifact formation that had been observed previously when the more common distillation extraction is applied to sediments and soils (Bloom et al., 1997). Total Mercury in Sediments. Approximately 0.5 grams was digested using aqua regia (8mL HCl + 2 mL HNO3). Samples were allowed to sit overnight and were then diluted to 40 mL with reagent water. Mercury was then quantified using SnCl2 reduction, purge and trap dual amalgamation CVAFS as described above and concentrations were reported in ng g-1.
IV. Analytical Issues No significant analytical problems were noted. All blanks and estimated detection limits were low and typical of the methods employed. All recoveries were good, with precision of results more than 10 times the detection limits typically about 5% relative percent difference (RPD).
Draft Feasibility Study and Alternatives Evaluation April 2005 Rhine Channel Sediment Remediation B-3 040279-01
V. References Bloom, N.S., Coleman, J.A., and Barber, L. 1997. “Artifact Formation of Methyl
Mercury During Extraction of Environmental Samples by Distillation.” Fres. Anal. Chem. 358: 371-377.
APPENDIX C REVIEW OF CHANNEL AND STRUCTURAL CONDITIONS

Anchor Environmental, L.L.C. 1423 3rd Avenue, Suite 300 Seattle, Washington 98101 Phone 206.287.9130 Fax 206.287.9131
Draft Memorandum To: Orange County Coastkeeper
From: Anchor Environmental, L.L.C.
Date: April 13, 2005
Re: Review of Structural Components and Existing Conditions
Rhine Channel, Newport Beach, California
This memorandum provides a brief description of existing structural components and
conditions along the banks of the Rhine Channel in Newport Beach, California. The work was
conducted in November 2004 by Anchor Environmental using aerial photographs, surveys, and
site visits.
1 SITE BACKGROUND
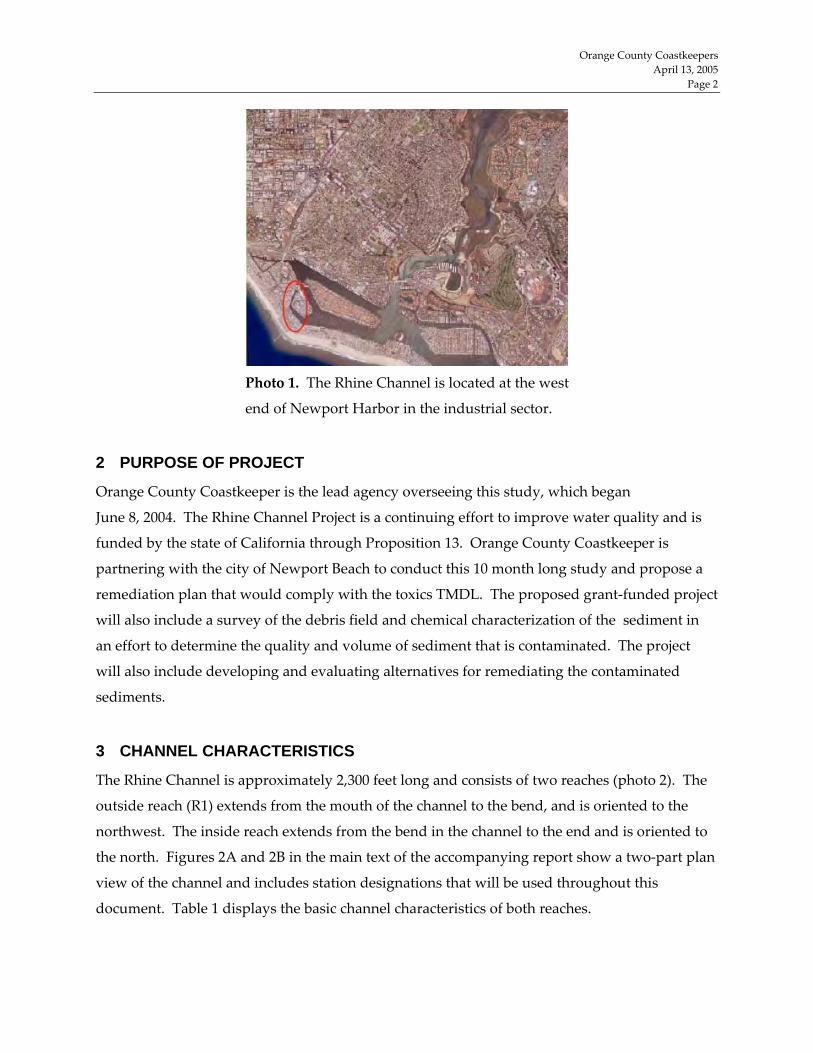
The Rhine Channel is a body of water located at the west end of Newport Harbor in the old,
industrial cannery and shipyard sector (photo 1). The channel tops Southern California's
Environmental Protection Agency (EPA) 1998 list of impaired water-bodies as a "toxic sediment
hot spot." Early studies suggest high amounts of mercury, copper, zinc, PCB and DDE toxins as
well as a suspected debris field of industrial and marine waste dumped there over the decades.
Historic records indicate that the sediments in the Rhine Channel have been contaminated since
the 1930s when the channel was lined with shipyards, metal plating facilities, and a cannery. It
appears that a significant amount of debris such as batteries, engines, and large pieces of metal
and wood have been deposited in the Rhine Channel over time. In addition, runoff from the
facilities on the channel and in the surrounding watershed has contributed to chemical
contamination of the sediments.
Orange County Coastkeepers April 13, 2005 Page 2
Photo 1. The Rhine Channel is located at the west
end of Newport Harbor in the industrial sector.
2 PURPOSE OF PROJECT
Orange County Coastkeeper is the lead agency overseeing this study, which began
June 8, 2004. The Rhine Channel Project is a continuing effort to improve water quality and is
funded by the state of California through Proposition 13. Orange County Coastkeeper is
partnering with the city of Newport Beach to conduct this 10 month long study and propose a
remediation plan that would comply with the toxics TMDL. The proposed grant-funded project
will also include a survey of the debris field and chemical characterization of the sediment in
an effort to determine the quality and volume of sediment that is contaminated. The project
will also include developing and evaluating alternatives for remediating the contaminated
sediments.
3 CHANNEL CHARACTERISTICS
The Rhine Channel is approximately 2,300 feet long and consists of two reaches (photo 2). The
outside reach (R1) extends from the mouth of the channel to the bend, and is oriented to the
northwest. The inside reach extends from the bend in the channel to the end and is oriented to
the north. Figures 2A and 2B in the main text of the accompanying report show a two-part plan
view of the channel and includes station designations that will be used throughout this
document. Table 1 displays the basic channel characteristics of both reaches.

Orange County Coastkeepers April 13, 2005 Page 3
Photo 2. Two reaches of the Rhine Channel
Table 1
Channel Characteristics
Reach Reach 1 (R1) Reach 2 (R2)
Relative location Outside Inside Length 1300 ft 1000 ft Width, sea wall to sea wall 450 ft 200 ft Working width 300 ft 100 ft Depth of the middle 11.5 ft 11ft Depth of the bend 11.5 ft 11.5 ft
4 DESCRIPTION OF CHANNEL BANK
4.1 Bulkheads
The entire bank of the Rhine Channel has been developed into housing, restaurants, small
businesses, and marine support services. The channel’s perimeter is approximately 5,000
feet long and mainly comprises a concrete slab bulkhead. Occasionally the bulkhead is
supported by steel tiebacks as depicted in photo 3. Some of the tiebacks appear to have
been installed post construction. The top of the bulkhead is at approximately 10 to 12 feet
MLLW in elevation. A concrete cap rests on top of the bulkhead.
Reach 2 (R2)
Bend
Reach 1 (R1)

Orange County Coastkeepers April 13, 2005 Page 4
Photo 3. Steel tieback supporting concrete bulkhead
4.2 Rip Rap
One section of the bank is armored by rip rap instead of the concrete slab. The rip rap bank
is about 60 feet long and appears to be in stable condition.
Photo 4. Rip rap at station 5+75
4.3 Natural Slope
On the east side of R2 from station 4 +50 to 6+00, an area of natural slope extends into the
channel (photo 5). The bank contains some concrete debris and a timber bulkhead. The
timber bulkhead is supported by soldier piles on 5 foot centers with wood laggings. The
slope rises above the high water mark to the underside of a wood deck in front of private
residences.

Orange County Coastkeepers April 13, 2005 Page 5
Photo 5. Natural slope at station 4 + 50 of Reach 2
4.4 Floating docks
Most docks along the channel are floating systems tied to concrete guide piles (photo 6).
The docks are free to move with the water height on a series of rollers. The docks are
oriented in various alignments; they are parallel, perpendicular, or diagonal to the bank.
Along the west side of R1, the docks surrounding the channel typically extend 60 feet out
into the waterway and are 15 feet apart. On the east side of R1, the docks can be up to 35
feet apart and house up to eight boats in a herringbone pattern. In R2, the west side docks
are typically 35 feet long and 15 feet apart.
Photo 6. Typical floating dock with concrete piles

Orange County Coastkeepers April 13, 2005 Page 6
4.5 Ramps and Sinker Lifts
Two boat ramps are located near station 13+00 along R1. One is on the east side and one is
on the west side of the channel. At station 16+00 in R1 on the west side there is a boat lift
operated by a boatyard. And as depicted in photo 7, a sinker lift is located on the west side
of the channel near station 18+00. The sinker lift has approximately 5 feet of clearance at
mid-tide and has very little access underneath. Sonar images depict what appears to be a
large debris field in the waterway near the sinker lift. Old boat parts, container doors, and
perhaps a car are speculated to be in this debris field.
Photo 7. Sinker lift near station 18+00
5 INDICATIONS OF STRUCTURAL WEAR AND DAMAGE
The bulkhead appears to be structurally sound along most of its length with some cracking and
deterioration of the outer surface material evident in many areas. There are three main
locations where the integrity of the bulkhead appears to be in poor condition. Of the
approximately 5,000 feet of concrete bulkhead, about 390 feet appear to be failing. This
represents approximately 8 percent of the total length of bulkhead along the channel. However,
if material is to be dredged near the bulkhead, measures may be needed to either shore up the
failing portions or reconstruct the sections entirely.
5.1 Bulkhead Failure
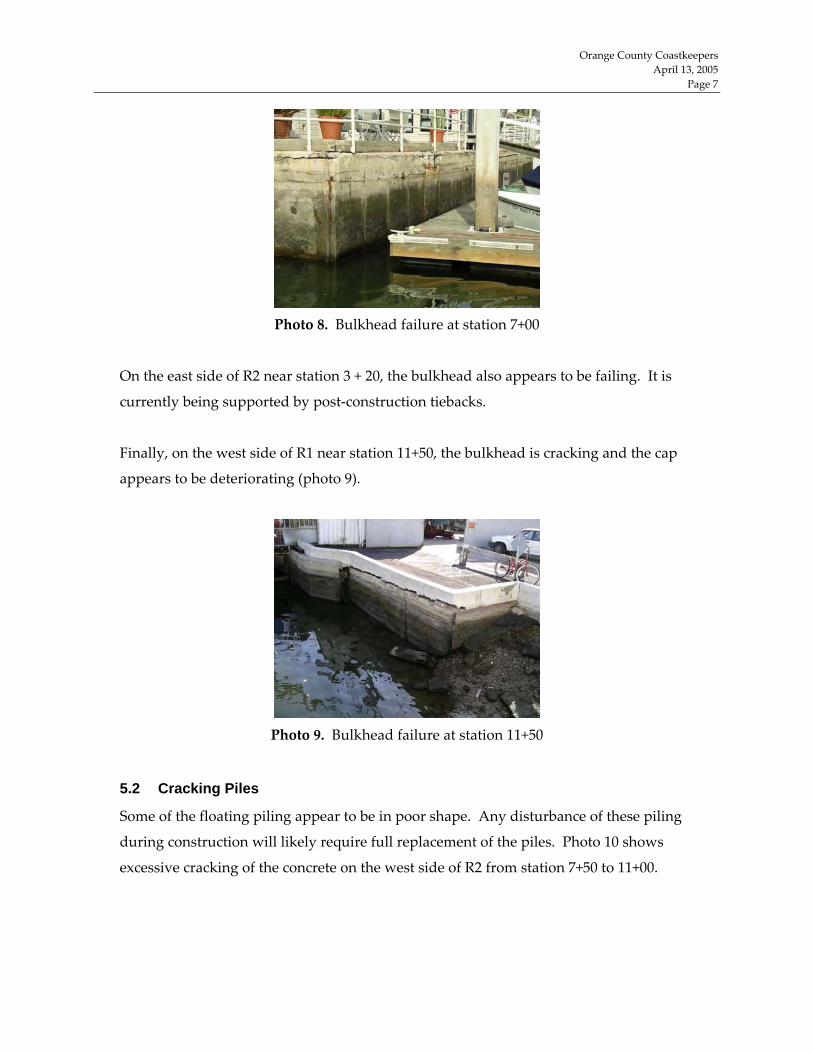
Specifically on the west side R2 near station 7+00, disintegrating concrete in the cap has
exposed rebar supports (photo 8). Spalling of the concrete is also prominent.
Orange County Coastkeepers April 13, 2005 Page 7
Photo 8. Bulkhead failure at station 7+00
On the east side of R2 near station 3 + 20, the bulkhead also appears to be failing. It is
currently being supported by post-construction tiebacks.
Finally, on the west side of R1 near station 11+50, the bulkhead is cracking and the cap
appears to be deteriorating (photo 9).
Photo 9. Bulkhead failure at station 11+50
5.2 Cracking Piles
Some of the floating piling appear to be in poor shape. Any disturbance of these piling
during construction will likely require full replacement of the piles. Photo 10 shows
excessive cracking of the concrete on the west side of R2 from station 7+50 to 11+00.

Orange County Coastkeepers April 13, 2005 Page 8
Photo 10. Cracks in concrete piling
5.3 Outfall pipes and storm drains
Storm drains release into the channel in various locations along the bulkhead. The
stormwater is discharged directly into the channel. Photo 11 shows an exposed outfall pipe
on the west side of the channel, off of 26th Street, near station 12+00.
Photo 11. Exposed storm drain

Orange County Coastkeepers April 13, 2005 Page 9
5.4 General Cracks and Deterioration
Some locations around the perimeter of the channel have superficial cracks in the apron or
sidewalk above the bulkhead (Photo 12). There is also evidence of deterioration of the
concrete that appears not to affect structural integrity of the bulkhead. If dredging
operations and heavy machinery are working in the vicinity of these areas, attention will
need to be paid to prevent worsening of the condition. In some areas, repairs or
reconstruction will need to take place if significant damage is done.
Photo 12. Cracks in sidewalk
Photo 13. Cracks in apron

Orange County Coastkeepers April 13, 2005 Page 10 6 CONCLUSION
The entire shoreline of the Rhine Channel is developed either by residential housing or
commercial businesses. The channel’s perimeter is approximately 5,000 feet long and mainly
comprises a concrete slab bulkhead. The perimeter also consists of one 60-foot section of rip rap
and one 150-foot section of natural slope.
For the most part, the bulkhead is in stable condition and should withstand the effects of
activity in the channel related to sediment remediation. About 390 feet (8 percent) of the
bulkhead is in poor condition or completely failing, and would requiring shoring or complete
replacement if work is to be conducted that would jeopardize the bulkhead integrity.
The other significant obstacles to sediment remediation are the floating piers and guide piles
that line the banks of the channel. These structures will likely require demolition/disassembly
and reassembly after the remediation work is completed.
APPENDIX D TROPHIC TRACE RISK ASSESSMENT

FOCUSED ECOLOGICAL RISK ASSESSMENT – BIOACCUMULATION MODELING
RHINE CHANNEL SEDIMENT REMEDIATION
NEWPORT BAY, CALIFORNIA
Prepared for Orange County Coastkeeper
Prepared by Anchor Environmental, L.L.C.
1423 Third Avenue, Suite 300
Seattle, Washington 98101
April 2005

Table of Contents
1 INTRODUCTION................................................................................................................................ 1
2 PROBLEM FORMULATION............................................................................................................. 4 2.1 Environmental Setting ............................................................................................................. 4 2.2 Resources Potentially at Risk and Receptor Selection......................................................... 4 2.3 Chemicals of Potential Concern.............................................................................................. 6 2.4 Conceptual Site Model............................................................................................................. 6 2.4.1 Dietary Exposure Pathway ................................................................................................. 8 2.4.2 Water Exposure Pathway.................................................................................................... 8 2.4.3 Sediment Exposure Pathway.............................................................................................. 9
2.5 Assessment Endpoints and Measures of Exposure and Effects......................................... 9
3 EXPOSURE ASSESSMENT .............................................................................................................. 11 3.1 Chemicals................................................................................................................................. 11 3.2 Environment............................................................................................................................ 13 3.3 Organisms................................................................................................................................ 15 3.3.1 Invertebrates ....................................................................................................................... 15 3.3.2 Fish ....................................................................................................................................... 16 3.3.2.1 Planktivorous Fish – California Killifish ................................................................ 16 3.3.2.2 Benthivorous Fish – Arrow Goby............................................................................ 17 3.3.2.3 Benthivorous Fish – Diamond Turbot .................................................................... 17 3.3.2.4 Piscivorous Fish – California Halibut ..................................................................... 18
3.3.3 Wildlife ................................................................................................................................ 18 3.3.3.1 Brown Pelican ............................................................................................................ 19 3.3.3.2 Cormorant................................................................................................................... 19 3.3.3.3 Harbor Seal ................................................................................................................. 20
4 EFFECTS ASSESSMENT .................................................................................................................. 21 4.1 Fish............................................................................................................................................ 21 4.2 Wildlife..................................................................................................................................... 22
4.2.1.1 Birds............................................................................................................................. 22 4.2.1.2 Harbor Seal ................................................................................................................. 24
5 RISK CHARACTERIZATION AND UNCERTAINTY EVALUATION.................................... 25 5.1 Fish............................................................................................................................................ 25 5.2 Wildlife..................................................................................................................................... 27 5.3 Risk Summary and Conclusions........................................................................................... 29
6 REFERENCES .................................................................................................................................... 31
Focused Ecological Risk Assessment April 2005 Rhine Channel Sediment Remediation D‐i 040279‐01
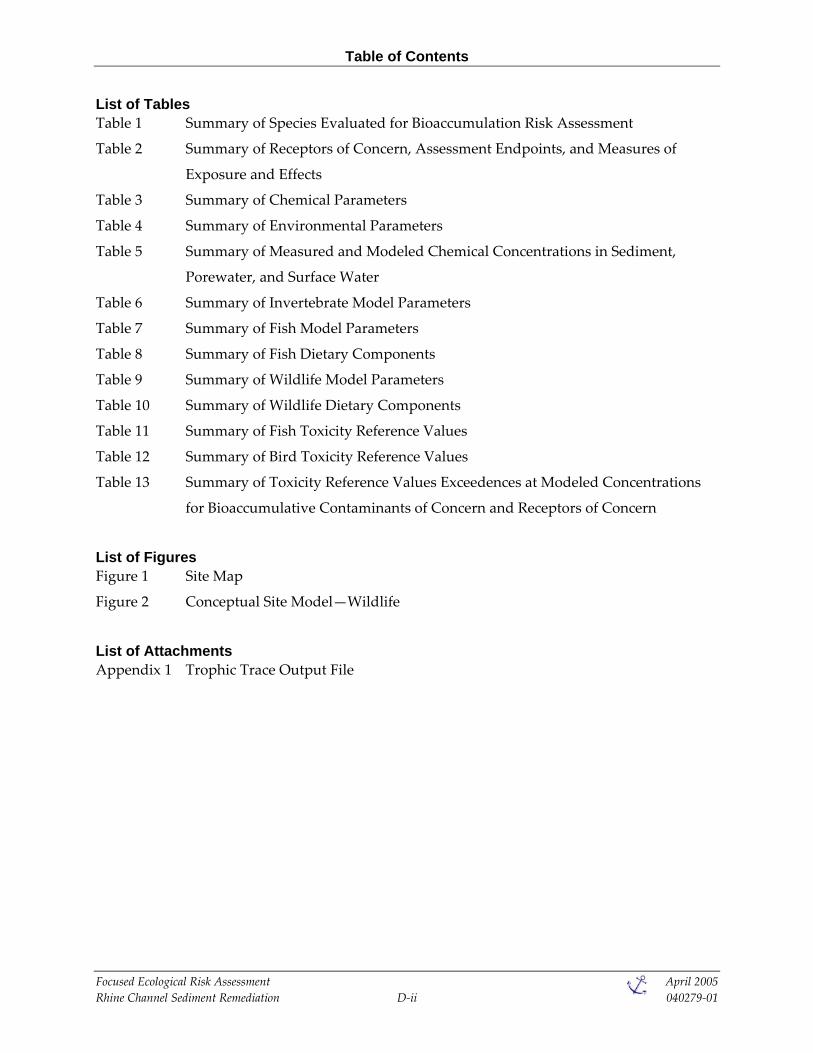
Table of Contents
List of Tables Table 1 Summary of Species Evaluated for Bioaccumulation Risk Assessment
Table 2 Summary of Receptors of Concern, Assessment Endpoints, and Measures of
Exposure and Effects
Table 3 Summary of Chemical Parameters
Table 4 Summary of Environmental Parameters
Table 5 Summary of Measured and Modeled Chemical Concentrations in Sediment,
Porewater, and Surface Water
Table 6 Summary of Invertebrate Model Parameters
Table 7 Summary of Fish Model Parameters
Table 8 Summary of Fish Dietary Components
Table 9 Summary of Wildlife Model Parameters
Table 10 Summary of Wildlife Dietary Components
Table 11 Summary of Fish Toxicity Reference Values
Table 12 Summary of Bird Toxicity Reference Values
Table 13 Summary of Toxicity Reference Values Exceedences at Modeled Concentrations
for Bioaccumulative Contaminants of Concern and Receptors of Concern
List of Figures Figure 1 Site Map
Figure 2 Conceptual Site Model—Wildlife
List of Attachments Appendix 1 Trophic Trace Output File
Focused Ecological Risk Assessment April 2005 Rhine Channel Sediment Remediation D‐ii 040279‐01

Introduction
1 INTRODUCTION
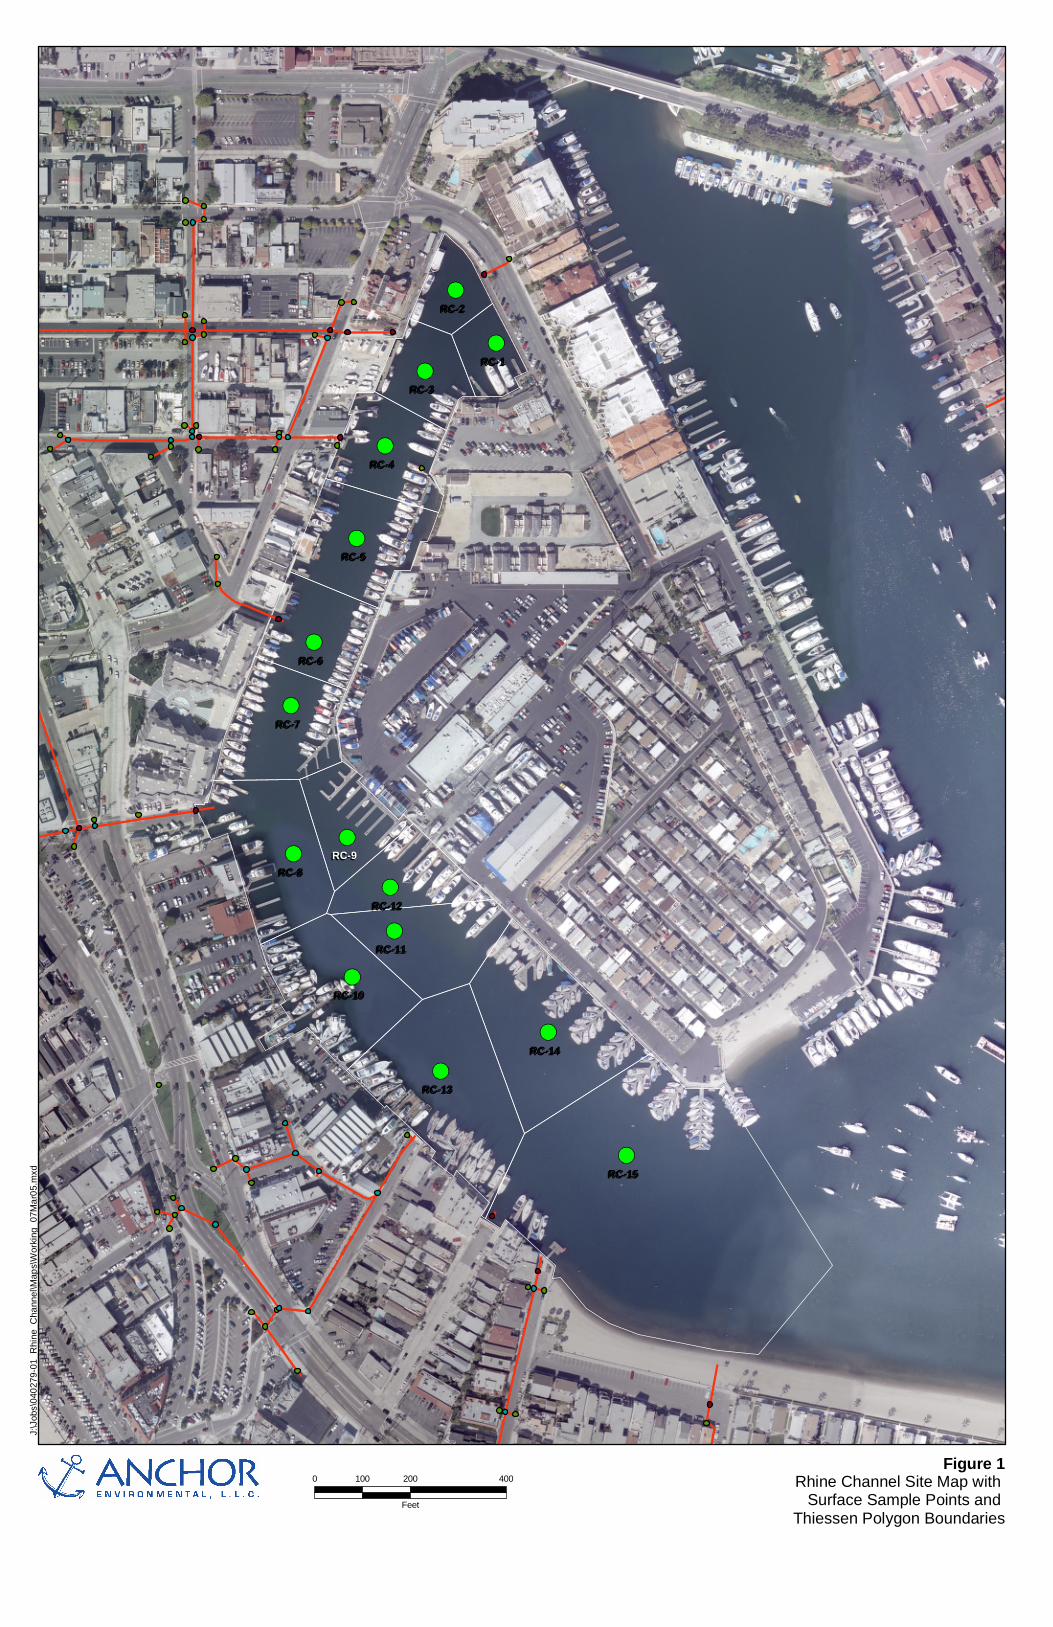
The Rhine Channel is a body of water located at the west end of Newport Bay in the old,
industrial cannery and shipyard sector (Figure 1). The channel tops Southern Californiaʹs
Environmental Protection Agency (CalEPA) 1998 list of impaired water‐bodies as a ʺtoxic
sediment hot spot.ʺ Early studies suggest high amounts of mercury, copper, zinc,
polychlorinated biphenyls (PCB) and dichlorodiphenyldichloroethylene (DDE, a breakdown
product of DDT) toxins, as well as a suspected debris field of industrial and marine waste
dumped in the channel over time. Historic records indicate that the sediments in the Rhine
Channel have been contaminated since the 1930s when the channel was lined with shipyards,
metal plating facilities, and a cannery. It appears that a significant amount of debris (such as
batteries, engines, and large pieces of metal and wood) has been deposited in the Rhine Channel
over time. In addition, runoff from the facilities on the channel and in the surrounding
watershed has contributed to chemical contamination of the sediments. Recent sediment data
show that in areas of the channel where the highest concentrations of some contaminants were
recorded, pollutants exceed levels above which adverse effects to marine benthos is expected.
In addition, sediment toxicity has been observed in amphipod and sea urchin toxicity tests.
(Anchor 2005; Coastkeeper 2005).
This focused ecological risk assessment (EcoRA) is part of an ongoing study evaluating the
cleanup of contaminated sediment in the Rhine Channel. The Rhine Channel project is a
continuing effort to improve water quality and is funded by the state of California through
Proposition 13. Orange County Coastkeeper is partnering with the city of Newport Beach to
conduct this 10‐month‐long study and propose a remediation plan that would comply with the
Toxics Total Maximum Daily Load (TMDL). The proposed grant‐funded project will also
include a survey of the debris field and chemical characterization of the sediment in an effort to
determine the quality and volume of sediment that is contaminated. The project will also
include developing and evaluating alternatives for remediation of the contaminated sediments.
(Coastkeeper 2005). The goal of this EcoRA is to provide an estimate of baseline risk from
bioaccumulation of contaminants to higher trophic levels of fish, birds, and marine mammals
for use in informing cleanup decisions.
Specifically, this EcoRA addresses the potential for food chain transfer of sediment‐associated
contaminants, including selected metals, PCBs, and DDE, to higher trophic levels of fish, birds,
Focused Ecological Risk Assessment April 2005 Rhine Channel Sediment Remediation D‐1 040279‐01

Introduction
and marine mammals. The Gobas steady‐state uptake model was used to evaluate non‐polar
organic compounds (PCBs and DDE), and a bioconcentration factor (BCF) approach was
applied for the inorganic metals, copper, mercury, and selenium. Both the Gobas model and
BCF model are included as parts of the U.S. Army Corps of Engineer (Corps) Trophic Trace
(Version 3.04; November 2003a) software developed by the Waterways Experiment Station
(WES) for use in evaluating dredged material (www.wes.army.mil/el/trophictrace).
This report documents the focused screening‐level EcoRA that was performed specifically to
evaluate bioaccumulation risk using the Trophic Trace model. The following sections generally
follow the U.S. Environmental Protection Agency (USEPA 1998a) guidelines for ecological risk
assessment and include a problem formulation, exposure characterization, effects
characterization, and risk analysis and uncertainty evaluation. In addition, the following
sections also reference the data entry screens in Trophic Trace to allow the reader to recreate the
modeling effort. The Trophic Trace output file is presented in Attachment 1 of this report. The
Trophic Trace Microsoft Excel input file is available upon request from Dan Hennessy of
Anchor Environmental, L.L.C. ([email protected]).
Focused Ecological Risk Assessment April 2005 Rhine Channel Sediment Remediation D‐2 040279‐01
J:\J
obs\
0402
79-0
1_R
hine
_Cha
nnel
\Map
s\W
orki
ng_0
7Mar
05.m
xd
G r e e n s B a y o u
RC-9RC-9RC-8RC-8
RC-7RC-7
RC-6RC-6
RC-5RC-5
RC-4RC-4
RC-3RC-3
RC-2RC-2
RC-1RC-1
RC-15RC-15
RC-14RC-14
RC-13RC-13
RC-12RC-12
RC-11RC-11
RC-10RC-10
Figure 1Rhine Channel Site Map with
Surface Sample Points and Thiessen Polygon Boundaries
0 200 400100
Feet

Problem Formulation
2 PROBLEM FORMULATION
Exposure to sediment‐associated contaminants of potential concern (COPCs) depends on the
physical fate and transport of the COPCs as well as the ecological characteristics of the receptors
of concern (ROCs). The potential longer‐term exposure of the ROCs to sediment COPCs may
occur by direct contact or ingestion of sediments and surface water, as well as food chain
transfer of contaminants by sediment or water dietary pathways.
2.1 Environmental Setting
The Rhine Channel is approximately 2,300 feet long and consists of two reaches, separated
by a slight bend in the channel alignment. The outer reach (Reach 1) extends from the
mouth of the channel to the bend, and is oriented to the northwest. The inner reach (Reach
2) extends from the bend in the channel to the head of the channel and is oriented to the
north. Reach 1 is approximately 1,300 feet long and 450 feet wide. Reach 2 is approximately
1,000 feet long and 125 feet wide. The approximate area of the Rhine Channel is
approximately 7 hectares. The depth of the Rhine Channel averages approximately ‐11 feet
mean lower low water (MLLW).
The entire bank of the Rhine Channel has been developed into housing, restaurants, small
businesses, and marine support services. The channel’s perimeter is approximately 5,000
feet long and is mainly comprised of a concrete slab bulkhead. The top of the bulkhead is
approximately 10 to 12 feet MLLW in elevation. A concrete cap rests on top of the
bulkhead. Smaller sections of rip rap (60 feet long) and natural slope (150 feet long) are also
present. Most docks along the channel are floating systems tied to concrete guide piles. The
docks are free to move with the water height on a series of rollers. The docks are oriented in
various alignments; they are parallel, perpendicular, or diagonal to the bank. Two boat
ramps and a sinker lift are also present. Storm drains release into the channel in various
locations along the bulkhead. The stormwater is discharged directly into the channel.
2.2 Resources Potentially at Risk and Receptor Selection
A number of ecological resources may utilize the Rhine Channel and surrounding areas
including potential use by threatened, endangered, and sensitive species. For the purpose
of this evaluation, three groups of species were evaluated as ROCs: fish, birds, and aquatic
mammals. In previous studies, benthic infaunal species were directly evaluated as ROCs
Focused Ecological Risk Assessment April 2005 Rhine Channel Sediment Remediation D‐4 040279‐01

Problem Formulation
based on comparison to sediment quality guidelines and toxicity tests (SCCWRP 2003);
these studies found risk to benthos from sediment‐associated contaminants is likely.
The selection of species as ROCs was made under consideration of the ecology of a typical
southern California delta embayment environment. Information on the fish was obtained
from the California Department of Fish and Game (CDFG) marine sport fish identification
webpage (CDFG 2003a), CDFG fish bulletins (CDFG 2002; Lane and Hill 1975), U.S. Fish and
Wildlife Service species profiles (www.nwrc.gov/publications/specintro.htm), and relevant
texts on seashore biology (Ricketts et al. 1985; Kozloff 1993; Smith and Carlton 1975).
Information on birds and mammals was obtained from the California Wildlife Habitat
Relationships System (CDFG 2003b) and local sources (Audubon 2004; Coastkeeper 2005;
Orange County 2005). The ROCs evaluated in this EcoRA are summarized in Table 1.
Table 1 Summary of Species Evaluated for Bioaccumulation Risk Assessment
Trophic Guild Species Environment Reason for Selection
Fish
Planktivorous fish California killifish (Fundulus parvipinnis)
Shallow, sheltered waters. High site fidelity
Prey item for piscivorous fish and birds. Feeds throughout the water column
Arrow goby (Clevelandia ios)
Shallow water, soft bottom substrate
Prey item for fish and birds. Consumes benthos. Burrows in sediments. Benthivorous fish
Diamond turbot (Hypsopsetta guttulata)
Shallow water, soft bottom substrate
Prey item for harbor seal. Consumes benthos
Piscivorous fish California halibut (Paralichthys californicus)
Shallow and deep waters, soft bottom substrate
Prey item for harbor seal. Consumes fish
Birds
Brown pelican (Pelecanus occidentalis)
Open water/channel island rookeries
State and federally endangered species
Piscivorous birds Double crested Cormorant (Phalacrocorax auritus)
Open water/rocky headlands and islands.
Common around wharfs and areas with little vegetation. Can have high site fidelity. Commonly used as environmental indicator species.
Mammals
Piscivorous mammal Harbor seal (Phoca vitulina) Nearshore habitats. Common pinniped. Consumes
fish.
Focused Ecological Risk Assessment April 2005 Rhine Channel Sediment Remediation D‐5 040279‐01

Problem Formulation
2.3 Chemicals of Potential Concern
The selection of CPOCs was based on the screening of sediment surface data (top 10 cm)
chemistry against established sediment quality guidelines (SQGs). Use of this sediment
data set represents existing conditions and assumes that the system is at a steady state and
that the only route of exposure is direct contact with the surface sediments, porewater, or
surface water (i.e., the modeled exposure does not address resuspension or disturbance of
sediment). While a number of chemicals in the Rhine Channel surface sediments exceeded
the SQGs established for the protection of benthos (SCCWRP 2004a), a more stringent screen
was applied to determine the primary bioaccumulative CPOCs. Specifically, the sediment
data were compared to the bioaccumulation trigger values established by the Puget Sound
Dredged Material Management Office (Corps 2003b). Chemicals with a maximum
concentration more than one‐half the bioaccumulation trigger value (copper, mercury,
selenium, DDE1, and total PCBs) were retained for further assessment in this focused
EcoRA.
2.4 Conceptual Site Model
The conceptual site model was primarily based on trophic transfer of the COPCs through
the food chain from sediment and/or water invertebrates forage species piscivorous
species as generally framed by the Trophic Trace model. In addition to the dietary
exposure, water exposure to the ROCs was also implicitly evaluated by the model for the
fish via the Gobas and BCF models. Water exposure to the bird and mammal receptors and
direct sediment exposure to all ROCs was evaluated qualitatively and is discussed below in
more detail.
The conceptual model defining the pathways to the seven ROCs that were modeled using
Trophic Trace are depicted in Figure 2. The invertebrate, fish, and wildlife in this model
were selected to represent a generic southern California bay food chain and address specific
concerns about bioaccumulation of COPCs in sensitive or important species. These species
are presented in Table 1. Additional discussion of the ecology of these species as it relates to
the parameterization of the model is provided below in Section 3.
1 Only DDE was detected in the Rhine Channel surface sediment. DDT and DDD were not detected.
Focused Ecological Risk Assessment April 2005 Rhine Channel Sediment Remediation D‐6 040279‐01

Figure 2 Conceptual Site Model – Wildlife
Rhine Channel Sediment Remediation
Sources
Wat
er
Inve
rt.
Fish
Exposure Route
• Complete and Insignificant
Complete and Significant
Brown Pelican
Surface Water
Sediment
WaterBiota (prey)
Sediment
Complete and Unknown
Significance
Incomplete
Sedi
men
t
Harbor Seal
Pelagic Invertebrates(crustacean)
•
•
•
Planktivorous Fish(Killifish)
Benthic Invertebrate (polychaete)
Ecological Receptors of Concern
•Piscivorous Fish(California Halibut)
Benthivorous Fish (Arrow Goby)
Benthic Invertebrate (crustacean)
Double Crested Cormorant
Benthivorous Fish (Diamond Turbot)
•
•

Problem Formulation
2.4.1 Dietary Exposure Pathway Two dietary pathways were evaluated, a sediment‐based pathway and a water‐based
pathway. In this model, invertebrates determine whether the food chain was based on
sediment or water diet pathways. At the beginning of this food chain were the following
invertebrates:
• A benthic crustacean and a benthic polychaete to represent the sediment diet
pathway
• A pelagic crustacean to represent the water diet pathway
At the second level of the food chain are organisms that prey on the invertebrates
described above. In this model, two fish and one bird preyed on the invertebrates:
• Planktivorous fish (California killifish) feeding throughout the water column,
primarily on pelagic invertebrates
• Benthivorous fish (diamond turbot and arrow goby) feeding on benthic
polychaetes and crustaceans
At the third level of the food chain described in this model are organisms that prey on
the planktivorous and benthivorous fish. This included two piscivorous bird species
feeding exclusively on pelagic fish (brown pelican and cormorant) and one piscivorous
fish species (California halibut). In addition, the model included a marine mammal
(harbor seal) feeding on the two larger flatfish species (turbot and halibut).
2.4.2 Water Exposure Pathway For the fish ROCs, the Trophic Trace model evaluates water exposure to organic
compounds through the Gobas model which incorporates gill uptake and elimination
into the tissue‐burden estimates. For the metals, a BCF approach is used to estimate
tissue burdens. For the wildlife ROCs, the water exposure pathway was not
quantitatively evaluated. Seabirds drink seawater to maintain homeostasis; however,
the dose was assumed to be insignificant compared to dietary pathways. Marine
mammals derive freshwater from prey and metabolic processes. Although the water
pathway is complete for wildlife, it was assumed to be insignificant.
Focused Ecological Risk Assessment April 2005 Rhine Channel Sediment Remediation D‐8 040279‐01

Problem Formulation
2.4.3 Sediment Exposure Pathway The direct sediment pathway was not complete for killifish or piscivorous birds (brown
pelican and double‐crested cormorant) ROCs. The sediment pathway was complete for
three fish (arrow goby, California halibut, and diamond turbot) ROCs because these
species are in direct contact with sediment and feed on sediment‐associated prey.
Sediment ingestion rates or absorption data were not available for fish; therefore, the
significance of this pathway is unknown. For this assessment it was assumed that the
dietary pathway was the primary driver of fish tissue burdens.
The sediment exposure pathway was complete for harbor seal because they feed on
demersal fish such as halibut and diamond turbot. Sediment ingestion rates were not
available for harbor seal and, therefore, the significance of this pathway is unknown. For
this assessment it was assumed that the dietary pathway was the primary driver of risks
to harbor seal.
2.5 Assessment Endpoints and Measures of Exposure and Effects
For all ROCs, the assessment endpoints were survival, growth, and reproduction. Three
approaches to evaluating risk were evaluated for the ROCs: media‐based exposure
comparisons, dietary exposure comparisons, and tissue‐residue comparisons. Toxicity
reference values (TRVs) were selected based on the evaluation approach identified below in
Section 4. Table 2 summarizes the ROCs, assessment endpoints, and measures of exposure
and effects used to estimate risk.
Focused Ecological Risk Assessment April 2005 Rhine Channel Sediment Remediation D‐9 040279‐01

Problem Formulation
Table 2 Summary of Receptors of Concern, Assessment
Endpoints, and Measures of Exposure and Effects
Trophic Guild Species Assessment
Endpoint Measure of Exposure and Effect Fish
Planktivorous fish California killifish Survival, growth, and reproduction
Comparison of modeled tissue data to residue-effects data1
Benthivorous fish Arrow goby Survival, growth, and reproduction
Comparison of modeled tissue data to residue-effects data1
Diamond turbot Survival, growth, and reproduction
Comparison of modeled tissue data to residue-effects data1
Piscivorous fish California halibut Survival, growth, and reproduction
Comparison of modeled tissue data to residue-effects data1
Birds Brown pelican Survival, growth,
and reproduction Comparison of modeled site-specific exposure to TRVs
Piscivorous birds
Double crested cormorant Survival, growth, and reproduction
Comparison of modeled site-specific exposure to TRVs
Mammals Harbor seal Survival, growth,
and reproduction Comparison of modeled site-specific exposure to TRVs
1: Copper was evaluated on a dietary basis.
Focused Ecological Risk Assessment April 2005 Rhine Channel Sediment Remediation D‐10 040279‐01

Exposure Assessment
3 EXPOSURE ASSESSMENT
This section describes the data that were used to parameterize the Trophic Trace model.
The food chain analysis for the COPCs was conducted using the Gobas model feature provided
in Trophic Trace. The following sections correspond to the data entry screens of Trophic Trace.
3.1 Chemicals
The factors describing chemical behavior in the food chain were a water‐to‐tissue parameter,
a sediment‐to‐water parameter, and a sediment‐to‐biota parameter. The parameters
describing organic chemical behavior in the food chain used in this evaluation were Kow,
Koc, and a biota‐sediment accumulation factor (BSAF) The parameters describing metals
behavior in the food chain were used in this evaluation were a BCF, Kd, and trophic transfer
factor (TTF) (Table 3).
The Kow values for PCBs and DDE were obtained from the toxicological profiles on the
Agency for Toxic Substances and Disease Registry (ATSDR) web site
(http://www.atsdr.cdc.gov/toxpro2.html). Koc was calculated from Kow using the Connell
and Hawker equation as cited in the Trophic Trace users manual (VonStakelberg and
Burmistrova 2003). The BSAF values were obtained from the WES BSAF database
(http://www.wes.army.mil/el/bsaf/bsaf.html). The PCB BSAF is the mean of all PCB benthic
field values. The BSAF used for DDE is the value for all pesticide benthic field studies. In the
Trophic Trace (Version 3.04) examples for total PCBs and DDE, a BSAF of 1.7 was used, the
default value used by the Corps (USEPA 1998b) for evaluating the theoretical lipid
bioaccumulation potential of nonpolar organic compounds. Therefore, relative to this value,
using the WES benthic average BSAF values for total PCBs and DDE is likely to result in a
conservative estimate of food chain bioaccumulation.
BCF values for were obtained from several sources. It is important to note that predicting
metals bioconcentration is more uncertain than similar predictions for nonpolar organics.
As noted by McGeer et al. (2003), “bioconcentration and bioaccumulation factors do not
distinguish between essential mineral nutrient, normal background metal bioaccumulation,
the adaptive capabilities of animals to vary uptake and elimination within the spectrum of
exposure regimes, nor the specific ability to sequester, detoxify, and store internalized metal
Focused Ecological Risk Assessment April 2005 Rhine Channel Sediment Remediation D‐11 040279‐01

Exposure Assessment
from metal uptake that results in adverse effect.” The BCF values applied herein were
selected based on their use as recommended conservative screening guidelines.
For copper, the BCF of 1,000 was based on a compilation of bioconcentration relationships
provided by McGeer et al. (2003) and was selected from the regression relationship for non‐
salmonid fish. As noted above, substantial uncertainty exists around the use of BCFs; the
value selected was conservative based on measured copper concentrations in the Rhine
Channel surface water which would have justified a lower BCF.
For mercury, the BCF of 30,000 was selected from USEPA (2004) concentration factors of
metals in the marine environment. Although higher BCFs were reported (USEPA 1999b),
these values were for divalent mercury (120,000) or methyl mercury (1,600,000), and the
elemental mercury BCF value reported in this report is 1. Since neither total nor dissolved
mercury were detected in the Rhine Channel by SCCRWP (2004a) and methylation has been
demonstrated to be low, the use of the divalent or methyl mercury BCFs is not warranted.
Based on site‐specific data using the detection limit of the Rhine Channel surface water
mercury analyses (0.005 μg/L) and the maximum fish tissue mercury value for whole body
samples collected in the inner lower portion of Newport Bay (0.02 mg/kg), the estimated
BCF is approximately 4,000. Therefore, the use of 30,000 as the mercury BCF for the
modeling exercise is likely to be conservative.
For selenium, the BCF of 10,000 was selected from USEPA (2004) concentration factors of
metals in the marine environment. Lower selenium BCFs were reported in another USEPA
(1999b) data compilation. Neither total nor dissolved selenium were detected in the Rhine
Channel by the Southern California Coastal Water Research Project Authority (SCCWRP
2004a). Therefore, the use of the literature selenium BCF of 10,000 for the modeling exercise
was considered appropriate.
The Kd values for copper, mercury, and selenium were obtained from USEPA (1999a)
compilation of partition coefficients for metals. The TTF values for copper, mercury, and
selenium were obtained from USEPA (2000) compilation trophic transfer of metals in
benthic invertebrate prey to finfish values.
Focused Ecological Risk Assessment April 2005 Rhine Channel Sediment Remediation D‐12 040279‐01

Exposure Assessment
Table 3 Summary of Chemical Parameters
Organic COPC Kow Koc BSAF PCBs (Total) 6.301 6.197 2.203
DDE 6.51 6.400 5.025 Metal COPC BCF Log Kd TTF
Copper 1,000 1 3.5 0.21 Mercury 30,000 2,3 4.9 1
Selenium 10,0003 3.6 1 Notes:
1: Based on McGeer et al. (2003), Figure 4H, assumed copper water concentration 1 ppb. 2: USEPA 1999b 3: USEPA 2004 – fish filet BCF of 30,000. USEPA 1999b BCF value was not used (see Section 3.1 for discussion) Kd – Metal Partition Coefficient for sediment/porewater. (Mean value from USEPA 1999b Table 5;) TTF – Trophic Transfer Factor (USEPA 2000). These values are noted to be highly uncertain, although conservative BCF – Bioconcentration Factor (L/kg).
3.2 Environment
The parameters used in the Trophic Trace model to define the environment at Rhine
Channel were surface water temperature, total organic carbon (TOC) in sediment, and the
concentrations of COPCs in sediment and surface water. The freely dissolved surface water
concentrations of organic COPCs were calculated by the model from the sediment and TOC
data using equilibrium partitioning. For the metals, the measured dissolved concentrations
(SCCWRP 2004a) were applied2. Therefore, particulate organic carbon and dissolved
organic carbon in surface water were not needed as input parameters.
Table 4 summarizes the water temperature and TOC values used in the model. The water
temperatures used in the model were the averages reported by National Oceanic and
Atmospheric Administration (NOAA) at Balboa, California, and Newport Beach, California,
respectively (http://www.nodc.noaa.gov/dsdt/cwtg/spac.html). The TOC values used in the
model were the minimum, mean, and 95 percent upper confidence level (95% UCL)of the
2 Dissolved and total metals were measured in water column and sediment‐water interface (SWI) samples taken midpoint in Rhine Channel at Station NB3 by SCWRRP (2004a). These values were used as the basis dissolved metals inputs to the model. Organic water samples were taken in the Newport Bay Turning Basin, not Rhine Channel. For this reason, the model calculation of organic water concentrations using equilibrium partitioning (EqP) were applied. The PCB and DDE water concentrations are included in Table 5 for comparison purposes.
Focused Ecological Risk Assessment April 2005 Rhine Channel Sediment Remediation D‐13 040279‐01

Exposure Assessment
mean concentrations measured in 2002 in the surface sediments in the Rhine Channel
(SCCWRP 2003).
Table 4
Summary of Environmental Parameters
Parameter Value Water Temperature (°C) 16.8, 18.2 TOC in Sediment (%:) 1.0, 1.6, 1.95
Table 5 summarizes the sediment and dissolved water concentrations used in the model.
The sediment concentrations used in the model were the minimum, mean, the 95% UCL of
the mean, and the maximum values measured in 2002 in the Rhine Channel surface
sediments (SCCWRP 2003). The Rhine Channel water column data were available for
metals. The measured concentrations for metals were based on the water column and the
SWI concentration that were measured at the bend of the Rhine Channel at Station NB3
(SCCWRP 2004a). For the modeled metal water concentrations, the SWI value was
multiplied by 2, 4, and 6 respectively to provide a conservative safety factor. These
multiples were input to the Trophic Trace model to apply the fuzzy math feature and were
paired with the increasing sediment values (i.e., the minimum, mean, the 95% UCL of the
mean, and the maximum values). PCB and DDE water column measures were made in
Newport Bay at the Turning Basin. Because of uncertainty associated with the sampling
technique and location outside of the Rhine Channel, the PCB and DDE concentrations
applied in the model were those calculated by the model using equilibrium partitioning
(EqP). The values measured in Turning Basin water samples (SCCWRP 2004a) are included
herein for reference.
Focused Ecological Risk Assessment April 2005 Rhine Channel Sediment Remediation D‐14 040279‐01

Exposure Assessment
Table 5 Summary of Measured and Modeled Chemical Concentrations in Sediment, Porewater, and
Surface Water
Chemical Statistical
Value Sediment (ng/g dw) Calculated (EqP) Porewater (ng/L)
Measured Water Concentrations (ng/L)
Min. 225,000 71,151 5,780 Mean 654,000 206,813 11,560
95% UCL 768,000 242,863 23,120
Copper
Max. 957,000 302,630 34,680 Min. 2,400 30 5
Mean 9,000 113 10 95% UCL 10,600 133 20
Mercury
Max. 14,300 180 30 Min. 1,270 319 10
Mean 2,360 593 20 95% UCL 2,630 661 40
Selenium
Max. 3,120 784 60 Min. 30 0.612 0.336
Mean 54.9 1.37 0.672 95% UCL 63.7 1.58 1.34
DDE
Max. 97.9 3.90 2.02 Min. 51 1.66 0.146
Mean 225.9 8.98 0.292 95% UCL 279.1 11.1 0.584
PCBs (Total)
Max. 401 25.5 0.876 Notes:
The EqP concentration is equivalent to a porewater measurement. The measured concentrations for metals were based on the water column and the sediment-water interface concentration that were measured at the bend of the Rhine Channel at Station NB3 (SCCWRP 2004a). The PCB and DDE concentrations applied in the model were those calculated by EqP; the values measured in Turning Basin water samples (SCCWRP 2004a) are included herein for reference. For the measured water concentrations, the base SWI value was multiplied by 2, 4, and 6, respectively, to provide a conservative safety factor. Highlighted values are those water concentrations used in the model.
3.3 Organisms
This section describes the model parameters for the invertebrate, fish, and wildlife ROCs.
This section follows the data input screens of Trophic Trace.
3.3.1 Invertebrates Invertebrate lipid data were selected from the literature to most closely approximate the
lipid content in the invertebrate prey likely to be found at the site (Table 6). Benthic
infaunal assemblage data for shallow embayment areas of southern California were
Focused Ecological Risk Assessment April 2005 Rhine Channel Sediment Remediation D‐15 040279‐01

Exposure Assessment
obtained from the SCCWRP Web Site (SCCWRP 1997), CDFG (Lane and Hill 1975), and
relevant marine biology references (Kozloff 1993; Ricketts et al. 1985). Amphipods and
polychaetes were the two most abundant infaunal groups in the shallow assemblage
(SCCWRP 1997). Therefore, the two invertebrates modeled for the sediment diet
pathway were a generic benthic polychaete and a generic crustacean. These two species
were selected to represent the prey items of arrow goby and diamond turbot. The
benthic polychaete lipid value used was the grand mean of the category “Polychaete
misc.” as reported in the WES BSAF database. The selected benthic crustacean lipid
value was for the category marine crustacean as reported in the WES database.
For the water diet pathway, a generic pelagic crustacean modeled on copepods was used
to represent the prey items of the pelagic fish (anchovy/grunion). The copepod lipid data
were obtained from the WES database and the value used was the mean of copepod wet
weight whole body lipid values.
Table 6
Summary of Invertebrate Model Parameters
Trophic Guild Lipid % (ww) Lipid Basis Diet Pathway Benthic Polychaete 1.461 WES Polychaete Sediment Benthic Crustacean 2.759 WES Marine Crustacean Sediment Pelagic Crustacean 5.14 WES Copepod Water Note ww wet weight
3.3.2 Fish Fish species were selected based on CDFG habitat assignments and CDFG and U.S. Fish
and Wildlife Service (USFWS) species profiles. Fish lipid data, weights, and site use
factors (SUFs) were selected to approximate the biological and ecological features of the
fish likely to be found at the site. Table 7 summarizes the lipid, weight and SUF. Table 8
summarizes the dietary components of the modeled fish.
3.3.2.1 Planktivorous Fish – California Killifish
California killifish are a common omnivorous fish in shallow soft bottom
environments of the Pacific coast and are a prey item of piscivorous fish and wildlife.
Killifish feed throughout the water column and a large portion of their diet consists
Focused Ecological Risk Assessment April 2005 Rhine Channel Sediment Remediation D‐16 040279‐01
Exposure Assessment
of planktonic species (Lane and Hill 1975). For this reason, killifish was used to
model the water dietary pathway. For the model it was assumed that the generic
planktonic crustacean comprised 100 percent of the diet. The lipid value and weight
used in the model, 1.5 percent and 5 grams, respectively, were based on California
killifish collected from Newport Bay (SCCWRP 2004b). A SUF of 1 was used for the
killifish because these fish exhibit site fidelity (Lane and Hill 1975).
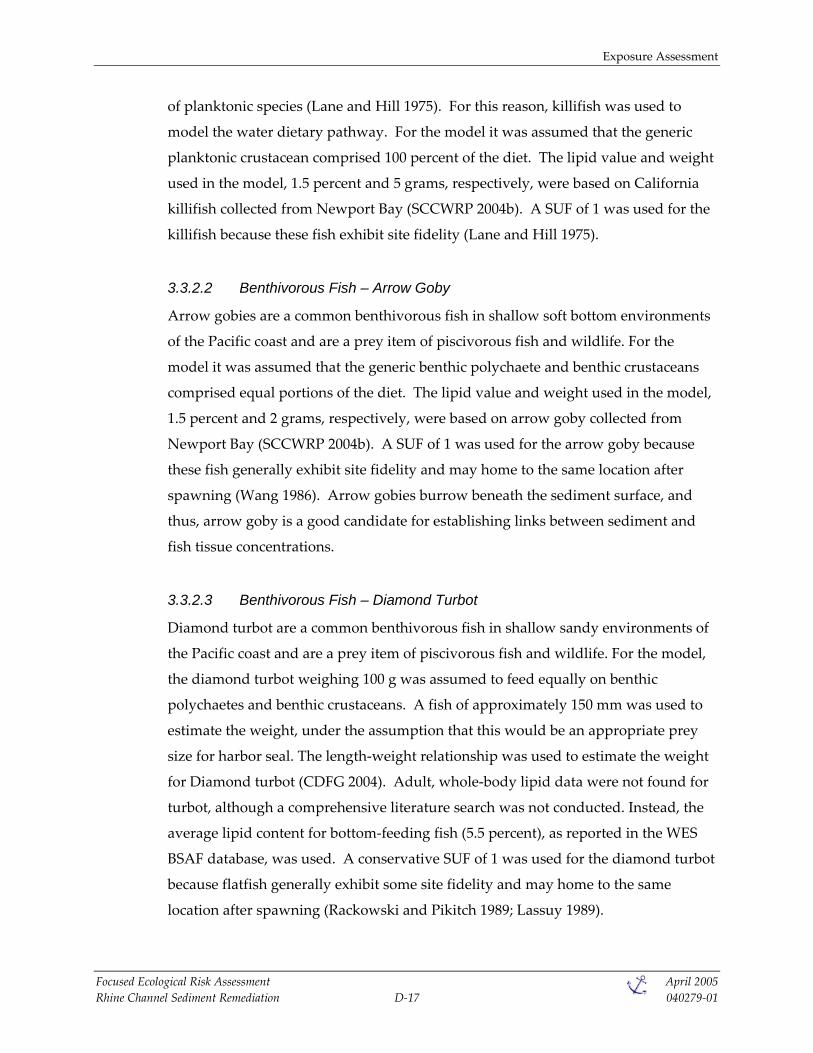
3.3.2.2 Benthivorous Fish – Arrow Goby
Arrow gobies are a common benthivorous fish in shallow soft bottom environments
of the Pacific coast and are a prey item of piscivorous fish and wildlife. For the
model it was assumed that the generic benthic polychaete and benthic crustaceans
comprised equal portions of the diet. The lipid value and weight used in the model,
1.5 percent and 2 grams, respectively, were based on arrow goby collected from
Newport Bay (SCCWRP 2004b). A SUF of 1 was used for the arrow goby because
these fish generally exhibit site fidelity and may home to the same location after
spawning (Wang 1986). Arrow gobies burrow beneath the sediment surface, and
thus, arrow goby is a good candidate for establishing links between sediment and
fish tissue concentrations.
3.3.2.3 Benthivorous Fish – Diamond Turbot
Diamond turbot are a common benthivorous fish in shallow sandy environments of
the Pacific coast and are a prey item of piscivorous fish and wildlife. For the model,
the diamond turbot weighing 100 g was assumed to feed equally on benthic
polychaetes and benthic crustaceans. A fish of approximately 150 mm was used to
estimate the weight, under the assumption that this would be an appropriate prey
size for harbor seal. The length‐weight relationship was used to estimate the weight
for Diamond turbot (CDFG 2004). Adult, whole‐body lipid data were not found for
turbot, although a comprehensive literature search was not conducted. Instead, the
average lipid content for bottom‐feeding fish (5.5 percent), as reported in the WES
BSAF database, was used. A conservative SUF of 1 was used for the diamond turbot
because flatfish generally exhibit some site fidelity and may home to the same
location after spawning (Rackowski and Pikitch 1989; Lassuy 1989).
Focused Ecological Risk Assessment April 2005 Rhine Channel Sediment Remediation D‐17 040279‐01

Exposure Assessment
3.3.2.4 Piscivorous Fish – California Halibut
California halibut are a long‐lived and important game fish found in shallow soft
bottom environments of the Pacific coast. California halibut are piscivorous and are
prey for piscivorous wildlife. For the model, it was assumed that halibut fed equally
on California killifish and arrow goby. The weight of a 230 mm California halibut
that was taken from Newport Bay was 213 g (SCCWRP 2004b). A weight of 200g
was used in the model. Adult, whole‐body lipid data were not found for halibut,
although a comprehensive literature search was not conducted. Instead, the average
lipid content for bottom‐feeding fish (5.5 percent), as reported in the WES BSAF
database, was used. A SUF of 1 was used for halibut under the conservative
assumption that some site fidelity may occur. (Kucas and Hassler 1986)
Table 7
Summary of Fish Model Parameters
Trophic Guild Species Lipid % (ww) Weight (g) Site Use Factor Planktivorous fish California killifish 1.5 5 1 Benthivorous fish Arrow goby 1.5 2 1 Benthivorous fish Diamond turbot 5.5 100 1 Piscivorous fish California halibut 5.5 200 1
Table 8
Summary of Fish Dietary Components
Trophic Guild Species Prey Item Percent of Diet Planktivorous fish California killifish Pelagic crustacean 100% Benthivorous fish Arrow goby Benthic polychaete
Benthic crustacean 50% 50%
Benthivorous fish Diamond turbot Benthic polychaete Benthic crustacean
50% 50%
Piscivorous fish California halibut California Killifish Arrow Goby
50% 50%
3.3.3 Wildlife Four wildlife species were evaluated in this assessment, three birds and one marine
mammal. As noted above, the three bird species were selected because of their
threatened or endangered status. Body weights, ingestion rates, and SUFs are provided
in Table 9. Table 10 summarizes the dietary components of the modeled wildlife.
Focused Ecological Risk Assessment April 2005 Rhine Channel Sediment Remediation D‐18 040279‐01

Exposure Assessment
Exposure data for wildlife were obtained from the California Wildlife Habitat
Relationships System (CDFG 2003b) (http://www.dfg.ca/gov/whdab), CalEcotox (2003)
(http://www.oehha.org/cal_ecotox/), and the Wildlife Exposure Factors Handbook
(USEPA 1993). Where appropriate, wildlife SUFs were calculated based on the area of
Rhine Channel, approximately 7 ha.
3.3.3.1 Brown Pelican
The brown pelican feeds almost entirely on planktonic fish (CDFG 2003b and
CalEcotox 2003). CalEcotox (2003) reported that northern anchovy made up 80
percent of the diet in nestlings. For the model, it was assumed that the killifish, a
planktivore, made up 100 percent of the pelican diet. The body weight of the brown
pelican (3.4 kg) was based on the midrange of adult birds reported by CalEcotox
(2003). The ingestion rate of 760 g/day was calculated using the seabird allometric
equation for food ingestion and adjusted to wet weight assuming 80 percent
moisture content (USEPA 1993). The reported foraging distance for juvenile brown
pelicans was 10 km to 50 km (CalEcotox 2003). The lower bay of Newport Beach is
approximately 300 ha (Corps 2005). Under the assumption that the pelican selected
only prey items from Lower Newport Bay a foraging area was estimated to be
approximately 300 ha. The area of the Rhine Channel is approximately 7 ha.
Therefore, conservatively rounding up the area of influence of the Rhine Channel to
10 ha, an SUF of 0.03 was used for the brown pelican. Because of its large food
requirements and distant breeding grounds in the Channel Islands, this SUF is likely
conservative (CDFG 2003b).
3.3.3.2 Cormorant
The double crested cormorant feeds almost entirely on fish (CDFG 2003b and
CalEcotox 2003). CalEcotox (2003) reported that flat fish, sculpins, and anchovy
made up 80 percent of the diet. For the model, it was assumed that the killifish and
arrow goby made up equal parts of the cormorant diet. The body weight of the
double crested cormorant (1.3 kg) was based on the low range of adult birds
reported by CalEcotox (2003). The ingestion rate of 385 g/day was calculated using
the seabird allometric equation for food ingestion and adjusted to wet weight
assuming 80 percent moisture content (USEPA 1993). The reported foraging distance
Focused Ecological Risk Assessment April 2005 Rhine Channel Sediment Remediation D‐19 040279‐01

Exposure Assessment
for double crested cormorants was 3.5 km to 61.8 km (CalEcotox 2003). To ensure a
conservative evaluation of risk to piscivorous birds, a SUF of 1 was applied to
cormorant.
3.3.3.3 Harbor Seal
Harbor seals feed opportunistically on fish and invertebrates. For the model, it was
assumed that halibut and diamond turbot made up equal parts of the diet. The body
weight of harbor seal was based on an adult average of 82 kg (ADFG 2003). The food
ingestion rate, 13 kg/day wet weight (ww) was calculated based on the mammal
allometric equation for food ingestion and adjusted to wet weight assuming
80 percent moisture content (EPA 1993). Alaska Department of Fish and Game (2003)
reports that harbor seals make “considerable local movements” on the order of over
100 km. A SUF of 0.05, representing a 200 ha of suitable foraging area in lower
Newport Bay was used for harbor seal. Because of its documented movements and
large food requirements on the order of 5 to 6 percent of body weight per day
(CDFG 2003b), it is likely that this SUF is conservative.
Table 9
Summary of Wildlife Model Parameters
Trophic Guild Species Body Weight (kg) Ingestion Rate
(kg/day ww) Site Use Factor
Avifauna Brown pelican 3.4 0.76 0.03 Piscivorous birds
Cormorant 1.3 0.385 1 Mammals Harbor seal 82 13 0.05
Table 10 Summary of Wildlife Dietary Components
Trophic Guild Species Prey Item Percent of Diet
Avifauna Brown pelican Killifish 100
Killifish 50 Piscivorous Birds
Cormorant Arrow goby 50
Mammals Harbor seal Diamond turbot
California halibut 50 50
Focused Ecological Risk Assessment April 2005 Rhine Channel Sediment Remediation D‐20 040279‐01

Effects Assessment
4 EFFECTS ASSESSMENT
This section describes the selection of TRVs for the COPC‐ROC pairs. TRVs were selected to
ensure a conservative determination of risk. Rather than conducting a comprehensive literature
search, existing risk evaluations, including the Trophic Trace examples and major risk
assessments, were the primary sources of data. Where possible, no observable apparent effects
levels (NOAEL) and lowest observable apparent effects levels (LOAEL), obtained from
laboratory studies, were used to provide a better evaluation of TRV uncertainty.
4.1 Fish
A tissue‐based approach was used to evaluate toxicity to fish from exposure to mercury,
PCBs, and DDE. Because copper and selenium are essential mineral nutrients and can be
compartmentalized in specific organs, a dietary approach is generally taken for these metals
and was applied for this model (Chapman et al. 2003). Fish TRVs are presented in Table 11.
The Trophic Trace default TRVs for DDE and PCBs were used in this assessment. For DDE,
Hamelink et al. (1971) reported a LOAEL of 24 mg/kg for green sunfish and pumpkinseed
based on survival. The DDE NOAEL was estimated using an uncertainty factor of 10. For
PCBs, Hansen et al. (1973) reported a LOAEL of 9.3 mg/kg and a NOAEL of 1.9 mg/kg for
sheepshead minnow based on reproductive endpoints.
For mercury, a NOAEL of 0.2 mg/kg and a LOAEL of 0.47 mg/kg, both based on survival of
mummichog, were taken from Matta et al. (2001). The Matta et al. (2001) values were
applied in the Final Lower Duwamish Waterway ecological risk assessment, which was
approved by USEPA Region 10 in 2003 (Windward 2003).
For copper, a dietary NOAEL of 8 mg/kg and a LOAEL of 16 mg/kg, both based on growth
of channel catfish were taken from Murai et al. (1981). The Murai et al. (1981) values were
applied in the Final Lower Duwamish Waterway ecological risk assessment, which was
approved by USEPA Region 10 in 2003 (Windward 2003).
For selenium, a dietary NOAEL of 3.9 mg/kg and a LOAEL of 7.3 mg/kg, both based on
mortality in bluegill were taken from Cleveland et al. (1993). The Cleveland et al. (1993)
Focused Ecological Risk Assessment April 2005 Rhine Channel Sediment Remediation D‐21 040279‐01
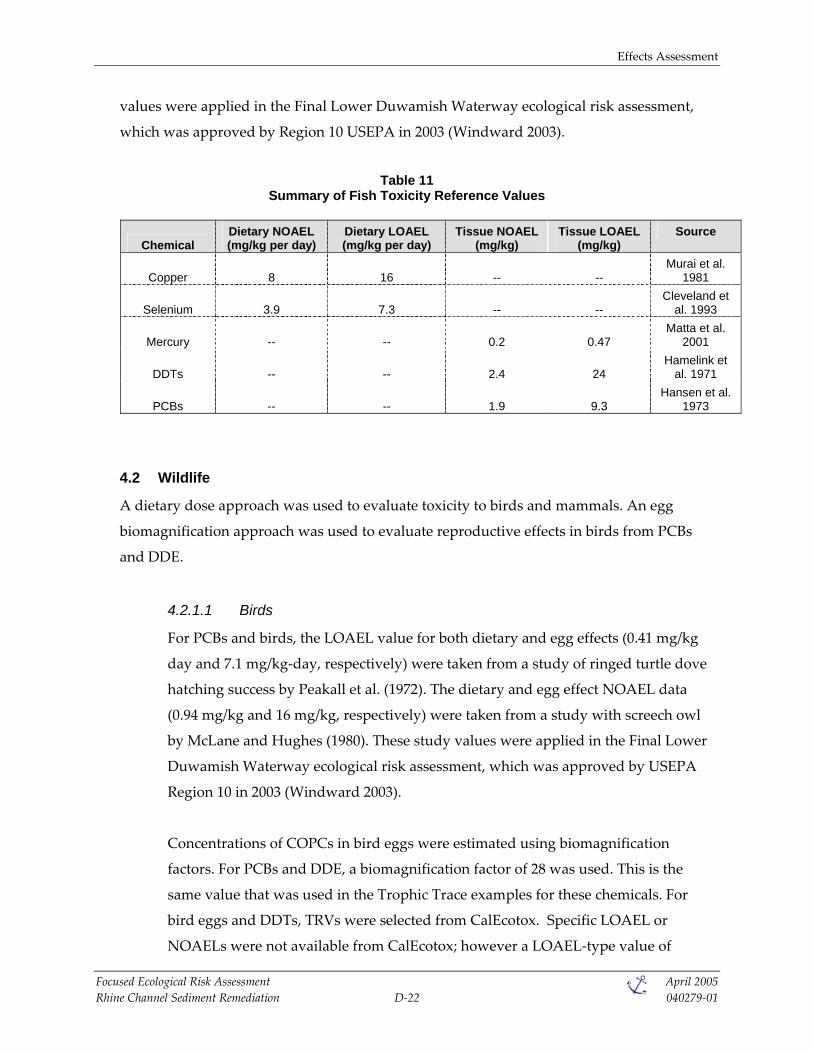
Effects Assessment
values were applied in the Final Lower Duwamish Waterway ecological risk assessment,
which was approved by Region 10 USEPA in 2003 (Windward 2003).
Table 11
Summary of Fish Toxicity Reference Values
Chemical Dietary NOAEL (mg/kg per day)
Dietary LOAEL (mg/kg per day)
Tissue NOAEL (mg/kg)
Tissue LOAEL (mg/kg)
Source
Copper 8 16 -- -- Murai et al.
1981
Selenium 3.9 7.3 -- -- Cleveland et
al. 1993
Mercury -- -- 0.2 0.47 Matta et al.
2001
DDTs -- -- 2.4 24 Hamelink et
al. 1971
PCBs -- -- 1.9 9.3 Hansen et al.
1973
4.2 Wildlife
A dietary dose approach was used to evaluate toxicity to birds and mammals. An egg
biomagnification approach was used to evaluate reproductive effects in birds from PCBs
and DDE.
4.2.1.1 Birds
For PCBs and birds, the LOAEL value for both dietary and egg effects (0.41 mg/kg
day and 7.1 mg/kg‐day, respectively) were taken from a study of ringed turtle dove
hatching success by Peakall et al. (1972). The dietary and egg effect NOAEL data
(0.94 mg/kg and 16 mg/kg, respectively) were taken from a study with screech owl
by McLane and Hughes (1980). These study values were applied in the Final Lower
Duwamish Waterway ecological risk assessment, which was approved by USEPA
Region 10 in 2003 (Windward 2003).
Concentrations of COPCs in bird eggs were estimated using biomagnification
factors. For PCBs and DDE, a biomagnification factor of 28 was used. This is the
same value that was used in the Trophic Trace examples for these chemicals. For
bird eggs and DDTs, TRVs were selected from CalEcotox. Specific LOAEL or
NOAELs were not available from CalEcotox; however a LOAEL‐type value of
Focused Ecological Risk Assessment April 2005 Rhine Channel Sediment Remediation D‐22 040279‐01

Effects Assessment
8 mg/kg was selected that was reported as the critical threshold DDE concentration
in brown pelican eggs associated with 20 percent eggshell thinning. A NOAEL‐type
value was not available from CalEcotox; however, 3 mg/kg was a level where nests
fledged at least one chick. These values were similar to the eggshell thinning data
provided in the Trophic Trace examples for Osprey and Bald Eagle and are similar to
those values used in other risk assessments (RETEC 2002).
For brown pelican, the dietary DDE toxicity value selected was the LOAEL (0.028
mg/kg per day) reported for this species by Sample et al. (1996). A NOAEL (0.0028
mg/kg per day) was estimated using an uncertainty factor of 10.
For cormorant, the DDE NOAEL of 0.084 mg/kg body weight (bw) per day This
value was derived based on American kestrel using a no‐effect dietary concentration
of 0.3 mg/kg ww (Lincer 1975), a body weight of 0.114 kg (CalEcotox 2003), and a
food ingestion rate of 0.032 kg ww/day (calculated from Nagy 1987). A DDE LOAEL
was calculated using an uncertainty factor of 10. The Lincer et al. (1975) values were
applied in the Final Lower Duwamish Waterway ecological risk assessment, which
was approved by USEPA Region 10 in 2003 (Windward 2003).
For mercury, a NOAEL of 0.0091 mg/kg bw day was derived based on egret using a
no‐effect dietary concentration of 0.05 mg/kg ww (Spalding et al. 2000), a body
weight of 1.02 kg (Arizona Game and Fish 2002), and a food ingestion rate of 0.185
kg ww/day (Kushlan 1978). A mercury LOAEL was calculated using an uncertainty
factor of 10. These study values were applied in the Final Lower Duwamish
Waterway ecological risk assessment, which was approved by USEPA Region 10 in
2003 (Windward 2003).
For selenium, a NOAEL of 0.42 mg/kg bw day and LOAEL of 0.82 mg/kg bw day
was taken from Heinz et al. (1989), based on reproduction in mallards. For copper a
NOAEL of 47 mg/kg bw day and LOAEL of 62 mg/kg bw day was taken from
Mehring et al. (1960), based on growth and mortality in chicks. These study values
were taken from compilation of TRVs prepared as part of the Lower Willamette
River ecological risk assessment.
Focused Ecological Risk Assessment April 2005 Rhine Channel Sediment Remediation D‐23 040279‐01

Effects Assessment
Table 12
Summary of Bird Toxicity Reference Values
Chemical Dietary NOAEL (mg/kg per day)
Dietary LOAEL (mg/kg per day)
Egg NOAEL (mg/kg)
Egg LOAEL (mg/kg)
DDE 0.084 0.84 3 8 PCBs 0.41 0.94 7.1 16
Mercury 0.0091 0.091 Copper 47 62
Selenium 0.42 0.82
4.2.1.2 Harbor Seal
Toxicity data were not readily available for the harbor seal. Therefore, the toxicity
data for otter, provided in the Trophic Trace examples, were used. While the
uncertainty in this approach is high, mustelids like otter and mink are among the
most sensitive mammals to PCBs and pesticides, and therefore, the otter toxicity
values are a reasonable surrogate for species‐specific data. The NOAEL and LOAEL
for PCBs were 0.004 and 0.04 mg/kg per day. The NOAEL and LOAEL for DDE were
0.8 and 4 mg/kg‐day.
For copper, a NOAEL of 18 mg/kg bw day and LOAEL of 26 mg/kg bw day was
taken from Aulerich et al. (1982), based on reproduction in mink. For mercury, a
NOAEL of 0.16 mg/kg bw day and LOAEL of 0.25 mg/kg bw day was taken from
Wobeser et al. (1976), based on growth and mortality in mink. For selenium, a
NOAEL of 0.094 mg/kg bw day and LOAEL of 0.12 mg/kg bw day was taken from
Halverson et al. (1966), based on growth in rat. These study values were taken from
compilation of TRVs prepared as part of the Lower Willamette River ecological risk
assessment.
Focused Ecological Risk Assessment April 2005 Rhine Channel Sediment Remediation D‐24 040279‐01
Risk Characterization and Uncertainty Evaluation
5 RISK CHARACTERIZATION AND UNCERTAINTY EVALUATION
Risk to the ROCs from exposure to the COPCs in the Rhine Channel sediments was assessed
using toxicity quotients (TQs). Trophic Trace provided a range of TQs based on the fuzzy math
assessment of uncertainty using the minimum, mean, 95% UCL of the mean, and the maximum
of the sediment and TOC concentrations. This range of values provides a method to assess the
uncertainty in the risk estimates. For the risk characterization, the 95% UCL sediment
concentration was used to provide the maximum reasonable exposure estimate. The 95% UCL
is likely a conservative exposure estimate because the area‐weighted COPC concentrations in
the Rhine Channel sediments are lower. A summary of the modeling results are presented in
Table 13.
For the fish, cormorant, and seal ROCs, LOAELs were used as the benchmark for which to
assess risk. For brown pelican, a threatened or endangered species, NOAELs were used as the
risk benchmark to ensure that individuals would be protected.
Uncertainties in the problem formulation and the exposure and effects measure have the
potential to affect the conclusions of a risk assessment. The selection of COPCs was based on
previous screening results. It is unlikely that the selection of COPCs would result in changes to
the risk conclusions. The receptors evaluated for the risk assessment were selected to represent
species with the greatest likelihood of having a complete pathway to sediment‐associated
COPCs. The TRVs for this assessment were the lowest values for the relevant organisms and
endpoints that were available in the literature. It is unlikely that species not represented have
greater exposure potential or are significantly more sensitive than the species evaluated. Less
conservative, but appropriate and defensible, TRVs could result in predictions of marginal or no
risk. Uncertainties for exposure measures are discussed below for the species evaluated.
5.1 Fish
For the metals, the BCF model approach was applied to estimating dietary‐ or tissue‐based
exposures. It is important to note that for metals, it is assumed that the bioavailable fraction
of sediment associated metals is represented by the calculated, or measured, dissolved
metals concentration in the water. In order to estimate the metal concentration in tissue, the
water concentration is multiplied by the BCF. Relative to the modeling of non polar
organics, the BCF approach is more uncertain. However, the BCF approach used
Focused Ecological Risk Assessment April 2005 Rhine Channel Sediment Remediation D‐25 040279‐01

Risk Characterization and Uncertainty Evaluation
conservative BCF values (USEPA 2004). For this reason, in addition to the model results,
two additional, site‐specific, lines of evidence were considered for evaluating risk to fish
from sediment associated metals. These additional lines of evidence were the measured
surface water and sediment‐water interface concentrations (SCCWRP 2004a) and the
measured fish tissue burdens (SCCWRP 2004b).
For copper, the modeled dietary exposure using the 2X water value (which approximates
the measured dissolved water column concentration at Station NB3), exceeded the dietary
NOAEL value. The modeled dietary exposure using 4X water value exceeded the LOAEL.
While the 4X copper value may be greater than actual copper concentrations in the Rhine
Channel, it is important to note that the measured surface water concentrations exceed the
acute and chronic marine ambient water quality criteria (AWQC). Overall, it appears that
there is a risk to fish in the Rhine Channel from copper. The fact that copper measured at
the sediment‐water interface in the Rhine Channel is ten times higher than that measured at
Station NB10 indicates that the Rhine Channel sediments are a possible source.
For mercury, the BCF approach was coupled with a trophic transfer factor to estimate tissue
burdens in fish for comparison to tissue‐based TRVs. The modeled tissue burden using the
2X water value exceeded the dietary NOAEL value. The modeled dietary exposure using
4X water value exceeded the LOAEL. However, for mercury, the values measured by
SCCWRP (2004a) were below detection limits and the detection limits were substituted into
the exposure model. The mercury detection limits were well below AWQC values.
Mercury tissue concentrations measured in forage fish collected from near the mouth of the
Rhine Channel (SCCWRP 2004b) were also below the tissue‐based TRVs. Overall, there
does not appear to be a significant risk from mercury to fish in the Rhine Channel.
For selenium, none of the modeled dietary exposure levels exceeded the NOAEL. The
measured water column and sediment‐water interface selenium concentrations are well
below the AWQC values. In addition, selenium concentrations measured in forage fish
were below the dietary TRV values. Overall, there does not appear to be a significant risk
from selenium to fish in the Rhine Channel.
Focused Ecological Risk Assessment April 2005 Rhine Channel Sediment Remediation D‐26 040279‐01

Risk Characterization and Uncertainty Evaluation
For DDE, none of the modeled tissue burden exposure levels exceeded the NOAEL.
Overall, there does not appear to be a significant risk from DDE to fish in the Rhine
Channel.
For PCBs, the modeled tissue burden exposure levels based on the maximum PCB
concentrations exceeded the NOAEL for killifish, turbot, and halibut. Overall, there does
not appear to be a significant risk from PCBs to fish in the Rhine Channel.
5.2 Wildlife
For harbor seal, the NOAEL for PCBs was exceeded for the tissue burdens, based on the
mean sediment concentration. Because all of the LOAEL TQs were less than 1, it is unlikely
that the Rhine Channel sediments pose a risk to harbor seals. Although there is some
uncertainty in the TRV that was used because it was based on mustelid (otter) toxicity,
mustelids are among the most sensitive species to PCBs. No other chemicals had TQs
greater than 1 for harbor seal. The SUF for harbor seal was 0.05, although foraging areas are
likely greater than 500 ha. This source of uncertainty is acceptable to ensure that risk
estimates are conservative. Overall, there does not appear to be a significant risk to seal in
the Rhine Channel from any of the bioacumulative COPCs assessed herein.
For adult cormorant, the NOAEL TQs was exceeded for the 95% UCL DDE concentration;
all DDE LOAEL TQs were less than 1. For cormorant eggs, the minimum DDE
concentrations resulted in a NOAEL TQ greater than 1 and the 95% UCL DDE and
concentration had a LOAEL TQs greater than 1. For PCBs and adult cormorant, the NOAEL
TQs was only exceeded for the maximum PCB concentrations; all LOAEL TQs were less
than 1. For cormorant eggs, the mean PCB concentrations resulted in a NOAEL TQ and
LOAEL TQs greater than 1. Because the LOAEL TQs for the 95% UCL for PCBs and DDE
were greater than 1 for cormorant eggs, risk to cormorant reproduction is possible due to
bioaccumulation of these compounds from the sediment to fish tissue.
For cormorant and metals, the BCF approach was coupled with a trophic transfer factor to
estimate tissue burdens in fish for comparison to the dietary‐based TRVs for birds. For
mercury, the modeled tissue burden using the 1X measured water value exceeded the
dietary NOAEL value. The modeled dietary exposure using 4X water value exceeded the
Focused Ecological Risk Assessment April 2005 Rhine Channel Sediment Remediation D‐27 040279‐01

Risk Characterization and Uncertainty Evaluation
LOAEL. However, for mercury, the surface water values measured by SCCWRP (2004a)
were below detection limits and the detection limits were substituted into the exposure
model. Also, the mercury detection limits were well below AWQC values. Mercury tissue
concentrations measured in forage fish collected from near the mouth of the Rhine Channel
(SCCWRP 2004b) were also below the dietary‐based bird LOAEL (Hazard Quotient [HQ] =
0.08)3. Overall, there does not appear to be a significant risk to cormorant from
bioaccumulation of mercury from the sediment to fish tissue. Neither copper nor selenium
TRVs were exceeded for cormorant.
As noted above, brown pelican is a threatened or endangered species and therefore
NOAELs were used as the risk benchmark to ensure that individuals would be protected.
For adult brown pelican, the NOAEL TQs was exceeded for the maximum DDE
concentrations; all DDE LOAEL TQs were less than 1. For brown pelican eggs, the mean
DDE concentrations resulted in a NOAEL TQ greater than 1 and the maximum DDE and
concentration had a LOAEL TQs greater than 1. Because the NOAEL TQs for the 95% UCL
for DDE were greater than 1 for pelican eggs, risk to brown pelican reproduction is possible
from exposure to DDE associated with the Rhine Channel sediments. There is uncertainty
associated with the DDE TRV selected for assessing adult brown pelican due to the fact that
the value was derived from uncontrolled field studies and that contaminants in addition to
DDE may have been present in prey items.
For PCBs and adult pelican, all NOAEL TQs were less than 1. For brown pelican eggs, the
mean PCB concentrations resulted in a NOAEL TQ and LOAEL TQs greater than 1. Because
the NOAEL TQs for the 95% UCL for PCBs were greater than 1 for pelican eggs, risk to
brown pelican reproduction is possible from exposure to the Rhine Channel sediments.
None of the metals TRVs were exceeded for brown pelican. The SUF for brown pelican was
0.03, based on a conservative estimated foraging area of 300 ha. Although brown pelican
rookeries are on the Channel Islands, and foraging areas are likely greater than 300 ha, this
source of uncertainty is acceptable to ensure that risk estimates are conservative. Overall, it
3 Based on the maximum forage fish mercury concentration, 0.026 mg/kg (SCCWRP 2004b), the estimated dose to cormorant is 0.008 mg/kg bw day. Based on the 95% UCL concentration of all mercury fish tissue samples, 0.060 mg/kg (SCCWRP 2004b), the estimated dose to cormorant is 0.02 mg/kg bw day. A fish tissue mercury concentration of approximately 0.31 mg/kg would be required to exceed the mercury LOAEL for birds.
Focused Ecological Risk Assessment April 2005 Rhine Channel Sediment Remediation D‐28 040279‐01

Risk Characterization and Uncertainty Evaluation
appears that DDE and PCBs in the Rhine Channel sediment may contribute incremental risk
to the reproduction of brown pelican due to bioaccumulation of these compounds from the
sediment to fish tissue.
5.3 Risk Summary and Conclusions
This risk assessment evaluated the potential for adverse effects to fish, birds, and marine
mammals from the Rhine Channel sediments under existing conditions. In the risk
characterization, exposure and effects data were compared for the seven ROCs and five
COPCs. The exposure of the ROCs to sediment‐associated COPCs was evaluated for direct
contact or ingestion of sediments and surface water as well as food chain transfer of
contaminants from sediment and/or water invertebrates forage species piscivorous
species, as generally framed by the Trophic Trace model. Bioaccumulation modeling of the
COPCs was used to evaluate whether food chain accumulation would result in tissue
burdens or dietary doses greater than selected TRVs. Table 13 summarizes the results that
were obtained based on reasonable and conservative exposure estimates.
For all fish species, dietary exposure to copper indicated potential adverse effects to
survival, growth, or reproduction. In addition, it is important to note that copper measured
in the Rhine Channel surface water samples exceeded AWQC acute and chronic values.
Based on a weight of evidence approach that included comparison of the modeling results
to measured surface water and tissue burdens of mercury and selenium, there does not
appear to be a significant risk to fish in the Rhine Channel from these metals.
For cormorant and pelican adults, no risk was indicated from any of the COPCs. However
for pelican and cormorant eggs, the TRVs were exceeded for PCBs and DDE, indicating
potential risk to the reproduction of these birds. However, it is important to note that the
evaluation was conservative and that there is substantial uncertainty around the bird
exposure and effects estimates data that were applied. Overall, DDE and PCBs in the Rhine
Channel sediment may contribute incremental risk to the reproduction of cormorant and
brown pelican due to bioaccumulation of these compounds from the sediment to fish tissue.
Focused Ecological Risk Assessment April 2005 Rhine Channel Sediment Remediation D‐29 040279‐01
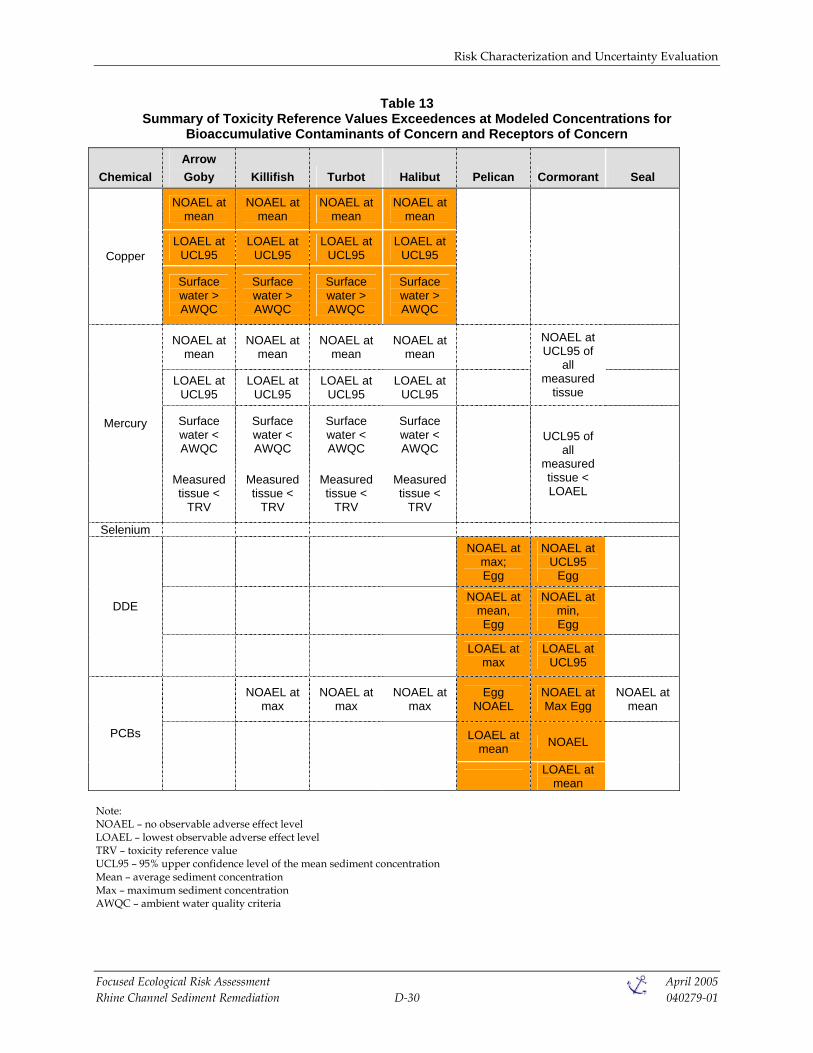
Risk Characterization and Uncertainty Evaluation
Table 13 Summary of Toxicity Reference Values Exceedences at Modeled Concentrations for
Bioaccumulative Contaminants of Concern and Receptors of Concern
Chemical Arrow Goby Killifish Turbot Halibut Pelican Cormorant Seal
NOAEL at mean
NOAEL at mean
NOAEL at mean
NOAEL at mean
LOAEL at UCL95
LOAEL at UCL95
LOAEL at UCL95
LOAEL at UCL95
Copper
Surface water > AWQC
Surface water > AWQC
Surface water > AWQC
Surface water > AWQC
NOAEL at mean
NOAEL at mean
NOAEL at mean
NOAEL at mean
LOAEL at UCL95
LOAEL at UCL95
LOAEL at UCL95
LOAEL at UCL95
NOAEL at UCL95 of
all measured
tissue
Surface water < AWQC
Surface water < AWQC
Surface water < AWQC
Surface water < AWQC
Mercury
Measured tissue <
TRV
Measured tissue <
TRV
Measured tissue <
TRV
Measured tissue <
TRV
UCL95 of all
measured tissue < LOAEL
Selenium
NOAEL at
max; Egg
NOAEL at UCL95
Egg
NOAEL at
mean, Egg
NOAEL at min, Egg
DDE
LOAEL at max
LOAEL at UCL95
NOAEL at max
NOAEL at max
NOAEL at max
Egg NOAEL
NOAEL at Max Egg
NOAEL at mean
LOAEL at mean NOAEL
PCBs
LOAEL at mean
Note: NOAEL – no observable adverse effect level LOAEL – lowest observable adverse effect level TRV – toxicity reference value UCL95 – 95% upper confidence level of the mean sediment concentration Mean – average sediment concentration Max – maximum sediment concentration AWQC – ambient water quality criteria
Focused Ecological Risk Assessment April 2005 Rhine Channel Sediment Remediation D‐30 040279‐01

References
6 REFERENCES
Alaska Department of Fish and Game (ADF). 2003. Wildlife Notebook Series – Harbor Seal.
(www.state.ak.us/adfg/notebook/marine/harseal.htm)
Anchor Environmental, L.L.C. (Anchor). 2005. Draft Feasibility Study and Alternatives
Evaluation, Rhine Channel Sediment Remediation, Newport Bay, California.
Arizona Game & Fish. 2002. Great egret (Casmerodius albus). Arizona Game & Fish
Department, Phoenix, AZ. (http://www.gf.state.az.us/frames/fishwild/ngame_f.htm.)
Audubon. 2004. Sea and Sage Coastal Christmas Bird Count December 28, 2003. Sea & Sage
Audubon Society, an Orange County Chapter of the National Audubon Society.
(http://exo.com/~kenyon/CoastalCBC.pdf)
Aulerich R.J., Ringer R.K., Bleavins M.R., Napolitano A. 1982. Effects of supplemental dietary
copper on growth, reproductive performance and kit survival of standard dark mink
and the acute toxicity of copper to mink. J Anim Sci 55(2):337‐343.
CalEcotox (2003) California Wildlife Biology, Exposure Factor, and Toxicity Database.
(http://www.oehha.org/cal_ecotox/)
CDFG. 2002. Biological Characteristics of Nearshore Fishes of California, Life History Database,
Version 1.0. California Department of Fish and Game. October 25.
CDFG. 2003a. California Marine Sportfish Identification Web Page. California Department of
Fish and Game. (http://www.dfg.ca.gov/mrd/msfhabs1.html)
CDFG. 2003b. California Wildlife Habitat Relationships System (CWHRS). California
Department of Fish and Game. (http://www.dfg.ca.gov/whdab)
Chapman, P.M., et al. 2003. Conducting Ecological Risk Assessments of Inorganic Metals and
Metalloids: Current Status. Human and Ecological Risk Assessment 9(4): 641‐697.
Focused Ecological Risk Assessment April 2005 Rhine Channel Sediment Remediation D‐31 040279‐01
References
Cleveland L, Little EE, Buckler DR, Wiedmeyer RH. 1993. Toxicity and bioaccumulation of
waterborne and dietary selenium in juvenile bluegill (Lepomis macrochirus). Aquat
Toxicol 27:265‐280.
Coastkeeper. 2005. Orange County Coastkeeper web page regarding the Rhine Channel project
(http://www.coastkeeper.org/projects.html)
Hamelink J.L., Waybrant R.C., Ball R.C. 1971. A proposal: exchange equilibria control the
degree chlorinated hydrocarbons are biologically magnified in lentic environments.
Trans Am Fish Soc 100(2):207‐213.
Halverson A.W., Palmer I.S., Guss P.L. 1966. Toxicity of selenium to post‐weanling rats. Toxicol
Appl Pharmacol 9:477‐484.
Hansen D.J., Schimmel S.C., Forester J. 1973. Aroclor 1254 in eggs of sheepshead minnows:
effect on fertilization success and survival of embryos and fry. In: Proceedings of 27th
Annual Conference, Southeastern Association of Game and Fish Commissioners, Hot
Springs, AR, October 14 17, 1973. pp 420‐426.
Heinz G.H., Hoffman D.J., Gold L.G. 1989. Impaired reproduction of mallards fed an organic
form of selenium. J Wildl Manage 53(2):418‐428.
Kozloff, E.N. 1993. Seashore life of the Northern Pacific Coast. University of Washington Press.
Seattle, Washington.
Kucas, S.T. Jr. and T.H. Hassler. 1986. Species Profiles: Life History and Environmental
Requirements of Coastal Fishes and Invertebrates (Pacific Southwest) – California
Halibut. U.S. Fish and Wildlife Service Biological Report 82(11.44).
Kushlan J.A. 1978. Feeding ecology of wading birds. In: Sprunt A, Ogden JC, Winckler S, eds,
Wading birds. National Audubon Society, New York, NY, pp 249‐297.
Focused Ecological Risk Assessment April 2005 Rhine Channel Sediment Remediation D‐32 040279‐01
References
Lane, D.E. and C.W. Hill (eds.). 1975. The Marine Resources of Anaheim Bay. California
Department of Fish and Game. Fish Bulletin 165.
Lassuy, D.R. 1989. Species Profiles: Life History and Environmental Requirements of Coastal
Fishes and Invertebrates (Pacific Northwest) – English sole. U.S. Fish and Wildlife
Service Biological Report 82(11.101).
Lincer J.L. 1975. DDE‐induced eggshell‐thinning in the American kestrel: a comparison of the
field situation and laboratory results. J Appl Ecol 12(3):781‐793.
Matta M.B., Linse J., Cairncross C., Francendese L., Kocan R.M. 2001. Reproductive and
transgenerational effects of methylmercury or Aroclor 1268 on Fundulus heteroclitus.
Environ Toxicol Chem 20(2):327‐335.
McGeer, J.C. et al. 2003. Inverse Relationship between Bioconcentration Factor and Exposure
Concentration for Metals: Implication for Hazard Assessment of Metals in the Aquatic
Environment. Environmental Toxicology and Chemistry 22(5): 1017‐1037.
McLane MAR, Hughes D.L. 1980. Reproductive success of screech owls fed Aroclor 1248. Arch
Environ Contam Toxicol 9:661–665.
Mehring A.L., Brumbaugh J.H., Sutherland A.J., Titus H.W. 1960. The tolerance of growing
chickens for dietary copper. Poult Sci 39:713‐719.
Murai T., Andrews J.W., Smith Jr RG. 1981. Effects of dietary copper on channel catfish.
Aquaculture 22:353‐357.
Nagy K.A. 1987. Field metabolic rate and food requirement scaling in mammals and birds. Ecol
Monogr 57: 111‐128
Orange County. 2005. Newport Bay Watershed reports and studies web page.
(http://www.ocwatersheds.com/watersheds/newportbay_reports_studies.asp)
Focused Ecological Risk Assessment April 2005 Rhine Channel Sediment Remediation D‐33 040279‐01

References
Peakall D.B., Lincer J.L., Bloom S.E. 1972. Embryonic mortality and chromosomal alterations
caused by Aroclor 1254 in ring doves. Environ Health Perspect 1:103‐104.
Rackowski J.P. and E.K. Pikitch. 1989. Species Profiles: Life History and Environmental
Requirements of Coastal Fishes and Invertebrates (Pacific Southwest) –Pacific and
Speckled sanddabs. U.S. Fish and Wildlife Service Biological Report 82(11.107).
RETEC Group. 2002. Final baseline Human Health and Ecological Risk Assessment – Lower Fox
River and Green Bay Wisconsin, Remedial Investigation and Feasibility Study.
Ricketts E.F., J. Calvin, and J.W. Hedgpeth, revised by DW Phillips. 1985. Between Pacific Tides,
Fifth Edition. Stanford University Press, Stanford, California.
Sample B.E., Opresko D.M., Suter G.W. 1996. Toxicological benchmarks for wildlife. 1996
revision. ES/ERM‐86/R3. Office of Environmental Management, US Department of
Energy, Washington, DC.
SCCWRP. 1997. Relationship Between Depth, Latitude, and Sediment and the Structure of
Benthic Infaunal Assemblages on the Mainland Shelf of Southern California. Southern
California Coastal Water Research Project Authority (SCCWRP) web site.
(http://www.sccwrp.org/pubs/annrpt/97/ar12.htm)
SCCWRP. 2003. Chemistry and Toxicity in Rhine Channel Sediments. Southern California
Coastal Water Research Project Authority. Technical Report 391. May 2003.
SCCWRP. 2004a. Newport Bay Sediment Toxicity Studies. Southern California Coastal Water
Research Project Authority. Technical Report 443. June 2004.
SCCWRP. 2004b. Bioaccumulation of Contaminants in Recreational and Forage Fish in Newport
Bay, California in 2000‐2002. Southern California Coastal Water Research Project
Authority. Technical Report 446. June 2004.
Focused Ecological Risk Assessment April 2005 Rhine Channel Sediment Remediation D‐34 040279‐01

References
Spalding M.G., Frederick P.C., McGill H.C., Bouton S.N., McDowell L.R. 2000. Methylmercury
accumulation in tissues and its effects on growth and appetite in captive great egrets. J
Wildl Diseas 36(3):411‐422.
Smith, R.I. and J.T. Carlton, Eds. 1975. Light’s Manual: Intertidal Invertebrates of the Central
California Coast, Third Edition. University of California Press, Berkeley, California.
U.S. Army Corps of Engineers (Corps). 2003a. Trophic Trace Version 3.02. Waterways
Experiment Station, Vicksburg, Mississippi. (www.wes.army.mil/el/trophictrace)
U.S. Army Corps of Engineers (Corps). 2003b. Dredged Material Evaluation and Disposal
Procedures, A Users Manual for the Puget Sound Dredged Disposal Analysis (PSDDA)
Program. February 2000 (updated with 2003 COC Table)
U.S. Army Corps of Engineers (Corps). 2005. Los Angeles District web page, Upper Newport
Bay Harbor Project http://www.spl.usace.army.mil/newportbay/uppernewportbay.htm).
United States Environmental Protection Agency (USEPA). 1993. Wildlife Exposure Factors
Handbook. U.S. Environmental Protection Agency. EPA/60/R‐93/187.
USEPA. 1998a. Guidelines for Ecological Risk Assessment – Final. U.S. Environmental
Protection Agency. EPA/630/R‐95/002F.
USEPA. 1998b. Evaluation of Dredged Material Proposed for Discarge in the Waters of the U.S.
– Testing Manual, Inland Testing Manual. U.S. Environmental Protection Agency. EPA‐
823B‐98‐004.
USEPA. 1999a. Partition Coefficients for Metals in Surface Water, Soil, and Waste, Draft. U.S.
Environmental Protection Agency, Office of Solid Waste. June 22.
USEPA. 1999b. Data Collection for the Hazardous Waste Identification Rule: Section 11.0.
Aquatic Food Web Data. U.S. Environmental Protection Agency. October.
Focused Ecological Risk Assessment April 2005 Rhine Channel Sediment Remediation D‐35 040279‐01

References
USEPA. 2000. Proposed changes to the bioaccumulation testing evaluation framework and
response to scientific peer reviewers comments on the existing framework for
determining the suitability of dredged material to be placed at the Historic Area
Remediation Site (HARS); Appendix E: Potential for Trophic Transfer of Metals in
Benthic Invertebrate Prey to Finfish.” U.S. Environmental Protection Agency, Region 2.
October. http://www.epa.gov/region02/water/dredge/testing.htm
USEPA. 2004. Issue Paper on the Bioavailability and Bioaccumulation of Metals. U.S.
Environmental Protection Agency. August 19.
Von Stackelberg, K. and A. Burmistrova. 2003. Trophic Trice Users Manual: A tool for Assessing
Risks from Trophic Transfer of Sediment‐Associated Contaimnants. June 24, 2003.
(www.wes.army.mil/el/trophictrace)
Wang, J.C.S. 1986. Fishes of the Sacramento‐San Joaquin Estuary and Adjacent Waters,
California: A Guide to the Early Life Histories. Berkeley Digital Library Project.
Technical Report 9 (FS/B10‐4ATR 86‐9). January 1986.
http://elib.cs.berkeley.edu/kopec/tr9/html/home.html
Windward Environmental L.L.C. 2003. Lower Duwamish Waterway Remedial Investigation,
Appendix A. Phase 1 Ecological Risk Assessment, Final. Prepared for U.S.
Environmental Protection Agency, Region 10 and Washington State Department of
Ecology Northwest Regional Office. July 3.
Focused Ecological Risk Assessment April 2005 Rhine Channel Sediment Remediation D‐36 040279‐01