coho relative value equity versus benchmark and peersfunddocumentation.candoris.nl/coho/coho us...
TRANSCRIPT
FOR INVESTMENT PROFESSIONAL USE ONLY
Coho Relative Value Equity versus Benchmark and PeersPerformance data as of 31/03/2020, gross of fees

FOR INVESTMENT PROFESSIONAL USE ONLY 2
18-year Coho versus benchmarksCoho Relative Value Equity v. Benchmark
Substantially better returns
Source: eVestmentData quoted is past gross of fee performance and current performance may be lower or higher. Past performance is no guarantee of future results. Investment return and principal value of an investment will fluctuate.
FOR INVESTMENT PROFESSIONAL USE ONLY 3
Coho’s Repeatable Pattern of ReturnsParticipate in mature bull markets, benefit from low downside capture
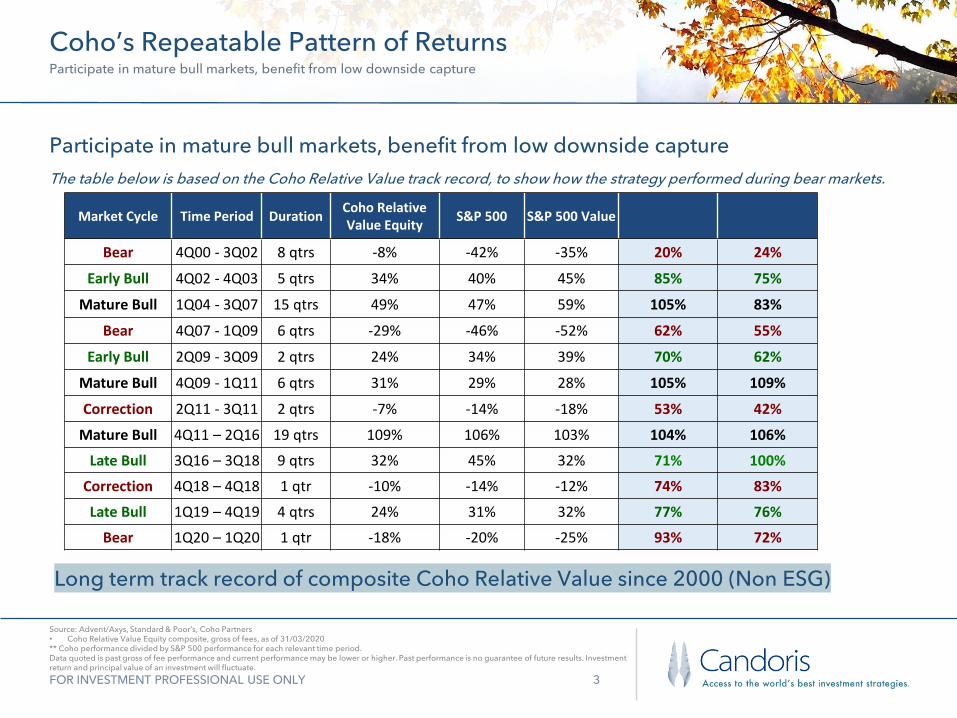
Participate in mature bull markets, benefit from low downside captureThe table below is based on the Coho Relative Value track record, to show how the strategy performed during bear markets.
Source: Advent/Axys, Standard & Poor’s, Coho Partners• Coho Relative Value Equity composite, gross of fees, as of 31/03/2020** Coho performance divided by S&P 500 performance for each relevant time period.Data quoted is past gross of fee performance and current performance may be lower or higher. Past performance is no guarantee of future results. Investment return and principal value of an investment will fluctuate.
Long term track record of composite Coho Relative Value since 2000 (Non ESG)
Market Cycle Time Period Duration Coho Relative Value Equity
S&P 500 S&P 500 Value
Bear 4Q00 - 3Q02 8 qtrs -8% -42% -35% 20% 24%
Early Bull 4Q02 - 4Q03 5 qtrs 34% 40% 45% 85% 75%
Mature Bull 1Q04 - 3Q07 15 qtrs 49% 47% 59% 105% 83%
Bear 4Q07 - 1Q09 6 qtrs -29% -46% -52% 62% 55%
Early Bull 2Q09 - 3Q09 2 qtrs 24% 34% 39% 70% 62%
Mature Bull 4Q09 - 1Q11 6 qtrs 31% 29% 28% 105% 109%
Correction 2Q11 - 3Q11 2 qtrs -7% -14% -18% 53% 42%
Mature Bull 4Q11 – 2Q16 19 qtrs 109% 106% 103% 104% 106%
Late Bull 3Q16 – 3Q18 9 qtrs 32% 45% 32% 71% 100%
Correction 4Q18 – 4Q18 1 qtr -10% -14% -12% 74% 83%
Late Bull 1Q19 – 4Q19 4 qtrs 24% 31% 32% 77% 76%
Bear 1Q20 – 1Q20 1 qtr -18% -20% -25% 93% 72%
FOR INVESTMENT PROFESSIONAL USE ONLY 4
Calendar Year ReturnsCoho Relative Value Equity v. Benchmark and Peers
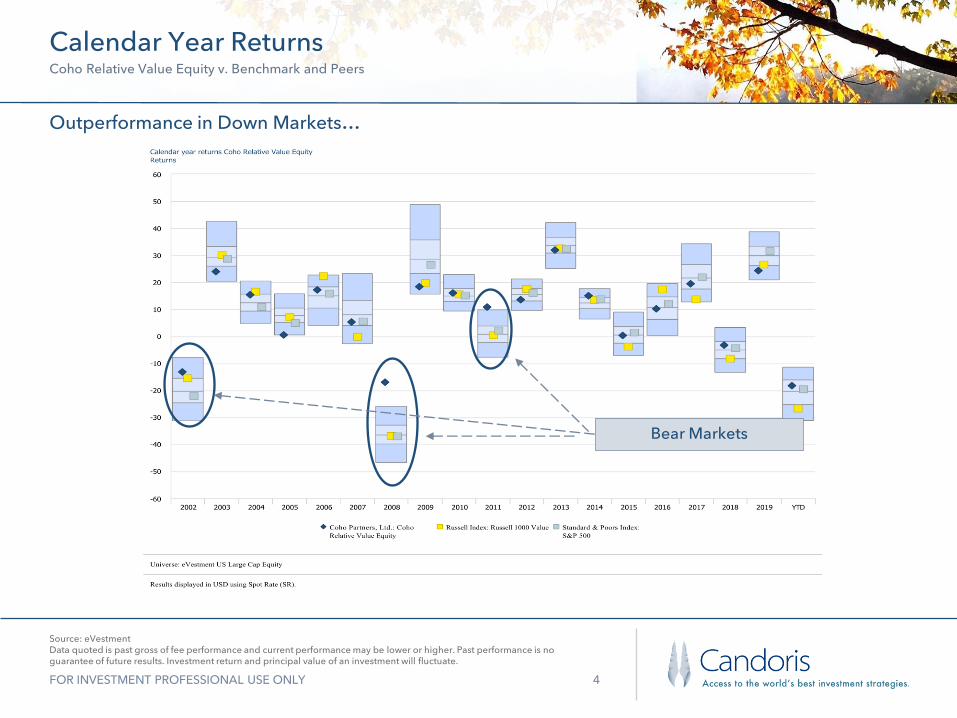
Outperformance in Down Markets…
Source: eVestmentData quoted is past gross of fee performance and current performance may be lower or higher. Past performance is no guarantee of future results. Investment return and principal value of an investment will fluctuate.
Bear Markets
FOR INVESTMENT PROFESSIONAL USE ONLY 5
Calendar Year PerformanceCoho Relative Value Equity v. Benchmark and Peers
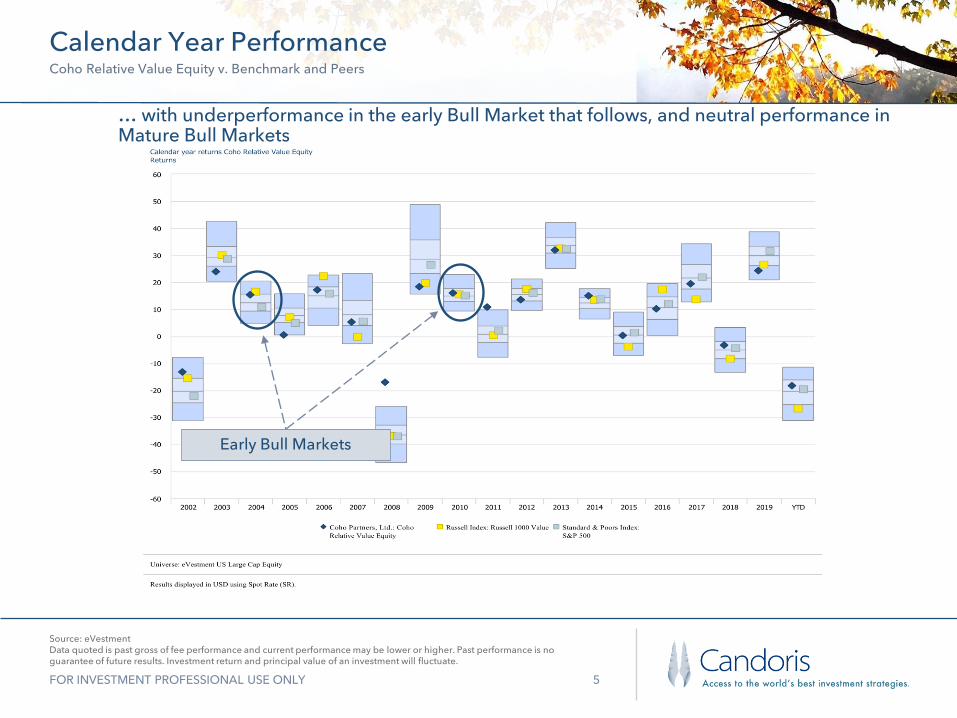
… with underperformance in the early Bull Market that follows, and neutral performance in Mature Bull Markets
Source: eVestmentData quoted is past gross of fee performance and current performance may be lower or higher. Past performance is no guarantee of future results. Investment return and principal value of an investment will fluctuate.
Early Bull Markets
FOR INVESTMENT PROFESSIONAL USE ONLY 6
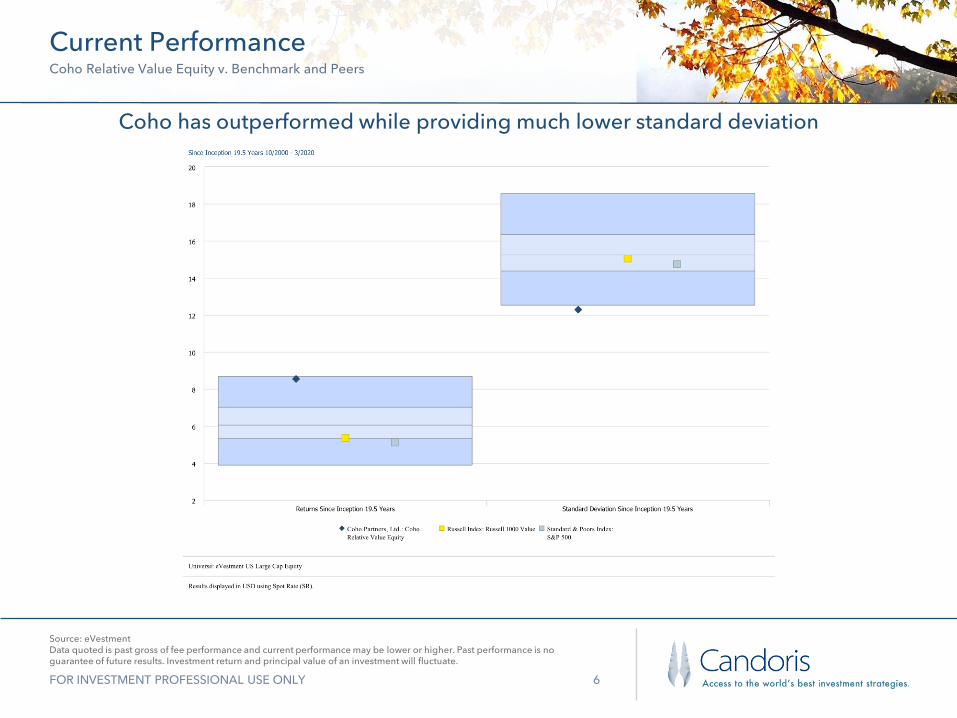
Current PerformanceCoho Relative Value Equity v. Benchmark and Peers
Coho has outperformed while providing much lower standard deviation
Source: eVestmentData quoted is past gross of fee performance and current performance may be lower or higher. Past performance is no guarantee of future results. Investment return and principal value of an investment will fluctuate.
FOR INVESTMENT PROFESSIONAL USE ONLY 7
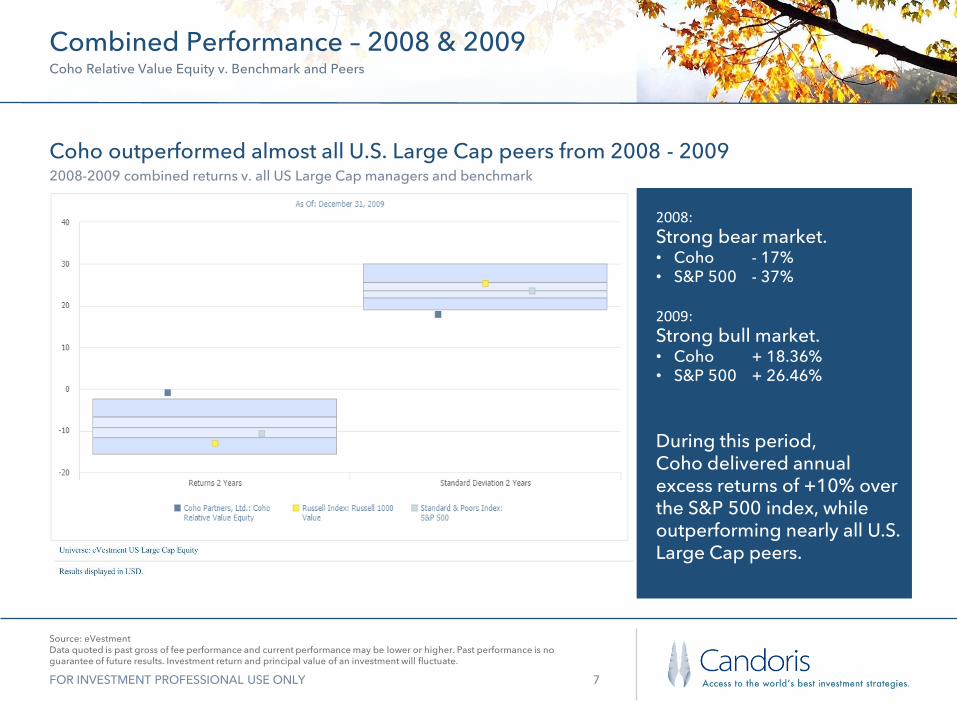
Combined Performance – 2008 & 2009Coho Relative Value Equity v. Benchmark and Peers
Coho outperformed almost all U.S. Large Cap peers from 2008 - 20092008-2009 combined returns v. all US Large Cap managers and benchmark
Source: eVestmentData quoted is past gross of fee performance and current performance may be lower or higher. Past performance is no guarantee of future results. Investment return and principal value of an investment will fluctuate.
2008:
Strong bear market.• Coho - 17% • S&P 500 - 37%
2009:
Strong bull market.• Coho + 18.36%• S&P 500 + 26.46%
During this period, Coho delivered annual excess returns of +10% over the S&P 500 index, while outperforming nearly all U.S. Large Cap peers.
FOR INVESTMENT PROFESSIONAL USE ONLY 8
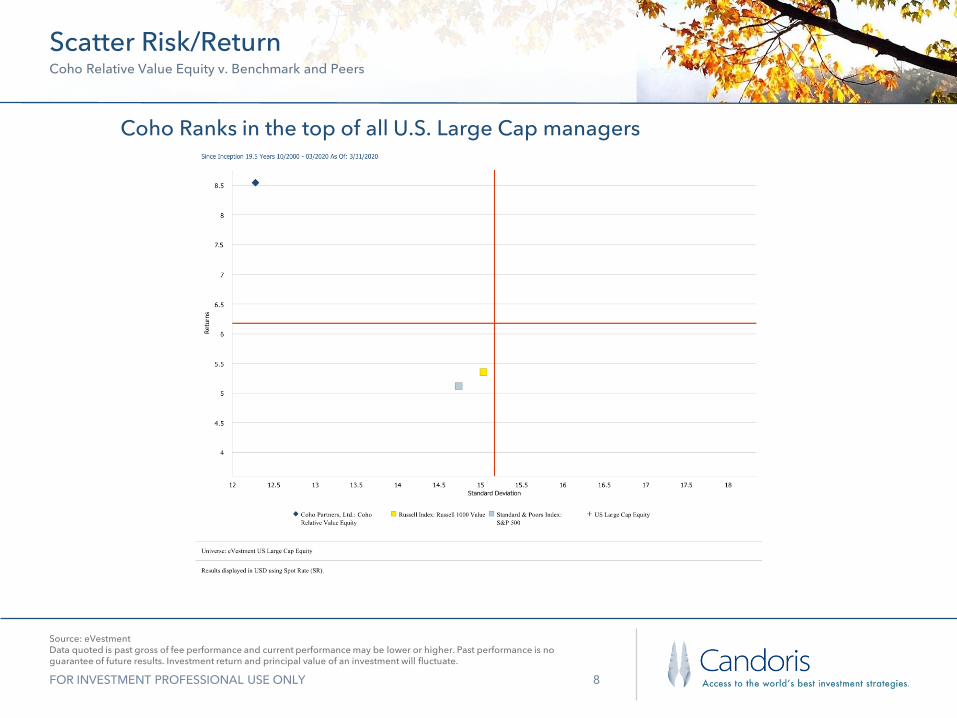
Scatter Risk/ReturnCoho Relative Value Equity v. Benchmark and Peers
Coho Ranks in the top of all U.S. Large Cap managers
Source: eVestmentData quoted is past gross of fee performance and current performance may be lower or higher. Past performance is no guarantee of future results. Investment return and principal value of an investment will fluctuate.
FOR INVESTMENT PROFESSIONAL USE ONLY 9
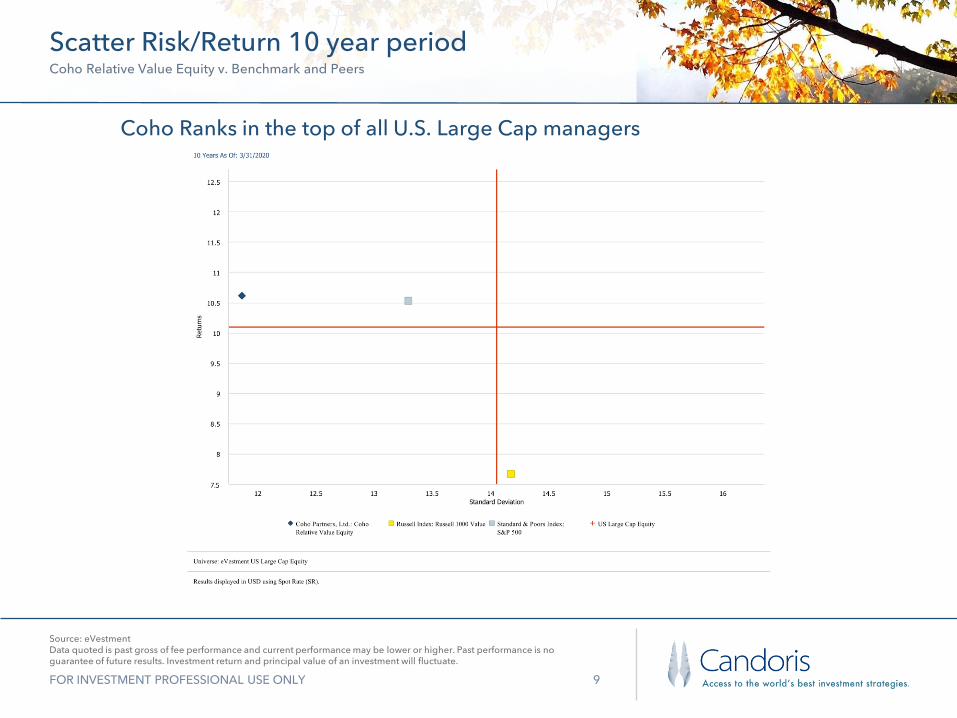
Scatter Risk/Return 10 year periodCoho Relative Value Equity v. Benchmark and Peers
Coho Ranks in the top of all U.S. Large Cap managers
Source: eVestmentData quoted is past gross of fee performance and current performance may be lower or higher. Past performance is no guarantee of future results. Investment return and principal value of an investment will fluctuate.
FOR INVESTMENT PROFESSIONAL USE ONLY 10
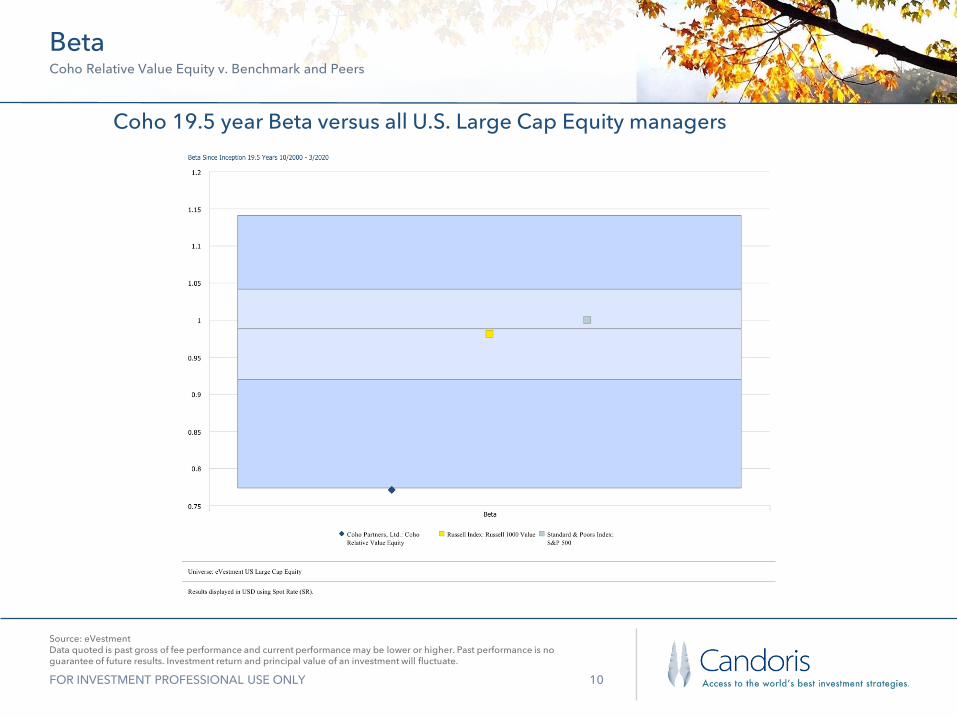
BetaCoho Relative Value Equity v. Benchmark and Peers
Coho 19.5 year Beta versus all U.S. Large Cap Equity managers
Source: eVestmentData quoted is past gross of fee performance and current performance may be lower or higher. Past performance is no guarantee of future results. Investment return and principal value of an investment will fluctuate.
FOR INVESTMENT PROFESSIONAL USE ONLY 11
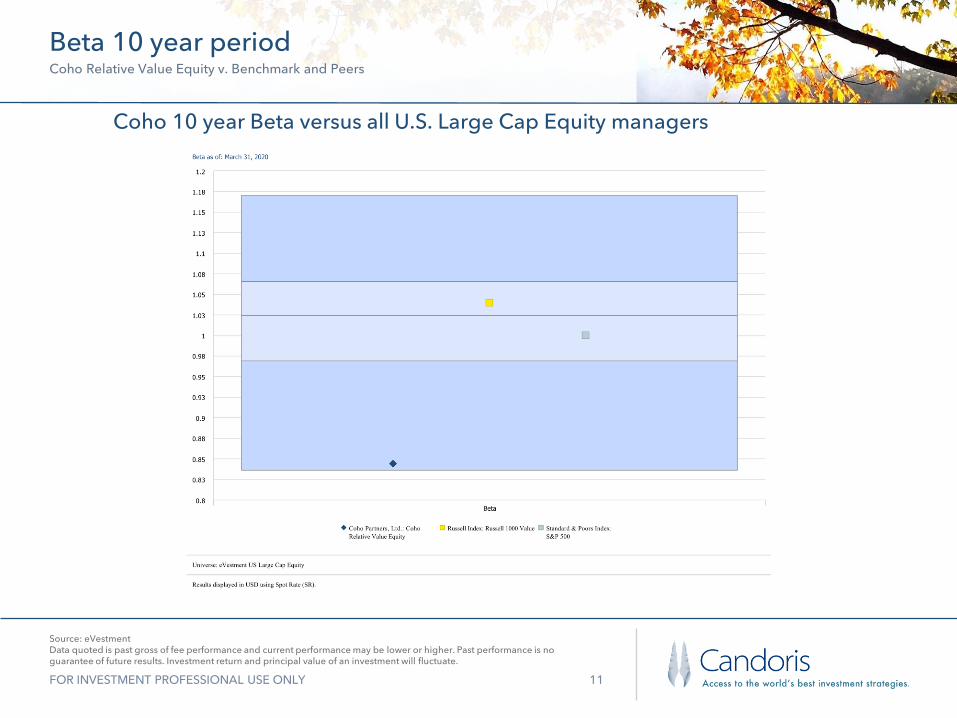
Beta 10 year periodCoho Relative Value Equity v. Benchmark and Peers
Coho 10 year Beta versus all U.S. Large Cap Equity managers
Source: eVestmentData quoted is past gross of fee performance and current performance may be lower or higher. Past performance is no guarantee of future results. Investment return and principal value of an investment will fluctuate.
FOR INVESTMENT PROFESSIONAL USE ONLY 12
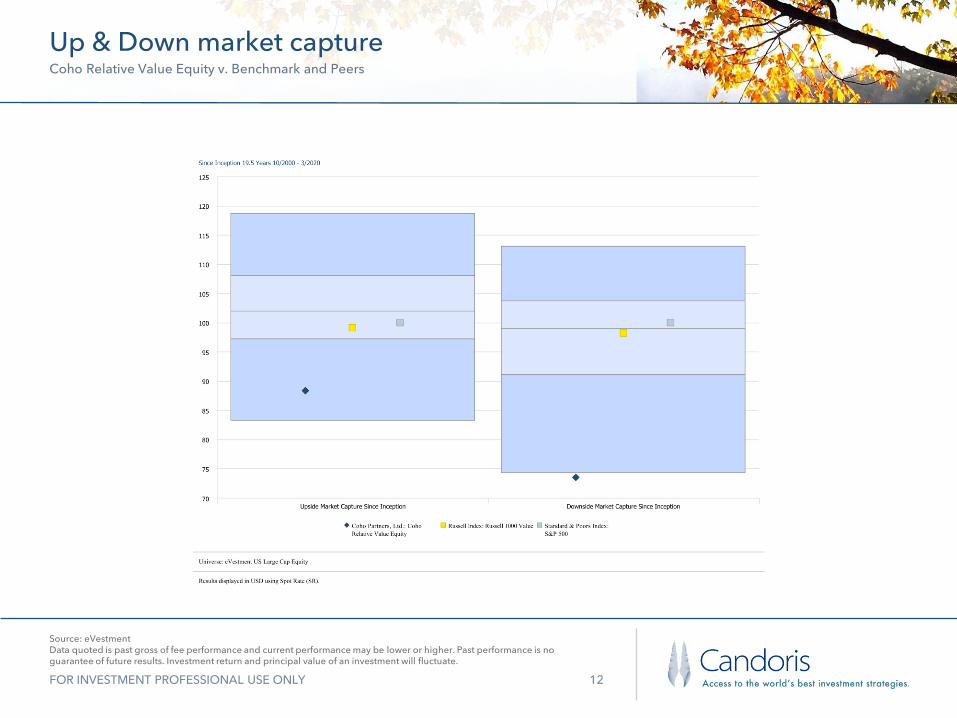
Up & Down market captureCoho Relative Value Equity v. Benchmark and Peers
Source: eVestmentData quoted is past gross of fee performance and current performance may be lower or higher. Past performance is no guarantee of future results. Investment return and principal value of an investment will fluctuate.
FOR INVESTMENT PROFESSIONAL USE ONLY 13
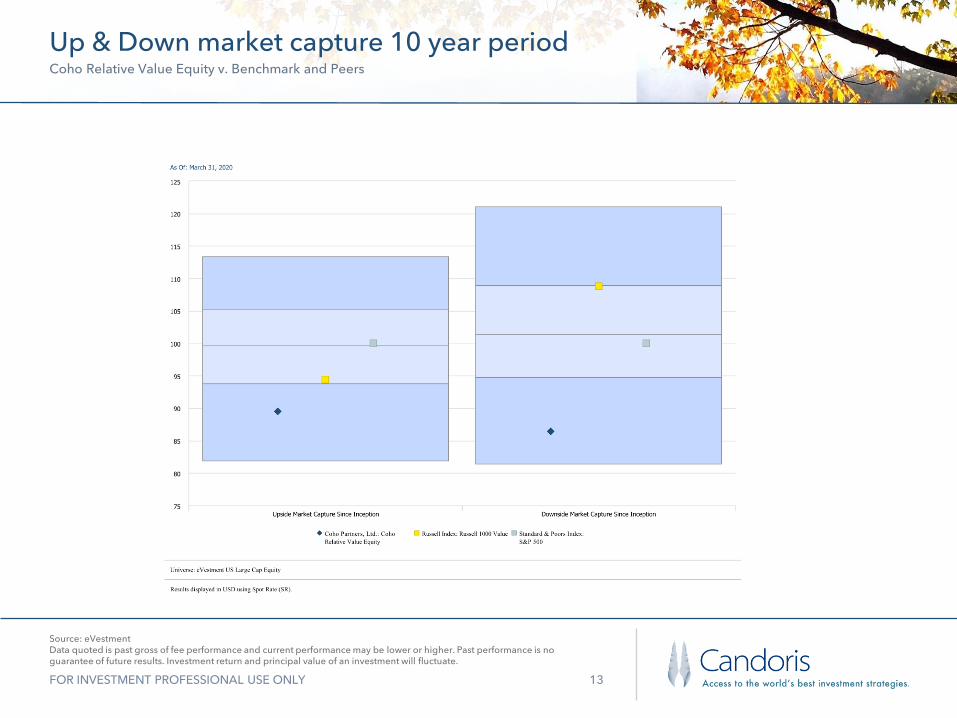
Up & Down market capture 10 year periodCoho Relative Value Equity v. Benchmark and Peers
Source: eVestmentData quoted is past gross of fee performance and current performance may be lower or higher. Past performance is no guarantee of future results. Investment return and principal value of an investment will fluctuate.
FOR INVESTMENT PROFESSIONAL USE ONLY 14
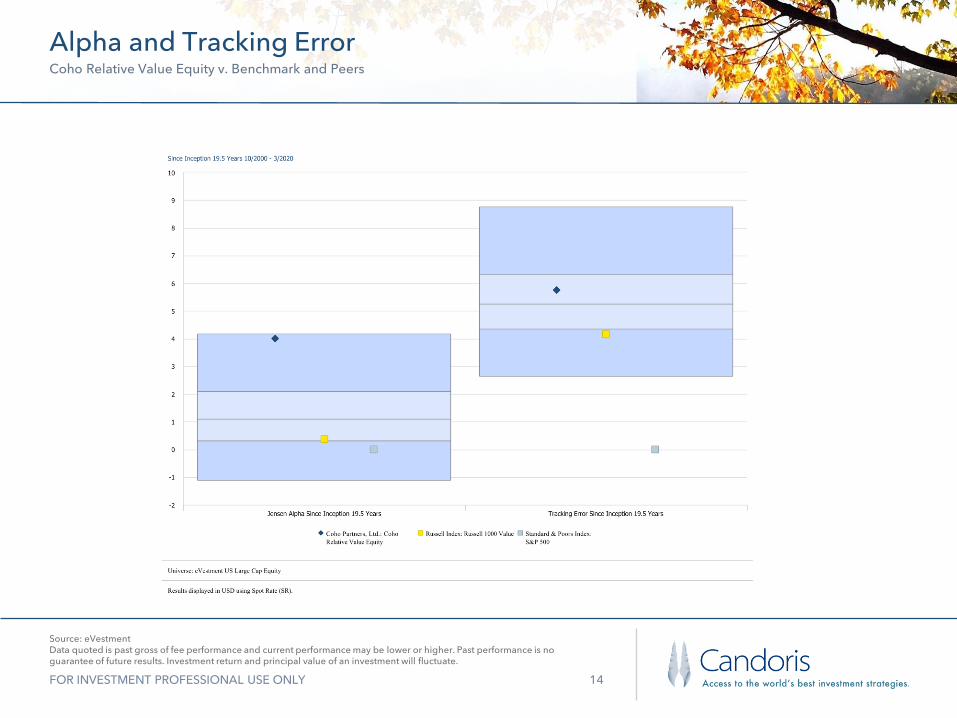
Alpha and Tracking ErrorCoho Relative Value Equity v. Benchmark and Peers
Source: eVestmentData quoted is past gross of fee performance and current performance may be lower or higher. Past performance is no guarantee of future results. Investment return and principal value of an investment will fluctuate.
FOR INVESTMENT PROFESSIONAL USE ONLY 15
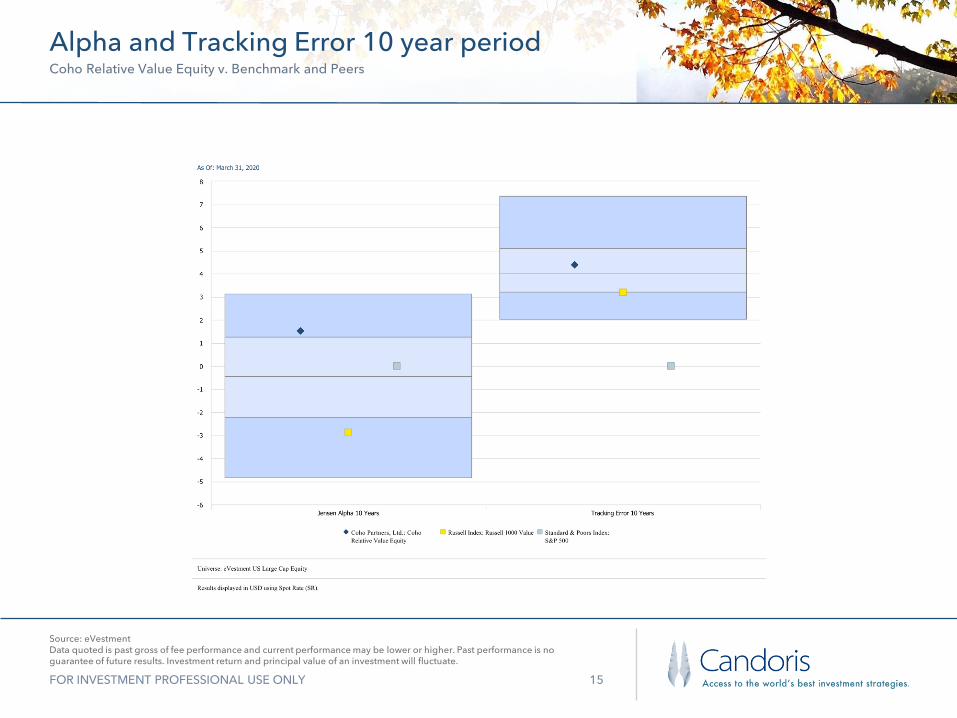
Alpha and Tracking Error 10 year periodCoho Relative Value Equity v. Benchmark and Peers
Source: eVestmentData quoted is past gross of fee performance and current performance may be lower or higher. Past performance is no guarantee of future results. Investment return and principal value of an investment will fluctuate.
FOR INVESTMENT PROFESSIONAL USE ONLY 16
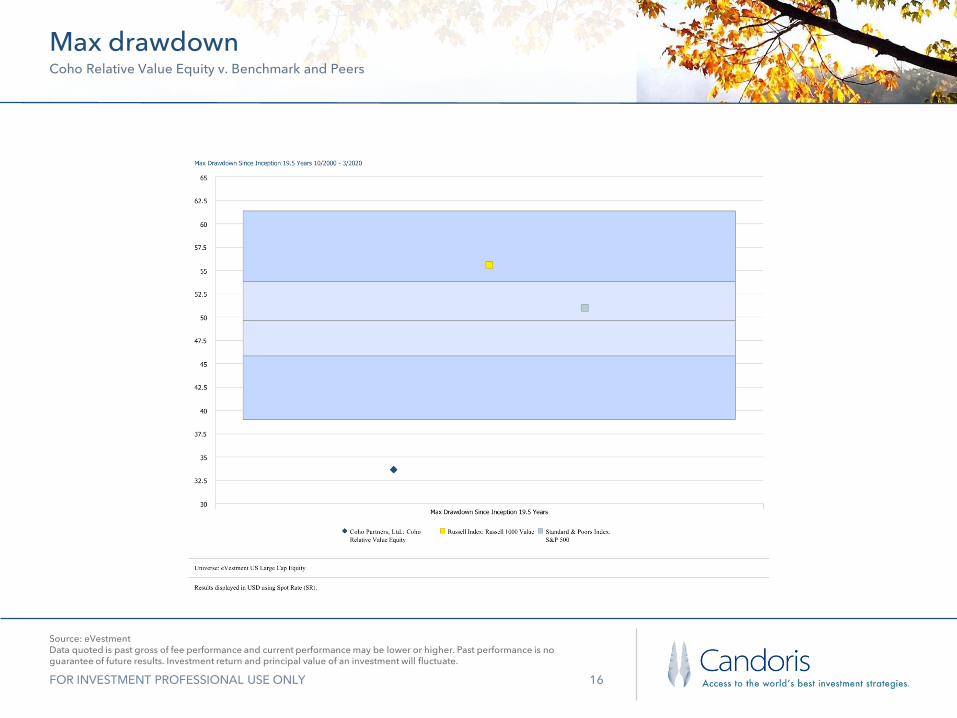
Max drawdownCoho Relative Value Equity v. Benchmark and Peers
Source: eVestmentData quoted is past gross of fee performance and current performance may be lower or higher. Past performance is no guarantee of future results. Investment return and principal value of an investment will fluctuate.
FOR INVESTMENT PROFESSIONAL USE ONLY 17
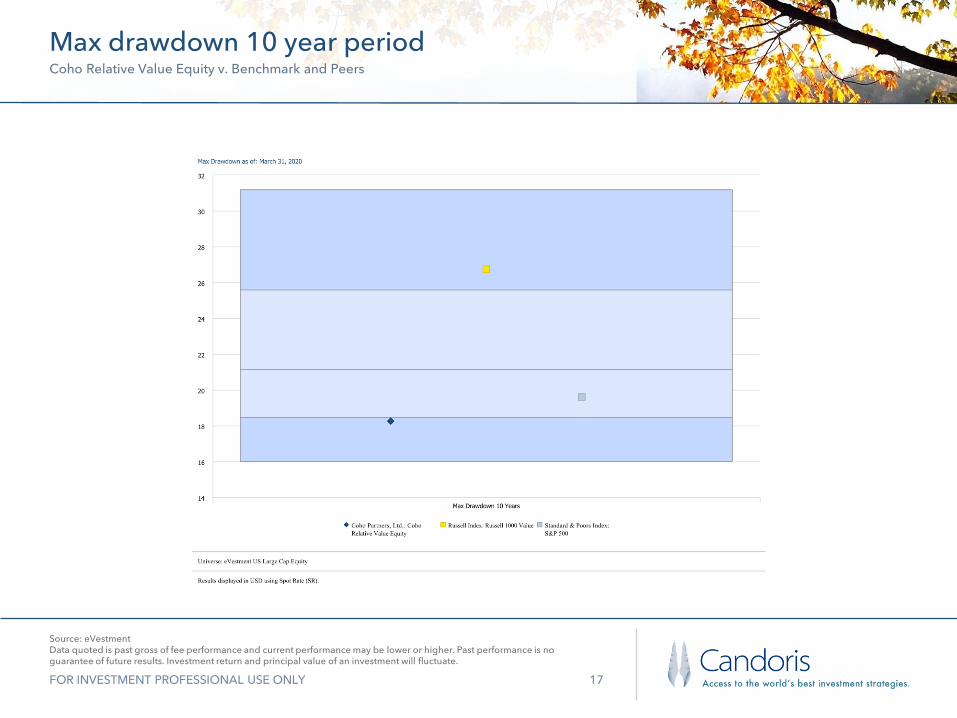
Max drawdown 10 year periodCoho Relative Value Equity v. Benchmark and Peers
Source: eVestmentData quoted is past gross of fee performance and current performance may be lower or higher. Past performance is no guarantee of future results. Investment return and principal value of an investment will fluctuate.
FOR INVESTMENT PROFESSIONAL USE ONLY 18
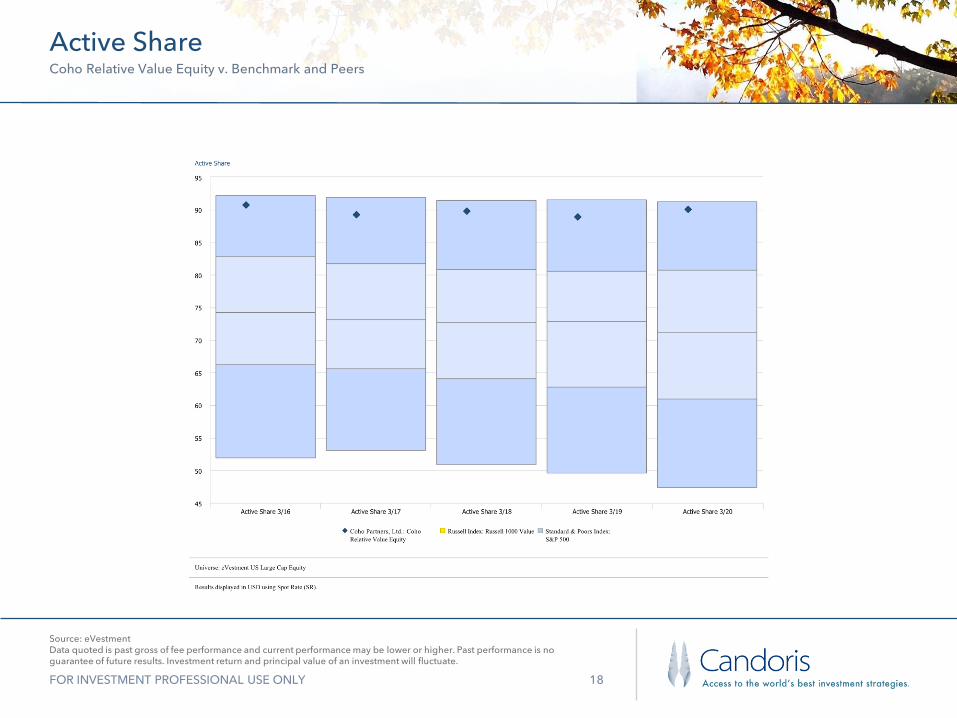
Active ShareCoho Relative Value Equity v. Benchmark and Peers
Source: eVestmentData quoted is past gross of fee performance and current performance may be lower or higher. Past performance is no guarantee of future results. Investment return and principal value of an investment will fluctuate.

FOR INVESTMENT PROFESSIONAL USE ONLY 19FOR INVESTMENT PROFESSIONAL USE ONLY 50
Coho ESG U.S. Large Cap Equity FundFund information
Fund Launch:
December 2017
Structure:UCITS with ESG
AUM:$157 million * as of 31-3-2020
Exchange:Ireland
Benchmark:
S&P 500 Total Return Index, S&P 500 Value Index
Liquidity:Daily Liquidity & Valuation
Custodian:
Royal Bank of Canada
Central Admin:
Royal Bank of Canada
Transfer Agent:
Royal Bank of Canada
Auditor:
Deloitte
Composite: Relative Value Strategy Data
Source: eVestment Coho Relative Value as of 31-12-2019 since inceptionData quoted is past gross of fee performance and current performance may be lower or higher. Past performance is no guarantee of future results. Investment return and principal value of an investment will fluctuate.
Copies of the Prospectus, Supplement and KIIDs are available free of charge from: www.candoris.nl
Management Fee:64 basis points for institutional share class
Other Fees:Annual fixed 15 basis points for institutional investors
Active Share Classes: ISIN Bloomberg
USD Institutional: IE00BF1XKT19 COHIUSDEUR Institutional: IE00BJ2DJ355 COHAIEAEuro Denominated Retail: IE00BF1XKW48 COHREUR USD Retail: IE00BF1XKV31 COHRUSD
Active Share 90.90
FOR INVESTMENT PROFESSIONAL USE ONLY 20
Coho U.S. Large Cap Equity FundFund Information
Fund Launch:
May 2015
Structure:UCITS with ESG
AUM:$103 million
Exchange:Ireland
Benchmark:
S&P 500 Total Return Index, S&P 500 Value Index
Liquidity:Daily Liquidity & Valuation
Fund Composite DataAlpha 4.76Beta 0.76Std Dev 11.91UMC 88.28DMC 68.92Information Ratio 0.71Tracking Error 5.71Sharpe Ratio 0.67
Management Fee:64 basis points for institutional share class
Other Fees:Annual fixed 15 basis points for institutional investors
Active Share Classes: ISIN Bloomberg
USD Institutional: IE00BF1XKT19 COHIUSDEuro Denominated Retail: IE00BF1XKW48 COHREUR USD Retail: IE00BF1XKV31 COHRUSD
Custodian:
Royal Bank of Canada
Central Admin:
Royal Bank of Canada
Transfer Agent:
Royal Bank of Canada
Auditor:
Deloitte
Source: eVestment as of 30-11-2017 since inceptionData quoted is past gross of fee performance and current performance may be lower or higher. Past performance is no guarantee of future results. Investment return and principal value of an investment will fluctuate.
Copies of the Prospectus, Supplement and KIIDs are available free of charge from: www.candoris.nl
FOR INVESTMENT PROFESSIONAL USE ONLY 47
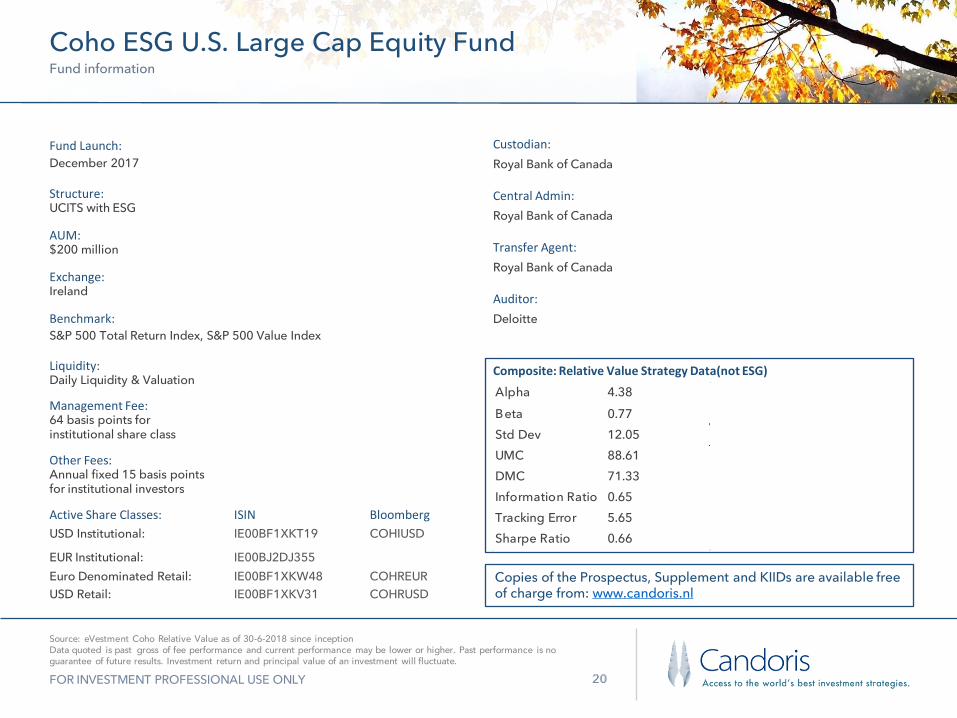
Coho ESG U.S. Large Cap Equity FundFund information
Fund Launch:
December 2017
Structure:UCITS with ESG
AUM:$200 million
Exchange:Ireland
Benchmark:
S&P 500 Total Return Index, S&P 500 Value Index
Liquidity:Daily Liquidity & Valuation
Custodian:
Royal Bank of Canada
Central Admin:
Royal Bank of Canada
Transfer Agent:
Royal Bank of Canada
Auditor:
Deloitte
Composite: Relative Value Strategy Data(not ESG)
Source: eVestment Coho Relative Value as of 30-6-2018 since inceptionData quoted is past gross of fee performance and current performance may be lower or higher. Past performance is no guarantee of future results. Investment return and principal value of an investment will fluctuate.
Copies of the Prospectus, Supplement and KIIDs are available free of charge from: www.candoris.nl
Management Fee:64 basis points for institutional share class
Other Fees:Annual fixed 15 basis points for institutional investors
Active Share Classes: ISIN Bloomberg
USD Institutional: IE00BF1XKT19 COHIUSD
EUR Institutional: IE00BJ2DJ355Euro Denominated Retail: IE00BF1XKW48 COHREUR USD Retail: IE00BF1XKV31 COHRUSD
Alpha 4.38
Beta 0.77Std Dev 12.05UMC 88.61DMC 71.33Information Ratio 0.65Tracking Error 5.65Sharpe Ratio 0.66
FOR INVESTMENT PROFESSIONAL USE ONLY 23
This information is proprietary and cannot be reproduced or distribute. Certain information may be received from sources Candoris B.V.considers reliable; Candoris B.V. does not represent that such information is accurate or complete. Certain statements contained hereinmay constitute “projections,” “forecasts” and other “forward-looking statements” which do not reflect actual results and are based primarilyupon applying retroactively a hypothetical set of assumptions to certain historical financial data. Actual results, performance or events maydiffer materially from those in such statements. Any opinions, projections, forecasts and forward-looking statements presented herein arevalid only as of the date of this document and are subject to change. Nothing contained herein should be construed as (i) an offer to buyany security or (ii) a recommendation as to the advisability of investing in, purchasing or selling any security. Candoris B.V. assumes noobligation to update any forward-looking information.
Past performance is no guarantee of future results.
Swiss disclaimerIn Switzerland, the Fund is considered foreign investment schemes pursuant to Art. 119 of the Swiss Federal Collective Investment Schemes Act (CISA). No application has been submitted to the Federal Financial Market Supervisory Authority (FINMA) to obtain approval within the meaning of Art. 120 CISA to offer or distribute the investment in or from Switzerland to “Non-Qualified Investors”, and no other steps have been taken in this direction. Consequently, investors do not benefit from the specific investor protection and/or FINMA supervision pursuant to the CISA and its implementing ordinances.
Any offer or sale must therefore be in strict compliance with Swiss law, and in particular with the provisions of the Collective Investment Schemes Act and its implementing ordinances, and FINMA circular 2013/9 on distribution of collective investment schemes. No person or entity is authorized to offer or sell the Shares or distribute any Fund Documentation, including the Prospectus, the Articles of Incorporation and annual reports issued by the Fund from time to time or promotional material pertaining to the Fund in or from Switzerland other than to "Qualified Investors", as defined in Article 10 of the CISA and Articles 6 and 6a of the CISO and any circulars issued by FINMA.
The Fund has appointed as Swiss Representative Oligo Swiss Fund Services SA, Av. Villamont 17, 1005 Lausanne, Switzerland, Tel: +41 21 311 17 77, email: [email protected]. The Fund’s paying agent is Helvetische Bank AG. Any Fund Documentation may be obtained free of charge from the Swiss Representative in Lausanne. In respect of the Shares distributed in or from Switzerland, the place of performance and jurisdiction is at the registered office of the Swiss Representative.