coffee economic viability study
TRANSCRIPT

Coffee Economic Viability Study
Authored on Behalf of the Kenya Coffee Platform through research by Coffee Management
Services.
1
ABBREVIATIONS
AFA - Agriculture and Food Authority
AFCA - Africa Fine Coffee Association
BBC - Bacterial Blight of Coffee
CBD - Coffee Berry Disease
CLR - Coffee Leaf Rust
CMS - Coffee Management Services Ltd
COP - Colombian Pesos
CRI - Coffee Research Institute.
ERP - Enterprise Resource Planning
FCS - Farmer Cooperative Society (ies)
GAPs - Good Agricultural Practices
GCP - Global Coffee Platform
GHG - Green House Gas
ILO - International Labour Organization
NCE - Nairobi Coffee Exchange
OT - Outturn
PCRs - Producer Crop Returns
SAI - Social Accountability International

2
Table of Figures
FIGURE 1: NATIONAL PRODUCTION DISTRIBUTION OVERVIEW ................................................................... 7
FIGURE 2: COFFEE GROWERS SAMPLED IN EACH COUNTY ......................................................................... 8
FIGURE 3: STAKE HOLDERS CONSULTATIVE FORUM ................................................................................. 15
FIGURE 4: NATIONAL PRODUCTION DISTRIBUTION OVERVIEW ................................................................. 28
FIGURE 5: COFFEE GROWERS SAMPLED IN EACH COUNTY ....................................................................... 30
FIGURE 6: MAP OF COFFEE GROWING AREAS IN KENYA .......................................................................... 31
FIGURE 7: AGE DISTRIBUTION OF COFFEE GROWERS SURVEYED BY PERCENTAGE ................................. 34
FIGURE 8: AVERAGE AGE BY COUNTY ....................................................................................................... 36
FIGURE 9: GENDER OF COFFEE GROWERS WHO PARTICIPATED IN THE STUDY ........................................ 37
FIGURE 10: GENDER DISTRIBUTION ACROSS DIFFERENT FARMER ARCHETYPES ...................................... 38
FIGURE 11: EDUCATION LEVELS OF THE COFFEE GROWERS INTERVIEWED ............................................. 39
FIGURE 12: ESTATE PRODUCTION WEIGHT PER TREE ................................................................................ 39
FIGURE 13: SMALLHOLDER PRODUCTION WEIGHT PER TREE .................................................................... 41
FIGURE 14: ESTATE FARMERS PRODUCTION COST PER KILO` ................................................................... 41
FIGURE 15: SMALLHOLDER FARMERS PRODUCTION COST PER TREE ........................................................ 43
FIGURE 16: REVENUE DISTRIBUTION IN KENYA SHILLINGS PER KILO OF CHERRY .................................. 44
FIGURE 17: BREAKEVEN POINT FOR ESTATE FARMERS ............................................................................. 46
FIGURE 18: BREAKEVEN POINT FOR SMALLHOLDER FARMERS ................................................................. 46
FIGURE 19: ECONOMIC VIABILITY POINT FOR ESTATE FARMERS .............................................................. 47
FIGURE 20: DISTRIBUTION OF ECONOMIC VIABILITY FOR ESTATE FARMERS BY PRODUCTION LEVELS . 48
FIGURE 21: ECONOMIC VIABILITY POINT FOR SMALLHOLDER FARMERS .................................................. 48
FIGURE 22: DISTRIBUTION OF ECONOMIC VIABILITY FOR SMALLHOLDER FARMERS BY PRODUCTION
LEVELS ........................................................................................................................................................ 49
FIGURE 23: NUMBER OF WET MILLS INTERVIEWED PER COUNTY ............................................................ 49
FIGURE 24: AVERAGE REGISTERED MEMBERS BY COUNTY ...................................................................... 50
FIGURE 25: ACTIVE MEMBER VS. REGISTERED MEMBERS BY COUNTY .................................................... 52
FIGURE 26: GENDER OF WET MILL MEMBERS ........................................................................................... 53
FIGURE 27: DISTRIBUTION OF REVENUE RETENTION RATE ....................................................................... 54
FIGURE 28: PAY-OUT RATE ACROSS WET MILLS ....................................................................................... 55
FIGURE 29: BREAKDOWN OF WET MILL EXPENDITURE ............................................................................. 57
FIGURE 30: BREAKDOWN OF MARKETING AND MILLING COSTS .............................................................. 58
FIGURE 31: BREAKDOWN OF THE MARKETING FEE ................................................................................... 58

3
FIGURE 32: BREAKDOWN OF FACTORY AND ADMINISTRATION COSTS .................................................... 59
FIGURE 33: COMPARISON OF AVERAGE PRICES ACROSS DIFFERENT CLEAN COFFEE GRADES ................ 71
FIGURE 34: COMPARISON OF PRICE VARIATION FOR DIFFERENT CLASSES OF SAME GRADE IN SAME
AUCTION ..................................................................................................................................................... 61
FIGURE 35: ESTATE FARMERS SENSITIVITY ANALYSIS WITH REVENUE AND COST GROWTH .................. 61
FIGURE 36: SMALLHOLDER FARMERS SENSITIVITY ANALYSIS WITH REVENUE AND COST GROWTH ...... 62
FIGURE 37: ESTATE FARMERS’ SENSITIVITY ANALYSIS WITH REVENUE GROWTH AND COST DROP ...... 62
FIGURE 38: SMALLHOLDER FARMERS’ SENSITIVITY ANALYSIS WITH REVENUE GROWTH AND COST
DROP ........................................................................................................................................................... 63

4
List of Tables
TABLE 1: COFFEE GROWERS THAT PARTICIPATED IN THE STUDY ................................................... 9
TABLE 2: COFFEE PRODUCTION HISTORY ...................................................................................... 12
TABLE 3: COFFEE GROWERS THAT PARTICIPATED IN THE STUDY ................................................. 31
TABLE 4: ANNUAL AVERAGE PRICE PER KILO OF CLEAN SEASON 2016/17.................................. 43
TABLE 5: PAY OUT COMPARISON ACROSS WET MILLS ................................................................. 56

5
Table of Contents
ABBREVIATIONS ........................................................................................................................ 1
EXECUTIVE SUMMARY ............................................................................................................ 7
1.0 BACKGROUND OF THE STUDY .................................................................................. 10
1.1 Coffee Production in Kenya ........................................................................................... 10
1.2 Sauti ya Kahawa ............................................................................................................. 13
1.3 Coffee Management Services Ltd (CMS) Background ................................................. 14
1.4 Stakeholders’ Consultative Forum Consensus ............................................................... 15
2.0 LITERATURE REVIEW .................................................................................................. 16
2.1 Definitions ...................................................................................................................... 19
2.2 Field Agronomy ............................................................................................................ 22
2.3 Revenue Determination .................................................................................................. 25
2.4 Cost of Production .......................................................................................................... 25
3.0 METHODOLOGY ............................................................................................................ 26
3.1 Coffee Economic Viability Study Background .............................................................. 26
3.2 Stakeholders’ Consultative Forum Consensus ............................................................... 26
4.0 DATA ANALYSIS AND FINDINGS .............................................................................. 27
4.1 Site Selection and Sampling ........................................................................................... 31
4.2 Data Collection and Analysis ......................................................................................... 32
4.3 Results and Findings ...................................................................................................... 33
4.3.1 Age of the Farmers.................................................................................................. 33
4.3.2 Gender of the Coffee Growers ................................................................................ 35
4.3.3 Level of Education .................................................................................................. 37
4.3.4 Household Size ....................................................................................................... 38
4.3.5 Production ............................................................................................................... 38
4.3.6 Cost of Production .................................................................................................. 40
4.3.7 Revenue Distribution .............................................................................................. 43
4.3.8 The Breakeven Points ............................................................................................. 45

6
4.3.9 Economic Viability Point ........................................................................................ 47
4.3.10 The Wet Mill Perspective ........................................................................................... 49
4.3.11 Sensitivity Analysis .................................................................................................... 55
5.0 RECOMMENDATIONS ................................................................................................... 64
6.0 APPENDICES .................................................................................................................... A
APPENDIX 1: ASSUMPTIONS ................................................................................................ B
APPENDIX 2: RESEARCH QUESTIONNAIRES .................................................................... C

7
EXECUTIVE SUMMARY
This report presents the results of the analysis of the data collected for the coffee economic study in all
coffee producing counties across the country in March 2018. This study consisted of in-depth interviews
with a target of 540 coffee farming households. The primary counties in which the sample was targeted are
based on the contribution to the national production as shown in the following graph:
Figure 1: National Production Distribution Overview
Source: Author’s Graphs using NCE data
The sampled estates, smallholders and wet mills were selected randomly in the respective counties. The
following figure shows the county and the respective farmers sampled.
5,636,151
4,325,876
4,286,369
4,066,928
2,466,772
2,200,006
1,755,288
1,372,517
747,363
655,572
557,244
522,362
437,048
320,299
130,945
87,296
48,581
47,717
31,217
20,811
Kiambu
Kirinyaga
Nyeri
Muranga
Kericho
Meru
Machakos
Kisii
Bungoma
Embu
Nakuru
Trans Nzoia
Tharaka Nithi
Kakamega
Nandi
Uasin Gishu
West Pokot
Baringo
Kisumu
Homabay

8
Figure 2: Coffee Growers Sampled in each County
A total of 495 respondents were interviewed from the different counties in coffee growing areas. However,
after cleanup of the data the respondents whose information was used in data analysis is as follows:
56
72 71 72
38
1410
35
5 2
31 32
9
18
512
97
8474 73
38
13 11
35
3 3
32 33
9
18
5
12
Nu
mb
er
of
Re
spo
nd
en
ts
Achieved Response Rate Total Sampled Respondents

9
Table 1: Coffee Growers that participated in the Study
County Number of Smallholder farmers
Number of Estate farmers
Number of Wetmills
Achieved Response Rate
KIAMBU 26 27 3 56
MURANGA 48 21 3 72
NYERI 61 5 5 71
KIRINYAGA 66 2 4 72
MERU 32 2 4 38
EMBU 10 2 2 14
THARAKA NITHI 9 1 10
KERICHO 29 2 4 35
NANDI 2 1 2 5
UASHIN GISHU 1 1 2
MACHAKOS 26 1 4 31
KISII 26 2 4 32
TRANS NZOIA 4 3 2 9
BUNGOMA 13 2 3 18
KAKAMEGA 3 1 1 5
NAKURU 7 2 3 12
363 73 46 482
All participants selected for the study were growing coffee and indeed made a contribution to the
national coffee volumes as per the NCE transaction listing reports in the season 2016/17. Since
quantitative analyses alone could not provide the in-depth understanding of the livelihood systems
employed by the coffee growers, this quantitative study is supplemented by a series of (qualitative)
discussions captured in narrative sections of the report.
Given that this report represents results from the first round of data collection, it presents more of
a profile, or a snapshot at a point in time of the surveyed coffee growers rather than a detailed
analysis of changes over time. A more detailed analysis of change can inform future studies.
Nevertheless, this report captures some interesting findings and results that have emerged from the
data analysis.
10
1.0 BACKGROUND OF THE STUDY
1.1 Coffee Production in Kenya
Agriculture is the backbone of Kenya’s economy with the government of Kenya estimating that
the sector accounts for about 25.4% of annual GDP and another 27% indirectly from agro-based
industries and services with small scale farmers contributing the most. Similarly, smallholder
farmers are responsible for more than three-quarters of Kenya’s coffee production. There are about
570,0001 small-scale farmers who have been most affected by the reducing income from coffee
because of falling productivity and difficulty in meeting international quality standards. For
instance, the production of coffee during Kenya’s independence in 1963 was 43,778 Metric Tons
(MT) and it substantially increased to a high of 128,926 MT in year 1987/1988. However,
following the collapse of International Coffee Agreement in 1989, production of coffee went into
a steady decline and coupled with other key challenges, production today is estimated at 42,000
MT1. This has significantly reduced the income of small scale coffee farmers with majority of
them neglecting the crop.
Smallholder coffee farmers in Kenya own approximately 85,000 hectares out of the approximately
110, 0001 hectares under coffee. It is estimated that six million Kenyans are employed directly or
indirectly in the coffee industry. The major coffee-growing regions in Kenya are the high plateaus
around Mt. Kenya, the Aberdare Ranges, Kisii, Nyanza, Bungoma, Nakuru and Kericho among
others. The high plateaus of Mount Kenya that have acidic soil provide excellent conditions for
growing coffee plants. Coffee from Kenya, which is of the 'mild Arabica' type, is well known for
its intense flavor, full body and pleasant aroma with notes of cocoa. This high grade coffee from
Kenya is one of the most sought-after coffees in the world.
Conditions favoring coffee growing include:
1. Temperature – Coffee does well under temperatures of 14 to 26°C although Arabica
coffee can tolerate temperatures of up to 30°C. In Kenya the coffee growing areas
experience cool to hot climate ideal for coffee growing. The temperatures average 15°—
30°C.
1 Coffee Research Institute

11
2. Rainfall – Arabica coffee requires rainfall ranging between 1000 and 2 000 mm per
annum. Many coffee growing areas in Kenya receive rainfall of about 1000 — 2000 mm
which is well distributed.
3. Soils – Most of the growing areas in Kenya have fertile deep volcanic soils which are
suitable for coffee. The soils are well drained and are acidic with a pH of between 5.3 and
6.0.
4. Topography – The coffee growing areas have undulating landscape with hill slopes as
well as gentle slopes. This has ensured well drained and aerated soils.
5. Altitude – Most of the growing areas have an altitude ranging between 610 m and 1830
m. However in a few areas like Machakos, coffee is grown at slightly lower altitudes.
6. Labour – Coffee growing is labour intensive. A lot of manual labour is required for
planting, pruning and harvesting. The dense human population in the growing areas has
provided a source of labour.
Coffee Varieties
Coffee Plants come in two main varieties: - Arabica and Robusta
Arabica beans are mild in the cup, with comparatively less caffeine, while Robusta is more
aromatic. The Robusta tree appears bushier, the leaves are larger and the berries form in clusters.
Coffee Research Institute (CRI) currently produces five commercial cultivars (varieties) of
Arabica coffee. Different varieties are recommended for various altitudes.
• K7 – low altitude coffee areas with serious Coffee Leaf Rust (CLR).
• SL 28 – medium to high coffee areas without serious CLR.
• SL 34 – high coffee zone with good rainfall.
• Ruiru 11 – all coffee growing areas. Resistant to both Coffee Berry Disease (CBD) and
CLR.
• Batian – all coffee growing areas.

12
Production History
Table 2: Coffee Production History
Season Auction Auction Direct Direct Total
Weight- Kgs Value $ Weight- Kgs Value-$ Weight- Kgs Value – USD
1998/99* 67,406,795 159,633,152 67,406,795 159,633,152
1999/20* 85,862,945 144,043,500 85,862,945 144,043,500
2000/01* 65,163,902 89,165,020 65,163,902 89,165,020
2001/02* 47,427,241 73,683,754 47,427,241 73,683,754
2002/03* 58,612,490 76,827,524 58,612,490 76,827,524
2003/04* 52,873,632 87,992,442 52,873,632 87,992,442
2004/05* 49,753,670 120,403,162 49,753,670 120,403,162
2005/06* 47,495,275 128,290,188 47,495,275 128,290,188
2006/07* 53,368,337 143,006,663 53,368,337 143,006,663
2007/08* 39,448,221 139,823,941 2,045,280 8,106,791 41,493,501 147,930,731
2008/09* 51,881,026 160,459,376 1,195,560 4,385,904 53,076,586 164,845,280
2009/10* 36,197,159 171,347,974 3,784,154 19,492,410 39,981,313 190,840,384
2010/11* 33,633,235 221,468,088 2,231,981 22,211,998 35,865,216 243,680,086
2011/12** 43,366,142 190,810,778 5,701,514 33,580,664 49,067,656 224,391,441
2012/13** 38,140,842 127,164,780 3,723,449 17,991,934 41,864,291 145,156,714
2013/14** 40,927,603 174,151,188 8,282,060 42,988,034 49,209,663 217,139,222
2014/15** 35,194,567 143,669,895 6,018,824 31,666,480 41,213,391 175,336,376
2015/16** 30,801,302 117,114,138 5,276,800 32,277,442 37,117,054 161,274,979
2016/17** 34,092,094 159,211,178 6,755,743 43,738,496 40,847,837 202,949,674
Source: CRI Data*, NCE Data**

13
Though the smallholders have 85,000 hectares out of the 110, 000 hectares under coffee in Kenya,
their productivity is very low. Most of the smallholders produce 300-400Kgs/ha of clean coffee
while the estates can do up to 1600 Kg/ha clean Coffee. This is as a result of the different farming
methods. Large plantations put in a lot of effort on implementation of the good agricultural
practices while smallholders face a number of challenges from lack of information to lack of
capital, poor climate change adaption measures among others. However, challenges like lack of
research capacity and lack of success in developing new resistant high producing varieties is faced
by all producers in Kenya.
1.2 Sauti ya Kahawa
The Kenya coffee stakeholders have found it necessary to create a platform with a view to bringing
the value chain stakeholders together to deliberate on critical issues and develop a common
approach/strategy to address such issues. This idea was actualized with the initial funding and
technical support from Global Coffee Platform (GCP), UTZ, Solidaridad (SECAEC) and Africa
Fine Coffees Association (AFCA). The platform shall make it possible for the stakeholders to
participate in setting the coffee agenda as well as to monitor and track the progress on the agreed
plans and goals. It shall also act as the entry point for the development partners and any other
organizations willing to work with actors along the value chain in country. The Government,
through the Ministry of Agriculture and Livestock and the Department of Cooperatives takes a
crucial role in making the platform a reality. The platform, dubbed Sauti ya Kahawa, borrows from
Global Coffee Platform, Uganda Coffee Platform, Tanzania Coffee Platform (Mkutano wa
Kahawa) and other countries’ coffee platform models and experience. The ultimate goal is to create
an inclusive and participatory County and National level coffee forum that will bring together all
coffee stakeholders to discuss critical issues affecting the sector, resulting in an increase in coffee
production and quality in the Country as well as a conducive business environment. As a basis for
the improvement of Kenyan coffee producers’ profitability, the newly founded Kenyan National
Coffee Platform “Sauti ya Kahawa” and the GCP commissioned a study to identify key areas for
action and to identify agreed criteria to determine the cost of production and living income among
coffee farmers.
14
1.3 Coffee Management Services Ltd (CMS) Background
Coffee Management Services Ltd (CMS) is a private limited company owned by East Africa
Coffee Co LLP. It commenced operations in 2006 and has operated for 12 years emerging the
best coffee marketer in terms of market share. Being an agribusiness firm, CMS provides several
services to its clients. These include farm management, pre-financing coffee production, price risk
management, marketing, bulk competitively priced farm inputs, project management,
environmental audits, sustainability and certification expertise. CMS comprises of 88 employees
out of which 30 are senior agronomists.
Over the years CMS have emerged to be the leading coffee marketer, marketing 23 % of the
Kenyan coffee. Currently CMS is working with 141 wet-mills and this means approximately
250,000 smallholders in Kenya. These farmers are scattered in all the coffee producing counties
in Kenya. The company comprises of highly qualified staff that are equipped with the right skills
for coffee productions, project management, Environmental audits and farm management. CMS
also manages large farms that cover up to 2,800 ha. The company has been training farmers and
has identified most of the challenges facing smallholder farmers: lack of knowledge of soil
nutrition, appropriate inputs, inadequate farmers training, lack of market information,
unfavourable terms while accessing credit, etcetera. CMS has over 30 are field agronomy liaison
officers who do farmers’ trainings. CMS has been guiding farmers towards sustainability and more
so advising them on how the crop is likely to behave. One of the major activities has been to
encourage farmers take their soils for expert analysis so that they may be sure of the nutrients that
the soils need to support the coffee tree. This is meant to avoid deficiency or over dose of some
nutrients. This has given a wide range of experiences in terms of identifying the factors affecting
coffee production , cost of production for coffee, coffee industry policies , production trends ,
market trends and price trends . The combination of the said factors determines the amount of
income realized by the producers.
Previously CMS has partnered with several other partners ranging from local institutions to
international institutions. Some of the partners have been other private companies, NGOs, public
institutions, government institutions and The Dutch government. These partnerships include;
Nescafe plan – Creating Shared Value with Nestle, CSR projects with Tchibo in Germany, Dutch

15
government in food security, Bill and Melinda Gates, DEG and IDH. CMS is also in Tanzania and
Rwanda. It is also offering consultancy services in Ethiopia.
1.4 Stakeholders’ Consultative Forum Consensus
A consultative meeting was held at the beginning of the study to get stakeholder input which
involved methodology and data collection. See picture below:
Figure 3: Stake Holders Consultative Forum
16
2.0 LITERATURE REVIEW
Economic viability for farmers has been an area of interest over the years. Numerous studies on
crops viability have been done around the whole world. A study conducted by Joni Valkila of
Institute of Development Studies was to evaluate the viability and advantages of Fairtrade organic
coffee production and trade in the case of the Nicaraguan small-scale farmers. This study indicated
the economic advantages of growing coffee are not always clear though Fairtrade organic coffee
production can increase farmer income in the case of low-intensity coffee production. It was
however noted that more intensive Fairtrade organic Coffee production can yield benefits through
premium but still yields tend to be lower compared to conventional methods. The study further
noted that when the conventional prices are low, Fairtrade prices will be a bit high. The conclusion
was that it’s hard to determine the viability of Fairtrade organic Coffee in Nicaragua since the
prices are not stable.
A study conducted in Colombia (2007) by the Global Coffee Platform (GCP) on Coffee Economic
viability indicated that farmers were not producing optimally. It was noted that the farmers were
producing 300 kg green / ha and could be increased by 65% on average. 70 % of the coffee growing
population was producing below the average. This meant that they were not viable. The study
noted that among the factors affecting coffee viability include poor agronomic practices, cash flow
issues, lack of training, very old trees among others. If the above issues could be solved, the study
indicates that it would be possible to increase productivity by 25%.
Another study conducted in Colombia by International Coffee Organization in 2016 indicated that
the coffee revenue could only cover variable costs and thus the operating profit was positive.
However the long-term viability of Coffee was uncertain since the revenues would not cover full
costs of production i.e. variable and fixed costs. The study also mentioned that if the established
cost of 10 million COP/ha was brought into the picture and spread over 8 year’s lifetime, the
situation worsens. There were only four crop years out of the 10 years that were studied that had
the total profits greater than or equal to zero.
The same study noted that the scenario in Costa Rica is more or less the same with Colombia in
terms of cost of production. Costa Rica had very high prices and thus the revenues would cover

17
the costs comfortably in the case of 2005-2011. However, in 2012 the prices dropped drastically
and farmer incurred losses. This is a clear indication that coffee viability depends to some extent
on the prices though it’s a combination of cost management and optimal production.
In El Salvador , the same study indicated that the costs were taking an upward trend up to 2012
but in 2013 there was a leaf rust outbreak that affected the crop adversely and this resulted to
reduced labour cost and eventually a drop in the cost of production from 1400 USD/ha to 1300
USD/ha. On the other hand, the prices decreased and this led to 50% decrease in revenue again
threatening the viability of Coffee. As result, it was expected that most of the farmers would move
from Coffee to cocoa production. In Brazil, contrary to other countries, the study showed positive
profits both in Arabica and Robusta cases. Even when the establishment costs were brought into
account, the profits were still positive, an indication that Coffee farming was viable in Brazil then.
In Africa, a case study of coffee growing association conducted in Rwanda indicated that coffee
growing would only be profitable if the specialty market buys that coffee. However, this study had
limitations since it studied only on farmers’ association.
A study conducted by TechnoServe for GCP (2017) indicated that production for smallholders was
as low as 300 kg green/ ha with potential for a 65% increase in average yield. However the potential
may be lower for regions with poorer soil and older trees. The study mentioned some of the key
levers for yield improvement as farm rejuvenation, training in GAPs and targeted fertilizer and
pesticide application. The study also foresaw an opportunity for a 144% increase in profitability
for farmers, which translates into an estimated $55m annual potential value across the 571,000
smallholder farmers.
Sector study conducted by Agri-Logic for GCP (2016) on sector reviews of Angola, Burundi,
Cameroon, Côte d’Ivoire, Ethiopia, Kenya, Rwanda, Tanzania and Uganda indicated that in most
African origins, yields are low, quality is inconsistent and supply chains are inefficient. The study
indicated that coffee production has really reduced in Côte d’Ivoire, Zimbabwe, Congo
(Brazzaville), Gabon Zambia and the Central African Republic. However, a positive trend in
growth was noted in Kenya, Tanzania and Rwanda since supply over the past 5 years is positive.
This study noted that farming household income was below poverty line in all of the African coffee
origins. This would mean coffee farming is not viable but with proper investment, farmer training,
18
rejuvenation/replanting, input supply, improvement of processing capacity, access to credit and
farmer organization capacity building, the study noted that productivity can improve making
coffee viable in these countries. This study further suggested that the bulk of the investment should
be on farmers’ training and input supply.
Strategic Literature Review study on coffee production costs and farm profitability conducted by
Specialty Coffee Association (2016) indicated that there was a highly significant correlation
between profitability and production cost per kilogram. This was based on the understanding that
profitability is the value of guaranteed price against production costs. The study also showed that
production costs per kilogram and yield are not correlated and neither are production costs per
kilogram versus costs per hectare correlated. This means that the extra cost invested per hectare
would not automatically be compensated by achieving extra yield.
A study by True Price, commissioned by Fairtrade International (2017), “Assessing Coffee Farmer
Household Income” indicated that farmers in Indonesia relied highly on income from coffee
production whereas farmers in Kenya relied mainly on other sources of income. On average about
50% of farmer household income resulted from coffee production. The other large contributors
were income from other farm goods and off-farm wage income. Indonesian and Vietnamese
farmers had the highest farmer household incomes, which was mainly due to relatively high
incomes from coffee. Indonesian farmers had the highest coffee profitability, which resulted from
relatively low costs of production. Tanzanian farmers also had a high profitability per kilo of
coffee, but this did not translate into high farmer household incomes due to relatively low coffee
production volumes. Moreover, Tanzanian farmers had almost negligible in-kind farm income and
income from off-farm activities. While some Kenyan farmers were making a profit on their farms,
the overall picture is very mixed, so that on average, Kenyan farmers were making losses on coffee
production. The results of this study were placed on the living wage concept and it was found that
on average Indian, Indonesian and Vietnamese farmers earned a household income, but only
Indonesia farmers earned a living household income from coffee production alone. Twenty-five
percent of Indian farmers, almost 50% of Indonesian and Vietnamese farmers and 100% of Kenyan
farmers could not earn a living income. An additional ‘value added analysis’, showed that farmers
were able to provide their households and their hired workers with a living income from coffee

19
production in India and Indonesia. In Kenya – where farmers made losses on coffee production –
and Vietnam, that was not the case then.
2.1 Definitions
Economic Viability
Economic viability means that the real returns from farming operations relative to the farm’s asset
value and labour inputs are competitive compared to other alternatives. Farming is the defining
characteristic of a farm; it must succeed on that basis in order to be viable.
Estate Farmer Economic Viability
Economic viability in the case of an Estate farmer refers 11.16% risk free rate (one Year Treasury
Bill) plus annual average inflation rate of 5% plus a return on tax of 30%, all this summing up to
around 22%. This means that economic viability of this farmer shall be a Return on Investment of
above 22%.
Smallholder Farmer Economic Viability
Economic viability in the case of a smallholder farmer refers to the ability and capacity of a farm
to 'make a living'. This shall be influenced by ability over time of the farmer to apply good
agriculture practices that enable them to continually produce above their cost of production and
earn at least the living wages as given by Anker and Anker (2015).
Profitability
Profitability is defined as the ability of the farmer to produce a return on an investment based on
their resources in comparison with alternative investments.
Profit
Profit is a measure of the financial performance of the farm. It is computed as total revenue less
total expenses incurred by the farmer. Although the farmer may realize a profit, this does not
necessarily mean that their coffee growing is viable.

20
Living Income may be defined as:
• The level of wages sufficient to meet the basic living needs of an average-sized family in
a particular economy, (ILO).
• The remuneration received for a standard work week by a worker in a particular place
sufficient to afford a decent standard of living for the worker and her or his family, Social
Accountability International, (SAI).
• Income sufficient to pay the bills, buy enough food, handle emergencies and stay off
welfare, (Black's Law Dictionary)
Elements of a decent standard of living include; food, water, housing, education, health care,
transport, clothing and other essential needs including provision for unexpected events.
A study conducted by Anker and Anker (2016) on Living Wage Report in Kenya with a focus on
rural Mount Kenya Area has placed the living wage at KShs.13, 193 gross per month. The same
author had in 2014 done a study on living wage for Lake Naivasha flower growing area and
currently tags it at KShs. 22,104 gross per month after adjusting for inflation and taxes for the
period from 2014 to 2016.
Costs of production include:
• What the farmer has to give up as they venture into the coffee farming. It is the necessary
investment needed to initiate the production process and keep it going.
• All the farm level cash outflow costs, selling costs, implicit costs for activities done by the
farmer himself, the farmer’s time spent in the farm and the interest income forgone by
committing the capital resources into the farm, transport, administrative, financing and
security costs.
• Cost of production goes with the scale of production derived from economies of size.
Bigger farms have advantages over smaller farms. However, due to scale drawbacks, it is
not easy to determine the optimal size especially with the concept of diminishing returns
that often affect large scale farms.
21
A few definitions were also borrowed from Ha et al (2006);
“Profit is a measure of receipts less costs. Economists split costs into two broad
categories, those that vary with output (variable costs) and those that do not (fixed
costs). Different profit measures use different definitions of ‘receipts’ or ‘costs’.
For example, some profit measures ― like farm gross margin ― take account of
variable costs, but exclude fixed costs. Profit will change when something affects
either receipts or costs. For example, an output price change will alter profit because
it affects receipts (price of output times the quantity of output). If costs stay constant
and output price rises, then by definition, profit will rise.
Productivity is a measure of the units of (physical) output that can be produced
from a given amount of (physical) inputs. We can most easily measure productivity
when a production process requires only one input and one output. Productivity will
not be affected by a change in output price, because price is not part of the
productivity equation; a change in output price does not affect the ability of the
farm to transform inputs into outputs.
Prices (of inputs or outputs) will affect profit, but they will not affect productivity.
However, technical change (via research or other means) will affect both
productivity and profit since it affects the ability of farms to convert inputs to
outputs (productivity) and hence affects receipts (output price times output
quantity) or costs (input price times input quantity) or both. Farmers are concerned
with profit because it provides the means for current consumption (food, clothing,
education, etc.) and investment. They are concerned with productivity to the extent
that it helps them create higher profits, or to counter the inexorable cost-price
squeeze. Research administrators know that for an industry to survive, it has to
continually improve its productivity. Otherwise, international competition will
displace domestic production on the world market and at home. This could lead to
the demise of an industry, (Ha et al, 2006, pg.9)”

22
2.2 Field Agronomy
The stakeholders agreed that the study would assume that the farmers have mature coffee trees.
The cost areas were to comprise the below areas;
Pruning
Pruning literally means removing superfluous parts of a tree. It is therefore a very large field of
operation. To be more precise, it is necessary to refer to pruning in its separate operations:
Conversion and first pruning, main pruning, handling, de-suckering and chimney opening.
Weed Management
Weeds are plants growing in a farm where they are not wanted. They pose a threat to the crop as
they compete for nutrients and water as well as harbor pests that may pose harm to the crop. Weeds
are characterized by very fast proliferation and can be a nuisance to control as they can interfere
with coffee management practices like fertilizer application.
Weed Control methods are the methods applied to suppress growth of the weeds or to eradicate
the weeds from the coffee field. They are both preventative and eliminative in nature. Weeds
control should be carried out whenever weeds are spotted especially during the wet weather and
should be a continuous activity to suppress their growth. The methods are classified into:
• Mechanical
• Chemical
• Cultural
Major Pest and Diseases
Diseases
The major coffee diseases are fungal and bacterial. They include:
• Coffee Berry Disease(CBD)
• Coffee Leaf Rust(CLR)
• Bacterial Blight of Coffee (BBC) being the only major disease caused by bacteria.

23
Other diseases include:
• Fusarium root disease
• Fusarium bark disease
• Brown eye spot disease
• Botrytis warty disease.
Pests
The major pests in coffee include:
Pest Type Economic Injury .Level
• Antestia 2 per tree
• capsid bug 4 tree
• Berry borer 10 adults
• Leaf skeletonizers 20 per tree
• Giant loopers 10 on suckers,20 on adults
• Thrips 2 per leaf
• Leaf miner 35 moths per tree
• Scales 10% in inspected area
Economic injury level refers to the smallest number of insects (amount of injury) that will cause
yield losses equal to the insect management costs
Coffee Nutrition
Nutrients are classified into Micronutrients and Macronutrients.
Macronutrients are those nutrients required in large and sufficient amounts and as such their
availability in less quantities result in nutrient deficiency disorders.
Foliar Feeds
They supplement ground applied fertilizers as well as supply micronutrients especially Zinc, Boron
and magnesium.
24
They are beneficial especially to plants carrying a heavy crop and in situations where the plant is
unable to absorb nutrients especially in dry seasons. The foliar should be applied when the
temperatures are low to prevent berry and leaf scorching.
Manures in Coffee
Application of organic manure to coffee is of utmost importance because manure contains the
major nutrients required for plant growth.
Manure as well, increases microorganism activities in the soil thus promoting nutrient availability.
They suppress weeds and moderate soil temperatures. They also improve soil structure and
improve water percolation.
Manure should be applied at a rate of 1-2 debes2 per hole during planting and yearly on mature
trees. This will greatly improve the soil nutrient profile and increase coffee production immensely.
Coffee Harvesting
Coffee quality is made in the field through the various agronomic activities carried throughout the
growth stages till maturity. To maintain the quality of coffee, it is essential that all stages are
followed and carried out as per the recommended procedures. Coffee harvesting begins when the
berries begin to ripen by turning red over at least 75 % of the surface.
This is achieved approximately 8 months after first flowering. Picking is the first operation towards
processing as it entails the removal of the ripe cherries from the coffee trees for processing. It is
during picking that the initial standard for quality is maintained through selective picking and
sorting
2 Debe is a 20 litre can.
25
Coffee Processing
Coffee processing is a critical stage from a quality maintenance point of view. It involves a series
of stages each of which has a distinct purpose. Good cherries from the farm may be spoilt if
processing conditions are not properly managed. There are three methods of processing namely:
wet processing, dry processing and honey processing.
Wet processing method involves pulping of cherries, fermentation then drying. This method gives
better quality coffee and as such is the main method used in Kenya. It is so called because most
stages require use of water.
Dry processing is also known as “mbuni”3 drying. It involves harvesting and drying the cherries
without pulping.
The third method of processing is a new method that is being adopted in Kenya. Honey processing
involves only picking the perfectly ripe cherries which are pulped without water. The parchment
is then dried with the mucilage still fully attached.
2.3 Revenue Determination
Revenue was calculated as per the below:
Total yield per tree (kg of cherry) multiplied by Price per Kg of cherry
2.4 Cost of Production
In our case, the costs of production included all the farm level cash outflow costs, selling costs,
implicit costs for activities done by the farmer himself, the farmer’s time spent in the farm and the
interest income forgone by committing the capital resources into the farm, transport,
administrative, financing and security costs.
Cost of production goes with the scale of production derived from economies of size. Bigger farms
have advantages over smaller farms. However, due to scale drawbacks, it’s not easy to determine
the optimal size especially with the concept of diminishing returns that often affect large scale
farms.
3 Mbuni refers to the Cherries that are dried without the removal of the pulp

26
3.0 METHODOLOGY
3.1 Coffee Economic Viability Study Background
In order to be able to understand the question of coffee economic viability in Kenya, the Kenya
National Coffee Platform “Sauti ya Kahawa” commissioned a study to identify key areas for action
and identify agreed criteria to determine the cost of production and living income among coffee
farmers. The objective of the study was to identify and pilot key criteria to determine the cost of
production, profitability and living income among coffee farmers, which would be agreed among
Kenyan coffee stakeholders and endorsed by the Kenya National Coffee Platform, to be used as a
national standard for farm economy assessments and to inform further areas of action. This study
focused on coffee growers across the country.
3.2 Stakeholders’ Consultative Forum Consensus
According to Agriculture and Food Authority (AFA), the smallholders are about 570,000 farmers
(grouped into about 600 Farmer Co-operatives). An estimated 3,850 farmers are in coffee estates.
These smallholder farmers produced 27,230 metric tons of coffee out of 40,848. This was 65% of
the total Kenya coffee production in the year 2017.
It was agreed that the sample size would thus be composed of 65% farmer co-operatives and 35%
from estate farmers. The sample on farmer co-operatives would be further broken down into wet
mills from where the smallholder farmers to be sampled would be drawn. The sample used 3
criteria, sampling error being at 5% significant level and 95% confidence level meaning that 95
out of 100 samples would have the true population value within the range of our precision.
The following explains how the sample size was obtained.
The assumptions made were as follows:
• We do not know the variability in the proportion that will adopt the generic coffee farming
Good Agricultural Practices; therefore, assumed p=.5. (the maximum variability in a
population)
• The coffee growing farmers is a large population by the definition of Cochran (1963:75)
and hence uses his equation as below to determine a representative sample for proportions.
27
Where:
Equation 1: no = Z2pq
e2
n0 is the sample size
Z2is the abscissa of the normal curve that cuts off an area at the tails (1 - equals the desired
confidence level, e.g., 95%). The value for Z is found in statistical tables which contain the
area under the normal curve, e.g. Z = 1.96 for 95 % level of confidence
e is the desired level of precision implying the acceptable sampling error
p is the estimated proportion of an attribute that is present in the population
q is 1-p
A total of 540 farmers were sampled on stratified sampling method on the basis of 65 % for
smallholder and 35 % for estates. Each county was allocated a sample size based on the average
volumes produced and sold in the NCE for the previous 3 years. Each county sample size was
further grouped into estates and farmer co-operatives following the established ratio. Interviews
conducted randomly for each of the groups. This is to say that counties that had below 1% of the
three year average national production were not viable for the study. This formed part of the study
limitations.
The average national market price was based on clean coffee data obtained from the NCE market
reports for the season 2016/17. Cost of production for the wet mills was obtained from Producer
Crop Returns (PCRs) that are maintained by the wet mills and filed with the Ministry in charge of
Cooperatives.
It was also agreed that data collection would be done through face to face interviews, observations,
documents and records review.
4.0 DATA ANALYSIS AND FINDINGS
28
This report presents the results of the analysis of the data collected for the coffee economic study
in all coffee producing counties across the country in March 2018. This study consisted of in-
depth interviews with a target 540 coffee farming households. The primary counties in which the
sample was targeted are based on the contribution to the national production as shown in the
following figure:
Figure 4: National Production Distribution Overview
Source: Author’s Graphs using NCE data
The sampled estates, smallholders and wet mills were selected randomly in the respective counties.
The counties and the numbers of their coffee farmers actually surveyed and their percentage of the
respondents sampled is as follows:
5,636,151
4,325,876
4,286,369
4,066,928
2,466,772
2,200,006
1,755,288
1,372,517
747,363
655,572
557,244
522,362
437,048
320,299
130,945
87,296
48,581
47,717
31,217
20,811
Kiambu
Kirinyaga
Nyeri
Muranga
Kericho
Meru
Machakos
Kisii
Bungoma
Embu
Nakuru
Trans Nzoia
Tharaka Nithi
Kakamega
Nandi
Uasin Gishu
West Pokot
Baringo
Kisumu
Homabay

29
Figure 5: Coffee Growers Sampled in each County
A total of 495 respondents were interviewed in different counties in coffee growing areas.
However, after cleanup of the data the respondents whose information is used in data analysis is
as shown below:
56
72 71 72
38
1410
35
52
31 32
9
18
5
12
97
8474 73
38
1311
35
3 3
32 33
9
18
5
12
Nu
mb
er
of
Re
spo
nd
ed
nts
Achieved Response Rate Total Sampled Respondents

30
Table 3: Coffee Growers that participated in the Study
County Number of Smallholder farmers
Number of Estate farmers
Number of Wetmills
Achieved Response Rate
KIAMBU 26 27 3 56
MURANGA 48 21 3 72
NYERI 61 5 5 71
KIRINYAGA 66 2 4 72
MERU 32 2 4 38
EMBU 10 2 2 14
THARAKA NITHI 9 1 10
KERICHO 29 2 4 35
NANDI 2 1 2 5
UASHIN GISHU 1 1 2
MACHAKOS 26 1 4 31
KISII 26 2 4 32
TRANS NZOIA 4 3 2 9
BUNGOMA 13 2 3 18
KAKAMEGA 3 1 1 5
NAKURU 7 2 3 12
363 73 46 482
All participants selected for the study were growing coffee and indeed made a contribution to the
national coffee volumes as per the NCE transaction listing reports in the season 2016/17. Because
quantitative analyses alone cannot provide the in-depth understanding of the livelihood systems
employed by the coffee grower, this quantitative study is supplemented by a series of (qualitative)
discussions captured in the narrative sections of the report.
Given that this report represents results from the first round of data collection, it presents more of
a profile, or a snapshot at a point in time of the surveyed coffee growers rather than a detailed
analysis of changes over time. A more detailed analysis of change can inform future studies.
Nevertheless, this report captures some interesting findings and results have emerged from the data
analysis.
The interviews were conducted in a large number of randomly selected coffee growers in the
participating counties. Typically, farmers from various zones in the different counties were
31
interviewed. The data presented here represents a profile or a snapshot at a point in time of the
interviewed coffee growers rather than an analysis of changes that have taken place.
A map of Kenya showing the coffee growing areas in Kenya is presented in Figure 6 below.
Figure 6: Map of Coffee Growing Areas in Kenya
4.1 Site Selection and Sampling
The counties where interviews were to be conducted were agreed upon. The decision on how
many farmers to sample in each county was based on their contribution to the national volumes as
32
available in the Nairobi Coffee Exchange (NCE) 2016/17 Report. In each of the counties, the
coffee growers to be interviewed were randomly selected.
The farmers selected in the sample met the following criteria:
a. Must be a coffee producer.
b. Must be active i.e. have contributed to the national volume in season 2016/17.
c. Must be a member of the society for smallholders.
d. Must have delivered coffee to the respective FCS.
4.2 Data Collection and Analysis
After the respondents were identified, questionnaires were administered by the enumerators
capturing various areas of interest. The data collection was carried out between 26th February 2018
and 16th March 2018 on the targeted 540 coffee growers across all coffee growing counties of
Kenya. The data was entered, edited and analyzed using Microsoft Excel and is presented in
various forms such as graphs, tables, pie charts and others in this report.
Some of the conventions used throughout this report include the following:
• For ease of reviewing some of the results, percentages in figures and tables of results are usually
rounded off to the nearest whole percent. This means that occasionally the sum of percentages
in a table row or column or discussion in the text will not add up to exactly 100%
• Unless otherwise explicitly stated, missing cases and clearly erroneous outliers have been
excluded from the tables and figures. There are two reasons for this: (1) to avoid statistical
distortion of the results due to unrealistically large and/or small values and; (2) to improve the
clarity and details in some figures by reducing the ranges of the data considered. The
accompanying narrative indicates the ranges of the variables considered as being valid as well
as the number and/or percentage of the total number of surveyed coffee growers (540) that are
represented in these tables and figures.
• Some other numbers presented in the various tables throughout this report that have smaller
magnitudes may also be rounded off to either the nearest whole number or nearest one-tenth
percent unless otherwise stated.
• In order to protect the proprietary and confidential data of the Farmers, the vast majority of the
data presented in this report have not been disaggregated by farmer units.

33
4.3 Results and Findings
The respondents (coffee growers) were sampled from various counties across all the coffee
growing counties of Kenya where the survey was conducted.
The remainder of this report is organized into sections, where each section presents the analysis of
the baseline data relating to various aspects of interest. These sections and their subjects are as
follows:
▪ Section 4.3.1 - 4.3.4: Social Economic and Demographic Characteristics
▪ Section 4.3.5 - 4.3.8: Production revenues and costs
▪ Section 4.3.9: Sensitivity Analysis
4.3.1 Age of the Farmers
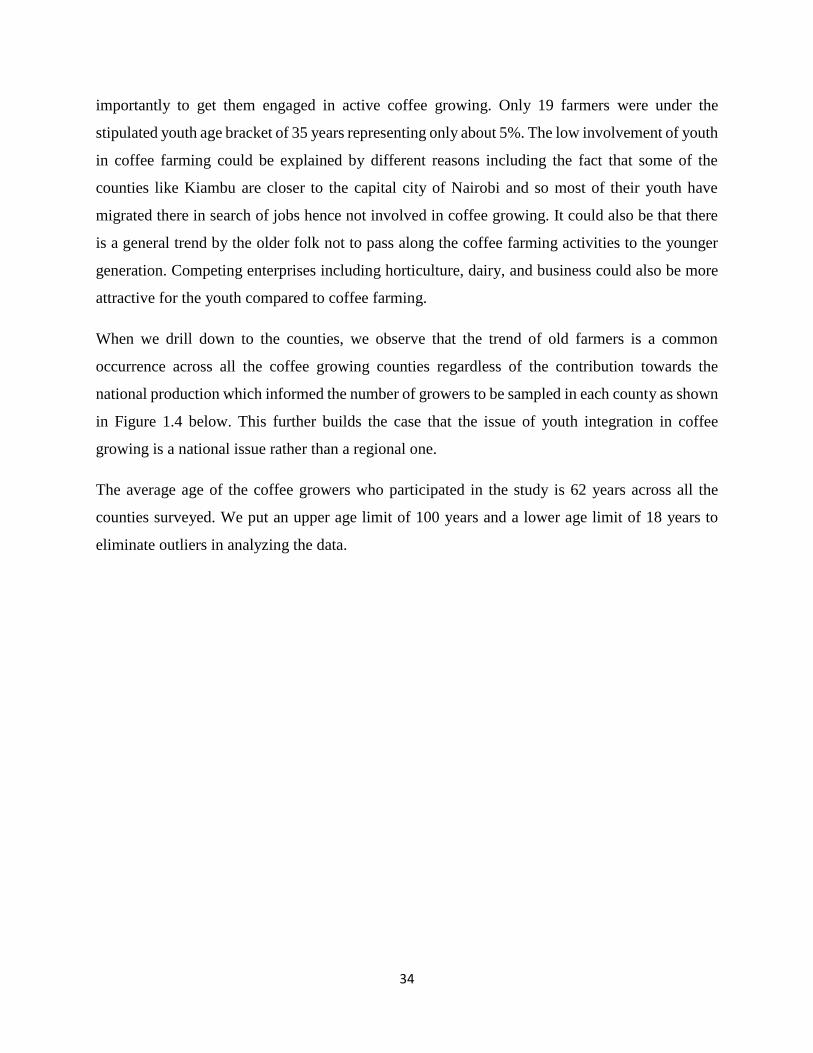
Figure 7: Age Distribution of Coffee Growers Surveyed by Percentage
Out of the 363 smallholder farmers surveyed, 177 farmers were above 60 years (the government
retirement age) which represents about 49%. This is not a surprising trend as coffee is popularly
known as “an old man’s crop”. It is also in line with earlier project literature review that indicated
that very few youth are involved in coffee growing. However, this data reaffirms the great need
for youth engagement and integration interventions to generate interest in coffee and more
5%
46%49%
18-35 35-60 >61
34
importantly to get them engaged in active coffee growing. Only 19 farmers were under the
stipulated youth age bracket of 35 years representing only about 5%. The low involvement of youth
in coffee farming could be explained by different reasons including the fact that some of the
counties like Kiambu are closer to the capital city of Nairobi and so most of their youth have
migrated there in search of jobs hence not involved in coffee growing. It could also be that there
is a general trend by the older folk not to pass along the coffee farming activities to the younger
generation. Competing enterprises including horticulture, dairy, and business could also be more
attractive for the youth compared to coffee farming.
When we drill down to the counties, we observe that the trend of old farmers is a common
occurrence across all the coffee growing counties regardless of the contribution towards the
national production which informed the number of growers to be sampled in each county as shown
in Figure 1.4 below. This further builds the case that the issue of youth integration in coffee
growing is a national issue rather than a regional one.
The average age of the coffee growers who participated in the study is 62 years across all the
counties surveyed. We put an upper age limit of 100 years and a lower age limit of 18 years to
eliminate outliers in analyzing the data.

35
Figure 8: Average Age by County
4.3.2 Gender and Coffee Growers
Coffee is pre-dominantly considered a male crop and the results of the baseline survey seem to
support this hypothesis as shown in Figure 9. Although women and youth provide most of the
labour on the coffee farms, ownership and decision making remain with the male in the household.
As highlighted in the literature review, women have been excluded in areas of training, leadership
positions and decision making. This has resulted in a big gap between training and implementation
resulting in low rates of adoption of Good Agricultural Practices. Most of the studies also noted
that there is a positive correlation between women and productivity and therefore recommends
women inclusion in coffee farming or employment of the household approach.
63
64
59
68
56
66
68
64
57
60
51
59
56
53
51
58
Kiambu
Kirinyaga
Nyeri
Muranga
Kericho
Meru
Machakos
Kisii
Bungoma
Embu
Nakuru
Trans Nzoia
Tharaka Nithi
Kakamega
Nandi
Uasin Gishu
Average Age ( Years )
Co
un
ty

36
Figure 9: Gender of Coffee Growers who participated in the Study
Only about 17 percent of all respondents interviewed across the coffee growing counties and across
estates and smallholders are female. This is in line with the literature review on gender in the coffee
sector that shows low women involvement. There were only 2 female estate owners from the total
73 estates interviewed which is only about 3% as shown in Fig 10. This could be explained by the
fact that most estates are passed on to the next generation and with a patrilineal inheritance system
then the estates tend to be passed onto the sons. Among the smallholder coffee growers
interviewed, 20% were female. This could be explained by the fact that for the smallholders, we
used the member registration documents at the cooperatives level. In some household the male
work away from home so the women are the ones who have a member number in the cooperative.
Also, there are a number of widows who have taken up the numbers of their spouses at the
cooperatives. Based on these observations, the higher number among smallholders should be
understood as growing and delivering coffee at the cooperative and not necessary an indicator to
coffee farm ownership.
83%
17%
Male
Female

37
Figure 10: Gender Distribution across different Farmer Archetypes
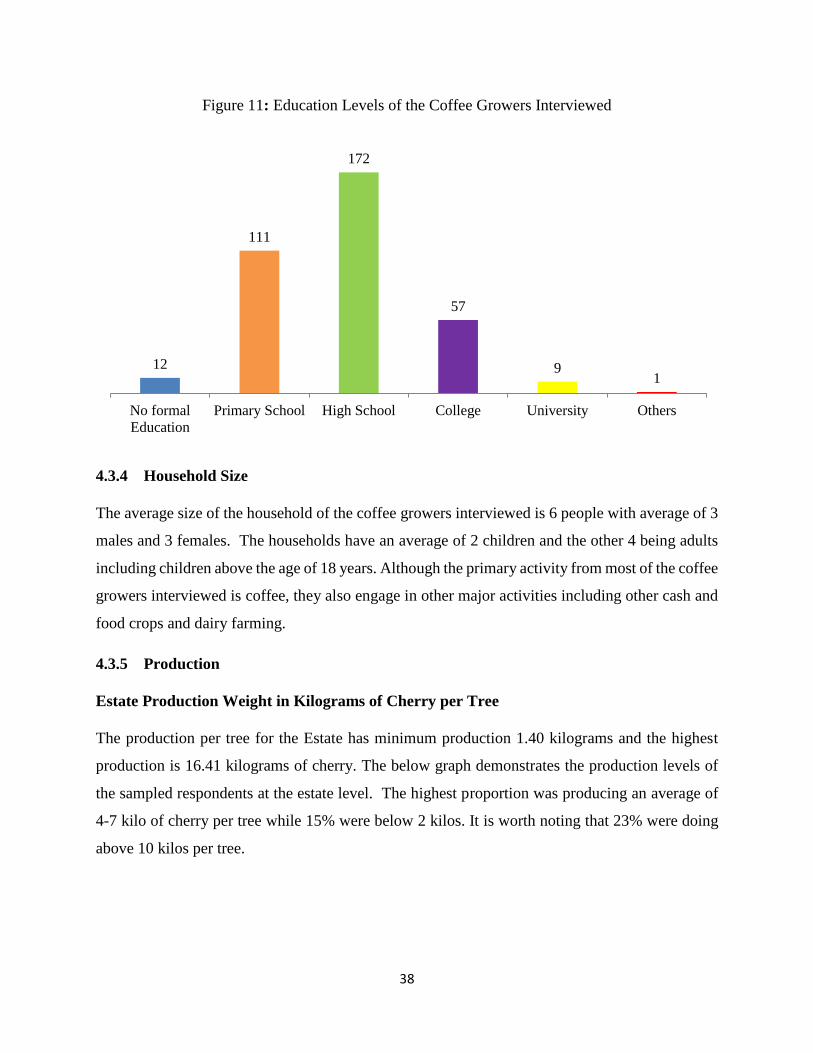
4.3.3 Level of Education
The education level of the head of the household could have a significant impact on their ability
to profitably run a coffee farming business .This may be due to their literacy level (their ability to
assimilate written manuals and other materials). Other factors may explain the strong correlation
seen between their education level and the impacts of a project on their specific household. The
coffee viability study interview asked about the highest educational achievement by respondent.
These results are presented in Figure 11 and show that, most of the farmers interviewed (66%)
have attained basic education which is the secondary school level as currently set by the
government of Kenya.
97%
3%Estates
80%
20%
Smallholders
Male
Female
38
Figure 11: Education Levels of the Coffee Growers Interviewed
4.3.4 Household Size
The average size of the household of the coffee growers interviewed is 6 people with average of 3
males and 3 females. The households have an average of 2 children and the other 4 being adults
including children above the age of 18 years. Although the primary activity from most of the coffee
growers interviewed is coffee, they also engage in other major activities including other cash and
food crops and dairy farming.
4.3.5 Production
Estate Production Weight in Kilograms of Cherry per Tree
The production per tree for the Estate has minimum production 1.40 kilograms and the highest
production is 16.41 kilograms of cherry. The below graph demonstrates the production levels of
the sampled respondents at the estate level. The highest proportion was producing an average of
4-7 kilo of cherry per tree while 15% were below 2 kilos. It is worth noting that 23% were doing
above 10 kilos per tree.
12
111
172
57
91
No formal
Education
Primary School High School College University Others
39
Figure 12: Estate Production Weight per Tree
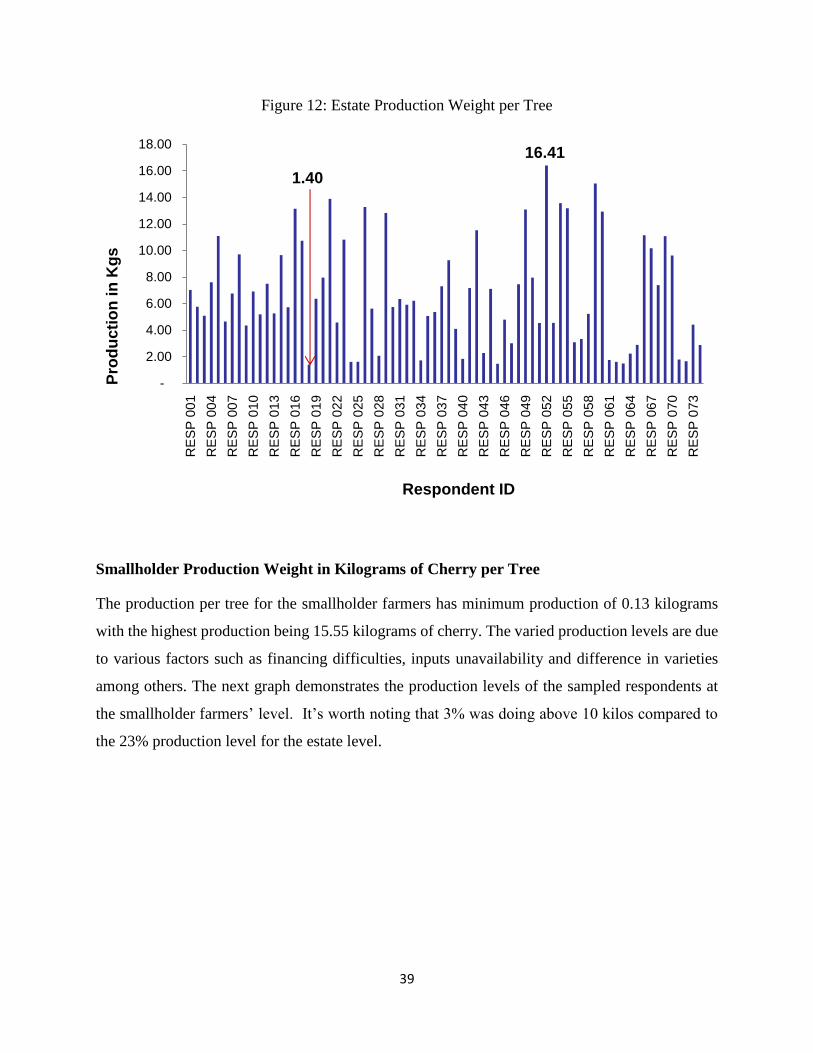
Smallholder Production Weight in Kilograms of Cherry per Tree
The production per tree for the smallholder farmers has minimum production of 0.13 kilograms
with the highest production being 15.55 kilograms of cherry. The varied production levels are due
to various factors such as financing difficulties, inputs unavailability and difference in varieties
among others. The next graph demonstrates the production levels of the sampled respondents at
the smallholder farmers’ level. It’s worth noting that 3% was doing above 10 kilos compared to
the 23% production level for the estate level.
1.40
16.41
-
2.00
4.00
6.00
8.00
10.00
12.00
14.00
16.00
18.00
RE
SP
001
RE
SP
004
RE
SP
007
RE
SP
010
RE
SP
013
RE
SP
016
RE
SP
019
RE
SP
022
RE
SP
025
RE
SP
028
RE
SP
031
RE
SP
034
RE
SP
037
RE
SP
040
RE
SP
043
RE
SP
046
RE
SP
049
RE
SP
052
RE
SP
055
RE
SP
058
RE
SP
061
RE
SP
064
RE
SP
067
RE
SP
070
RE
SP
073
Pro
du
cti
on
in
Kg
s
Respondent ID

40
Figure 13: Smallholder Production Weight per Tree
4.3.6 Cost of Production
Average Production Cost for Estate Farmers
The production costs have labour cost components (pruning, weed control and picking) as the main
cost components for both estates and smallholder farmers. The estates have additional costs being
administration and processing costs forming part of major costs for the estates but not found in the
smallholder farms. The cost components are on average moving down depending on production
level for both estate and smallholder farmers.
From the raw data, the cost of production per kilogram of cherry had a high of KShs. 96.52 and a
low of KShs. 30.48 for the estate farmers. The variations in the costs are due to different farming
scales. Estate farmers are categorized in small, medium and large estates. They thus have varied
levels of adoption of Good Agricultural Practices. Other factors include labour, input costs, coffee
varieties among others.
0.13
15.55
-
2.00
4.00
6.00
8.00
10.00
12.00
14.00
16.00
18.00
RE
SP
00
1
RE
SP
01
0
RE
SP
01
9
RE
SP
02
8
RE
SP
03
7
RE
SP
04
6
RE
SP
05
5
RE
SP
06
4
RE
SP
07
3
RE
SP
08
2
RE
SP
09
1
RE
SP
10
0
RE
SP
10
9
RE
SP
11
8
RE
SP
12
7
RE
SP
13
6
RE
SP
14
5
RE
SP
15
4
RE
SP
16
3
RE
SP
17
2
RE
SP
18
1
RE
SP
19
0
RE
SP
19
9
RE
SP
20
8
RE
SP
21
7
RE
SP
22
6
RE
SP
23
5
RE
SP
24
4
RE
SP
25
3
RE
SP
26
2
RE
SP
27
1
RE
SP
28
0
RE
SP
28
9
RE
SP
29
8
RE
SP
30
7
RE
SP
31
6
RE
SP
32
5
RE
SP
33
4
RE
SP
34
3
RE
SP
35
2
RE
SP
36
1
Pro
du
cti
on
in
Kg
s
Respondent ID
41
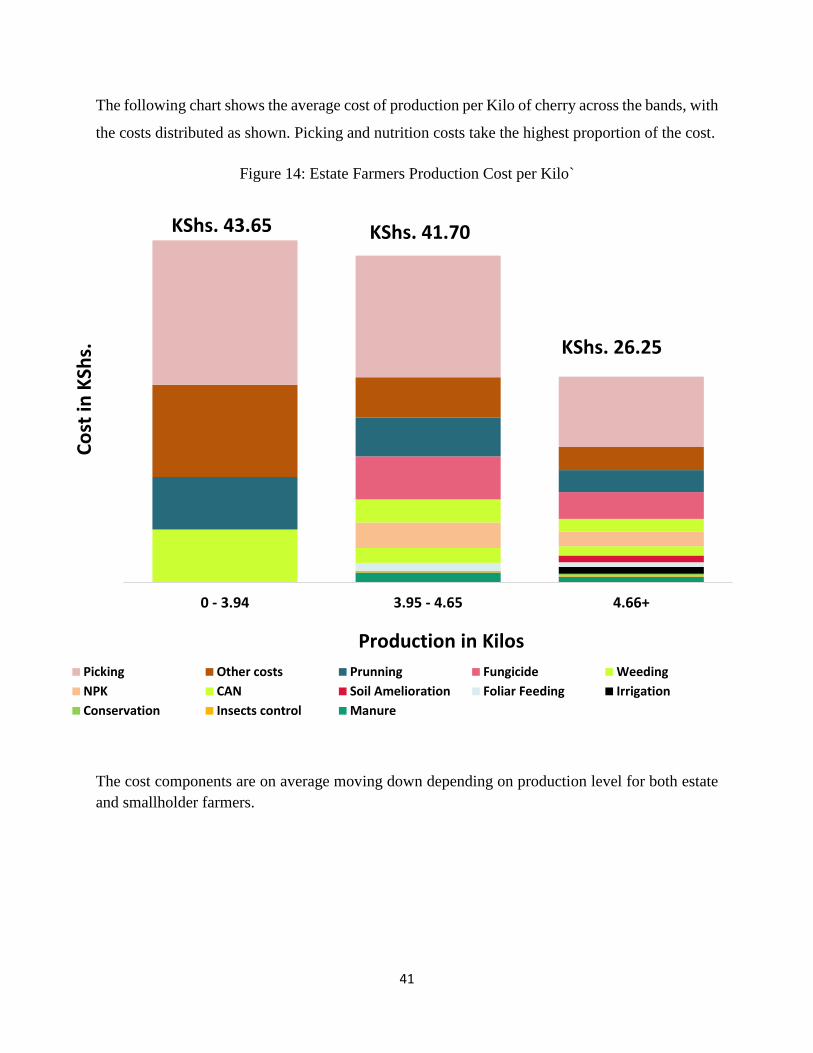
The following chart shows the average cost of production per Kilo of cherry across the bands, with
the costs distributed as shown. Picking and nutrition costs take the highest proportion of the cost.
Figure 14: Estate Farmers Production Cost per Kilo`
The cost components are on average moving down depending on production level for both estate
and smallholder farmers.
0 - 3.94 3.95 - 4.65 4.66+
Picking Other costs Prunning Fungicide Weeding
NPK CAN Soil Amelioration Foliar Feeding Irrigation
Conservation Insects control Manure
Co
st in
KSh
s.
Production in Kilos
KShs. 43.65 KShs. 41.70
KShs. 26.25

42
Average Production Cost for Smallholder Farmers
Cost factors include labour, input costs, coffee varieties among others. The below chart shows the
average cost of production per kilo of cherry across the bands, with the costs distributed as shown.
However, the bulk of the costs are in picking. From the below, the smallholder farmers seem not
to invest much in pest and disease control and nutrition.
Figure 15: Smallholder Farmers Production Cost per Tree
The cost components are on average moving down depending on production level for both estate
and smallholder farmers.
0 - 1.28 1.29 - 2.53 2.54+
Picking Weeding Prunning Fungicide CAN
NPK Manure Foliar Feeding Insect Control Financing Costs
Production in Kilos
KShs. 91.16
KShs. 29.46
KShs. 42.09
43
In general, the cost of production for both categories will vary based on various factors among
them:
• Levels of adoption of Good Agricultural Practices
• Cost of labour
• Cost of input
• Coffee varieties
• Level of productivity ( Higher production = lower cost per unit )
• Level of farm management efficiency among others
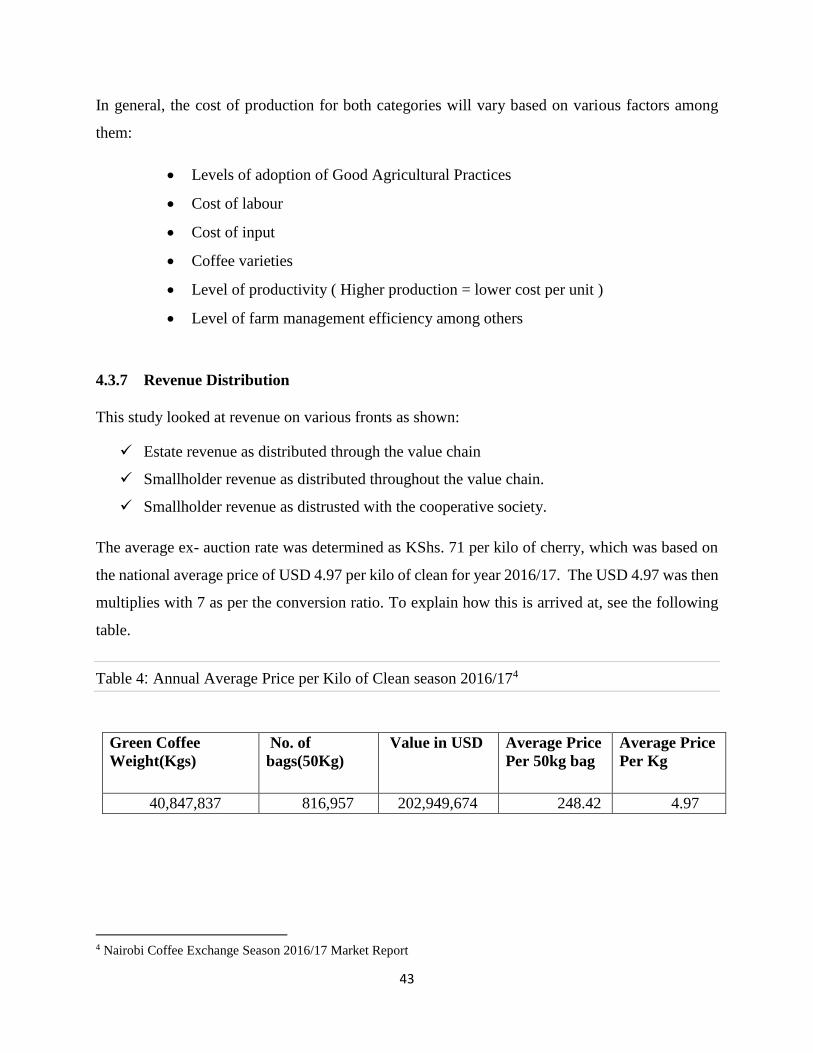
4.3.7 Revenue Distribution
This study looked at revenue on various fronts as shown:
✓ Estate revenue as distributed through the value chain
✓ Smallholder revenue as distributed throughout the value chain.
✓ Smallholder revenue as distrusted with the cooperative society.
The average ex- auction rate was determined as KShs. 71 per kilo of cherry, which was based on
the national average price of USD 4.97 per kilo of clean for year 2016/17. The USD 4.97 was then
multiplies with 7 as per the conversion ratio. To explain how this is arrived at, see the following
table.
Table 4: Annual Average Price per Kilo of Clean season 2016/174
Green Coffee
Weight(Kgs)
No. of
bags(50Kg)
Value in USD Average Price
Per 50kg bag
Average Price
Per Kg
40,847,837 816,957 202,949,674 248.42 4.97
4 Nairobi Coffee Exchange Season 2016/17 Market Report
44
This amount was distributed throughout the value chain to determine what the different farmer
archetypes take home.
Figure 16: Revenue Distribution in Kenya Shillings per Kilo of Cherry
The total revenue of KShs. 71 was distributed throughout the value chain with the farmer being
left with KShs. 53.75 after taking care of processing and administrative costs at the society and
wet mill level.
As explained in the literature review, all smallholder farmers aggregate their coffee at the wet mill
thus the smallholder revenue may be looked at from two perspectives; value chain perspective and
the society level perspective as shown in the graph above.
Value Chain Wet Mill Estates1.25
1.25
2.56 2.56
67.19 67.19
67.19
9.10 9.10 3.53
4.33 4.33
21.2
53.75 53.75
42.46
Net paid to Farmers
Total Administration
cost
Total Factory
Processing cost
Net paid to FCS
Marketing Costs
Total Milling costs
45
From the value chain perspective, it was observed that the marketing revenue (this included milling
component) was only KShs3.86. This left a total of KShs. 67.19 that was transferred to the society
level. However, the farmer received KShs. 53.75, with a difference of KShs. 13.43 being retained
in the society/wet mill level.
From the society perspective, it was observed that the society received KShs. 67.19 which it shared
to administration and factory expenses before distributing the rest (KShs. 53.75) to the farmer. The
retained amount KShs. 13.43 was shared between the two functional costs such that administration
cost received KShs. 4.33 while factory expenses shared KShs. 9.10.
For estate farmers they still have to pay the marketing and milling costs thus after the amount
was distributed throughout the value chain with the estate farmer being left with KShs. 42.46 after
taking care of processing and administrative costs that include cost of security and financing.
Although the processing costs are much lower for estates, their administration costs seem to offset
this gain so they earn less per kilo of cherry compared to the smallholder farmers. However, due
their huge volumes, their total income is much higher for the individual farmer.
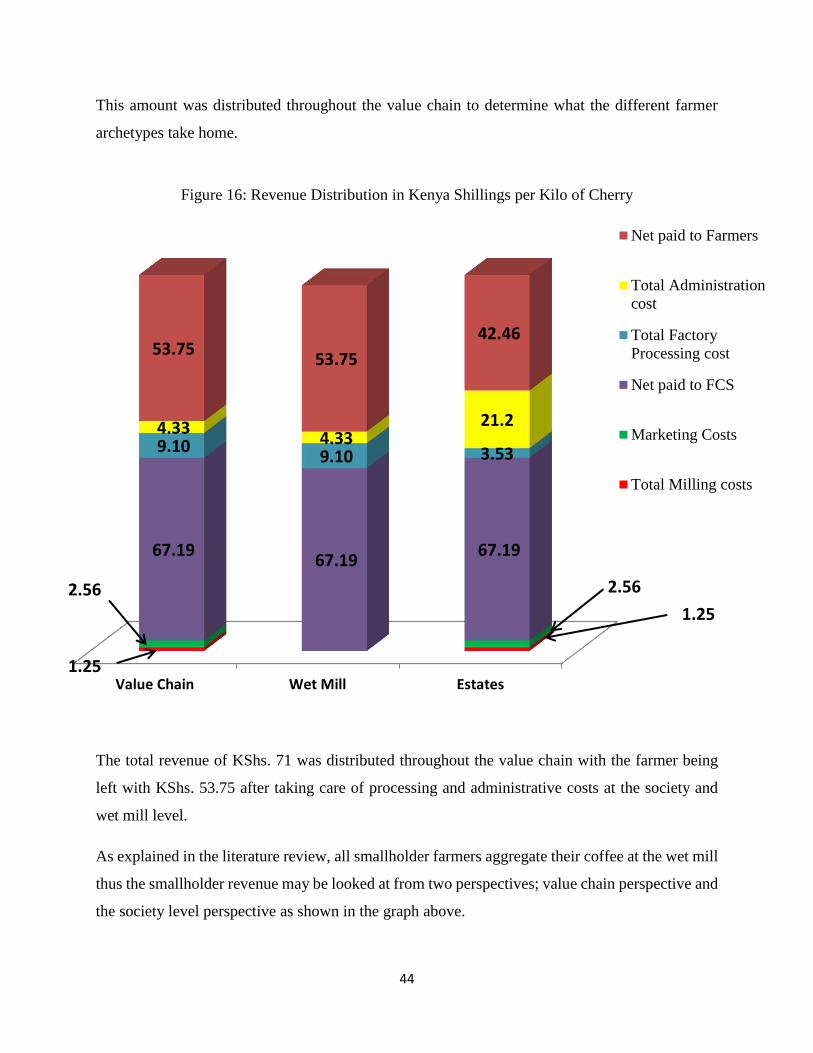
4.3.8 The Breakeven Points
The Breakeven Point for Estate Farmers
The breakeven per tree for the estate farmer is 3.94 kilo grams. Farmers will make losses while
producing anything below 3.94 Kgs of cherry per tree. Above this production, on average, the
farmers shall be making profits.

46
Figure 17: Breakeven Point for Estate Farmers
The Breakeven Point for Smallholder Farmers
The Breakeven per tree for the smallholder farmer is 1.28 kilo grams. Farmers will make losses
while producing anything below 1.28 Kgs of Cherry per tree. Above this production, on average,
the farmers shall be making profits.
Figure 18: Breakeven Point for Smallholder Farmers
y = 0.2532x - 0.3235
-150%
-75%
0%
75%
150%
225%
300%
375%
450%
- 2.00 4.00 6.00 8.00 10.00 12.00 14.00 16.00 18.00
Small Holder Farmers Break Even Point Margin %
Production per tree in
BEP:
1.28 Kgs per tree
47
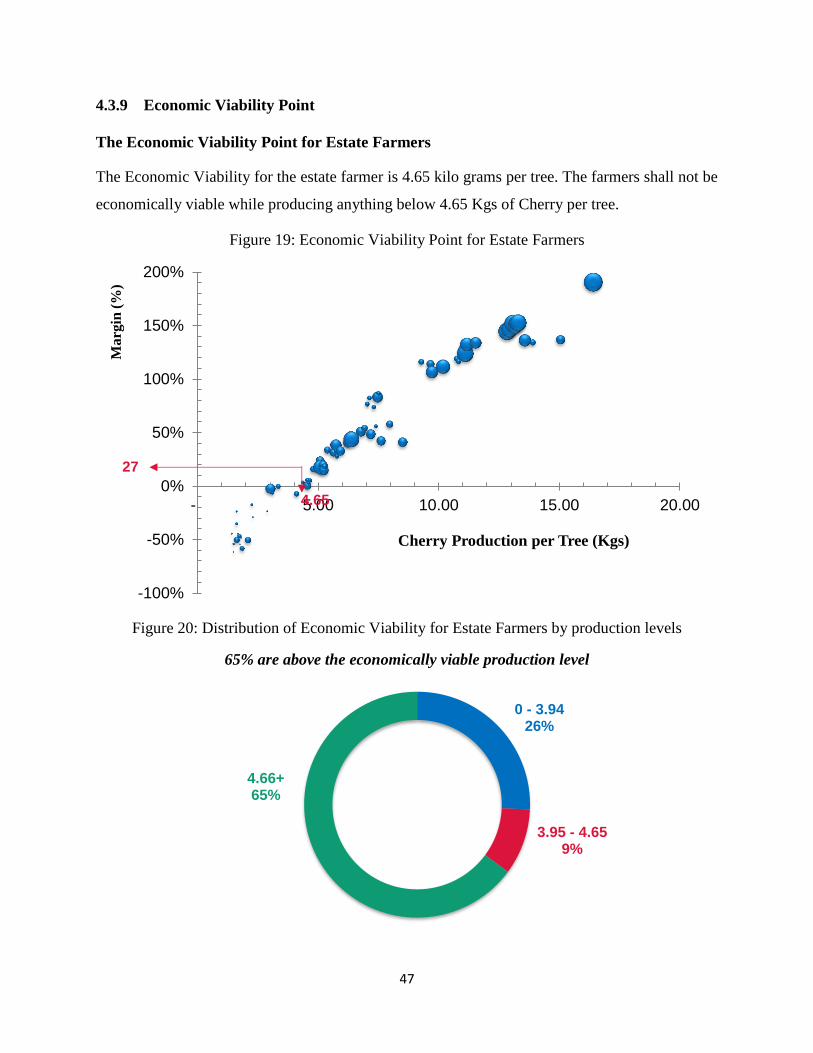
4.3.9 Economic Viability Point
The Economic Viability Point for Estate Farmers
The Economic Viability for the estate farmer is 4.65 kilo grams per tree. The farmers shall not be
economically viable while producing anything below 4.65 Kgs of Cherry per tree.
Figure 19: Economic Viability Point for Estate Farmers
Figure 20: Distribution of Economic Viability for Estate Farmers by production levels
-100%
-50%
0%
50%
100%
150%
200%
- 5.00 10.00 15.00 20.00
Ma
rgin
(%
)
Cherry Production per Tree (Kgs)
4.65
27
0 - 3.9426%
3.95 - 4.659%
4.66+65%
65% are above the economically viable production level
48
The Economic Viability Point for Smallholder Farmers
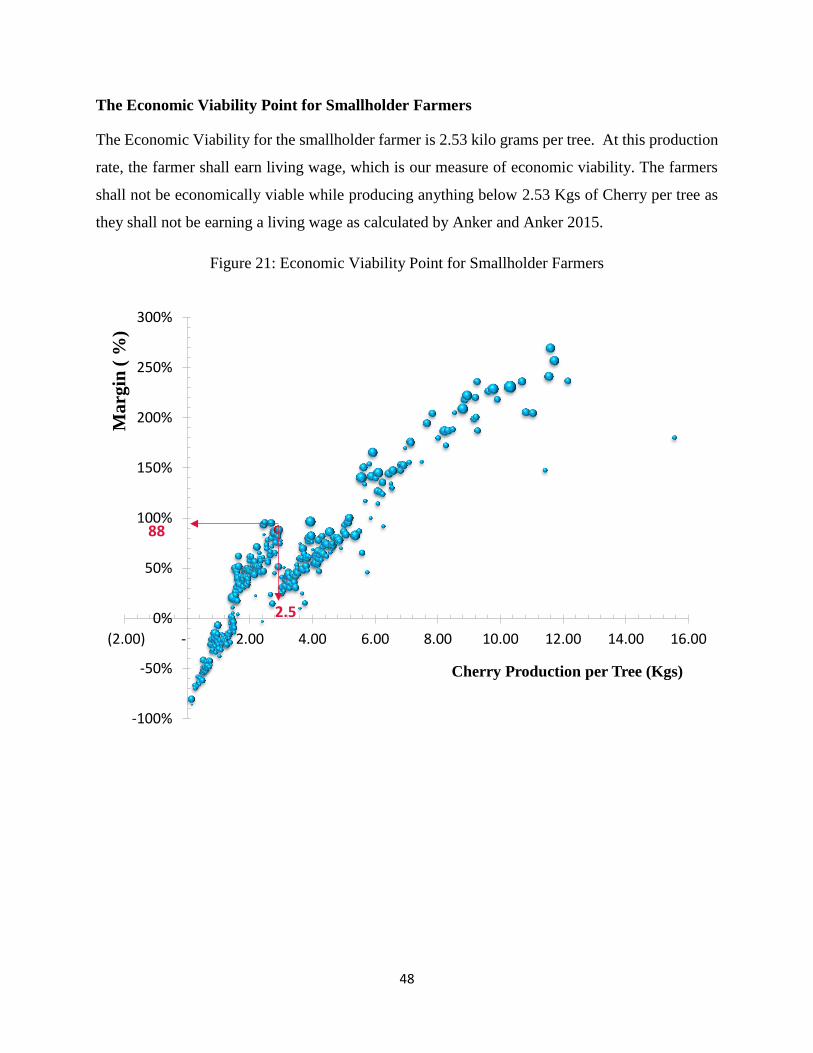
The Economic Viability for the smallholder farmer is 2.53 kilo grams per tree. At this production
rate, the farmer shall earn living wage, which is our measure of economic viability. The farmers
shall not be economically viable while producing anything below 2.53 Kgs of Cherry per tree as
they shall not be earning a living wage as calculated by Anker and Anker 2015.
Figure 21: Economic Viability Point for Smallholder Farmers
-100%
-50%
0%
50%
100%
150%
200%
250%
300%
(2.00) - 2.00 4.00 6.00 8.00 10.00 12.00 14.00 16.00
Ma
rgin
( %
)
Cherry Production per Tree (Kgs)
2.5
88

49
Figure 22: Distribution of Economic Viability for Smallholder Farmers by production levels
4.3.10 The Wet Mill Perspective
There were a total of 46 wet mills that participated in the study from all the coffee growing regions
in the country as shown below:
Figure 23: Number of Wet mills Interviewed per County
0 - 1.2822%
1.29 - 2.5328%
2.54+49%
Close to 50% are above economically viable production level
3 3
5
4 4
2
1
4
2
1
4 4
2
3
1
3
50
Information was collected and analyzed from the participating wet mills through a questionnaire
administered by the field team. The data was then analyzed and used to corroborate data gathered
from the smallholder farmers. The wet mill data was also used to identify other factors that affect
the handling of the coffee once it leaves the farms and that affect the final payment that the farmer
receives.
a) Membership Details `
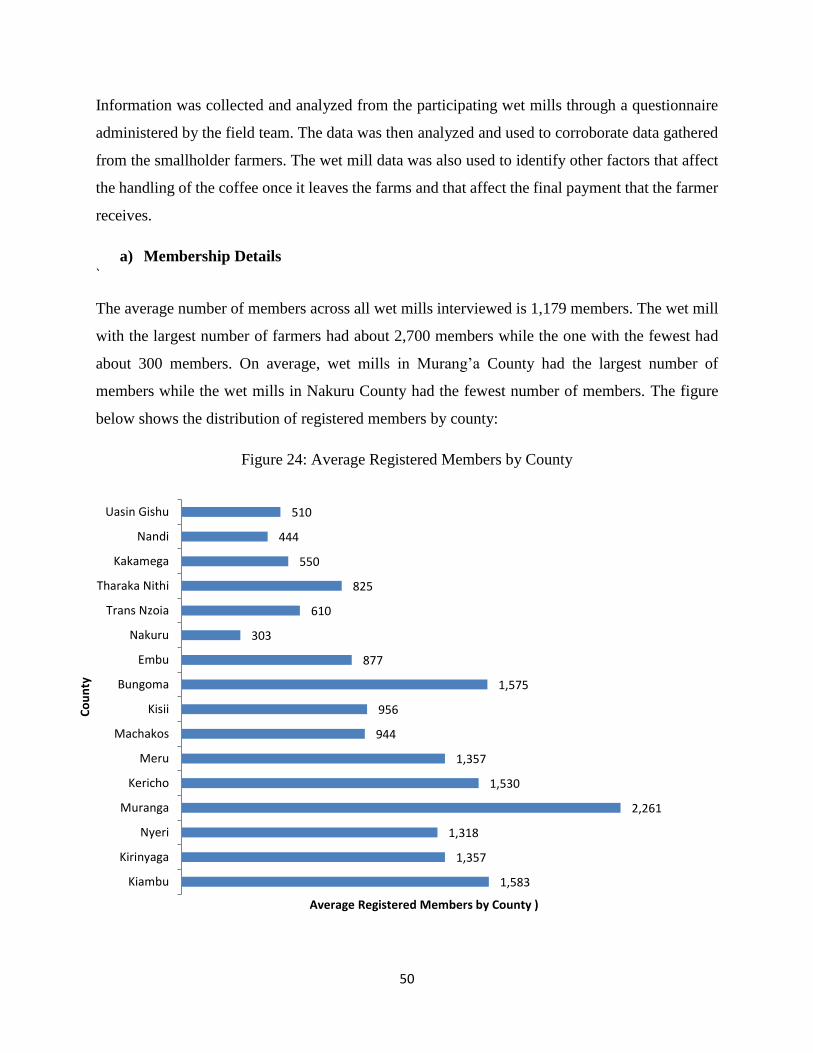
The average number of members across all wet mills interviewed is 1,179 members. The wet mill
with the largest number of farmers had about 2,700 members while the one with the fewest had
about 300 members. On average, wet mills in Murang’a County had the largest number of
members while the wet mills in Nakuru County had the fewest number of members. The figure
below shows the distribution of registered members by county:
Figure 24: Average Registered Members by County
1,583
1,357
1,318
2,261
1,530
1,357
944
956
1,575
877
303
610
825
550
444
510
Kiambu
Kirinyaga
Nyeri
Muranga
Kericho
Meru
Machakos
Kisii
Bungoma
Embu
Nakuru
Trans Nzoia
Tharaka Nithi
Kakamega
Nandi
Uasin Gishu
Average Registered Members by County )
Co
un
ty
51
b) Active Members
Further analysis of the membership revealed that there is a high number of members who are
inactive across all the participating wet mills. About 25% of members registered are inactive
meaning they have not delivered coffee to the wet mills in the last 3 years. This could explain why
the number of coffee smallholder farmers is high yet the coffee volume is declining. This also
informs a need for further study to dig deeper into the reasons this high percentage is inactive.
Some counties had the active number of members averaging more than 90% of the registered
members being active in Kisii/Nyamira, Nandi, Kericho and Kakamega while Kiambu County had
the lowest number of active members out of all registered members at 58%. The following is a
figure showing the distribution of active members by county.

52
Figure 25: Active Member VS Registered Members by County
1,583
1,357 1,318
2,261
1,530
1,357
944 956
1,575
877
303
610
825
550 444 510
917
1,064 1,082
1,432 1,428
1,214
711
912
1,243
542
267
428
648
510400 438
Registered Members Active Members

53
c) Gender
The membership data shows an average of 70% of members are men and 30% are women.
According to the membership details from the wet mills the gender gap seemed to close compared
to the data collected from the smallholder farmers which indicated 83% of the farmers are men
and only 17% are women which could be an indication that there has been a significant effort on
the membership registration end to include women. This could also be an indication of gains on
policy as the constitution (2010) which has the 1/3 gender rule.
Figure 26: Gender of Wet mill Members
d) Revenue Retention
Wet mills aggregate farmers’ coffee for wet milling and drying after which the coffee is taken to
millers for dry milling and grading. The coffee is then sold through the auction or direct channels
as provided for by the law. Once the coffee is sold the marketing agent remits proceeds within 14
days. The cooperative then work out what each wet mill has been paid and how much each of the
members should receive after deducting any debts and other obligations that the wet mill has. They
also retain up to 20% as stipulated by law towards the wet mill operations. From the data collected
the average revenue retention rate across all participating wet mills is 18% with the wet mill
70%
30%
Male
Female

54
retaining the least being 5% and one retaining the most being at 39%. The distribution of the
retention percentages across the respondent is as shown below:
Most wet mills retain 18% as shown in the normal distribution curve below:
Figure 27: Distribution of Revenue Retention Rate
About 72% of the wet mills remained within the stipulated 20% retention by the ministry. Only
13 wet mills retained more than 20%. Impressively 12 out of the 46 wet mills were retaining less
than 10% for their operations. This could be an indicator of high levels of efficient, good
production and good governance.
e) Revenue Pay-out
Most farmers (72%) from the wet mills interviewed received more than 20% of the revenue
realized according to the wet mill data collected. However, about 28% of the wet mills paid out
less than the 20% stipulated by the Ministry. With the lowest wet mill paying out at 61% as
shown in the graph below:
18%
0% 5% 10% 15% 20% 25% 30% 35% 40% 45%

55
Figure 28: Pay-out Rate across Wet Mills
4.3.11 Sensitivity Analysis
i) Understanding Factors affecting Pay Out
The pay-out rate is determined by various factors including volume, quality, market trends and governance among other factors. To best
understand these factors, we took the payment calculation documents and conducted sensitivity analysis with data from the participating
wet mills presented in section that follows.
89%
95%91%
82%
61%
91%88%
95%
69%
75%
92%
83%81%79%
63%63%
80%
95%
85%81%
71%
82%
88%87%91%91%
75%
81%80%81%82%
91%
75%
63%
85%
91%88%
92%
63%
80%81%
91%
81%79%81%
71%
Re
spo
nd
e…
Re
spo
nd
e…
Re
spo
nd
e…
Re
spo
nd
e…
Re
spo
nd
e…
Re
spo
nd
e…
Re
spo
nd
e…
Re
spo
nd
e…
Re
spo
nd
e…
Re
spo
nd
e…
Re
spo
nd
e…
Re
spo
nd
e…
Re
spo
nd
e…
Re
spo
nd
e…
Re
spo
nd
e…
Re
spo
nd
e…
Re
spo
nd
e…
Re
spo
nd
e…
Re
spo
nd
e…
Re
spo
nd
e…
Re
spo
nd
e…
Re
spo
nd
e…
Re
spo
nd
e…
Re
spo
nd
e…
Re
spo
nd
e…
Re
spo
nd
e…
Re
spo
nd
e…
Re
spo
nd
e…
Re
spo
nd
e…
Re
spo
nd
e…
Re
spo
nd
e…
Re
spo
nd
e…
Re
spo
nd
e…
Re
spo
nd
e…
Re
spo
nd
e…
Re
spo
nd
e…
Re
spo
nd
e…
Re
spo
nd
e…
Re
spo
nd
e…
Re
spo
nd
e…
Re
spo
nd
e…
Re
spo
nd
e…
Re
spo
nd
e…
Re
spo
nd
e…
Re
spo
nd
e…
Re
spo
nd
e…
Lowest, 61%
Highest, 95.28%

56
Table 5: Pay Out comparison across Wet Mills
Wet mill 1 Wet mill 2 Wet mill 3 Wet mill 4 TOTAL
Cherry (Kgs) 458,355 281,722 266,083 117,361 1,123,521
Sales of Clean Coffee (Kgs) 74,268 43,583 41,716 17,399 176,966
Conversion Ratio 6.17 6.46 6.38 6.75 6.35
Revenue
Sales of Clean Coffee (KShs.) 50,944,136 30,172,544 27,965,136 11,600,482 120,682,298
Average Price per Kg Cherry 111.15 107.10 105.10 98.84 107.41
Average Price per Kg Clean 685.95 692.30 670.37 666.73 681.95
Expenditure
Marketing Expenditure 2,435,326 1,482,420 1,368,600 587,796 5,874,142
Factory Expenditure 3,676,409 2,600,966 2,395,128 1,556,913 10,229,416
Administration 11,346,611 6,181,967 5,776,105 2,140,576 25,445,259
Total expenditure 17,458,346 10,265,353 9,539,833 4,285,285 41,548,817
Amount for distribution 33,485,790 19,907,191 18,425,303 7,315,197 79,133,481
Pay-out (KShs. per Kg Cherry) 73.06 70.66 69.25 62.33 70.43
Pay-out rate 65.73% 65.98% 65.89% 63.06% 65.57%
Cost Allocations
Marketing Expenditure 4.78% 4.91% 4.89% 5.07% 4.87%
Factory Expenditure 7.22% 8.62% 8.56% 13.42% 8.48%
Administration Expenditure 22.27% 20.49% 20.65% 18.45% 21.08%
Sensitivity Analysis:
Recommended 80% 88.92 85.68 84.08 79.08 85.93
Additional amount to the farmer 15.86 15.02 14.83 16.74 15.50
Benchmarked to neighbours at 85% 94.47 91.04 89.33 84.02 91.30
Additional amount to farmers 21.42 20.37 20.09 21.69 20.87
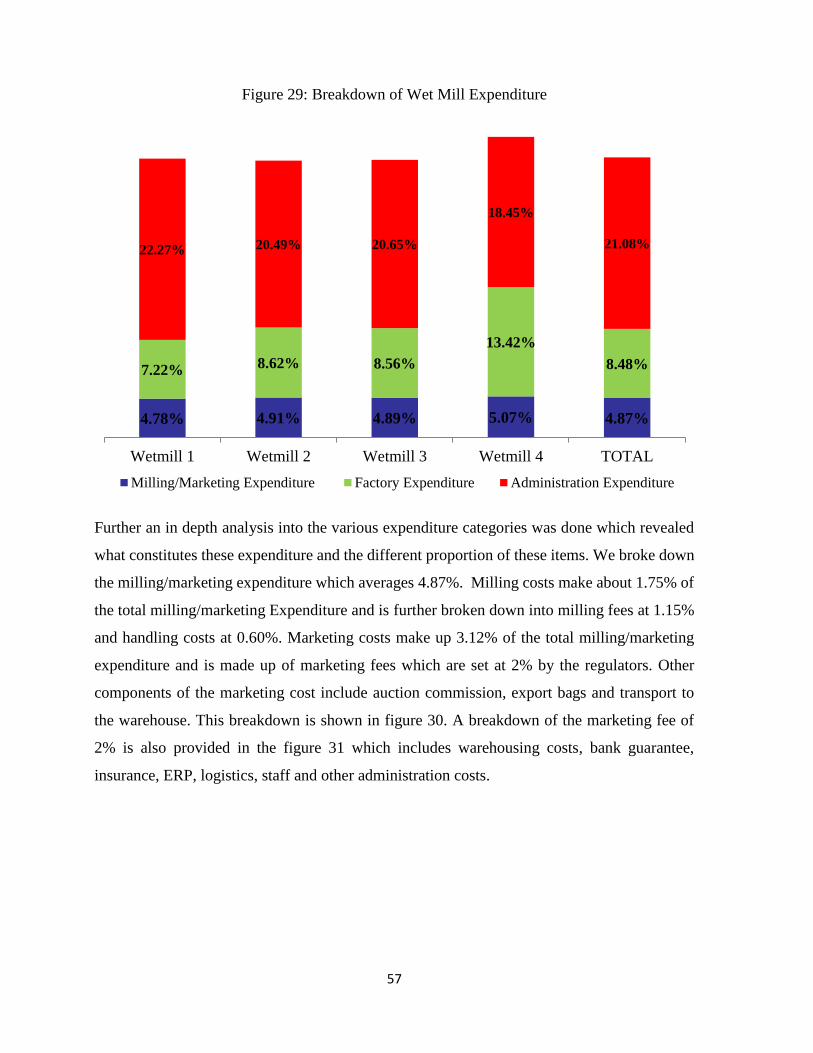
57
Figure 29: Breakdown of Wet Mill Expenditure
Further an in depth analysis into the various expenditure categories was done which revealed
what constitutes these expenditure and the different proportion of these items. We broke down
the milling/marketing expenditure which averages 4.87%. Milling costs make about 1.75% of
the total milling/marketing Expenditure and is further broken down into milling fees at 1.15%
and handling costs at 0.60%. Marketing costs make up 3.12% of the total milling/marketing
expenditure and is made up of marketing fees which are set at 2% by the regulators. Other
components of the marketing cost include auction commission, export bags and transport to
the warehouse. This breakdown is shown in figure 30. A breakdown of the marketing fee of
2% is also provided in the figure 31 which includes warehousing costs, bank guarantee,
insurance, ERP, logistics, staff and other administration costs.
4.78% 4.91% 4.89% 5.07% 4.87%
7.22% 8.62% 8.56%
13.42%
8.48%
22.27% 20.49% 20.65%
18.45%
21.08%
Wetmill 1 Wetmill 2 Wetmill 3 Wetmill 4 TOTAL
Milling/Marketing Expenditure Factory Expenditure Administration Expenditure

58
Figure 30: Breakdown of Marketing and Milling costs
Figure 31: Breakdown of the Marketing Fee (2% of the marketing cost)
Marketing Costs Milling Costs
1.15%
0.60%
2.00%
0.10%
0.68%
0.34%
Transport to
warehouse
Export bags
Auction
commission
Marketing fees
Handling
Milling fee
22.76%
10.01%
21.01%
21.01%
7.00%
11.00%
8.00%
Warehousing Costs
Bank Guarantee
Logistics
insurance
ERP
Staffing and Admin
Costs
Business Development
costs, others

59
Figure 32: Breakdown of Factory and Administration costs
Auction Price
One of the factors that affects revenue and hence pay-out to farmers is market price. The study
looked at the auction prices to get some insight. To understand the auction price trends we
looked at data from the National Coffee Auction for various sales within season 2016/17and
analysed it. We sort to understand the auction price trend and whether this affects the revenue
to the wet mills by considering the prices of different grades across a number of sales.
Interestingly, the average prices across different grades does not significantly change over time
The highest price for AA was about 380 dollars and the lowest was USD 298 over 2 months
which is only a variation of USD 70 per 50kg bag. In addition, higher grade consistently fetched
higher prices over time compared to lower grades alluding to the fact that regardless of the
auction price trend the most important aspect is quality. Grade AA fetched up to USD 380 per
50kg while the highest amount grade C coffee fetched was USD 223 for a 50kg for the period
under analysis as shown in the following graph.
7.22%
22.27%
Factory Expenditure Administration Expenditure
• Labour
• Fuel/ Electricity
• Security
• Maintenance
• Finance costs
• Capex
• Society general votehead
• Drying materials
• Transport and
bags
• Water

60
Figure 33: Comparison of Average Prices across Different Clean Coffee Grades
Quality
In order to further understand the importance of quality and its impact on the wet mill revenue,
we compared the prices for different classes of coffee for the same grade from one auction. In
this case we chose grade AB of different outturns sold within the same auction sale in season
2016/17. We then compared the prices that those outturns, that had different classes (class 3-
and class 4+), fetched in this particular auction. The higher quality coffee (class 3- ) again
consistently fetched higher prices compared to the class 4+ coffee in the same auction. In one
particular case we note up to USD 140 difference per 50kg bag between class 3- and class 4+
for AB grade. Quality is therefore a significant determinant of price in the auction and by
extension, revenue to the wet mill.
0
50
100
150
200
250
300
350
400
Sale 14 Sale 15 Sale 16 Sale 17 Sale 18 Sale 19
Av
era
ge
pri
ce (
US
D)
per
50
kg
ba
g
AA AB C PB
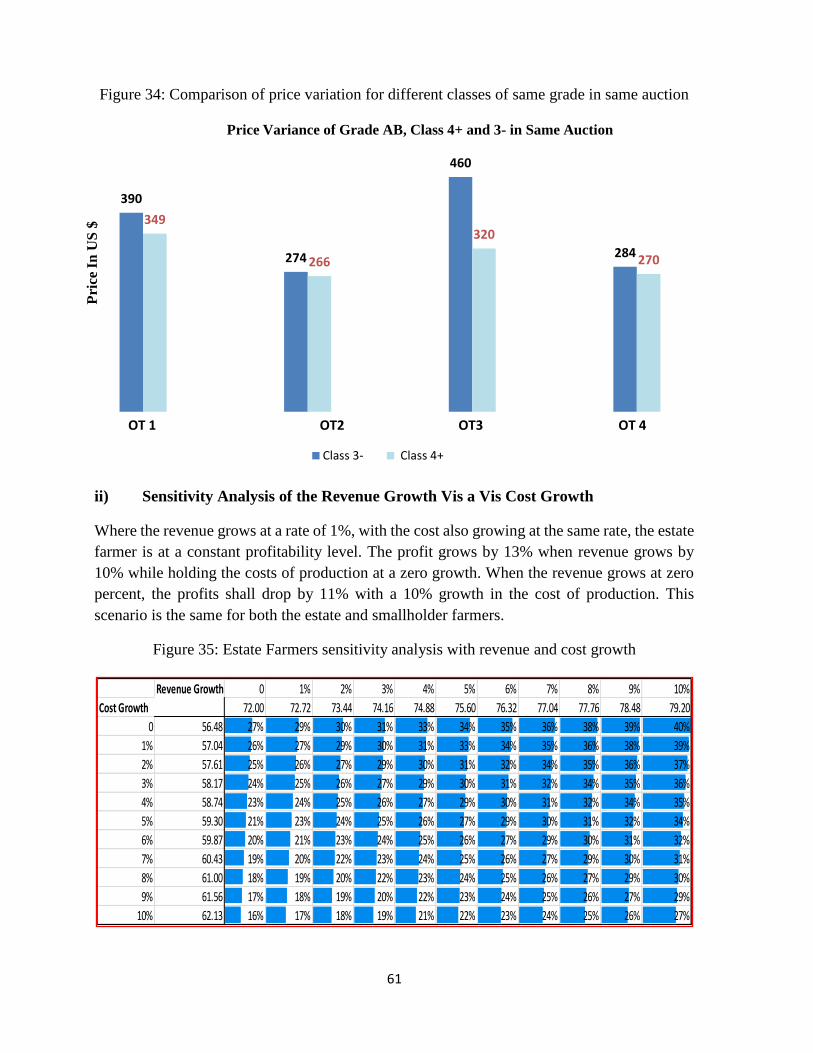
61
Figure 34: Comparison of price variation for different classes of same grade in same auction
ii) Sensitivity Analysis of the Revenue Growth Vis a Vis Cost Growth
Where the revenue grows at a rate of 1%, with the cost also growing at the same rate, the estate
farmer is at a constant profitability level. The profit grows by 13% when revenue grows by
10% while holding the costs of production at a zero growth. When the revenue grows at zero
percent, the profits shall drop by 11% with a 10% growth in the cost of production. This
scenario is the same for both the estate and smallholder farmers.
Figure 35: Estate Farmers sensitivity analysis with revenue and cost growth
390
274
460
284
349
266
320
270
Pri
ce I
n U
S $
Price Variance of Grade AB, Class 4+ and 3- in Same Auction
Class 3- Class 4+
OT 1 OT2 OT3 OT 4
Revenue Growth 0 1% 2% 3% 4% 5% 6% 7% 8% 9% 10%
Cost Growth 27% 72.00 72.72 73.44 74.16 74.88 75.60 76.32 77.04 77.76 78.48 79.20
0 56.48 27% 29% 30% 31% 33% 34% 35% 36% 38% 39% 40%
1% 57.04 26% 27% 29% 30% 31% 33% 34% 35% 36% 38% 39%
2% 57.61 25% 26% 27% 29% 30% 31% 32% 34% 35% 36% 37%
3% 58.17 24% 25% 26% 27% 29% 30% 31% 32% 34% 35% 36%
4% 58.74 23% 24% 25% 26% 27% 29% 30% 31% 32% 34% 35%
5% 59.30 21% 23% 24% 25% 26% 27% 29% 30% 31% 32% 34%
6% 59.87 20% 21% 23% 24% 25% 26% 27% 29% 30% 31% 32%
7% 60.43 19% 20% 22% 23% 24% 25% 26% 27% 29% 30% 31%
8% 61.00 18% 19% 20% 22% 23% 24% 25% 26% 27% 29% 30%
9% 61.56 17% 18% 19% 20% 22% 23% 24% 25% 26% 27% 29%
10% 62.13 16% 17% 18% 19% 21% 22% 23% 24% 25% 26% 27%

62
Figure 36: Smallholder Farmers sensitivity analysis with revenue and cost growth
iii) Sensitivity Analysis of the Revenue Growth Vis-a- Vis Cost Drop
Where the revenue grows at a rate of 10%, with the cost dropping at the same rate, the estate
farmer is at more than double the profitability level, (56% against 27%). The profit grows by
13% when revenue grows by 10% while holding the costs of production at a zero growth. When
the revenue grows at zero percent, the profits shall grow by 15% with a 10% drop in the cost
of production.
Figure 37: Estate farmers’ Sensitivity Analysis with Revenue Growth and Cost Drop
Where the revenue grows at a rate of 10%, with the cost dropping at the same rate, the
smallholder farmer is close to double the profitability level, (69% - 39%). The profit grows by
13% when revenue grows by 10% while holding the costs of production at a zero growth. When
the revenue grows at zero percent, the profits shall grow by 15% with a 10% drop in the cost
of production.
Revenue Growth 0 1% 2% 3% 4% 5% 6% 7% 8% 9% 10%
Cost Growth 39% 53.69 54.23 54.77 55.30 55.84 56.38 56.91 57.45 57.99 58.53 59.06
0 38.73 39% 40% 41% 43% 44% 46% 47% 48% 50% 51% 52%
1% 39.12 37% 39% 40% 41% 43% 44% 45% 47% 48% 50% 51%
2% 39.51 36% 37% 39% 40% 41% 43% 44% 45% 47% 48% 49%
3% 39.89 35% 36% 37% 39% 40% 41% 43% 44% 45% 47% 48%
4% 40.28 33% 35% 36% 37% 39% 40% 41% 43% 44% 45% 47%
5% 40.67 32% 33% 35% 36% 37% 39% 40% 41% 43% 44% 45%
6% 41.06 31% 32% 33% 35% 36% 37% 39% 40% 41% 43% 44%
7% 41.44 30% 31% 32% 33% 35% 36% 37% 39% 40% 41% 43%
8% 41.83 28% 30% 31% 32% 33% 35% 36% 37% 39% 40% 41%
9% 42.22 27% 28% 30% 31% 32% 34% 35% 36% 37% 39% 40%
10% 42.61 26% 27% 29% 30% 31% 32% 34% 35% 36% 37% 39%
Revenue Growth 0 1% 2% 3% 4% 5% 6% 7% 8% 9% 10%
Cost Drop 27% 72.00 72.72 73.44 74.16 74.88 75.60 76.32 77.04 77.76 78.48 79.20
0 56.48 27% 29% 30% 31% 33% 34% 35% 36% 38% 39% 40%
1% 55.91 29% 30% 31% 33% 34% 35% 36% 38% 39% 40% 42%
2% 55.35 30% 31% 33% 34% 35% 37% 38% 39% 40% 42% 43%
3% 54.78 31% 33% 34% 35% 37% 38% 39% 41% 42% 43% 45%
4% 54.22 33% 34% 35% 37% 38% 39% 41% 42% 43% 45% 46%
5% 53.65 34% 36% 37% 38% 40% 41% 42% 44% 45% 46% 48%
6% 53.09 36% 37% 38% 40% 41% 42% 44% 45% 46% 48% 49%
7% 52.52 37% 38% 40% 41% 43% 44% 45% 47% 48% 49% 51%
8% 51.96 39% 40% 41% 43% 44% 45% 47% 48% 50% 51% 52%
9% 51.40 40% 41% 43% 44% 46% 47% 48% 50% 51% 53% 54%
10% 50.83 42% 43% 44% 46% 47% 49% 50% 52% 53% 54% 56%

63
Figure 38: Smallholder farmers’ Sensitivity Analysis with Revenue Growth and Cost Drop
The take home points in this case are that the movement and/or co movement of both revenues
and costs are very key drivers to the economic viability of the coffee growing in Kenya. Efforts
need therefore to be made to enhance revenue generation while controlling the costs of
production.
Revenue Growth 0 1% 2% 3% 4% 5% 6% 7% 8% 9% 10%
Cost Drop 39% 53.69 54.23 54.77 55.30 55.84 56.38 56.91 57.45 57.99 58.53 59.06
0 38.73 39% 40% 41% 43% 44% 46% 47% 48% 50% 51% 52%
1% 38.34 40% 41% 43% 44% 46% 47% 48% 50% 51% 53% 54%
2% 37.96 41% 43% 44% 46% 47% 49% 50% 51% 53% 54% 56%
3% 37.57 43% 44% 46% 47% 49% 50% 51% 53% 54% 56% 57%
4% 37.18 44% 46% 47% 49% 50% 52% 53% 55% 56% 57% 59%
5% 36.80 46% 47% 49% 50% 52% 53% 55% 56% 58% 59% 61%
6% 36.41 47% 49% 50% 52% 53% 55% 56% 58% 59% 61% 62%
7% 36.02 49% 51% 52% 54% 55% 57% 58% 59% 61% 62% 64%
8% 35.63 51% 52% 54% 55% 57% 58% 60% 61% 63% 64% 66%
9% 35.25 52% 54% 55% 57% 58% 60% 61% 63% 65% 66% 68%
10% 34.86 54% 56% 57% 59% 60% 62% 63% 65% 66% 68% 69%
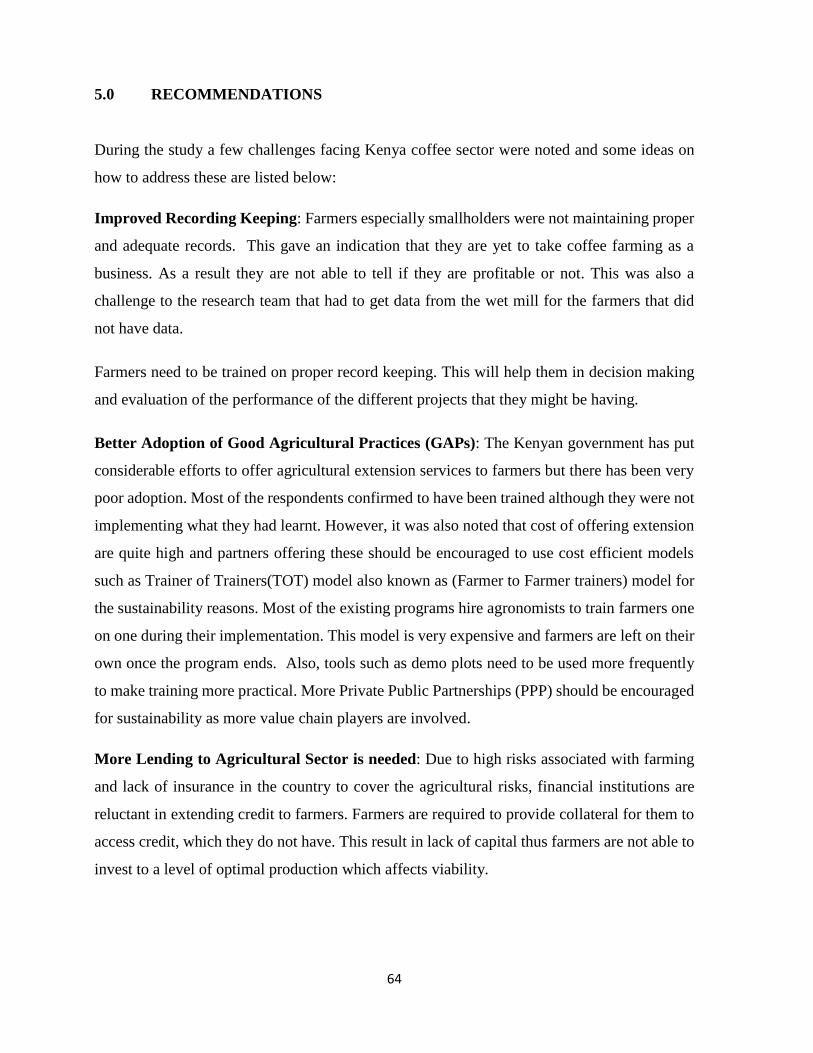
64
5.0 RECOMMENDATIONS
During the study a few challenges facing Kenya coffee sector were noted and some ideas on
how to address these are listed below:
Improved Recording Keeping: Farmers especially smallholders were not maintaining proper
and adequate records. This gave an indication that they are yet to take coffee farming as a
business. As a result they are not able to tell if they are profitable or not. This was also a
challenge to the research team that had to get data from the wet mill for the farmers that did
not have data.
Farmers need to be trained on proper record keeping. This will help them in decision making
and evaluation of the performance of the different projects that they might be having.
Better Adoption of Good Agricultural Practices (GAPs): The Kenyan government has put
considerable efforts to offer agricultural extension services to farmers but there has been very
poor adoption. Most of the respondents confirmed to have been trained although they were not
implementing what they had learnt. However, it was also noted that cost of offering extension
are quite high and partners offering these should be encouraged to use cost efficient models
such as Trainer of Trainers(TOT) model also known as (Farmer to Farmer trainers) model for
the sustainability reasons. Most of the existing programs hire agronomists to train farmers one
on one during their implementation. This model is very expensive and farmers are left on their
own once the program ends. Also, tools such as demo plots need to be used more frequently
to make training more practical. More Private Public Partnerships (PPP) should be encouraged
for sustainability as more value chain players are involved.
More Lending to Agricultural Sector is needed: Due to high risks associated with farming
and lack of insurance in the country to cover the agricultural risks, financial institutions are
reluctant in extending credit to farmers. Farmers are required to provide collateral for them to
access credit, which they do not have. This result in lack of capital thus farmers are not able to
invest to a level of optimal production which affects viability.

65
Climate Change Mitigation and Adaption: Global warming associated with GHG emissions
have interfered with the normal weather pattern and made coffee farming more complicated as
tree flowering is not uniform and even. Over the recent years, farmers have experienced low
flowering due to prolonged drought. This has in turn resulted to low production, very high cost
of production and poor quality. Farmers should be educated on climate change mitigation and
adaptation techniques in coffee farming to remain resilient.
Youth Inclusion: Most of the farmers are aged as the study noted; the average age of a coffee
farmer is 54 years. This means that in most farms the farmers’ energy is diminishing and they
are not fast to learn new ideas and technology. The study noted that only 5% of the respondents
were below 35 years. Youth inclusion in the coffee farming should be given a priority.
Women Inclusion: Women exclusion in coffee farming has posed a big gap between the
existing training and implementation. This is due to the fact that most of the trainings are
attended by men while women tender the coffee bushes. The study noted that only 17% of the
respondents were women indicating that although most of the women do the work on the farm
they are not engaged in any coffee farming decision making. Training modules and programs
that focus on women should be developed and implemented. The coffee farming communities
should embrace the household approach in managing the coffee farms.
High Quality Agro - inputs: Most of the respondents especially the smallholders cited this as
one of the biggest challenges. The Kenyan market is flooded with counterfeits of all products
including agro-inputs. This has resulted in loss of crops and high cost of inputs lowering the
profits and eventually affecting the viability of coffee farming. Bulk procurement by the
farmers groups should be encouraged since most of the counterfeits products are found in the
local agro-vet shops that are not approved. The policy makers need to ensure that proper checks
are done frequently to flash out counterfeits from the market.
Cushioning on Volatile Prices: The coffee prices are heavily affected by the New York prices.
Since Kenya only produces about 0.5% of the world coffee, this mean it cannot significantly
influence the world market and is a coffee price taker. The lack of cushioning of the farmers
against the volatile prices demotivates them resulting in low production. Eventually this has
led to high cost of production and low profits putting the coffee economic viability at risk. A
66
mechanism should be established to cushion the farmers from this price volatility to stabilize
revenue.
Farmer Organization Capacity Building: The study noted that most of the smallholders
complained about their farmer support organizations in terms of inefficiency or poor
management of funds. Capacity building in terms of governance should be given a priority.
Further, there should be adequate supervision by the regulatory bodies.
A
6.0 REFERENCES
Montagnon, C., (2017). Coffee Production Costs and Farm Profitability: Strategic Literature Review
Specialty Coffee Association Dr Christophe, RD2 Vision October 2017
Agri-Logic and Valued Chain, (2017). AFRICAN COFFEE SECTOR INVESTMENT OPPORTUNITIES
Summary of sector reviews of Angola, Burundi, Cameroon, Côte d’Ivoire, Ethiopia, Kenya, Rwanda,
Tanzania and Uganda.
GCP (2017), Economic Viability of Coffee Farming, Kenya.
Haggar J. 2008. Manejando los costos de produccion de café en fincas organicas y convencionales.
Ramacafé, Nicaragua 2008.
Haggar, J., Jerez, R., Cuadra, L., Alvarado, U., & Soto, G. (2012). Environmental and economic costs
and benefits from sustainable certification of coffee in Nicaragua. Food Chain, 2(1), 24-41.
ICO, 2016. Assessing the economic sustainability of coffee growing. Doc ICC, 117-6, 23 pp.
Stewart, P., 2014. The Business Case for the African Coffee Farmer. Can Smallholder Farmers
Become Coffee Farmer Entrepreneurs? AFCA Conference, 2014.
Technoserve, 2014. Colombia: A business case for sustainable production. Sustainable Coffee
Program, IDH.
Lundy, M. 2015. Production Costs: Evidence from Colombia. SCAA 2015 Lectures.
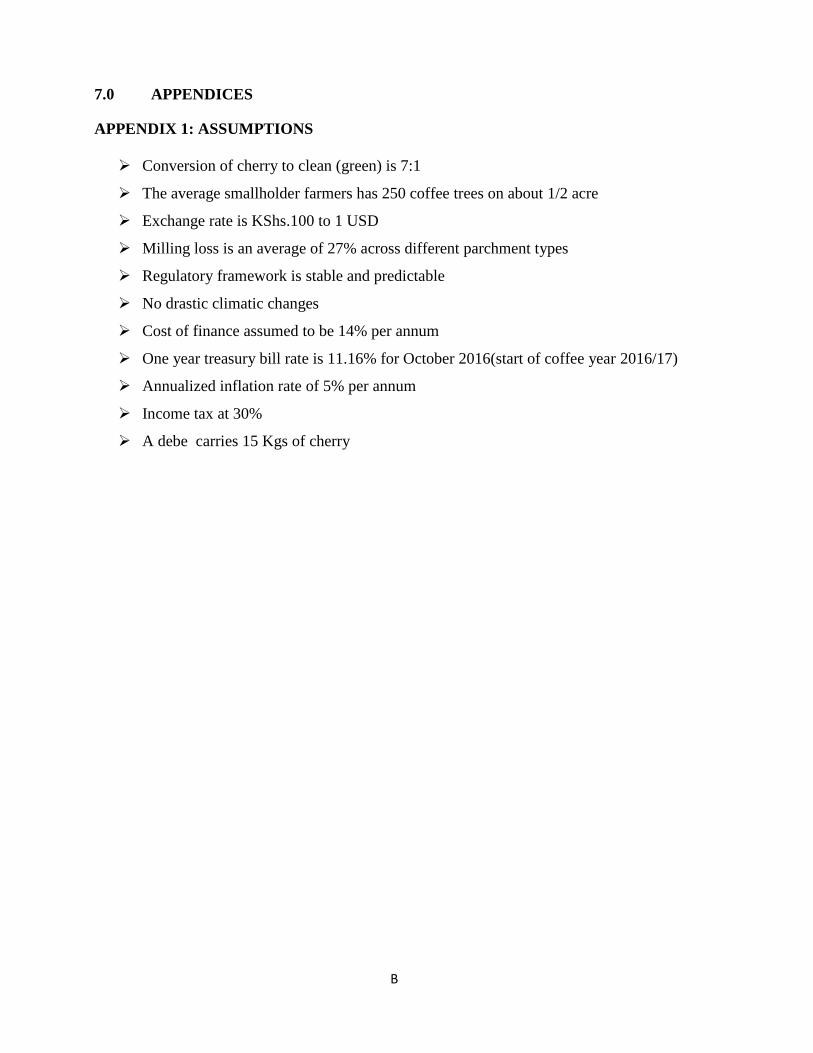
B
7.0 APPENDICES
APPENDIX 1: ASSUMPTIONS
➢ Conversion of cherry to clean (green) is 7:1
➢ The average smallholder farmers has 250 coffee trees on about 1/2 acre
➢ Exchange rate is KShs.100 to 1 USD
➢ Milling loss is an average of 27% across different parchment types
➢ Regulatory framework is stable and predictable
➢ No drastic climatic changes
➢ Cost of finance assumed to be 14% per annum
➢ One year treasury bill rate is 11.16% for October 2016(start of coffee year 2016/17)
➢ Annualized inflation rate of 5% per annum
➢ Income tax at 30%
➢ A debe carries 15 Kgs of cherry

C
APPENDIX 2: RESEARCH QUESTIONNAIRES
a) SMALL HOLDER FARMER QUESTIONNAIRE
1. GENERAL INFORMATION
Date of Study (DD/MM/YYYY) / /
Enumerator’s Name
Respondent’s Name Gender
(a):
Cooperative Society
Factory Name
County Name
2. REGISTERED MEMBERS DETAILS
Age
(years)
Blocks d
Highest Level
of Education
(code a)
Primary
activity
(code b)
Home occupancy
(code c)
Information on
Household size: No.
adult
male
No. adult
female
No. children (< 18 Yrs.)
Male Female
a) Highest level of
education
b) Primary activity/activities
1 =No formal education
2= Primary school
3= High/secondary
school
4= College
5= University
6= Other (specify):
0 = Coffee farming
1 = Other cash crop farming
2 = Food crops
3 = Dairy farming
4 = Other livestock farming e.g. goat, poultry
5 = Business[trade/services (non-agric.)]
6 = Formal salaried employee (e.g. civil servant, private
sector, domestic work)
7 = Retired
8 = Other
(specify):_________________________________________
c) Home occupancy d) Age (years)
1= permanently resident
2= sometimes away (<
3 months/year away)
3= frequently away (3 –
9 months/year away)
1. = 18-25 Years
2. = 25-35 years
3. = 35-45 years
4. = 45 -55Years

D
5. = Above 55 years
3. ASSETS – LAND AND LIVESTOCK
a) Land
Number of
Parcels
Size of
parcel(code)
Tenure system
(Code)
If parcel is owned, who owns
(Code)
1
2
3
4
Total farm:
Size of parcel Tenure System If Owned, Name on
title/certificate:
1= acre
2= ha
3= other, specify:
[conversion in
metric system]
1= Title deed
2= Owned but not titled
3= Community land
4= Lease
5=Other (specify)
1= Male household
2= Female household
3= Joint household
4. GOOD AGRICULTURAL PRACTICES(GAP)
a) How long have you been in coffee farming? ______ (years)
b) Complete the table below, for the variety/type and number of coffee trees on the farm:
Coffee
Varieties
System* under which it
is grown (code)
Current number of
trees
Area in
Acres
SL 34
SL 28
K7
Ruiru 11
Batian
* System
Note: *System: Pure stand=1; Intercropped=2; Shaded=3; Un-shaded=4 (enter ALL
those that
apply).
c) What is the average yearly cherry production on your farm? ______ (kg) and how much
was the price per kilo?
Year Kgs Price per Kg
2012
2013

E
2014
2015
2016
d) Which of the GAPs do you practice on your farm? (Tick)
i. Use of improved seed
ii. Inorganic fertilizer use
iii. Organic fertilizer use
iv. Soil conservation
v. Pest and disease control
vi. Harvesting operations
vii. Post-harvest practice/care
viii. Soil testing
ix. Coffee tree nursery management
e) Have you received any form of training on Good Agricultural Practices on the farm?
a) Yes (ASK f-h below )
b) No (SKIP TO 5)
f) If Yes at (2) from whom did you receive the training?
a) SMS ( Mobile Text)
b) Cooperative society
c) Others (specify)_______________
g) If Yes to the answer above, specify on areas where you have received training.
___________________________________________________________________________
___________________________________________________________________________
___________________________________________________________________________
h) How would you gauge your level of training on Good Agricultural Practices?
i. Excellent
ii. Very good
iii. Average
iv. Poor
5. COST OF COFFEE PRODUCTION
a) How much did you spend in the last year on coffee farming activities?
Field Activity No of times per year Cost (KSHS)
Labour costs (See 5b.) ✓ Hand Weed control
✓ irrigation application
✓ Herbicide application
✓ Irrigation application
✓ Conservation(terracing, shade trees, mulching)

F
✓ Fungicide Application
✓ Fertilizer application
✓ Pruning
✓ Manure application
Chemical costs
Soil Improvement – Ground Fertilizer • CAN
• NPK
• Manure
Foliar Feeding • Monar|Tomek|Wuxal Boron|Nutrivant|,Urea, e.Salt| etc.
Disease Control
• Cabrio | Nordox |Delan|Nativo|Michrothiol
Fungicide Control
• Copper|Cabrio|Delan|Daconil| Quandris| Nativo|,Captan
etc.
Pests Control • Dursban|DC Tron|Diazinon|Dursban
Soil Amelioration • Lime, Rock phosphate, Gypsum
Insects Control • Actara, Bouviteck, Decis, Fursban, Microthiol etc.
Others ( Please specify )
b) Source of Labour? 1. 2. 3.
1= Family labour 2. = Hired labour 3. = Mixed (1&2)
*If family labour ask for time and 1calculate wage equivalent
c) Other Crop costs:
Cost per unit No of units Total Cost
Picking in debes
Transport bags
Cherry transport to the
factory in debes
G
d) Complete the table below for the other Food/cash crops sales
Food/ Cash crop Area allocated (Acres) Intercropped with coffee ( Yes/No)
1.
2.
3.
4.
e) Complete the table below for the other cash crops sales:
Where do
you sell other
Food/cash
crops
Do you sell /
aggregate
the crops to
this
‘location’?
(0 = No, 1 =
Yes)
Distance
to selling
point
(km)
Mode of
transportation
*
(code)
kg harvested
and sold
Price
received per
kg
Price
received per
bag
Neighbours
Middlemen/
Brokers
Export
Processing
plant
Cooperatives
Other,
specify:
-----------------
-----------------
-----------------
-----------------
*Mode of
transportatio
n
1 = by foot, 2 = motorbike, 3 = ox cart 4 = handcart, 5 = car, 6 = truck, 7 =
other,
specify:_________________________________________________________
___
6. FAMILY FOOD CROPS PRODUCTION
a) Which food crops do you grow and approximate area allocate for each crop, quantity
produced and consumed at home?
Food crop Area allocated
(Acres)
Quantity
produced
Quantity
consumed

H
b) Other income generating Activities
--------------------------------------------------------------------------------------------------------------
----------------------------------------------------------------------------------------------------------
----------------------------------------------------------------------------------------------------------
----------------------------------------------------------------------------------------------------------
---------------------------
7. GROUP MEMBERSHIP, ACCESS TO CREDIT, TRAINING AND COFFEE
INFORMATION SERVICES
a) Are you a member of any farming related self- help group or co-operative society? ____
(0 = No, 1 = Yes)
b) If yes, what year did you join? Group ______; Co-operative society:
c) What services do you get? from the:
i) Group:
ii) Co-operative society:
d) Do you hold any leadership position in the group? (0=NO; 1=YES) If YES, what
position do you hold? 1 = Chairman; 2 = Secretary; 3 = Treasurer, 4 = Supervisory
committee, 5 = Other, specify:
e) In your area do you receive extension services? _______1=YES 0=NO
IF, YES, who provides the service?_____(Code) 1 = National govt; 2 = County
govt; 3= Cooperative; 4 = coffee marketing ; 5= management agents; 5 =
Promoter farmers; 6= Other farmers/ neighbours; 6 = Other, specify:
If NO, give reasons: _________________________________________________________
8. COFFEE SELLING
a) Which months do you usually harvest coffee? _____________ (list all codes that apply)
1 = Jan, 2 = Feb, 3 = Mar, 4 = Apr, 5 = May, 6 = Jun, 7 = Jul, 8 = Aug, 9 = Sept, 10 =
Oct, 11 = Nov, 12 = Dec b) Distance to collection point ( Factory) : ------------------ kms
c) Mode of transport: 1 = by foot , 2 = motorbike, 3 = bull/donkey cart 4= hand-cart, 5=
car, 6 = truck 7 = other, specify:
I
d) Price received per kg of cherry and Mbuni :Cherry: KShs Mbuni:
KShs
e) How do you get paid? _____________________________ (list all that apply)
1 = Cash 2= Cheque 3= Bank Transfer, 4 = other, (specify) ________________
f) How long do you wait to get paid after coffee delivery? _____________ (months/days)
g) Did you borrow operating capital in 2016 and 2017?
h) If yes,
i. How much money in KShs did you borrow in 2016 and 2017?
2016 2017
ii. How much interest did you pay in year 2016 and 2017?
2016 2017
i) How do you spend your income from coffee (enter % for each item)?
Expenditure
Item
% of coffee
income
Expenditure item % of coffee
income
Food Insurance
Shelter Hire of labour
Clothing Inputs for coffee production
Health Inputs for other crop production
Education Loan repayments
Savings Other, specify:
_________________
Total: 100% (check)
j) How do you cope with the effects of climate change?
Co -operative Governance
1. For how long have you been a member of the Cooperative society?
a) Above 15 Years
b) 10- 15 Years
c) 5-10 years
d) Below 5 years
2. What services do you receive from the FCS?
a. Extension services
b. Market information
c. Financial credit facilities

J
d. Other (specify) ` ---------------------------------------------------------
-
3. On a scale of 1 to 5 where 1 is dissatisfied and 5 satisfied, how satisfied are you with the
services provided by the Cooperative society?
Satisfied 5. 4. 3. 2. 1. Dissatisfied
4. If answer is 2 and 1 above, what areas would you like the cooperative society to improve?
____________________________________________________________________________
____________________________________________________________________________
_________________________________________________________________________

K
b) ESTATE FARMER QUESTIONNAIRE
1. GENERAL INFORMATION
Date of Study (DD/MM/YYYY) / /
Enumerator’s Name
Respondent’s Name Gender
(a):
Estate code
Estate Name
County Name
2. ASSETS – LAND AND LIVESTOCK
b) Land
Number of
Parcels
Size of
parcel(code)
Tenure system
(Code)
If parcel is owned, who owns
(Code)
1
2
3
4
Total farm:
Size of parcel Tenure System If Owned, Name on
title/certificate:
1= acre
2= ha
3= other, specify:
[conversion in
metric system]
1= Title deed
2= Owned but not titled
3= Community land
4= Lease
5=Other (specify)
1= Male household
2= Female household
3= Joint household
3. GOOD AGRICULTURAL PRACTICES(GAP)
c) How long have you been in coffee farming? ______ (years)
d) Complete the table below, for the variety/type and number of coffee trees on the farm:
Coffee
Varieties
System* under which it
is grown (code)
Current number of
trees
Area in
Acres
SL 34
SL 28
K7
Ruiru 11
Batian
* System

L
Note: *System: Pure stand=1; Intercropped=2; Shaded=3; Un-shaded=4 (enter ALL
those that
apply).
c) What is the average yearly cherry production on your farm? ______ (kg) and how much
was the price per kilo?
Year Kgs Price per Kg
2012
2013
2014
2015
2016
d) Which of the GAPs do you practice on your farm? (Tick)
x. Use of improved seed
xi. Inorganic fertilizer use
xii. Organic fertilizer use
xiii. Soil conservation
xiv. Pest and disease control
xv. Harvesting operations
xvi. Post-harvest practice/care
xvii. Soil testing
xviii. Coffee tree nursery management
e) Have you received any form of training on Good Agricultural Practices on the farm?
c) Yes (ASK f to h below )
d) No (SKIP TO 4)
f) If Yes at (2) from whom did you receive the training?
d) SMS ( Mobile Text)
e) Professional Training
f) Others (specify)_______________
g) If Yes to the answer above, specify on areas where you have received training.
___________________________________________________________________________
___________________________________________________________________________
___________________________________________________________________________
h) How would you gauge your level of training on Good Agricultural Practices?
v. Excellent
vi. Very good
vii. Average
viii. Poor
M
4. COST OF COFFEE PRODUCTION
a) How much did you spend in the last year on coffee farming activities?
Field Activity - Cost (KSHS) No of times per
year
2012 2013 2014 2015 2016 2017
Labour costs (See 5b.) ✓ Hand Weed control
✓ irrigation application
✓ Herbicide application
✓ Irrigation application
✓ Conservation(terracing, shade
trees, mulching)
✓ Fungicide Application
✓ Fertilizer application
✓ Pruning
✓ Manure application
Chemical costs
Soil Improvement – Ground Fertilizer • CAN
• NPK
• Manure
Foliar Feeding • Monar|Tomek|Wuxal
Boron|Nutrivant|,Urea, e.Salt|
etc.
Disease Control
• Cabrio | Nordox
|Delan|Nativo|Michrothiol
Fungicide Control
• Copper|Cabrio|Delan|Daconil|
Quandris| Nativo|,Captan etc.
Pests Control • Dursban|DC
Tron|Diazinon|Dursban
Soil Amelioration • Lime, Rock phosphate, Gypsum
Insects Control • Actara, Bouviteck, Decis,
Fursban, Microthiol etc.
Others ( Please specify )
b) Source of Labour? 1. 2. 3.
1= Family labour 2. = Hired labour 3. = Mixed (1&2)
*If family labour ask for time and 1calculate wage equivalent
c) Other Crop costs:

N
Cost per unit No of units Total Cost
Picking in debes
Transport bags
Cherry transport to the
factory in debes
d) Complete the table below for the other Food/cash crops sales
Food/ Cash crop Area allocated (Acres) Intercropped with coffee ( Yes/No)
1.
2.
3.
4.
e) Other Farm income generating Activities
--------------------------------------------------------------------------------------------------------------
----------------------------------------------------------------------------------------------------------
----------------------------------------------------------------------------------------------------------
----------------------------------------------------------------------------------------------------------
---------------------------
5. GROUP MEMBERSHIP, ACCESS TO CREDIT, TRAINING AND COFFEE
INFORMATION SERVICES
f) Are you a member of any farming related self- help group or co-operative society? ____
(0 = No, 1 = Yes)
g) If yes, what year did you join? Group ---------------------------
h) What services do you get? from the:
i) Group:
i) Do you hold any leadership position in the group? (0=NO; 1=YES) If YES, what
position do you hold? 1 = Chairman; 2 = Secretary; 3 = Treasurer, 4 = Supervisory
committee, 5 = Other, specify:
j) In your area do you receive extension services? _______1=YES 0=NO
f) IF, YES, who provides the service?_____(Code) 1 = National govt; 2 = County
govt; 3= Cooperative; 4 = coffee marketing ; 5= management agents; 5 =
Promoter farmers; 6= Other farmers/ neighbours; 6 = Other, specify:
g) If NO, give reasons:
_________________________________________________________

O
6. COFFEE SELLING
k) Which months do you usually harvest coffee? _____________ (list all codes that apply)
1 = Jan, 2 = Feb, 3 = Mar, 4 = Apr, 5 = May, 6 = Jun, 7 = Jul, 8 = Aug, 9 = Sept, 10 =
Oct, 11 = Nov, 12 = Dec l) Distance to Dry Mill : ------------------ kms
m) Mode of transport: 1 = motorbike, 2 = car, 3 = truck, 4 = other, specify:
n) Price received per kg of cherry and Mbuni :Cherry: KShs Mbuni:
KShs
o) How do you get paid? _____________________________ (list all that apply)
1 = Cash 2= Cheque 3= Bank Transfer, 4 = other, (specify) ________________
p) How long do you wait to get paid after coffee delivery? _____________ (months/days)
q) How do you spend your income from coffee (enter % for each item)?
Expenditure
Item
% of coffee
income
Expenditure item % of coffee
income
Food Insurance
Shelter Hire of labour
Clothing Inputs for coffee production
Health Inputs for other crop production
Education Loan repayments
Savings Other, specify:
_________________
Total: 100% (check)
r) How do you cope with the effects of climate change?
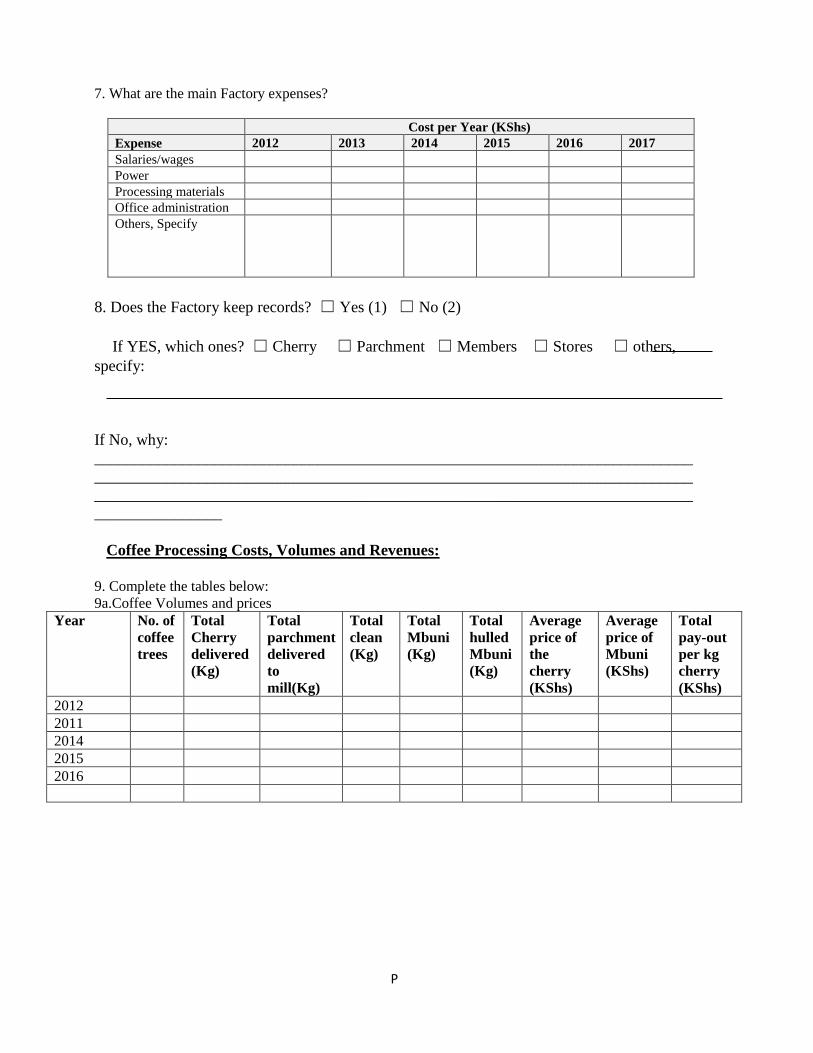
P
7. What are the main Factory expenses?
Cost per Year (KShs)
Expense 2012 2013 2014 2015 2016 2017
Salaries/wages
Power
Processing materials
Office administration
Others, Specify
8. Does the Factory keep records? ☐ Yes (1) ☐ No (2)
If YES, which ones? ☐ Cherry ☐ Parchment ☐ Members ☐ Stores ☐ others,
specify:
If No, why:
___________________________________________________________________________
___________________________________________________________________________
___________________________________________________________________________
________________
Coffee Processing Costs, Volumes and Revenues:
9. Complete the tables below:
9a.Coffee Volumes and prices
Year No. of
coffee
trees
Total
Cherry
delivered
(Kg)
Total
parchment
delivered
to
mill(Kg)
Total
clean
(Kg)
Total
Mbuni
(Kg)
Total
hulled
Mbuni
(Kg)
Average
price of
the
cherry
(KShs)
Average
price of
Mbuni
(KShs)
Total
pay-out
per kg
cherry
(KShs)
2012
2011
2014
2015
2016
2017
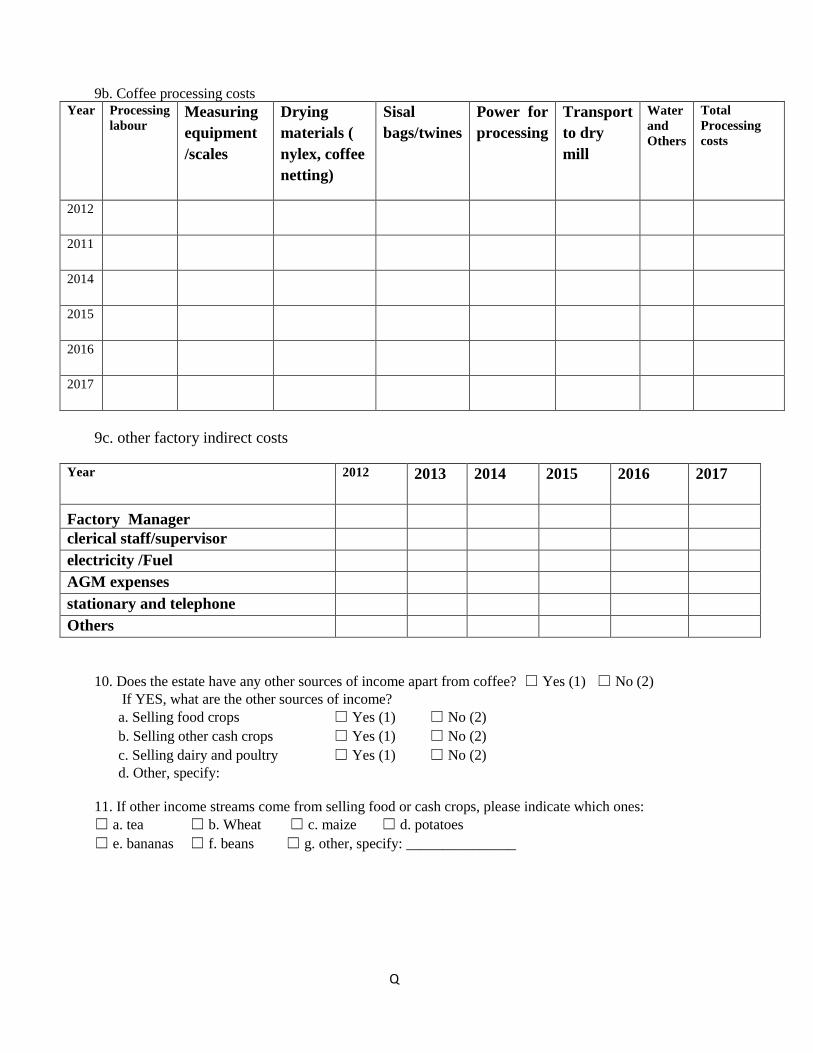
Q
9b. Coffee processing costs Year Processing
labour Measuring
equipment
/scales
Drying
materials (
nylex, coffee
netting)
Sisal
bags/twines
Power for
processing
Transport
to dry
mill
Water
and
Others
Total
Processing
costs
2012
2011
2014
2015
2016
2017
9c. other factory indirect costs
Year 2012 2013 2014 2015 2016 2017
Factory Manager
clerical staff/supervisor
electricity /Fuel
AGM expenses
stationary and telephone
Others
10. Does the estate have any other sources of income apart from coffee? ☐ Yes (1) ☐ No (2)
If YES, what are the other sources of income?
a. Selling food crops ☐ Yes (1) ☐ No (2)
b. Selling other cash crops ☐ Yes (1) ☐ No (2)
c. Selling dairy and poultry ☐ Yes (1) ☐ No (2)
d. Other, specify:
11. If other income streams come from selling food or cash crops, please indicate which ones:
☐ a. tea ☐ b. Wheat ☐ c. maize ☐ d. potatoes
☐ e. bananas ☐ f. beans ☐ g. other, specify: _______________

R
12. How much money was received by the Estate from coffee sales in the last 5 years?
13. How much money did the Estate receive per debe of cherry in the last 5 years? Year Amount(KShs)
2012
2013
2014
2015
2016
2017
14. Does the Estate maintain any certification?
☐ Yes (1) ☐ No (2)
15. If yes, please fill in the following table
Certification title
RA UTZ 4C Fair trade COMBI
Average annual cost
Average annual sales
Average annual Premiums
16. Please comment on the benefits of the certification to the coffee sales in the last two years
Environmental Awareness
17. Does your Estate strive to lower its negative impact on nature and the environment?
☐ Yes (1) ☐ No (2)
If YES, what negative impact is your Estate actively trying to reduce?
☐ Water waste (1) ☐ deforestation (2) ☐ soil degradation (3) ☐ other, specify:
18. What action are you taking to decrease the negative impact?
__________________________________________________________________________________
__________________________________________________________________________________
__________________________________________________________________________________
____________________
19. Do you borrow operating capital?
If yes,
Year Amount(KShs)
2012
2013
2014
2015
2016
2017

S
i. How much money in KShs did you borrow?
ii. How much interest did you pay
Year Amount Borrowed Interest Paid
2012
2013
2014
2015
2016
20. What are the key challenges affecting the Co-operative/Union?
☐ Infrastructure ☐ Availability of funds ☐ Weather (low rainfall)
☐ Performance of farmers ☐ Access to domestic power
☐ Lack of quality traders ☐ other, specify: ----------------------------------------------------
Future Plans
21. What are your Estate plans for the next 3 years?

T
c) WET MILL QUESTIONNAIRE
General Information:
Date of Survey (DD/MM/YYYY) / /
Enumerator’s Name
Co-operative
Society
Wet Mill
(Factory)
County
Secretary Manager ( CEO)
Gender(a):
Factory Details:
1. Membership
No. of
members Men Women
Youth
(below 35 years)
Year (a)
Total
(b)
Active
(c)
Non
active
(d)
Active
(e)
Non
active
(f)
Active
(g)
Non active
2012
2013
2014
2015
2016
2017
2. How often (in years) are new leaders elected? __________________
3. What is the number of staff in the Wet Mill?
Male________________ Female______________ Youth___________
4. What are the main Factory expenses?
Cost per Year (KShs)
Expense 2012 2013 2014 2015 2016 2017
Salaries/wages
Power
Processing materials
Transport
Office
administration
Others, Specify
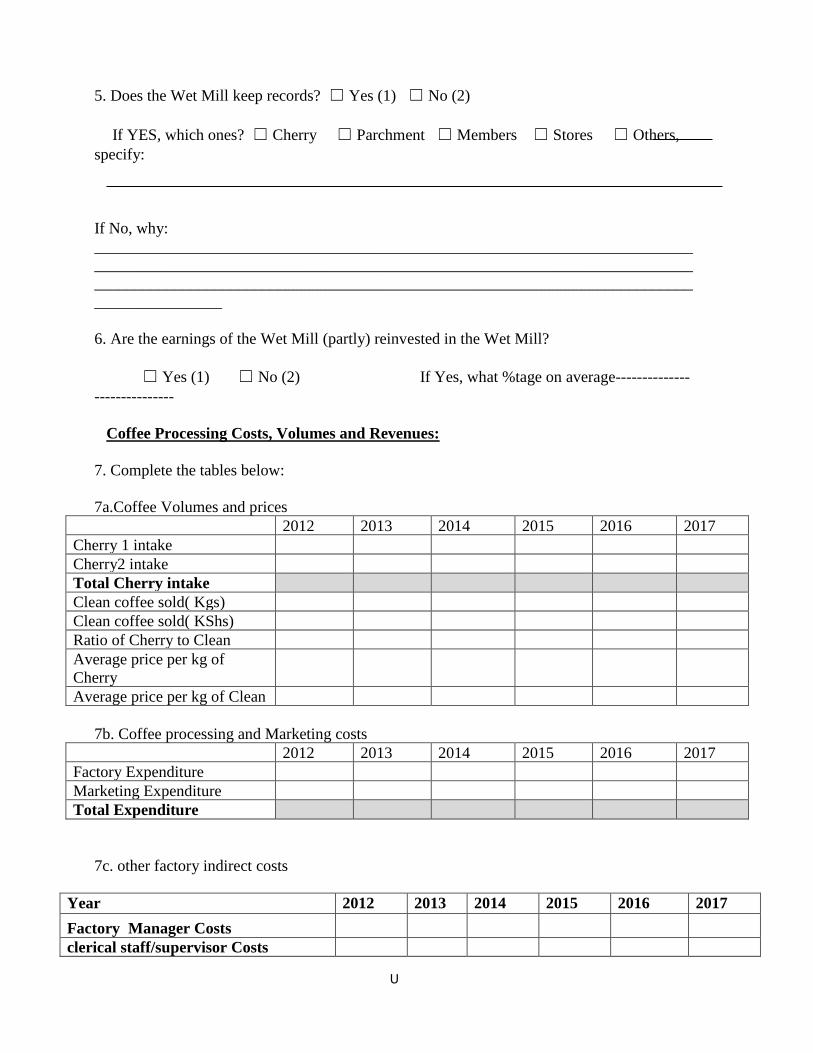
U
5. Does the Wet Mill keep records? ☐ Yes (1) ☐ No (2)
If YES, which ones? ☐ Cherry ☐ Parchment ☐ Members ☐ Stores ☐ Others,
specify:
If No, why:
___________________________________________________________________________
___________________________________________________________________________
___________________________________________________________________________
________________
6. Are the earnings of the Wet Mill (partly) reinvested in the Wet Mill?
☐ Yes (1) ☐ No (2) If Yes, what %tage on average--------------
---------------
Coffee Processing Costs, Volumes and Revenues:
7. Complete the tables below:
7a.Coffee Volumes and prices
2012 2013 2014 2015 2016 2017
Cherry 1 intake
Cherry2 intake
Total Cherry intake
Clean coffee sold( Kgs)
Clean coffee sold( KShs)
Ratio of Cherry to Clean
Average price per kg of
Cherry
Average price per kg of Clean
7b. Coffee processing and Marketing costs
2012 2013 2014 2015 2016 2017
Factory Expenditure
Marketing Expenditure
Total Expenditure
7c. other factory indirect costs
Year 2012 2013 2014 2015 2016 2017
Factory Manager Costs
clerical staff/supervisor Costs
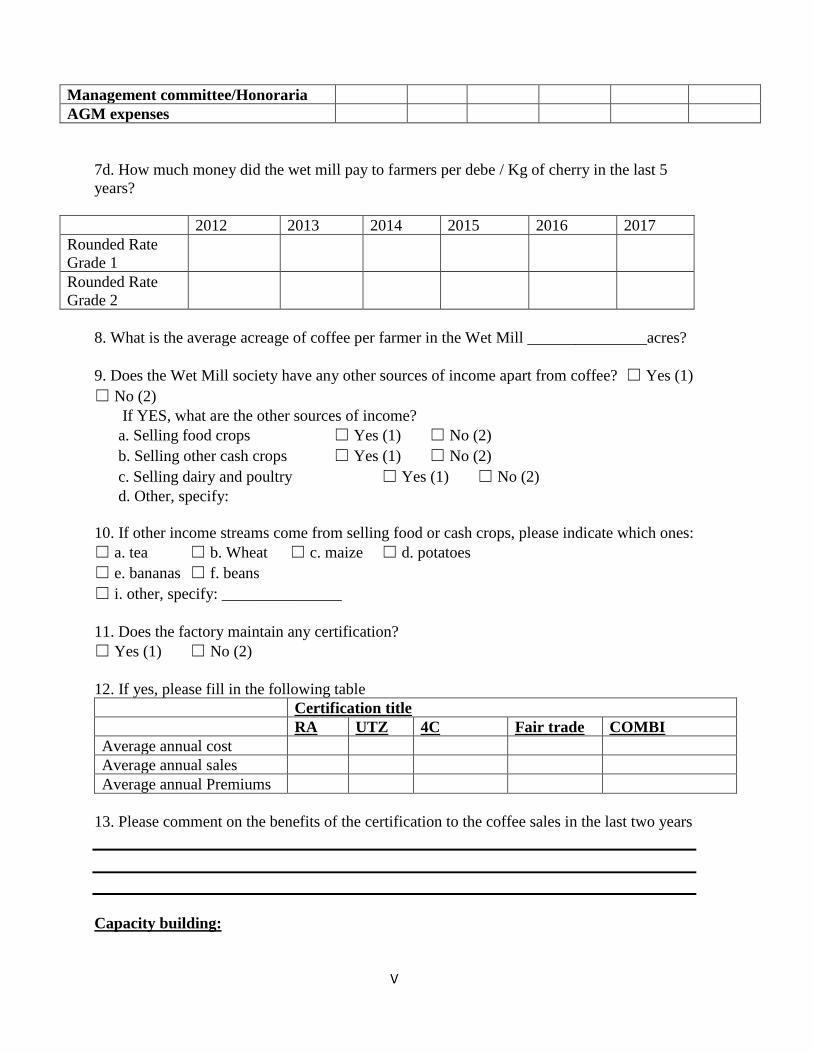
V
Management committee/Honoraria
AGM expenses
7d. How much money did the wet mill pay to farmers per debe / Kg of cherry in the last 5
years?
2012 2013 2014 2015 2016 2017
Rounded Rate
Grade 1
Rounded Rate
Grade 2
8. What is the average acreage of coffee per farmer in the Wet Mill _______________acres?
9. Does the Wet Mill society have any other sources of income apart from coffee? ☐ Yes (1)
☐ No (2)
If YES, what are the other sources of income?
a. Selling food crops ☐ Yes (1) ☐ No (2)
b. Selling other cash crops ☐ Yes (1) ☐ No (2)
c. Selling dairy and poultry ☐ Yes (1) ☐ No (2)
d. Other, specify:
10. If other income streams come from selling food or cash crops, please indicate which ones:
☐ a. tea ☐ b. Wheat ☐ c. maize ☐ d. potatoes
☐ e. bananas ☐ f. beans
☐ i. other, specify: _______________
11. Does the factory maintain any certification?
☐ Yes (1) ☐ No (2)
12. If yes, please fill in the following table
Certification title
RA UTZ 4C Fair trade COMBI
Average annual cost
Average annual sales
Average annual Premiums
13. Please comment on the benefits of the certification to the coffee sales in the last two years
Capacity building:
W
14. Do you offer extension services to your farmers on coffee? ☐ Yes (1) ☐ No (2)
If YES, which extension services do you offer? (Select ALL that apply)
☐ Trainings ☐ Information ☐ Advisory services
☐ Other, specify: _____________________________________________________
15. Do you use Promoter Farmers in your extension services? ☐ Yes (1) ☐ No (2)
If YES, how many? ______ and how many farmers does each promoter farmer work
with? _____
16. How many of the promoter farmers are: a. Male b. Female_______
17. Has the Wet Mill society received any training in 2017 on?
a. Governance ☐ Yes(1) ☐ No(2)
b. Post-harvest management and waste reduction ☐ Yes (1) ☐ No(2)
c. Good Agricultural Practices on coffee ☐ Yes (1) ☐ No (2)
d. Good Agricultural Practices on dairy production ☐ Yes (1) ☐ No (2)
e. Good Agricultural Practices on food crop and intercropping ☐ Yes (1) ☐ No (2)
f. Nutrition ☐ Yes (1) ☐ No (2)
18. Who provided the trainings in Q18?
☐ Marketing Agent (1) ☐ Union (3) ☐ NGO (3) ☐ Government (4)
☐ Other, specify: __________________________________________________
19. Has the Wet Mill trained its members in 2017 on?
a. Governance ☐ Yes (1) ☐ No (2)
b. Post-harvest management and waste reduction ☐ Yes (1) ☐ No (2)
c. Good agricultural practices on coffee ☐ Yes (1) ☐ No (2)
d. Dairy production ☐ Yes (1) ☐ No (2)
e. Good agricultural practices on Food crop and intercropping ☐ Yes (1) ☐ No (2)
f. Nutrition ☐ Yes (1) ☐ No (2)
Services
20. Do you offer to farmers services other than farm inputs and marketing? ☐ Yes (1) ☐
No (2)
If YES, what service do you offer? ☐ Healthcare (1) ☐ Insurance (2) ☐ Financial
linkage (3)
☐ Other, specify:
Gender and Youth
21. What is the current board composition?
a. Men ______________ Women ______________Youth ______________
22. Are the women able to vote in the selection of new leaders/board members? ☐ Yes (1)
☐ No

X
23. Are the youth able to vote in the selection of new leaders/board members? ☐ Yes (1)
☐ No
24. What activities are women and youth involved in the Wet Mill?
Women____________________________________________________________________
___________________________________________________________________________
___________________________________________________________________________
___________________
Youth:
25. Has the Wet Mill received any training on gender in the past 3 years? ☐ Yes (1) ☐
No (2)
If yes, who facilitated the workshop? ☐ Marketing Agent (1) ☐ Union (2) ☐ NGO
(3) ☐ Other, specify:
26. Has the Wet Mill provided any training on gender in the past 3 years? ☐ Yes (1) ☐
No (2)
27. Does the Wet Mill actively involve woman in the decision-making processes of the Co-
operative?
☐ Yes (1) ☐ No (2)
a. If YES, what steps are taken to involve them? Please elaborate
_____________________________________________________________________
_____________________________________________________________________
__________________________
b. If NO, give reasons:
28. Are there any programs in place to support women?
☐ Yes (1) ☐ No (2) If YES, which ones?
29. Does the Wet Mill/union have any activities in place to engage young people in coffee
farming and support their development as future coffee farmers? ☐ Yes (1) ☐ No (2)
If YES, which activities have been put in place?
___________________________________________________________________________
______________

Y
If NO, give reasons:
___________________________________________________________________________
___________________________________________________________________________
____________________________
30. Has the Co-operative organized any training programs in 2016 aimed specifically at
youth?
☐ Yes (1) ☐ No (2) If YES, which areas did the training cover:
Environmental Awareness
31. Does your Co-operative society strive to lower its negative impact on nature and the
environment?
☐ Yes (1) ☐ No (2)
If YES, what negative impact is your co-operative society actively trying to reduce?
☐ water waste (1) ☐ deforestation (2) ☐ soil degradation (3) ☐ Other, specify:
32. What action are you taking to decrease the negative impact?
___________________________________________________________________________
___________________________________________________________________________
___________________________________________________________________________
_________________________________________
33. Do you borrow operating capital?
s) If yes,
i. How much money in KShs did you borrow? How much interest did you pay
Year Amount Borrowed Interest Paid
2012
2013
2014
2015
2016
34. What are the key challenges affecting the Co-operative/Union?
☐ Infrastructure ☐ Availability of funds ☐ Weather (low rainfall)
☐ Performance of farmers ☐ Access to domestic power
☐ Lack of quality traders ☐ Other, specify:

Z
Future Plans
35. What are your co-operative society plans for the next 3 years?