code of practice for the quality assurance and control for...
TRANSCRIPT

Netherlands Commission on Radiation Dosimetry
Subcommittee VMAT QA
February 2015
Code of Practice for the Quality Assurance and Control
for Volumetric Modulated Arc Therapy
NEDERLANDSE COMMISSIE VOOR STRALINGSDOSIMETRIE
Report 24 of the Netherlands Commission on Radiation Dosimetry
February 2015

ii
Disclaimer regarding NCS reports
The NCS frequently publishes reports for fellow professionals in which recommendations are given for
various quality control procedures or otherwise. The members of the NCS board and the members of
the concerning subcommittee do not claim any authority exceeding that of their professional expertise.
Responsibility on how the NCS recommendations are implemented lies with the user, taking into
account the practice in his/her institution.
This report should be revised before February 2020
iii
Preface
The Nederlandse Commissie voor Stralingsdosimetrie (NCS, Netherlands Commission on
Radiation Dosimetry, http://www.radiationdosimetry.org) was officially established on 3
September 1982 with the aim of promoting the appropriate use of dosimetry of ionising
radiation both for scientific research and practical applications. The NCS is chaired by a
board of scientists, installed upon the suggestion of the supporting societies, including the
Nederlandse Vereniging voor Radiotherapie en Oncologie (Netherlands Society for
Radiotherapy and Oncology), the Nederlandse Vereniging voor Nucleaire Geneeskunde
(Dutch Society of Nuclear Medicine), the Nederlandse Vereniging voor Klinische Fysica
(Dutch Society for Medical Physics), the Nederlandse Vereniging voor Radiobiologie
(Netherlands Radiobiological Society), the Nederlandse Vereniging voor Stralingshygiëne
(Netherlands Society for Radiological Protection), the Nederlandse Vereniging voor
Medische Beeldvorming en Radiotherapie (Dutch Society for Medical Imaging and
Radiotherapy), the Nederlandse Vereniging van Klinisch Fysisch Medewerkers (Dutch
Society for Medical Physics Engineers), the Nederlandse Vereniging voor Radiologie
(Radiological Society of the Netherlands) and the Belgische Vereniging voor
Ziekenhuisfysici/Société Belge des Physiciens des Hôpitaux (Belgian Hospital Physicists
Association). To pursue its aims, the NCS accomplishes the following tasks: participation in
dosimetry standardisation and promotion of dosimetry intercomparisons, drafting of
dosimetry protocols, collection and evaluation of physical data related to dosimetry.
Furthermore, the commission shall maintain or establish links with national and international
organisations concerned with ionising radiation and promulgate information on new
developments in the field of radiation dosimetry.
Current members of the board of the NCS
J.B. van de Kamer, Chairman T.W.M. Grimbergen, Vice-Chairman
J. de Pooter, Secretary J.M.J. Hermans, Treasurer
A. Rijnders A. Spilt
F.W. Wittkämper M.K. Zeeman J.R. de Jong
P. Sminia K. Franken

iv
Code of Practice for the Quality Assurance and Control
for Volumetric Modulated Arc Therapy
February 2015
This report was prepared by a subcommittee of the Netherlands Commission on Radiation
Dosimetry (NCS).
Members of the subcommittee:
Anton Mans
Danny Schuring
Mark Arends
Lia Vugts
Jochem Wolthaus
Heidi Lotz
Marjan Admiraal
Rob Louwe
Michel Öllers
Jeroen van de Kamer
NCS, Delft, the Netherlands
For more information on NCS Reports, see http://radiationdosimetry.org

v
Summary
In December 2010, the NCS installed a new subcommittee to develop guidelines for quality
assurance and control for VMAT treatments. This report has been written by Dutch medical
physicists and has therefore, inevitably, a Dutch focus. Still, the writers of this report expect
that it is also valuable to other institutes preparing to introduce VMAT or willing to set up a
comprehensive QA program for it. The authors chose to use NCS reports on general linac
QA [1] and IMRT QA [2] as a starting point for this report and focussed on the additional QA
and commissioning demands required for the application of VMAT. This report only deals
with VMAT delivered by conventional linear accelerators. The QA for TomoTherapy systems
and similar is being dealt with by another NCS subcommittee.
The introduction covers briefly the transition from IMRT to VMAT and points out the
differences between these two delivery techniques. The second chapter discusses the
machine QA for VMAT. First, the requirements that already are used for IMRT are
summarized, followed by a discussion on the additional tests for VMAT. These tests can be
used in the regular QA program or as a means to analyse possible poor overall QA results.
At the end of the chapter a suggestion is given regarding the frequency of QA tests. It should
be noted that these proposed frequencies may be subject to change, depending on the
experience of the reader’s institute and the available QA equipment. In chapter 3, the
additional requirements for VMAT commissioning in the treatment planning system are
discussed. Special attention is being paid to the translation of the treatment plan, computed
using beams at discrete gantry angles, to the actual delivery with a continuously moving
gantry. Finally, some tips and tricks that may help setting up treatment planning for VMAT
are provided. The last chapter concerns patient-specific QA, covering both high-accuracy
and high-resolution measurements. Additionally, several simple checks for users having a
vast experience with VMAT are discussed. At the end of the report, the value of class-
solutions for patient-specific QA is discussed, along with recommended QA frequencies.
The subcommittee has made a considerable effort to be as complete and thorough as
possible. Still, the user is strongly advised to apply and modify our recommendations to their
local situation. Only a QA system that is smoothly integrated in the local workflow is
manageable, facilitating safe patient treatments. Therefore, this document should be
considered as a set of guidelines for proper QA and not as the only way to do it. A
manageable and coherent QA program can only be set up by the local user.
vi
Contents
Preface .................................................................................................................................. iii
Summary ................................................................................................................................ v
Contents ................................................................................................................................ vi
Abbreviations ...................................................................................................................... viii
1 Introduction .................................................................................................................... 9
2 Machine QA ..................................................................................................................11
2.1 Introduction ............................................................................................................11
2.2 Static gantry ...........................................................................................................12
2.2.1 Gantry angle accuracy with static gantry .........................................................12
2.2.2 Collimator accuracy with static gantry .............................................................12
2.2.3 MLC leaf position accuracy with static gantry ..................................................13
2.2.4 Output linearity and reproducibility with static gantry and nominal dose rate ...14
2.2.5 Flatness and symmetry with static gantry and nominal dose rate ....................15
2.3 Speed determination ..............................................................................................15
2.3.1 Gantry speed ..................................................................................................15
2.3.2 MLC leaf speed ...............................................................................................16
2.4 Dose rate dependence with static gantry ................................................................17
2.4.1 Output accuracy ..............................................................................................17
2.4.2 Flatness and symmetry at lowest dose rate .....................................................17
2.5 Dose rate dependence in dynamic mode ...............................................................18
2.5.1 Flatness and symmetry ...................................................................................18
2.5.2 Output .............................................................................................................20
2.6 MLC leaf position accuracy in dynamic mode .........................................................30
2.7 Interrupt handling ...................................................................................................31
2.8 Proposed test frequencies ......................................................................................32
3 VMAT representation and treatment planning ...............................................................34
3.1 Introduction ............................................................................................................34
3.2 VMAT representation .............................................................................................34
3.2.1 DICOM VMAT representation ..........................................................................34
3.2.2 Treatment unit VMAT interpretation .................................................................35
3.2.3 TPS VMAT modelling ......................................................................................37
3.3 Treatment Planning System commissioning ...........................................................41
3.3.1 Plan restrictions and hardware limitations .......................................................41
3.3.2 Leaf modelling .................................................................................................42

vii
3.3.3 Matched beams ...............................................................................................42
3.4 VMAT Inverse optimisation .....................................................................................43
3.4.1 Dose calculation ..............................................................................................43
3.4.2 Multiple arc optimisation ..................................................................................43
3.4.3 Limited arcs, avoidance sectors ......................................................................44
3.4.4 Plan complexity ...............................................................................................44
3.5 Class solutions .......................................................................................................45
3.6 ‘Tips and tricks’/ Recommendations .......................................................................46
4 Patient specific QA for VMAT ........................................................................................49
4.1 Introduction ............................................................................................................49
4.2 Absolute and relative dose measurements .............................................................50
4.2.1 Ionisation chambers ........................................................................................50
4.2.2 Thermoluminescent dosimetry ........................................................................51
4.2.3 Film dosimetry .................................................................................................51
4.2.4 Detector Arrays ...............................................................................................52
4.2.5 EPID dosimetry ...............................................................................................53
4.3 Gamma evaluation .................................................................................................53
4.4 Plan transfer validation ...........................................................................................54
4.5 Plausibility checks ..................................................................................................55
4.6 Recommendations for patient specific QA ..............................................................56
4.6.1 Absolute and relative dosimetry ......................................................................56
4.6.2 Gamma evaluation ..........................................................................................56
4.6.3 Class solutions ................................................................................................57
4.6.4 Frequency and type of patient-specific QA ......................................................57
Acknowledgements ..............................................................................................................60
References ...........................................................................................................................61

viii
Abbreviations
aSi Amorphous Silicon
CP Control Point
DICOM Digital Imaging and Communications in Medicine
EBT External Beam Treatment
EPID Electronic Portal Imaging Device
HDR High Dose Rate
HGS High Gantry Speed
IMRT Intensity-Modulated Radiation Therapy
LDR Low Dose Rate
LGS Low Gantry Speed
linac
MAIO
Linear accelerator
Maximum Allowable Inertia Overshoot
MC Monte Carlo
MLC Multi-Leaf Collimator
MU Monitor Unit
NCS Nederlandse commissie voor stralingsdosimetrie
QA Quality Assurance (set of policies and procedures to
maintain the quality of patient care)
R&V Record & Verify
RT Radiotherapy
RTT Radiotherapy Technologist
SSD Source Surface Distance
TLD Thermoluminescence Dosimeter
TPS Treatment Planning System
VMAT Volumetric Modulated Arc Therapy

9
1 Introduction
Over the last 30 years, dose delivery techniques in radiation therapy have rapidly evolved. In
the 1980s and early 1990s, conformal techniques consisting of usually not more than 5
beams were common. Either rectangular fields or fixed field shapes using cerrobend blocks
were used to obtain a suitable dose distribution. The availability of MLCs resulted in the
generation of more conformal fields, as well as in the introduction of IMRT [3].
IMRT introduced the possibility to shape non-uniform dose distributions and hypofractionate
certain parts of the tumour that are for example more radio resistant than other parts. These
integrated or sub-volume boost techniques have been applied in several clinical trials over
the last decade [4–6].
In IMRT, each treatment beam is subdivided in multiple small beams or beamlets. The
fluence intensity in each of these beamlets can be optimized leading to highly conformal
dose distributions. Compared to the traditional conformal beam set-up, more beams (up to
seven or more) are used in IMRT. At present, there are two methods to deliver these highly
conformal dose distributions, either static or dynamic IMRT. Static IMRT is often also referred
to as ‘step and shoot’ IMRT. In this case, the MLC generates several beam shapes and the
beam is off during the movement of the MLC. During dynamic or ‘sliding window’ IMRT, the
leaves move continuously while the beam is on.
The highly conformal dose distributions come at a price. The number of MUs in IMRT is
much higher than in conventional radiotherapy. This leads to prolonged treatment times,
potentially resulting in increased intra-fractional patient movement. Additionally, a higher
number of MUs may lead to a higher integral dose to normal healthy tissues increasing the
risk of secondary cancer(s). These disadvantages were partially counteracted with the
introduction of VMAT in 2008 [7–9] which also enables the delivery of highly conformal dose
distributions. A difference with fixed beam IMRT is that during VMAT the gantry rotates
around the patient while the beam is on and gantry rotation speed, dose rate and beam
shape vary continuously. For IMRT, the optimal, fixed gantry angles need to be determined
in advance which is not always straightforward [10,11]. Because the gantry angle, MLC and
dose rate continuously change during VMAT, the dose delivery is more time efficient
compared to IMRT. This leads to significantly shortened treatment times and slightly lower
integral dose. Another difference between VMAT and (step and shoot) IMRT is that there is
a fundamental difference between the representation of a VMAT arc in the TPS and on the
linac. In the TPS the arc is represented by a set of static beams, all having a single MLC

10
shape. On the linac, however, the MUs are delivered continuously while gantry angle, MLC
shape and dose rate are varying.
TomoTherapy can be considered as the oldest VMAT technique but this technique is the
topic of a future NCS report. The present report will only discuss the application of VMAT on
traditional radiotherapy linacs. Vendors offer VMAT on regular linacs but each vendor uses
its own brand name for VMAT (RapidArc is used by Varian and VMAT is used by Elekta).

11
2 Machine QA
2.1 Introduction
The introduction of VMAT resulted in synchronous gantry rotation and leaf movement, dose
rate changes and collimator rotation. For each treatment unit type, the moving parts of the
machine are enslaved to a leading parameter. The vendors have chosen different leading
parameters: gantry angle (Varian Clinac) or delivered number of MU (Elekta and Varian
TrueBeam). Since errors in these leading parameters will propagate to the enslaved
parameters, the accuracy of the leading parameters is of the utmost importance.
The characterisation and understanding of the dynamic behaviour of the linac is the first step
in implementing VMAT. The suggested machine QA tests in this chapter will assist the user
to assess the dynamic linac properties during VMAT delivery and verify the accuracy of
VMAT dose delivery. For convenience, the aspects of linac commissioning for conventional
IMRT as described in NCS report 22 [2] are summarised in paragraph 2.2 dealing with static
gantry tests. It is assumed that these prerequisites are fulfilled before the commissioning of
VMAT.
The next paragraphs describe how to translate the existing static beam tests into their
dynamic counterparts. Since the dynamic behaviour includes gantry and MLC motion and
dose rate variation, tests are needed to verify each quantity separately as well as combined.
Regular patient-specific QA can be regarded as ‘overall’ system check, where multiple
parameters are varied simultaneously, providing a general impression of the machine
performance. If patient specific QA results indicate that deviations are caused by machine
delivery problems, this chapter provides tests that may help to determine the root cause of
the failure. Depending on the characteristics of the released clinical VMAT applications,
users may choose to disregard specific tests.
The tests in this chapter may help identifying the dynamic characteristics of the treatment
machine and the range in which the machine functions correctly. The user should ensure that
the machine does not operate outside this range during clinical application of VMAT.
Although most tests are rather easy to implement, for the more complex tests (sections 2.5
and 2.6) the user is strongly encouraged to either develop DICOM RT plans that enable the

12
delivery of these tests in-house, or ask the vendor and institutes with the same treatment
equipment for assistance.
Since collimator rotation is usually not used clinically in VMAT, this chapter does not include
tests to verify the collimator rotation accuracy during VMAT delivery. For those instances
where dynamic collimator rotation is applied, the user should set up tests for collimator
rotations in the same fashion as gantry rotations.
2.2 Static gantry
In this section, we briefly summarise the recommendations of NCS reports 9 [1] and 22 [2]
that serve as a baseline for VMAT linac QA.
2.2.1 Gantry angle accuracy with static gantry
Scope
To determine the baseline level of the gantry angle accuracy, to be used as reference for
VMAT.
Background
The gantry angle is an important quantity in VMAT treatments. One should record the
baseline accuracy under static operation for comparison with the dynamic VMAT mode.
Suggested tests
Measurement of the gantry angle for the cardinal angles using a spirit level or inclinometer.
Tolerances
Suggested tolerance is 1˚, in accordance with NCS report 9. However, an accuracy of 0.5˚ is
achievable.
2.2.2 Collimator accuracy with static gantry
Scope
To determine the baseline level of the collimator angle accuracy, to be used as reference for
VMAT.

13
Background
The collimator angle can be one of the dynamic parameters used in VMAT. One should
record the baseline accuracy under static operation for comparison with the dynamic VMAT
mode.
Suggested tests
Measurement of all cardinal collimator angles, using a spirit level or inclinometer at gantry
angles 90 and 270°, as described in NCS report 9 [1].
Tolerances
Suggested tolerance is 1˚, in accordance with NCS report 9. However, an accuracy of 0.5˚ is
achievable.
2.2.3 MLC leaf position accuracy with static gantry
Scope
To determine the baseline level of MLC leaf position accuracy, to be used as reference for
VMAT.
Background
The MLC leaf position is one of the dynamic VMAT parameters. One should record the
baseline accuracy level under static operation for comparison with the dynamic VMAT mode.
Suggested tests
The picket fence test needs to be executed for all cardinal angles, as described in NCS
report 22.
Tolerances
For all cardinal gantry and collimator angles the leaf positioning accuracy should be better
than 1.0 mm, preferably < 0.5 mm, with respect to the desired position for each leaf. Leaf
position reproducibility should be better than 0.5 mm.

14
2.2.4 Output linearity and reproducibility with static gantry and nominal dose rate
Scope
To determine the baseline level of output linearity and reproducibility in static mode with
nominal dose rate, to be used as reference for VMAT.
Background
With VMAT the dose is given with varying dose rates, demanding a high precision on the
integration capacity and reproducibility of the MU system.
Suggested tests
Both linearity and reproducibility of the machine output need to be determined for the
clinically used range, similar to NCS report 9 and 22 (e.g. MU = 2, 5, 10, 20, 50, 100, 200,
500, 1000).
The linearity is defined as:
� =�
��
where
R= reading of the measurement
MU = the number of monitor units.
The reproducibility is defined as the coefficient of variation, defined by:
� =100
���
�� − ����
� − 1%
�
���
where
n = the number of measurements
Ri= reading of the ith measurement
� is the average value of the ratios Ri
Tolerances
Linearity should be within 1%. Reproducibility should be within 0.5%

15
2.2.5 Flatness and symmetry with static gantry and nominal dose rate
Scope
To determine the baseline level of flatness and symmetry in static mode, to be used as
reference for VMAT.
Background
Both flatness and symmetry may vary with moving gantry. The values should be determined
in static operation as a baseline for comparison with results obtained in dynamic mode.
Suggested tests
Measurement of beam profiles in the cardinal directions for cardinal gantry angles.
Tolerances
Flatness should be within 3%, symmetry should be within 3% in the flattened area, as
suggested in NCS report 9 [1] for cardinal angles. Note that it should be possible to have the
flatness and symmetry within 1.5%.
2.3 Speed determination
2.3.1 Gantry speed
Scope
To determine the maximum gantry speed and to verify if it is in accordance with the vendor
specifications.
Background
When the linac is operating in dynamic mode, gantry speed is the result of the position
demands of the gantry between two consecutive control points, the number of Monitor Units
to be delivered between these control points and the actual dose rate. The maximum and
minimum gantry speeds are used as an input variable for most TPSs.

16
Suggested tests
Record the rotation speeds using different speed demands through a user-defined control
point sequence in a DICOM RT plan file or directly at the machine. If possible, record both
averaged and actual rotation speed to assess the constancy of the speed.
Tolerances
Gantry speed should be within manufacturer specifications and the maximum gantry speed
should be entered in the TPS.
2.3.2 MLC leaf speed
Scope
To determine the maximum leaf speed of the slowest leaf. This may be used for input in the
TPS.
Background
Characterisation of the maximum speed of the slowest leaf and speed fluctuations is required
to ascertain good correspondence between TPS estimated delivery times, speeds and dose
rates versus the actual ones. Since identical behaviour of all leaves during delivery is
assumed within the TPS, the maximum leaf speed entered in the TPS should be determined
by maximum leaf speed of the slowest leaf. Note that a correctly defined leaf speed is not
related to an accurate leaf position.
Suggested tests
The maximum leaf speed of all leaves should be determined under all cardinal gantry angles
(or at least one reference and one under 90˚/270˚) with the leaf travel direction both parallel
and perpendicular to the direction of gravity. The leaves are all set at one far end and
requested to travel to the other far end. If available in the service tools of the linac
(depending on the vendor), one can record the leaf speed for single or multiple leaves when
travelling across the collimator opening. Otherwise, leaf-speed can be retrieved from the
linac log files. A qualitative approach would be visual inspection (either directly or at the
console depicting the leaves) of the trailing of leaves when they travel across the field.
Tolerances
At all angles leaf speeds should be within manufacturer specifications and the maximum leaf
speed should be entered in the TPS.

17
2.4 Dose rate dependence with static gantry
2.4.1 Output accuracy
Scope
To benchmark the accuracy of the linac ionisation chamber for multiple and varying dose
rates.
Background
The ionisation chamber of the treatment machine may become non-linear at low dose rates
or during dose rate switching. As the dose rate frequently changes during VMAT delivery,
this may influence the accuracy of the machine output.
Suggested tests
Determine the output of a 10x10 cm2 field at five discrete dose rates, including the minimum
and maximum dose rate. The second test is to determine the output stability with varying
dose rates. For a given number of MUs, set the initial dose rate to the allowed minimum for
approximately 1/3 of the number of MUs. Subsequently, switch it to maximum dose rate for
about 1/3 of the MUs and finally, switch it back to deliver the rest with the minimal allowed
dose rate. All tests should be performed at all cardinal gantry angles.
Tolerances
For all tests, the output should be within 0.5% compared to the reference value.
2.4.2 Flatness and symmetry at lowest dose rate
Scope
To determine minimum dose rate under which the linac can operate reliably in static mode at
cardinal gantry angles.
Background
Monitor chamber response may become non-linear at low dose rates or during dose rate
switching. Additionally, the irradiation beam may become unstable at very low dose rates.
Since VMAT frequently uses (much) lower dose rates compared to the nominal dose rates

18
one needs to determine the minimum and maximum dose rates at which a stable beam can
be created.
Suggested tests
Set the dose rate manually to the lowest dose rate with a stable beam and stable output (See
section 2.4.1, and NCS 9 and 22. Additionally, determine flatness and symmetry for the
minimum and maximum dose rate and three levels between them. This should be done
under gantry angle zero using the maximum measurable field size. For the other cardinal
angles, determine the flatness and symmetry for minimum and maximum dose rate.
Tolerances
Dose rate should be stable as specified by the manufacturer. For all cardinal angles, flatness
should be within 2% compared to a reference profile (see section 2.2.5) for all dose rates.
Symmetry within the flattened area should be within 2% compared to a reference profile.
Note that <1.5% should be achievable.
2.5 Dose rate dependence in dynamic mode
2.5.1 Flatness and symmetry
2.5.1.1 Flatness and symmetry at various continuous dose rates during gantry rotation
Scope
To determine the field flatness and symmetry at fixed dose rates during constant gantry
rotation.
Background
Due to the continuously changing field shape and gantry angle, VMAT plans generally show
more dose segments at low dose rates than in IMRT or 3D-CRT to meet the speed limiting
properties of the various linac components. The flatness and symmetry checks are already
part of the standard machine QA at cardinal gantry angles. However, to ensure an accurate
dose delivery in a dynamic mode of the linear accelerator, the field profiles in dynamic mode
should be equal to the profiles in static mode. Since TPS systems rely on data acquired in
static mode at gantry 0°, the profiles must be stable during gantry rotation, in particular for
low dose rates.

19
Suggested test
A linear (1D or 2D) dose detector array can be used to take angle-resolved measurements of
the beam profile. The array must be positioned perpendicular to the beam direction for all
gantry angles (e.g. gantry head mounted) and the sample frequency of the detector has to be
sufficiently high to obtain representative snapshots. Preferably, more than one profile per 5°
at maximum gantry speed should be acquired. The applied VMAT plan for this test
comprises of an open field of maximum field size and an angular spacing of the control
points of about 4 degrees to ensure a continuous movement of the linac (note that in theory
the control point spacing should not influence this test).
Measurements are to be performed at least at five dose rate levels, including the maximum
and minimum allowed dose rate. For linacs using binned dose rates, it is advised to slightly
increase the total number of MUs for each arc segment (e.g. 5%) to prevent the system from
falling back in a lower dose rate mode than intended due to minor instabilities of the system.
For the analysis of the cardinal gantry angle results, the field flatness and field symmetry
have to be within the specifications of the static gantry angle tests in section 2.2. For all other
gantry angles, visual inspection of the profile should provide adequate insight whether further
investigation is warranted or not.
Tolerances
Flatness variation and symmetry variation at all dose rates and gantry angles should be
smaller than 2% with respect to a reference profile using the same equipment (following NCS
report 22). It is recommended to only use dose rates in clinical practice that are within the
defined flatness variation and symmetry tolerances.
2.5.1.2 Flatness and symmetry during gantry rotation and dose rate changes
Scope
To determine the stability of the field flatness and field symmetry during gantry rotation with
constant gantry speed including dose rate changes.
Background
VMAT plan delivery often includes dose rate changes. To ensure accurate dose delivery
during VMAT, field flatness and symmetry must be stable while the dose rate changes.
20
Suggested test
A DICOM RT plan is required in which the arc is divided in angular sectors with alternating
dose rates (from maximum down to the minimum stable dose rate according to 2.4.1). A
dose detector array as discussed in 2.5.1 can be used but it must be capable of time-
resolved profile recording. Because the sampling frequency of detectors is limited, each dose
segment must be long enough to prevent undersampling. Field flatness and symmetry
should be determined and evaluated for each dose rate sector, in particular immediately after
a change in dose rate.
Tolerances
Flatness and symmetry should be within 2% of their static reference values within 5 MU after
a change in dose rate.
Gantry speed
Low High
Do
se
ra
te
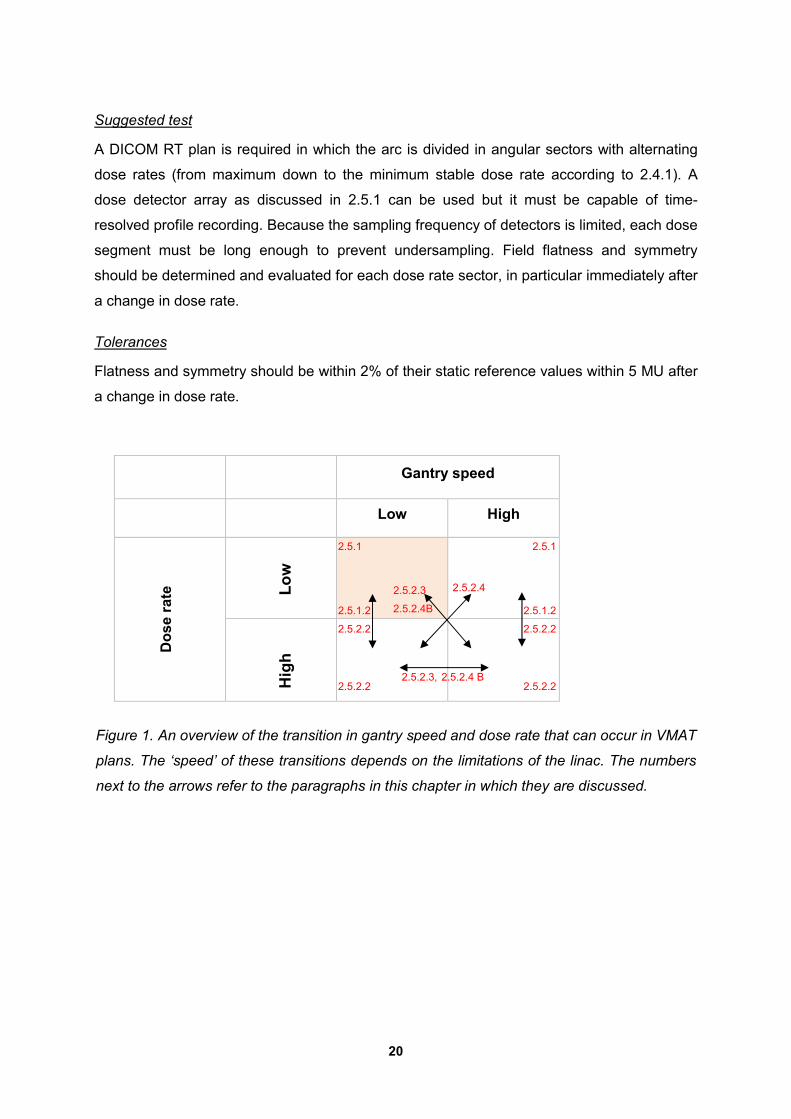
Figure 1. An overview of the transition in gantry speed and dose rate that can occur in VMAT
plans. The ‘speed’ of these transitions depends on the limitations of the linac. The numbers
next to the arrows refer to the paragraphs in this chapter in which they are discussed.
Hig
h
L
ow
2.5.1
2.5.1.2
2.5.2.2
2.5.2.2
2.5.1
2.5.1.2
2.5.2.2
2.5.2.2
2.5.2.3
2.5.2.4B
2.5.2.4
2.5.2.3, 2.5.2.4 B

21
2.5.2 Output
The dynamic behaviour of the treatment machine is determined by several varying
parameters: gantry (and collimator) rotation, MLC motion and dose rate variation. Although
the TPS will try to create an optimal and efficient treatment plan, the linac itself will
autonomously decide what the actual speed and dose rate will be that fits the prescription.
This paragraph describes the tests to verify the accuracy of VMAT delivery related to the
mutually dependent gantry rotation and dose rate variation. The tests cover the various
transitions in gantry speed and dose rate that can occur in VMAT plans, and enable users to
determine if the linac can meet the settings applied in the TPS. Vice versa, these tests may
help to set limits to the degrees of freedom that are allowed in treatment planning. Figure 1
gives an overview of the paragraphs where the gantry speed and dose rate changes
occurring in VMAT will be discussed.
2.5.2.1 Output beyond 1000 MU
Scope
To verify the linearity of the treatment machine for a large number of MUs.
Background
It is assumed that the linearity has been verified according to NCS reports 9 (Ch 8.1-3) and
22 (Ch. 2.4.2.2). In these reports, the maximum number of MUs is limited to 1000 to meet the
clinical restrictions of open fields and IMRT. However, since VMAT plans may deliver much
more MUs per arc, these linearity tests should be extended to the clinically used range of
MUs.
Suggested test
A VMAT beam of a 10 x 10 cm2 field containing 4000 MU (or more, if relevant) has to be
delivered over 360°, with the MUs evenly distributed in 4° intervals. Subsequently, a 10 x 10
cm2 VMAT beam over 360° containing 100 MU has to be delivered as reference. The total
dose for both beams should be determined with an ionisation chamber. The setup is
preferably isocentric or gantry mounted to be able to directly compare the results to the
(static) reference. For an isocentric setup, the plan should be irradiated on a cylindrical
phantom with an ionisation chamber at the centre in order to avoid angular dependence, or
an ionisation chamber with a build-up cap. Alternatively, a linac head-mounted device can be
used. A dose detector should be used as described in section 2.5.1.

22
Tolerances
The maximum allowed deviation from the reference is 0.5%.
2.5.2.2 Output in the presence of dose rate changes at constant gantry speed
Scope
To verify whether the linac output is constant during gantry rotation including changes in
dose rate.
Background
For fixed gantry angles, the tests to determine the effect of dose rate variations on the
monitor chamber has already been described (section 2.4.1). The dynamic linac behaviour
(i.e. gantry rotation and dose rate modulation) may affect the accuracy of the delivered dose
in an arc segment.
Suggested test
The test plan as described in paragraph 2.5.1.2 can be used. The plan should be irradiated
on a cylindrical phantom with an ionisation chamber at the centre in order to avoid angular
dependence, or an ionisation chamber with a build-up cap. Alternatively, a linac head-
mounted device can be used. A dose detector should be used as described in section 2.5.1.
The delivered (accumulated) dose for the whole plan and optionally for each dose sector,
has to be determined and compared with the reference value. The reference dose level can
be established by delivering the same number of MU with the same field size at constant
dose rate
Tolerances
The difference between measured and reference dose of the integral plan should be within
0.5%. If time-resolved ionisation chamber measurements can be performed, each delivered
dose segment should not differ more than 1% from the reference dose for all dose rates.
2.5.2.3 Mutual dependence of dose rate and gantry speed
Scope
To determine the relationship between gantry rotation speed and dose rate.
23
Background
An accurate control of gantry angle, gantry angle speed and dose rate is necessary for
accurate dose delivery. It is possible to deliver equal doses per sector in two ways: high
gantry speed and high dose rate, or low gantry speed and low dose rate. For a specific dose
delivery per gantry angle, the gantry angle speed and the dose rate are related according:
���������������� = �(�����������)
��=
�(�����������)
�(�����)∗
�(�����)
��
= 1
�������������������� �
∗ ��������
In this formula, t = time and CumMU is the cumulative number of delivered MUs.
Although some treatment planning systems can be steered to create treatment plans that
can be delivered with constant gantry speed, this cannot be enforced. The linac will always
autonomously determine the gantry speed, dose rate and MLC leaf speed.
Note that for dose rates limited to discrete levels (e.g. Elekta linacs with binned dose rates),
the desired dose per degree has to be delivered by one of the discrete dose rate levels and a
certain gantry speed.
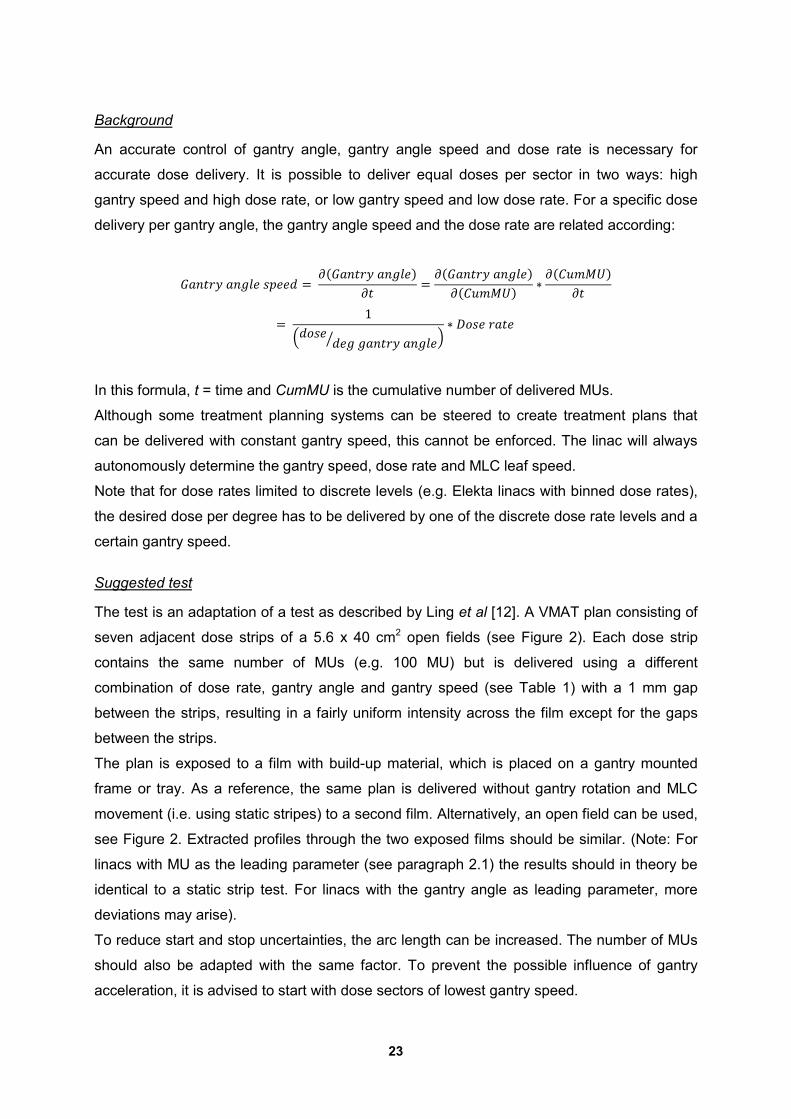
Suggested test
The test is an adaptation of a test as described by Ling et al [12]. A VMAT plan consisting of
seven adjacent dose strips of a 5.6 x 40 cm2 open fields (see Figure 2). Each dose strip
contains the same number of MUs (e.g. 100 MU) but is delivered using a different
combination of dose rate, gantry angle and gantry speed (see Table 1) with a 1 mm gap
between the strips, resulting in a fairly uniform intensity across the film except for the gaps
between the strips.
The plan is exposed to a film with build-up material, which is placed on a gantry mounted
frame or tray. As a reference, the same plan is delivered without gantry rotation and MLC
movement (i.e. using static stripes) to a second film. Alternatively, an open field can be used,
see Figure 2. Extracted profiles through the two exposed films should be similar. (Note: For
linacs with MU as the leading parameter (see paragraph 2.1) the results should in theory be
identical to a static strip test. For linacs with the gantry angle as leading parameter, more
deviations may arise).
To reduce start and stop uncertainties, the arc length can be increased. The number of MUs
should also be adapted with the same factor. To prevent the possible influence of gantry
acceleration, it is advised to start with dose sectors of lowest gantry speed.

24
Figure 2 Profiles of an open field (red) and dynamic stripes field (blue).
Table 1. The three possible combinations of gantry speed, dose rate and angular sector
length.
In general, the linac will deliver the dose in the shortest amount of time, thereby maximizing
gantry speed and dose rate. Therefore, changing gantry speed at low dose rate can only
occur when either the dose rate is explicitly defined or leaf travel (as third limiting parameter)
is introduced (this is depicted by the red shaded quadrant in figure 1). Note that one can
create test plans consisting of multiple dose sectors from any of the three combinations.
Tolerances
Differences between profiles obtained with and without gantry rotation should be smaller than
2%.
50 100 150 200 250 3000
50
100
150
200
250
300
350
400
Profile axis [mm]
Dose [
cG
y]
Open field
Stripes field
(a) Constant gantry speed (b) Constant dose rate (c) Constant angular sector length
Number
of MU Dose rate
Angular
sector
length
Gantry
speed
Number
of MU Dose rate
Angular
sector
length
Gantry
speed
Number
of MU Dose rate
Angular
sector
length
Gantry
speed
1 X DRMax Δ v 1 X DR Δ vmax 1 X DRMax Δ vmax
2 X DRMax/2 2Δ v 2 X DR 2Δ vmax/2 2 X DRMax/2 Δ vmax/2
3 X DRMax/4 4Δ v 3 X DR 4Δ vmax/4 3 X DRMax/4 Δ vmax/4
4 X DRMax/8 8Δ v 4 X DR 8Δ vmax/8 4 X DRMax/8 Δ vmax/8
5 X DRMax/16 16Δ v 5 X DR 16Δ vmax/16 5 X DRMax/16 Δ vmax/16
25
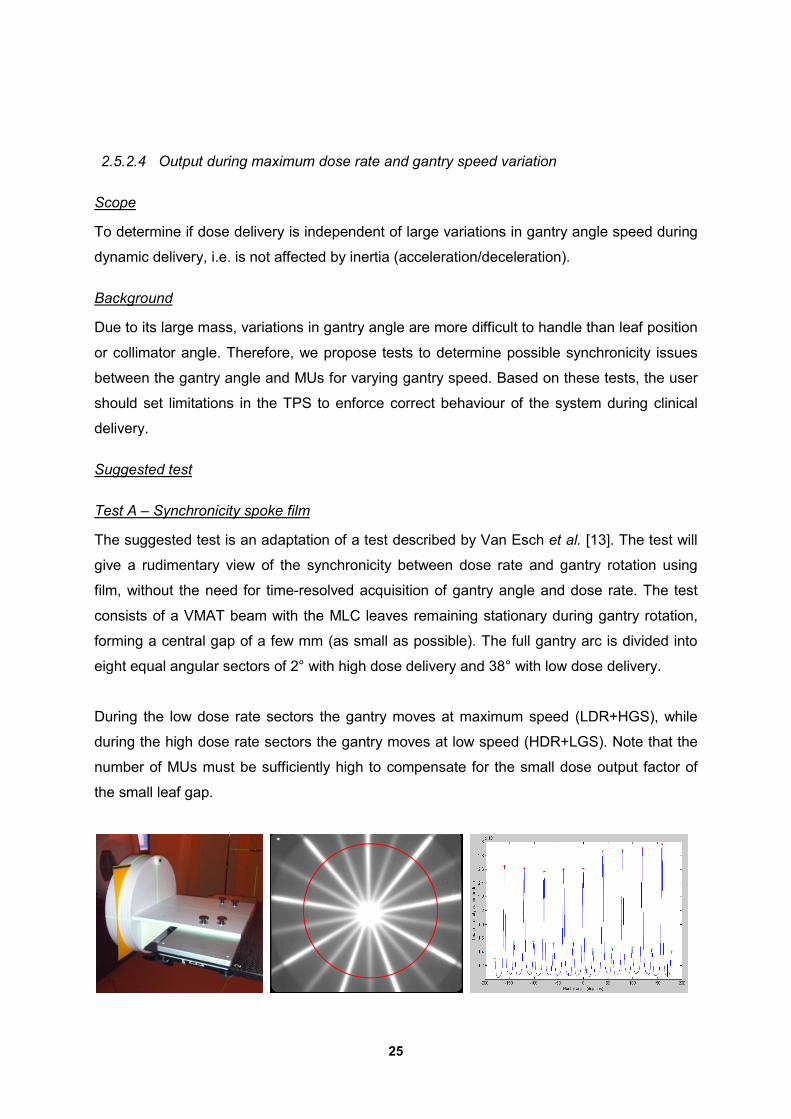
2.5.2.4 Output during maximum dose rate and gantry speed variation
Scope
To determine if dose delivery is independent of large variations in gantry angle speed during
dynamic delivery, i.e. is not affected by inertia (acceleration/deceleration).
Background
Due to its large mass, variations in gantry angle are more difficult to handle than leaf position
or collimator angle. Therefore, we propose tests to determine possible synchronicity issues
between the gantry angle and MUs for varying gantry speed. Based on these tests, the user
should set limitations in the TPS to enforce correct behaviour of the system during clinical
delivery.
Suggested test
Test A – Synchronicity spoke film
The suggested test is an adaptation of a test described by Van Esch et al. [13]. The test will
give a rudimentary view of the synchronicity between dose rate and gantry rotation using
film, without the need for time-resolved acquisition of gantry angle and dose rate. The test
consists of a VMAT beam with the MLC leaves remaining stationary during gantry rotation,
forming a central gap of a few mm (as small as possible). The full gantry arc is divided into
eight equal angular sectors of 2° with high dose delivery and 38° with low dose delivery.
During the low dose rate sectors the gantry moves at maximum speed (LDR+HGS), while
during the high dose rate sectors the gantry moves at low speed (HDR+LGS). Note that the
number of MUs must be sufficiently high to compensate for the small dose output factor of
the small leaf gap.

26
Figure 3. (a) Experimental setup of the cylindrical phantom for VMAT delivery. (b) the
exposed twinkle star film. The red circle depicts a circular contour that can be used to extract
the angle of each stripe as well as the intensity at a fixed distance from the centre of the
twinkle star. (c) The image/dose values at the circular contour. A small shift of the phantom
causes a difference in intensity of the stripes.
A film sandwiched within a cylindrical phantom and positioned in the plane of gantry rotation,
is used to obtain the dose profiles (see Figure 3 ). The phantom should be mounted outside
the table top to prevent attenuation by the couch. Since this test implies gantry angle
determination, correct positioning and orientation of the film with respect to the isocentre has
to be ensured. The angle of each spoke with respect to the gantry in upward position (0°) has
to be determined and compared with the intended gantry angle of the particular stripe.
The repeatability of the dose delivery can be obtained by determining the relative intensity of
each stripe at a fixed distance from the centre of the twinkle. Note that positioning errors or
isocentre inaccuracies will affect the height of the profile, making it impossible to use the
height as a reliable measure. Note that the conversion of the (optical density of the) film to
absolute dose is preferable but not a necessity.
An alternative can be to change the order of the spokes to 1, 3, 5, 7 and 9 for clockwise
gantry rotation and 8, 6, 4 and 2 for counter-clockwise gantry rotation within a single arc.
Inertia issues become more clearly visible since the odd and even peaks will shift in opposite
direction.
If a cylindrical phantom is not available, a rectangular or other shaped phantom can be used
as an alternative. However, the source-surface-distance will then be different for each gantry
angle and consequently a different dose at the same radial distance will be measured. The
height of the profiles (at the spokes) will thus not be directly related to the delivered dose.
The same is true if a cylindrical phantom is used that is not mounted outside the table top.
Tolerances
The intended and measured angular position of the peaks should be in agreement within 1°.
Test B – Maximum Allowable Inertia Overshoot (MAIO) test
The test A, described above, deals with the situation of LDR-HGS (small dose segment)
switching to HDR- LGS (large dose segment), and vice versa. But, if an arc segment with
27
HDR-HGS precedes a segment with LDR-LGS, a too slow deceleration of the gantry or
reduction in dose rate will have a large impact on the dose delivered in the succeeding
segment. The gantry may respond erratically in an attempt to follow the prescription. This
may either result in delivering the dose too soon, before the gantry has reached the
requested gantry angle, or too late, after the gantry has moved beyond its prescribed angle.
If the resulting deviation from the prescribed plan cannot be corrected within a defined
period, a linac interlock will occur. To prevent such behaviour, maximum gantry speed and/or
gantry acceleration parameters could be adjusted. Note that in practice the linac will not
interrupt due to exceeding gantry speed or inertia limits but due to large field symmetry or
flatness errors induced by high gantry inertia and a large dose rate change. Some treatment
planning systems offer mechanisms to avoid strong gantry acceleration and deceleration.
The linac will generally deliver the dose in the shortest possible time, thereby maximizing
gantry speed and dose rate. Thus, to enforce the treatment machine to change the gantry
speed at low dose rate, the dose rate needs to be defined explicitly. If that is not possible,
leaf travel (just) outside the aperture (the guard leaves for Elekta linacs) may be used to
enforce the combination of low gantry speed and low dose rate (See Table 2) or use the
outermost leaves if the field size is large enough to neglect output changes.
In Table 3, an example of a prescription to test machine inertia performance is presented. To
enforce quick changes in gantry speed, the delivered dose in the segment is reduced in one
of the linac states while keeping the other state constant. This will make it possible to
analyse the origin of possible limitations. Combining any of the linac states from Table 2,
users can create their own inertia test dedicated to their needs. Note that the transition to LL
is not displayed in Table 3. MLC motion is required to perform such a transition, which will
add a higher level of complexity to the test plans. Inertia will be tested as well in transitions
towards HL.

28
Table 2. Overview of the dose rate and gantry speed settings to create a test plan for inertia
verification.
Sector
label
Linac state Sector * Delivered
Dose
rate
Gantry
Speed
Dose
(MU)
Gantry
travel
Leaf
travel
Explicit
def. dose
rate
Dose
rate
Gantry
Speed
[MU] [deg] [cm] [MU/min] [MU/min] [deg/s]
1-LH L H 2 12 60 6
2-LL L L 2 2 12** 60 60 1
3-HL H L 20 2 600 1
4-HH H H 20 12 600 6
* Each sector is scalable if each parameter is proportionally scaled
** Leaf travel required for a 2s (or 1 deg/s gantry speed) may be linac dependent.
The limitations of the linac can be found by changing the overall dose of the test plans. By
scaling the dose of each sector, each involved parameter is also proportionally scaled (Table
3). The outcomes of this test can be used to set corresponding parameters in the TPS if
available (e.g. gantry speed or smoothing/efficiency parameters). Furthermore, by performing
this test it is possible to determine if the treatment machine can handle abrupt changes,
without interrupts. The clinically possible changes should be well within the capabilities of the
linac.
Table 3. Suggested test plan to verify the linac inertia properties by varying the dose and
the gantry travel for each sector.
Dose
sector
number
Linac state Sector
label
Sector
Dose
rate
Gantry
Speed
Dose
(MU)
Gantry
travel
[MU] [deg]
HDR+LGS – HDR+HGS with decreasing HH dose sector size
1 H L 3-HL 20.00 2.00
2 H H 4-HH 20.00 12.00
3 H L 3-HL 20.00 2.00
4 H H 4-HH 10.00 6.00
5 H L 3-HL 20.00 2.00

29
6 H H 4-HH 5.00 3.00
7 H L 3-HL 20.00 2.00
8 H H 4-HH 2.50 1.50
9 H L 3-HL 20.00 2.00
10 H H 4-HH 1.25 0.75
11 H L 3-HL 20.00 2.00
HDR+LGS – HDR+HGS with decreasing HL dose sector size
1 H L 3-HL 20.00 2.00
2 H H 4-HH 20.00 12.00
3 H L 3-HL 10.00 1.00
4 H H 4-HH 20.00 12.00
5 H L 3-HL 5.00 0.50
6 H H 4-HH 20.00 12.00
7 H L 3-HL 2.50 0.25
8 H H 4-HH 20.00 12.00
9 H L 3-HL 1.25 0.13
10 H H 4-HH 20.00 12.00
HDR+LGS – LDR+HGS with decreasing HL dose sector size
1 H L 3-HL 20.00 2.00
2 L H 1-LH 20.00 120.00
3 H L 3-HL 20.00 2.00
4 L H 1-LH 10.00 60.00
5 H L 3-HL 20.00 2.00
6 L H 1-LH 5.00 30.00
7 H L 3-HL 20.00 2.00
8 L H 1-LH 2.50 15.00
9 H L 3-HL 20.00 2.00
10 L H 1-LH 1.25 7.50
11 H L 3-HL 20.00 2.00
HDR+LGS – LDR+HGS with decreasing LH dose sector size
1 H L 3-HL 20.00 2.00
2 L H 1-LH 10.00 60.00
3 H L 3-HL 10.00 1.00
4 L H 1-LH 10.00 60.00
5 H L 3-HL 5.00 0.50
6 L H 1-LH 10.00 60.00
7 H L 3-HL 2.50 0.25
8 L H 1-LH 10.00 60.00
9 H L 3-HL 1.25 0.13
10 L H 1-LH 10.00 60.00

30
Tolerances
The clinically used changes in gantry speed and dose rate variations should be deliverable
by the linac. The test described above should help to determine what the limitations of the
linac are.
2.6 MLC leaf position accuracy in dynamic mode
Scope
To determine the positional accuracy of the leaf position with moving gantry and leaves. This
test is an extension of the test described in section 2.2.3.
Background
This test shows the leaf positioning accuracy in dynamic mode. Leaf motion direction, gantry
motion direction and gravity effects may influence MLC positioning.
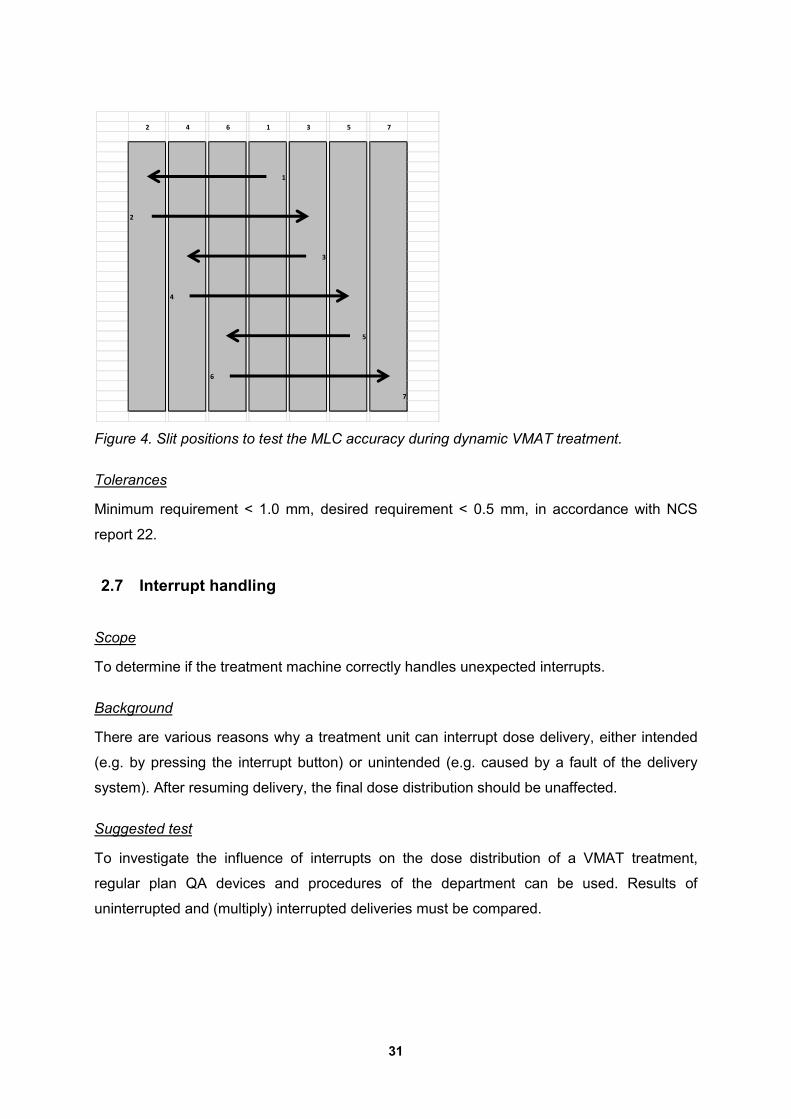
Suggested test
This test is a dynamic version of the picket fence test [14]. Place a film orthogonal to the
beam placed on a gantry mounted frame or tray (section 2.5.2.3) or use the EPID to record
an image. Use a VMAT sector with a high dose rate and a non-moving MLC slit to produce
the strip field. The next segment should consist of a low dose rate combined with a high MLC
speed sector to move the field opening to the next position. When starting with the centre slit
and delivering the subsequent slits as shown in the Figure 4, one ensures maximum MLC
speed between the slits.
Perform the test with different collimator angles, and at different starting position of the
gantry, both in clockwise and counter clockwise direction to investigate the influence of
gravity on leaf positioning. Emanating from section 2.2.3 with MLC position accuracy within
limits, a static plan of the seven strips at gantry 0° can be created and delivered to a second
film in the same setup as a reference. Derive dose profiles in the direction of the leaf
movement to compare expected (from the reference) and measured positions of the
abutments as well as the depth of the abutments according to NCS report 22 [2] and Sastre-
Padro et al. [15].
31
Figure 4. Slit positions to test the MLC accuracy during dynamic VMAT treatment.
Tolerances
Minimum requirement < 1.0 mm, desired requirement < 0.5 mm, in accordance with NCS
report 22.
2.7 Interrupt handling
Scope
To determine if the treatment machine correctly handles unexpected interrupts.
Background
There are various reasons why a treatment unit can interrupt dose delivery, either intended
(e.g. by pressing the interrupt button) or unintended (e.g. caused by a fault of the delivery
system). After resuming delivery, the final dose distribution should be unaffected.
Suggested test
To investigate the influence of interrupts on the dose distribution of a VMAT treatment,
regular plan QA devices and procedures of the department can be used. Results of
uninterrupted and (multiply) interrupted deliveries must be compared.
2 4 6 1 3 5 7
1
2
3
4
5
6
7

32
Tolerances
Interrupting the delivery should not prevent the machine completing the treatment at a later
time. When comparing interrupted and uninterrupted plan deliveries, dose deviations should
be within 1% preferably within 0.5%.
2.8 Proposed test frequencies
The following Table contains proposed test frequencies. Depending on the user’s experience
with the machine deviations can be allowed for. The reasons for the deviations should be
well documented. After acceptance of VMAT capability of the linac, the user could use a
fixed set of clinical VMAT plans to check the consistency of the VMAT delivery. In case of an
issue, the tests described in this chapter can assist in finding the origin of the problem.
Table 4. Overview of the different tests and the frequencies to perform them.
Section Test Frequency Note
2.2.1 Gantry angle accuracy with static gantry
Acceptance, every six months
Consider it after corrective maintenance
2.2.2 Collimator accuracy with static gantry Acceptance, every six months
Consider it after corrective maintenance
2.2.3 MLC leaf position accuracy with static gantry
Monthly Cardinal angles other than 0° can be done yearly
2.2.4 Output linearity and reproducibility with static gantry and nominal dose rate
Acceptance Consider it after corrective maintenance
2.2.5 Flatness and symmetry with static gantry and nominal dose rate
Monthly
2.3.1 Gantry speed Acceptance Consider it after corrective maintenance
2.3.2 MLC leaf speed Acceptance Consider it after corrective maintenance
2.4.1 Output accuracy Weekly
2.4.2 Flatness and symmetry at lowest dose rate
Acceptance/ on indication
2.5.1.1 Flatness and symmetry at various continuous dose rates during gantry rotation
Acceptance/ on indication
2.5.1.2 Flatness and symmetry during gantry rotation
Acceptance/ on indication

33
2.5.2.1 Output beyond 1000 MU Annually
2.5.2.2 Output in the presence of dose rate changes at constant gantry speed
Acceptance/ on indication
2.5.2.3 Mutual dependence of dose rate and gantry speed
Acceptance/ on indication
2.5.2.4 Output during maximum dose rate and gantry speed variation
Quarterly
2.6 MLC leaf position accuracy in dynamic mode
Acceptance/ on indication
2.7 Interrupt handling Annually
34
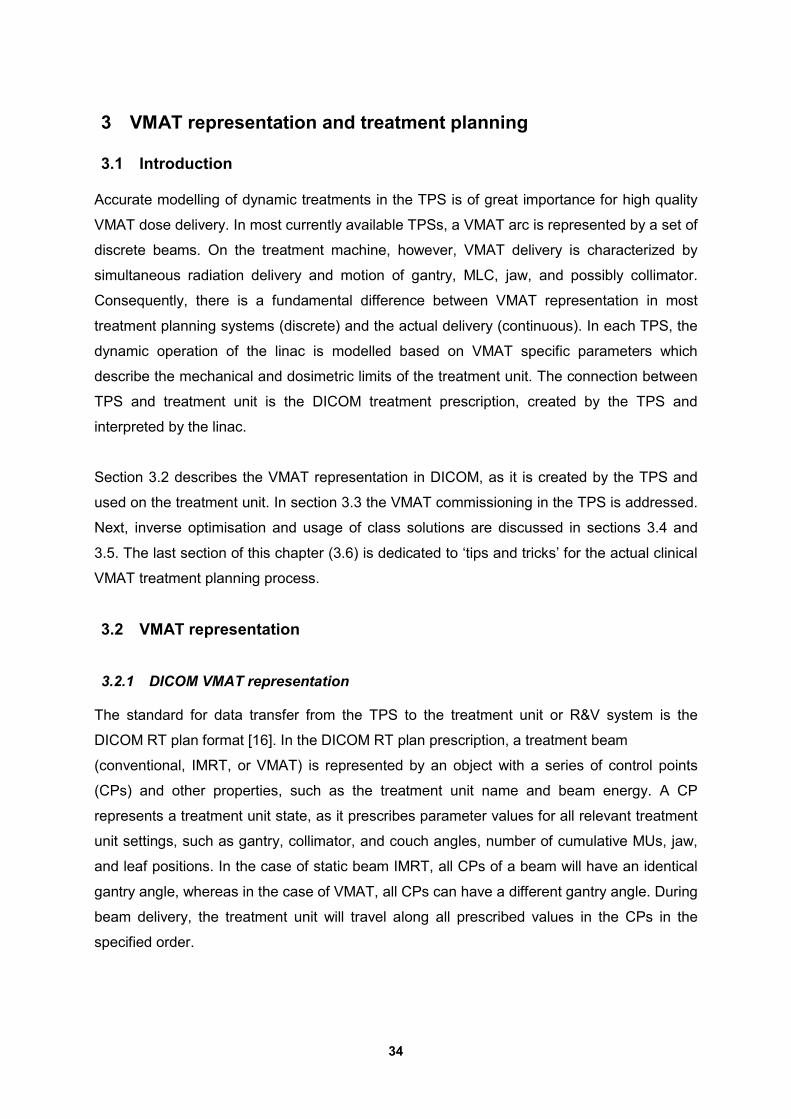
3 VMAT representation and treatment planning
3.1 Introduction
Accurate modelling of dynamic treatments in the TPS is of great importance for high quality
VMAT dose delivery. In most currently available TPSs, a VMAT arc is represented by a set of
discrete beams. On the treatment machine, however, VMAT delivery is characterized by
simultaneous radiation delivery and motion of gantry, MLC, jaw, and possibly collimator.
Consequently, there is a fundamental difference between VMAT representation in most
treatment planning systems (discrete) and the actual delivery (continuous). In each TPS, the
dynamic operation of the linac is modelled based on VMAT specific parameters which
describe the mechanical and dosimetric limits of the treatment unit. The connection between
TPS and treatment unit is the DICOM treatment prescription, created by the TPS and
interpreted by the linac.
Section 3.2 describes the VMAT representation in DICOM, as it is created by the TPS and
used on the treatment unit. In section 3.3 the VMAT commissioning in the TPS is addressed.
Next, inverse optimisation and usage of class solutions are discussed in sections 3.4 and
3.5. The last section of this chapter (3.6) is dedicated to ‘tips and tricks’ for the actual clinical
VMAT treatment planning process.
3.2 VMAT representation
3.2.1 DICOM VMAT representation
The standard for data transfer from the TPS to the treatment unit or R&V system is the
DICOM RT plan format [16]. In the DICOM RT plan prescription, a treatment beam
(conventional, IMRT, or VMAT) is represented by an object with a series of control points
(CPs) and other properties, such as the treatment unit name and beam energy. A CP
represents a treatment unit state, as it prescribes parameter values for all relevant treatment
unit settings, such as gantry, collimator, and couch angles, number of cumulative MUs, jaw,
and leaf positions. In the case of static beam IMRT, all CPs of a beam will have an identical
gantry angle, whereas in the case of VMAT, all CPs can have a different gantry angle. During
beam delivery, the treatment unit will travel along all prescribed values in the CPs in the
specified order.

35
In between CPs, no treatment unit state is prescribed in the DICOM RT plan prescription.
Special attention should be paid to the MU prescription per CP. The MU parameter describes
the cumulative MU fraction that the machine should have given upon reaching the specific
CP, whereas geometrical parameters define the actual state at that CP. Consequently, the
MU fraction value in the DICOM file equals zero at the first and one at the last CP. As a
result, a DICOM VMAT beam consisting of ‘n’ CPs will have ‘n-1’ MU increments.
3.2.2 Treatment unit VMAT interpretation
Ideally, the treatment unit reaches the prescribed combination of machine settings at each
CP. In between control points, the machine interpolates all varying parameters linearly, while
maintaining synchronicity of all varying parameters. However, it can easily be understood
that this ideal behaviour will be hard to realize. Perfect linear interpolation between CPs of all
parameters would require a high degree of synchronicity between the different parts of the
treatment unit, for example between gantry rotation and leaf motion, or between dose rate
and gantry speed. Additionally, perfect linear interpolation in between CPs would require
abrupt speed changes at the CPs. As speed changes take time, this is not possible.
In practice, VMAT treatment delivery is guided by a dedicated control loop feedback system.
The machine monitors the actual values of all parameters many times in the time interval
between CPs. One of the varying parameters is appointed as leading parameter to which all
other parameters must be synchronized. This synchronicity will not be perfect and tolerances
must be defined stating for each of the parameters to what extent it may deviate from ideal
synchronicity. A feedback loop is applied to steer each of the parameters in order to keep
deviations small. If this steering would be insufficient and deviations would become too large
or the maximum allowed deviation persist for too long, the treatment delivery is interrupted.
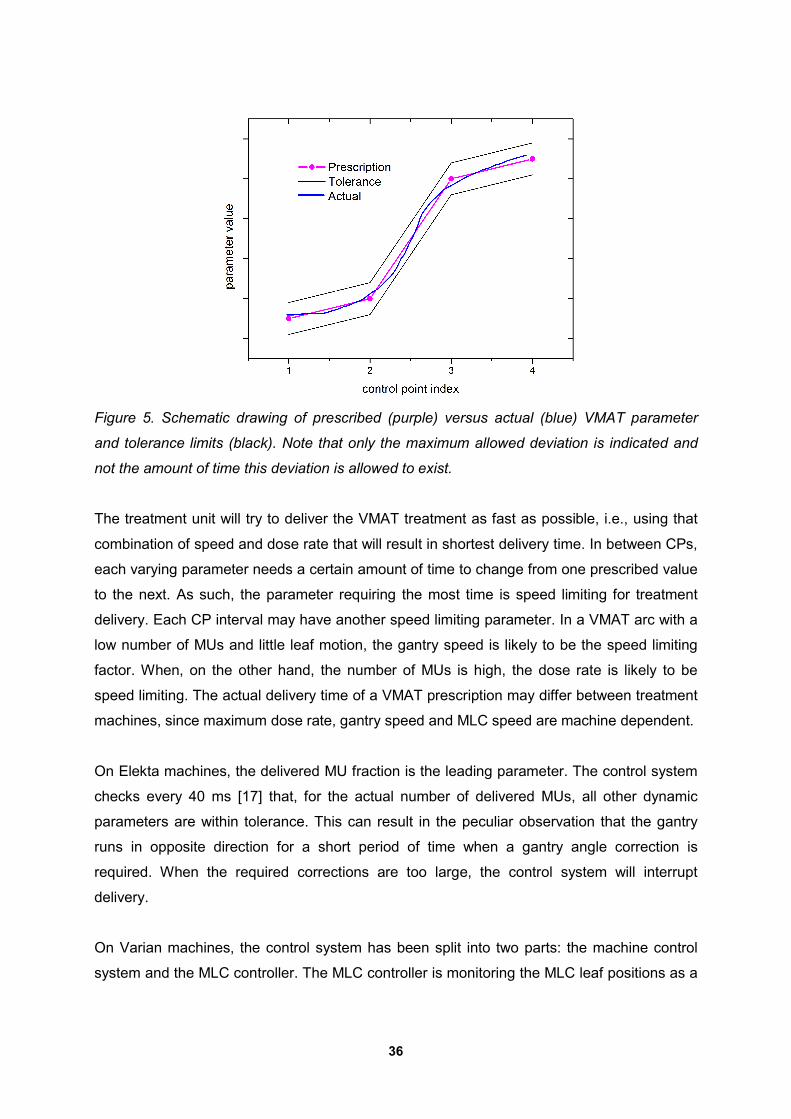
Figure 5 shows a schematic drawing for a single VMAT parameter of prescribed value
(purple), realized value (blue), and tolerance interval (black).
36
Figure 5. Schematic drawing of prescribed (purple) versus actual (blue) VMAT parameter
and tolerance limits (black). Note that only the maximum allowed deviation is indicated and
not the amount of time this deviation is allowed to exist.
The treatment unit will try to deliver the VMAT treatment as fast as possible, i.e., using that
combination of speed and dose rate that will result in shortest delivery time. In between CPs,
each varying parameter needs a certain amount of time to change from one prescribed value
to the next. As such, the parameter requiring the most time is speed limiting for treatment
delivery. Each CP interval may have another speed limiting parameter. In a VMAT arc with a
low number of MUs and little leaf motion, the gantry speed is likely to be the speed limiting
factor. When, on the other hand, the number of MUs is high, the dose rate is likely to be
speed limiting. The actual delivery time of a VMAT prescription may differ between treatment
machines, since maximum dose rate, gantry speed and MLC speed are machine dependent.
On Elekta machines, the delivered MU fraction is the leading parameter. The control system
checks every 40 ms [17] that, for the actual number of delivered MUs, all other dynamic
parameters are within tolerance. This can result in the peculiar observation that the gantry
runs in opposite direction for a short period of time when a gantry angle correction is
required. When the required corrections are too large, the control system will interrupt
delivery.
On Varian machines, the control system has been split into two parts: the machine control
system and the MLC controller. The MLC controller is monitoring the MLC leaf positions as a

37
function of gantry angle. The machine control system is monitoring the delivered MUs and
other parameters as a function of the gantry angle. The leaf positions are checked against
the prescription every 50 ms for C-series machines [18] and every 10 ms for TrueBeam
machines [19]. If the MLC is out of tolerance for a certain time, beam delivery will be
interrupted.
3.2.3 TPS VMAT modelling
With the development of fast optimisation algorithms [9,20,21], clinical use of VMAT has
become feasible. Most of these algorithms start using fluence optimisation with a coarse
sampling of the arc, using a limited number of beams at fixed gantry angles. Next the
sampling density of the arc is increased until the required angular spacing is reached.
Obviously, the smaller the CP spacing, the better the correspondence between the TPS
model and the linac behaviour [22]. A detailed description of these algorithms is beyond the
scope of this report.
During the optimisation procedure, the dynamic treatment delivery is simplified as a
collection of static beams at different gantry angles at which the MUs are delivered by a
certain MLC shape. On the treatment unit, however, treatment is delivered continuously: in
between CPs, MUs are delivered and the leaves are moving from one CP to the next.
The task of the TPS during VMAT optimisation is to generate a dose distribution that meets
the clinical criteria, while taking into account the geometrical and dosimetric limitations of the
treatment machine. Furthermore, a CP sequence has to be created that will result in a
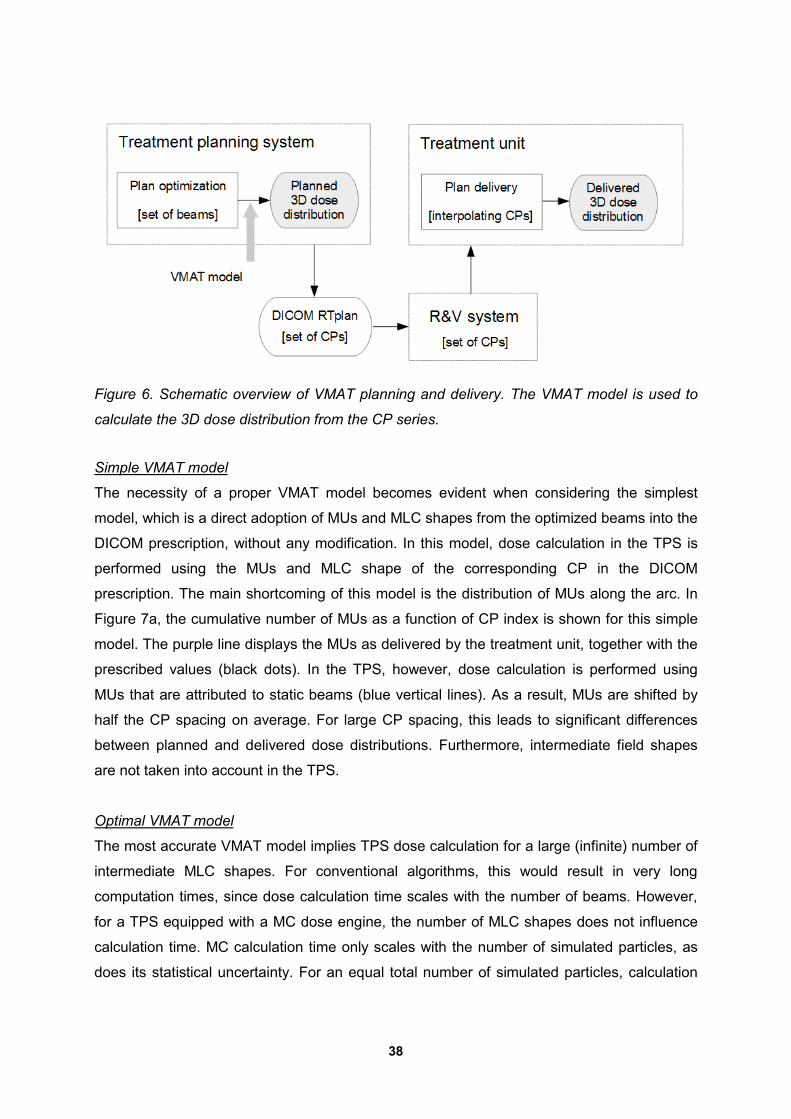
delivered dose distribution as close as possible to the calculated one, see Figure 6. To
achieve this, the TPS must have a model of the dynamic linac behaviour (in the following
referred to as ‘VMAT model’). The central tasks of the VMAT model are (i) dealing with the
intermediate field shapes, and (ii) assigning the MUs to the available CPs. In the following, 4
of these models are discussed.
38
Figure 6. Schematic overview of VMAT planning and delivery. The VMAT model is used to
calculate the 3D dose distribution from the CP series.
Simple VMAT model
The necessity of a proper VMAT model becomes evident when considering the simplest
model, which is a direct adoption of MUs and MLC shapes from the optimized beams into the
DICOM prescription, without any modification. In this model, dose calculation in the TPS is
performed using the MUs and MLC shape of the corresponding CP in the DICOM
prescription. The main shortcoming of this model is the distribution of MUs along the arc. In
Figure 7a, the cumulative number of MUs as a function of CP index is shown for this simple
model. The purple line displays the MUs as delivered by the treatment unit, together with the
prescribed values (black dots). In the TPS, however, dose calculation is performed using
MUs that are attributed to static beams (blue vertical lines). As a result, MUs are shifted by
half the CP spacing on average. For large CP spacing, this leads to significant differences
between planned and delivered dose distributions. Furthermore, intermediate field shapes
are not taken into account in the TPS.
Optimal VMAT model
The most accurate VMAT model implies TPS dose calculation for a large (infinite) number of
intermediate MLC shapes. For conventional algorithms, this would result in very long
computation times, since dose calculation time scales with the number of beams. However,
for a TPS equipped with a MC dose engine, the number of MLC shapes does not influence
calculation time. MC calculation time only scales with the number of simulated particles, as
does its statistical uncertainty. For an equal total number of simulated particles, calculation

39
time and dose uncertainty will be similar for dose calculation at the CPs only or at a large
number of intermediate beams. However, in the latter the dynamic behaviour of the treatment
unit is taken into account more accurately. This VMAT model is implemented in Monaco, up
from version 3. Figure 7b shows the exact coincidence of MUs on the linac and in the TPS. It
should be noted that also for the deterministic linear Boltzmann transport equation solver
algorithms (such as Acuros XB, implemented in Eclipse version 10 and higher) the
calculation time does not scale with the number of beam portals.
Figure 7. Graphical representation of the cumulative number of MU in the TPS and the
DICOM prescription for the four presented VMAT models (a) simple, (b) optimal, (c)
dosimetric averaging, and (d) geometric averaging.
Dosimetric averaging VMAT Model
Another VMAT model is based on redistribution of MUs for dose calculation in the TPS. In
the DICOM prescription, the MUs are attributed to CP intervals, i.e., between CP ‘n’ and
‘n+1’ a certain amount of MUs is prescribed. In this VMAT model, the MUs from a CP interval
are equally distributed between the two adjacent beams in the TPS. In this manner, there is
no systematic shift of MUs along the arc, as is the case in the simple VMAT model. Similar to

40
the simple model, the dosimetric averaging model takes into account only the MLC shape at
the CP. A schematic drawing of the distribution of MUs along the arc on the linac and in the
TPS for the dosimetric averaging model is shown in Figure 7c. This figure shows both the
number of MUs per CP in the DICOM prescription and in the TPS dose calculation for this
model. This VMAT model is implemented in Pinnacle [Philips Medical Systems, Best, the
Netherlands] up from version 9.0, and Oncentra External Beam [Elekta Oncology Systems]
up from version 3.3.
Table 5. MU definitions in DICOM and for TPS dose calculation in the dosimetric averaging
VMAT model for a VMAT arc of n+1 control points.
CP index 0 1 2 i n
TPS dose
calc MU1/ 2 (MU1+MU2)/2 (MU2+MU3)/2 (MUi+MUi+1)/2 MUn/2
DICOM MU0 = 0 MU1 MU2 MUi MUn
Geometric averaging VMAT Model
In a fourth VMAT model, dose calculation in the TPS is performed for beams at gantry angles
in between the DICOM CPs, using the average field shape of the two CPs. The number of
MUs in the beam corresponds to the number of MUs that will be delivered in the CP interval.
Figure 7d shows a schematic drawing of the MU distribution along the arc in the TPS and on
the treatment unit. Note that the assumptions in this model are different from the
assumptions in the dosimetric averaging model. Beware that using the combination of the
dosimetric averaging model in the TPS and the geometric averaging model for dose
verification, may yield exaggerated differences caused by the different implementations. The
geometric averaging model is implemented in the RayStation TPS [RaySearch Laboratories,
Stockholm, Sweden], as well as the Compass dose verification system [IBA dosimetry,
Schwarzenbruck, Germany].
To improve the modelling of the treatment unit behaviour in the TPS, Pinnacle allows from
version 9.2 for the generation of a set of extra CPs in between the original CPs when the
plan optimisation is finished. The final dose calculation is performed using a CP sampling of
the arc that is doubled compared to the optimisation stage. The plan with finer CP sampling
can also be exported as DICOM RT plan prescription. In Eclipse [Varian Medical Systems,
Palo Alto, CA, USA] the CP sampling for the final dose calculation is 2 degrees by default.

41
3.3 Treatment Planning System commissioning
In addition to NCS report 15 on the general commissioning of a TPS [23], NCS report 22 [2]
addresses the commissioning of a TPS for IMRT. It provides an overview of tests for the
evaluation of TPS modelling accuracy for IMRT specific topics, such as accuracy of the leaf
modelling, modelling of small beams and abutting fields. Since in essence, VMAT is IMRT
with extra degrees of freedom, all these topics are equally relevant for VMAT too. Before
implementing VMAT, the user is therefore referred to the relevant sections in NCS 22 [2],
especially for users who have not yet commissioned their TPS for IMRT treatment planning.
Some topics however are also shortly addressed in this report, because they are highly
important to VMAT or because VMAT poses additional requirements.
3.3.1 Plan restrictions and hardware limitations
As for IMRT, also for VMAT additional machine parameters will be required in the TPS.
Parameters are needed to describe the availability of options like dynamic jaw tracking, leaf
interdigitation and either binned or continuously variable dose rate during VMAT irradiation.
Furthermore, hardware limits like the range of gantry speeds and dose rates need to be
specified in the TPS. Clearly, the nature of these parameters necessitates to specify them
either per beam (e.g. max dose rate) or per treatment unit (e.g. max gantry speed). The
required set of additional parameters in the beam model and hardware specification varies
between different planning systems.
TPS and/or linac vendors often propose values for certain machine parameters to be entered
for a specific linac type. However, it is the user’s responsibility to verify that the values
entered in the TPS indeed result in realistic VMAT plans for the treatment unit at hand. The
dosimetric data in the beam model should relate to the geometries in the resulting VMAT
plans (e.g. small field sizes and elongated field shapes) to assure that dose calculation in the
TPS for the typical geometries in the VMAT plans is adequate. Furthermore, the user should
take note that it might be necessary to adapt TPS commissioning parameters away from the
vendor proposed values or values obtained by measurements, in order to improve dosimetric
accuracy and plan quality.
As mentioned in a previous section, during VMAT treatment delivery the treatment unit may
need to adapt time-related parameters such as dose rate, leaf speed or gantry speed, in
order to synchronize dose delivery at the control points. Therefore it is important that the
42
limitations of parameters of a treatment unit are realistically defined in the TPS, and that the
TPS indeed generates treatment plans that respect these technical limitations.
The user is advised to verify whether the TPS indeed abides by the technical limitations and
parameters that are set for a specific treatment unit, such as maximum dose rate, maximum
MLC speed, minimum MLC segment size etc.
As a test, treatment plans can be generated that require either a large number of MUs (in
order to force a high dose rate) or need large MLC movements in between control points.
The tests described in sections 2.3 - 2.6 might also be helpful for this testing.
3.3.2 Leaf modelling
During a VMAT treatment, the dose is delivered with varying aperture resulting from moving
leaves. Appropriate leaf modelling is of great importance since only leaves block the
radiation field for a considerable part of the irradiation. This effect may be slightly limited if
collimator jaws are allowed to adapt to the MLC field shape and follow the most retracted leaf
(so called jaw tracking). Additionally, since small MLC apertures are frequently present in
VMAT, adequate leaf tip and tongue and groove modelling is required [24].
Ideally, physical aspects like leaf transmission and penumbra can be accurately measured.
Entering the actual physical values in the TPS may nevertheless not always guarantee
adequate correspondence between TPS and measurement, due to limited modelling in the
TPS of the dynamic aspects of the treatment, as described in the previous section.
Adaptation of the measured physical properties of the leaves might be a tool to improve
correspondence.
3.3.3 Matched beams
Many institutes nowadays have multiple linacs which have ‘matched’ treatment beams,
implying that the dosimetric properties for a group of linacs can be described by only one
beam model in the TPS. If all relevant hardware, such as the MLC, is identical on the
treatment units, treatment plans can be exchanged freely between treatment units. However,
in order to use one beam model for VMAT on different treatment units, the user must verify
that the technical specifications in the beam model can be met by all treatment units. As a
consequence, if only one of the treatment units is equipped with additional features such as
jaw tracking or collimator rotation during VMAT, this should result in a separate beam model
in the TPS.
43
3.4 VMAT Inverse optimisation
3.4.1 Dose calculation
The additional degrees of freedom in VMAT with respect to IMRT can lead to long
computation times and increased risk for getting trapped in a local minimum. In recent years
however, several groups [9,20] have developed efficient algorithms for inverse optimisation
of VMAT plans. As a result, the time required for VMAT planning has become clinically
acceptable. Most of the currently available VMAT algorithms are based on a similar concept:
at the start of the optimisation, the sampling of the arc is coarse, and the number of CPs and
corresponding beams is increased step by step, until the requested spacing is reached. Dose
calculation is performed using a combination of a fast dose calculation algorithm with limited
accuracy, and a slower but more accurate dose calculation algorithm. The exact
implementation of arc sampling and multiple dose calculation algorithms varies between
vendors and software versions.
The possibility to re-run an optimisation based on results from previous runs provides a tool
to improve the VMAT plan, because of the use of a new starting point and the advantage of
taking into account the results of the accurate dose calculation. The user is advised to take
notice of the inverse optimisation design of the TPS software at hand.
3.4.2 Multiple arc optimisation
Creating a treatment plan with two or more arcs enables the TPS to generate a higher
degree of dose modulation in the treatment plan, at the cost of increased calculation and
treatment time [25]. Some TPSs allow for the optimisation of two arcs simultaneously, by
associating each calculation segment with two control points and two aperture shapes (e.g.
Eclipse versions 8.9 and up). The level at which this multiple arc optimisation can be adapted
by the user, is vendor-specific.
In the so-called dual arc approach, the fluence optimisation is the same as for a single arc.
However in the conversion, more control points are generated than is done for a single arc,
keeping more information from the fluence map. The control points are then divided between
two arcs, according to an algorithm that takes into account field shapes and leaf travel. In
general, one arc is generated with the leaves at the left and the other with them at the right
side of the MLC [20]. Usually this leads to less leaf motion per arc, but as a consequence it
may result in a split in the coverage of the target between the two arcs: one part of the target
is treated during the first arc, the other part of the target during the second arc. This will

44
normally not be a problem, but care should be taken to use dual arc optimisation in the case
of moving targets, for example lung tumours.
3.4.3 Limited arcs, avoidance sectors
The rotational nature of VMAT treatment plans results in areas of low dose, often including
healthy tissue and organs at risk. Avoiding certain beam directions in the VMAT plan can
prevent exposure of critical structures. The two main implementations to achieve this
avoidance are a ‘partial arc’ and the use of ‘avoidance sectors’. The so-called partial arc
technique is implemented in most TPSs, and allows the user to set the arc length to be less
than a full rotation. Apart from avoiding dose from a certain section of the arc, this also saves
computation and delivery time. Limiting the arc’s length to less than 180 degrees however,
will degrade plan quality for most treatment sites. Moreover, when using partial arcs of a
limited range, care must be taken that the control point spacing is adequate, especially in a
TPS with a discrete angle control point spacing.
In TPSs that allow for avoidance sectors, VMAT plans can be generated in which the dose
rate in predefined sectors of the arc can be set to zero or close to zero. The allowed number
and size of these so called avoidance sectors per arc is restricted, depending on the
treatment unit and TPS at hand. The choice for a partial arc technique or a technique with
avoidance sector depends on the TPS, the treatment goal and the apparatus at hand.
3.4.4 Plan complexity
It is often advantageous to limit the complexity of treatment plans: First of all, the treatment
time will increase with increasing complexity. Second, more complex plans require more
MUs, which may increase the dose outside the target area. Third, from a QA point of view, it
is desirable to have treatment segments of similar size as the field sizes used in
commissioning.
With the complexity of the treatment plans, usually the number of segments with many small
leaf openings increases and higher leaf speeds and more extreme dose rate variations are
required. Both effects may result in a decrease in correspondence between planned and
measured dose [26].
In most TPSs limiting the complexity of plans can be achieved by means of restrictions
during optimisation. This can be a restriction of the number of MUs (Eclipse), a minimum
segment area (Pinnacle), a restriction of the expected treatment time (Pinnacle and

45
Oncentra) or a target dose rate (Monaco). However, the user should bear in mind that
imposing such restrictions does not necessarily result in treatment plans actually fulfilling
these criteria.
3.5 Class solutions
For VMAT planning, the solution space is even larger than for IMRT. The benefit of working
with class solutions therefore is even more pronounced than for IMRT planning. Having class
solutions for all common tumour sites improves quality and efficiency in treatment planning
and treatment execution and may simplify QA. A class solution should consist of the
optimisation parameters and the relevant geometrical attributes: it should define both the
required structures to be used in optimisation and the allowed ranges of the associated
optimisation objectives, constraints and weights, together with a standard set of technical
requirements like beam parameters and calculation parameters.
The set of optimisation parameters for a VMAT treatment is likely to be similar to the one for
an IMRT treatment of the same site, but should take into account the rotational nature of the
treatment. This may require developing other or additional artificial structures to guide the
TPS to generate the desired distribution of the dose, and avoid a large low-dose-bath. In
general, the artificial structures and objectives used in static IMRT need to be reconsidered,
because their efficacy may be completely different for VMAT.
In obtaining the standard set of technical requirements for a class solution, one should
consider beam settings like the numbers of fields, desired start and stop angles, collimator
settings and beam energies. For calculation, the control point spacing and dose grid size
should be evaluated to obtain an optimal balance between calculation time and accuracy.
Similar to static IMRT planning, the optimal sets of plan settings and optimisation parameters
need to be established by each institute and for each tumour site separately.
Developing a class solution may for some tumour sites be a cumbersome exercise, but will in
general highly improve planning efficiency and consistency. Hence, the effort to generate a
tumour site specific class solution has to be considered with respect to the gain in efficiency
for the institute. When a class solution plan does not meet clinical plan acceptance criteria,
modification is needed. The need of improvement of an individual plan after class solution
optimisation will depend on the complexity of the treatment site. For example, complex head-
and-neck plans more likely require individual adaptation than prostate treatment plans do.
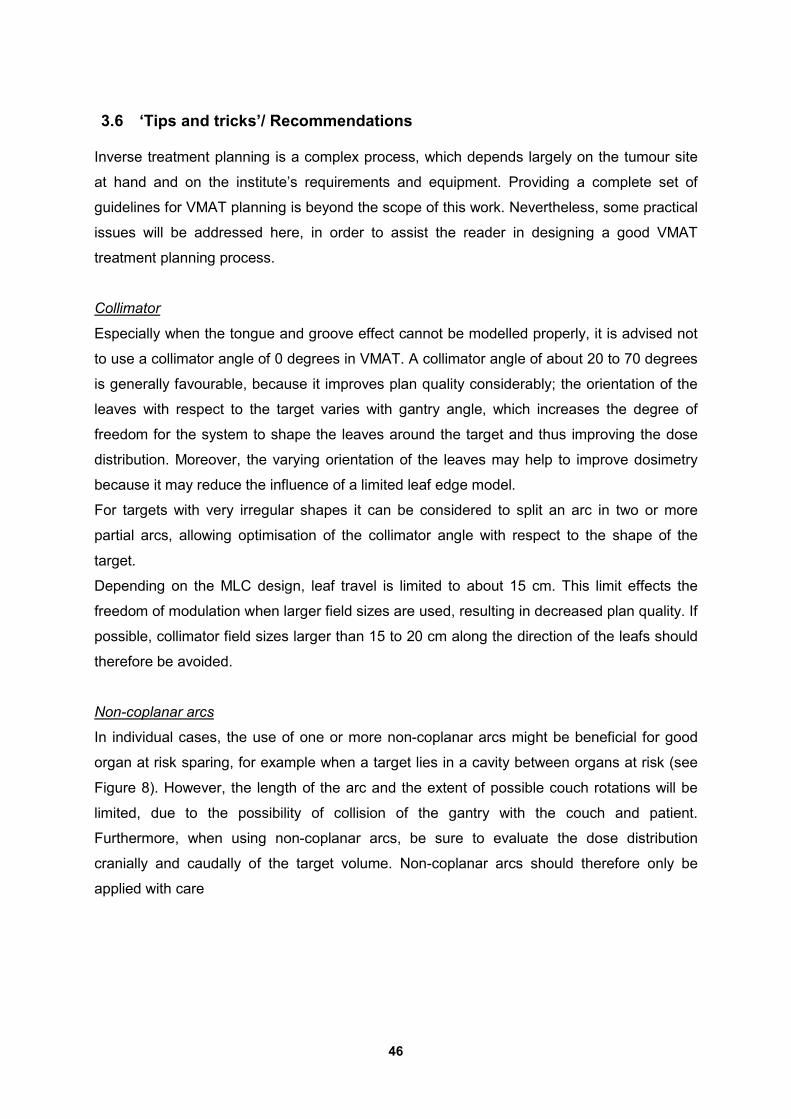
46
3.6 ‘Tips and tricks’/ Recommendations
Inverse treatment planning is a complex process, which depends largely on the tumour site
at hand and on the institute’s requirements and equipment. Providing a complete set of
guidelines for VMAT planning is beyond the scope of this work. Nevertheless, some practical
issues will be addressed here, in order to assist the reader in designing a good VMAT
treatment planning process.
Collimator
Especially when the tongue and groove effect cannot be modelled properly, it is advised not
to use a collimator angle of 0 degrees in VMAT. A collimator angle of about 20 to 70 degrees
is generally favourable, because it improves plan quality considerably; the orientation of the
leaves with respect to the target varies with gantry angle, which increases the degree of
freedom for the system to shape the leaves around the target and thus improving the dose
distribution. Moreover, the varying orientation of the leaves may help to improve dosimetry
because it may reduce the influence of a limited leaf edge model.
For targets with very irregular shapes it can be considered to split an arc in two or more
partial arcs, allowing optimisation of the collimator angle with respect to the shape of the
target.
Depending on the MLC design, leaf travel is limited to about 15 cm. This limit effects the
freedom of modulation when larger field sizes are used, resulting in decreased plan quality. If
possible, collimator field sizes larger than 15 to 20 cm along the direction of the leafs should
therefore be avoided.
Non-coplanar arcs
In individual cases, the use of one or more non-coplanar arcs might be beneficial for good
organ at risk sparing, for example when a target lies in a cavity between organs at risk (see
Figure 8). However, the length of the arc and the extent of possible couch rotations will be
limited, due to the possibility of collision of the gantry with the couch and patient.
Furthermore, when using non-coplanar arcs, be sure to evaluate the dose distribution
cranially and caudally of the target volume. Non-coplanar arcs should therefore only be
applied with care

47
Figure 8. Example of a target (in red) lying in between organs at risks. In this case an
improved sparing of the eyes (in green and blue) and optical nerves (in pink and purple)
could be achieved when using a table rotation of 90 degrees.
Isocentre location
The location of the isocentre can have a large impact on the plan quality. The amount of leaf
travel required is strongly dependent on the position of the isocentre with respect to the
target volume. The presence of large leaf travel between CPs can also decrease the
correspondence between the planned and actual dose, due to limitations in the VMAT model
(see section 3.2).
However, the choice of isocentre position is limited by the required clearance between the
patient’s elbows and other anatomy, and the rotating linac head, imager source and imager
panels. This limits the lateral position of the isocentre to about 6 to 8 cm, dependent on the
anterior-posterior position of the isocentre. Note that even when using a partial treatment
arc, the clearance on all sides should be guaranteed because of potential collisions during
gantry rotations for imaging and setup procedures.
Accounting for setup uncertainties
In a static beam setup, specific gantry angles are sometimes avoided in a treatment plan
because of expected setup uncertainties. This is for example the case for purely lateral
beams at the level of the shoulders for a head and neck treatment plan. With VMAT, this is
not that easy to achieve. However, one could consider avoiding dose from unfortunate arc
segments by using avoidance regions, or using large constraints on dose through (artificial)
structures. An example is shown in Figure 9.

48
Figure 9. Example of an artificial structure to avoid large dose contributions through the
shoulder.
Couch geometry
With a rotational treatment modality, it becomes more important to take the couch geometry
into account in the treatment planning [27,28]. Due to the fact that a significant part of the
beam may pass (obliquely) through the treatment couch, attenuation of the primary beam
can no longer be manually accounted for. It is therefore advised to include a couch model in
the dose calculation for VMAT.
Preconditions VMAT TPS hardware
Modern VMAT optimisation algorithms are using smart methods to make use of computer
resources efficiently during optimisation and dose calculation. Nevertheless, due to the large
number of beams (control points) in a VMAT plan, hardware requirements increase for VMAT
treatment planning with respect to IMRT. Furthermore, TPS data storage will need extension,
especially if the dose per control point will be saved.
Changes in dose prescription
In the optimisation, machine limits are taken into account. Once an optimal treatment plan is
achieved, no essential plan parameters should be changed. Especially a change in
prescription dose would require a new optimisation.

49
4 Patient specific QA for VMAT
4.1 Introduction
Previous chapters of this report focus on QA regarding treatment unit and planning system.
These procedures ensure that the overall performance of the linac and the planning system
are within tolerance. However, actual patient treatment plans may include (combinations of)
treatment parameters that lie outside the scope of these procedures, or may e.g. include
human errors in the treatment preparation phase. This chapter will focus on patient specific
QA involving VMAT treatments. The reader is assumed to be familiar with QA for
conventional IMRT treatments, as described in NCS report 22 [2], and to have already some
experience in IMRT QA.
The aim of performing patient-specific QA is to check that the intended treatment for
individual patients will be correctly delivered. Therefore, it should be verified that:
1. The plan intended for treatment by the radiation oncologist is correctly transferred
from the planning system to the linac.
2. The delivered dose on the linac is similar to the dose calculated by the TPS.
There is a fundamental difference between VMAT treatment planning (discrete) and VMAT
delivery (continuous). In addition, the treatment machine may re-interpret and adapt the
values of some TPS delivery parameters, such as gantry speed, if these cannot be met.
Therefore, it is advised to verify whether the dose delivery for a specific plan or class solution
is in accordance with the planned dose. To confirm whether the approximation used by the
TPS in mimicking the dynamic behaviour of the treatment unit is accurate, measurements of
the delivered dose to one point and of dose distributions need to be done.
For verification of the TPS dose calculations, plan transfer, and the ability of the treatment
machine to accurately deliver the intended dose, several methods are available. The best
method for an optimal QA program depends largely on the local workflow and available QA
devices.
As patient-specific QA of VMAT plans can be time consuming, the applied methods should
not only be safe and accurate but also time efficient. By using specific class solutions for
each tumour site as described in section 3.5, the workload can be reduced significantly.
Additionally, it promotes similarity in characteristics of treatment plans. This is specifically
important for VMAT, as studies have shown that planning parameters may have significant
impact on plan quality as well as QA results [26,29]. By controlling the range of these

50
parameters using class solutions, the amount of QA to be done for each individual patient
plan can be reduced.
Recommendations for patient-specific QA for VMAT will be given at the end of the chapter.
Furthermore the type of evaluation and the acceptance criteria, as well as the frequency and
type of QA measurements will be addressed.
Ultimately, the QA procedure should be designed in such a way that it includes verification at
the treatment unit of the prescribed dose for the target volume as well as the organs-at-risk.
This is however beyond the scope of this chapter but should be kept in mind when designing
the entire patient-specific QA chain.
4.2 Absolute and relative dose measurements
A number of different systems are available for dosimetric verification (both relative and
absolute) that can be used for VMAT measurements [30]. A thorough understanding of these
measurement systems is crucial since, for example, the detector response can be influenced
by angular dependence of the system, or by the use of non-water equivalent materials.
For absolute point dose measurements, ionisation chambers are well suited. Dose
distributions (both relative and absolute) should be measured with a high spatial resolution (2
mm or better) using film dosimetry, micro liquid ionisation chamber arrays and EPIDs. For
lower-resolution absolute measurements, detector arrays can be used.
In this paragraph the different dosimetric methods for absolute and relative dosimetry and
their application for the verification of VMAT treatments will be discussed.
4.2.1 Ionisation chambers
Quantitative dose validation at individual points can be done using ionisation chamber
measurements. Cylindrical ionisation chambers are used for point-dose measurements
because of their stability, linear response to absorbed dose, small directional dependence,
beam quality response independence, and traceability to a primary calibration standard. All
ionisation chambers exhibit some volume averaging due to their size. Therefore, care should
be taken that ionisation chambers are only used in relatively homogeneous dose regions.
Measurements at field edges may lead to larger deviations because of the absence of
charged particle equilibrium [31–33]. The reader should keep in mind that large number of
slit-like apertures in VMAT plans increase the likelihood of measuring at field edges, even if
the composite dose distribution is homogeneous.

51
For verification of the accuracy of the treatment planning system, the daily output fluctuation
of the linac should be taken into account, as this can be another source of errors in the
measurements.
Using a time-resolved read-out of the ionisation chamber, it is possible to check the dose at
each control point. This can give valuable information in case of deviations [34,35]. Time-
resolved ionisation chamber measurements are however not commonly used in current
clinical practice.
4.2.2 Thermoluminescent dosimetry
TLDs can be used for in vivo measurement of absolute dose [36]. They come in very small
dimensions, ensuring good approximation of point measurements. TLDs exhibit no angular
dependence of the dose response, and have a linear dose response for typical fraction
doses used in radiotherapy. The response of TLDs can however be energy- and dose rate
dependent. To guarantee sufficient accuracy, routine QA of the TLD reader has to be
conducted with a calibration procedure in the same energy range as the measurement. This
makes the use of TLDs labour intensive.
4.2.3 Film dosimetry
Film dosimetry is traditionally used for verification of integral dose distributions in a phantom
because of its high spatial resolution. If a good calibration procedure is available, film can be
used for absolute dosimetry. The most commonly used film type is radiochromic film which
has a number of advantages over radiographic film. The most important one being that no
film processing facilities are needed, and the energy dependence of these films which is
much smaller compared to radiographic films. There are also several issues concerned with
radiochromic film such as lateral scan artefacts, and inter- and intra-batch variation of the film
sensitivity that may deteriorate the measurement accuracy and require special attention
[37,38].
For radiochromic film, an optimal dose range exists in which the optical density response
information can be converted into its dose equivalence. To get an accurate measurement of
the dose distribution, the treatment dose is commonly scaled to the most sensitive dose
range of the film. Dose scaling is not preferable using a VMAT plan because the dynamic
behaviour of the treatment unit will change when the dose is changed. Therefore, films with
suitable dose response ranges have to be used. For Gafchromic EBT-type films, different

52
scanner colour channels can be used for different dose ranges [39]. Using optimized
multichannel dosimetry, taking into account the values of all 3 colours simultaneously to
determine the dose, helps to improve the performance of this type of film dosimetry [40,41]. If
a certain processing protocol has been selected, the user is strongly advised to stick to that
protocol. Changing from one protocol to another should be done with great care.
Disadvantages of film dosimetry are threefold. Firstly, the gantry angle dependence of the
response (although for Gafchromic EBT film this can be neglected). Secondly, the extensive
calibration procedures that are needed for absolute dosimetry. And finally, the fact that the
analysis cannot be done instantaneously. Film dosimetry can be a time consuming
procedure and requires a substantial amount of experience to control it.
4.2.4 Detector Arrays
Nowadays, a number of different types of detector arrays are available: 2D-arrays, consisting
of diodes or ionisation chambers; uni- or bi-planar arrays; and cylindrical arrays. The
usefulness of detector arrays is often limited by their low spatial resolution. Known
exceptions are arrays utilizing micro liquid-ionisation chambers which may have a resolution
of 2.5mm. When performing gamma index analysis, depending on the algorithm used to
calculate the gamma values, low spatial resolution may lead to under-sampling.
Gantry angle dependence is observed for static planar 2-D arrays whereas this is not
significant for bi-planar arrays [30]. To obtain an accurate measurement using static planar
arrays, the use of correction factors is advised [30,42]. Another solution is to rotate the
detector plane in conjunction with the gantry, so that it is always perpendicular to the beam
axis. This can for example be done by rotating the phantom synchronously with the gantry
(using an inclinometer) or by using a dedicated holder with which the dosimetry system is
mounted directly on the gantry. In this case, care must be taken that the mounting rig is rigid
enough to prevent sagging [43]. Moreover, one should keep in mind that errors in the
measured dose distribution resulting from gantry sagging of the linac itself will not be
detected. When only the integral dose is measured with these devices, gantry angle errors
during delivery will furthermore not be detected. The measured dose of these devices should
thus be related to the gantry angle in order to check the delivery of a VMAT beam.
A number of detector array systems offer the possibility of a 3D dose reconstruction in the
phantom, based on the 2D measurements. When a 3D dose distribution is used, errors in the
2D dose measurements - due to small errors in the measurement depth - can be more easily

53
detected. Different methods are available to calculate a 3D dose reconstruction from 2D
data. It is important that the reconstruction method and its limitations are well understood to
interpret the results correctly. Some methods use input from the TPS in certain steps of the
dose reconstruction to compute the dose. As a result, some errors in the TPS will therefore
not be detected using this verification procedure [44].
4.2.5 EPID dosimetry
EPID dosimetry can be used to replace film dosimetry for high-resolution measurements of
the dose distribution. As the readout of these systems is instantaneous, it is possible to
perform time-resolved measurements with this technique. The results can be analysed
instantaneously and no measuring devices have to be set up. As a result, EPID
measurements are less time consuming than film measurements and can therefore serve as
an easy means for regular pre-treatment and in vivo verification. A proper calibration
procedure of the EPID is however needed [45–47]. Reconstruction of the measured dose of
the EPID (e.g. the detector response or a 3D reconstruction of the dose to a dose plane at
the isocentre) relies on mathematical models. The assumptions and limitations of these
models should be well understood by the user.
A prerequisite for the EPID measurements is the stability of the panel alignment as this has
impact on the reconstruction of the dose distribution with respect to the machine isocentre.
These effects could be even more pronounced for VMAT due to the continuous gantry
rotation and fast de- and acceleration of the gantry [48,49]. Deviations should be taken into
account in the reconstruction software. It should be noted that the lifetime of the EPID can be
reduced by its frequent usage [50], and that the availability of commercial portal dosimetry
systems is limited at the time of writing of this report (2015). Furthermore, errors in the
integral dose distribution, due to gantry sagging will not show up in these measurements.
4.3 Gamma evaluation
For the evaluation of the delivered dose distribution compared to the calculated dose from
the TPS, a gamma analysis [51] is commonly performed. This method has its limitations, as
the pass rate itself does not contain any spatial information and is poorly correlated to actual
clinical parameters [52,53]. The gamma evaluation should thus be used with care, and in
combination with other evaluations like visual inspection of the gamma map and of the
measured and calculated dose profiles.
54
If any of the critical structures has a dose close to its tolerance value, extra attention should
be paid to check that deviations in the measured dose distribution do not result in violation of
these limits.
Some vendors provide software tools to recalculate the dose on the patient anatomy using
the dose as measured in a phantom, and subsequently estimate the DVHs of the actual dose
delivery. These tools might be helpful for the clinical interpretation of the QA results (see e.g.
A.J. Olch [54]), but a thorough validation of these tools is necessary.
The achievable pass rates and gamma criteria not only depend on the measurement system
used but also on the amount of intensity modulation in the treatment plan [29,30,55]. For the
dose calculation in the TPS the actual VMAT delivery has to be approximated by a finite
number of static beams. As a result, the number of segments usually is much larger
compared to conventional IMRT, and the number of parameters in these plans is thus much
larger. In spite of this, a gamma criterion and pass rates in the same order of magnitude as in
IMRT are achievable [17]. However, an excessive amount of modulation might result in a
deterioration of the QA results (and also a high number of MUs), and should therefore be
avoided if possible [29].
4.4 Plan transfer validation
Validation of plan transfers from the TPS to the R&V system should be performed to check
whether:
1. The plan can be exported from the TPS without errors
2. All treatment parameters are exported correctly to the linac
3. All treatment parameters sent by the TPS are within operating limits of the linac as
defined in the R&V system
The amount and type of testing required depends on the TPS and R&V used. For example,
Varian uses one single database for storage of the plan parameters of the TPS and R&V
system. Hence, no transfer errors between these two can occur. In short, knowledge of the
transfer process is required for a proper design of relevant tests. As checks of the
connectivity between TPS and linac should have already been performed for the
implementation of conformal and conventional IMRT treatment (see also NCS report 22 [2]),
tests can focus on the specific parameters needed for VMAT delivery. The R&V system
should be able to
- recognize that the plan should be treated as a VMAT beam

55
- deal with a changing gantry angle for each control point
- receive the direction of the gantry rotation.
Furthermore, the dose rate may (but not necessarily has to) be defined per control point,
which can influence the treatment delivery, depending on the linac manufacturer.
Once general plan transfer testing has been done for conventional IMRT delivery, according
to NCS 22, only a limited number of VMAT plans (e.g. 5 different patient plans for per class
solution) have to be checked for transfer errors. These tests should be performed in the
clinical environment, using the clinical workflow. An important source of errors that cannot be
detected with the previous test using a limited number of plans, is the possibility to transfer
an incorrect plan (i.e. a plan that is not intended for treatment) and the possibility to manually
alter a treatment plan in the R&V system. Procedures have to be implemented to prevent
these types of errors, or to verify consistency between the intended treatment plan and the
plan at the R&V system.
4.5 Plausibility checks
Plausibility checks verify if the treatment planning parameters have appropriate values for a
specific patient plan, given the dose and technique used. This can be done e.g. by
calculating the dose based on the beam settings of the plan, or by ascertaining these
parameters are within a certain range. The purpose of these checks is to detect large errors
in the range of 10% dose deviation or more. Furthermore, some of these checks might help
in identifying which plans are not in accordance with the standard class solution and thus
need more extensive QA. For VMAT delivery, the same tests can be used that are available
for conventional IMRT delivery (see NCS report 22, section 4.5.3.2). The following points
should be considered for VMAT:
The number of variables in a VMAT treatment plan is larger compared to
conventional IMRT. Hence, any manual checking or visual comparison of plans is
even less feasible.
Independent monitor unit calculations often rely on SSDs transmitted by the treatment
planning system. Not all TPS’s are capable of transmitting an SSD for each individual
control point in the arc (e.g. only the SSD at the start angle is sent) which could result
in large deviations in the dose calculation.
As already discussed in section 0, the continuous arc delivery is approximated for
dose calculation by a number of static beams, whereby the MUs are assigned to
static segments. This also holds for the independent MU calculations and could
cause deviations from the dose calculated in the TPS.

56
VMAT plans can contain a large number of segments with only a small dose
contribution to the isocentre or to any other chosen dose point. This can result in
large deviations in the dose calculations when the calculation assumes that all
segments contribute to the calculation point or, when this is accounted for correctly,
only a small fraction of the segments is checked.
Commercial MU calculation software for conventional IMRT sometimes cannot
handle VMAT plans, or a separate module is needed to do the dose calculation for
this treatment modality.
As these plausibility checks should ultimately test if the calculated dose in a reference point
(usually the isocentre) conforms to the dose as prescribed by the radiation oncologist, the
prescription dose should preferably be used as reference value for these checks, instead of
the dose calculated by the TPS in this point. In this way, no additional QA procedure is
needed to ensure that the correct dose was prescribed in the plan. By using plan data from
the R&V system, the plausibility checks also provide verification for plan transfer. Finally, for
checking the linac performance itself, other methods are necessary (see chapter 2).
4.6 Recommendations for patient specific QA
In this paragraph, recommendations concerning the type and frequency of dosimetric
evaluations, as well as evaluation criteria for patient-specific QA of VMAT are presented. The
extent and type of evaluation needed will depend on whether class solutions are
implemented, and on the degree of experience in both conventional IMRT delivery and
VMAT.
4.6.1 Absolute and relative dosimetry
Dosimetric verification can be done using different approaches. Several studies have shown
that the results of different dosimetric systems are coherent [30]. A thorough understanding
of the detector response (see section 4.2) is important to interpret the results and determine
the evaluation criteria. When tools for 3D dose reconstruction are available, a 3D instead of
2D verification method is recommended.
4.6.2 Gamma evaluation
A gamma evaluation of the dose distribution with a 3%/3mm criterion is recommended with a
minimum pass rate of 90% (identical to NCS report 22). Note that this is more stringent than

57
the 5%/5mm criterion with a pass rate of 85% recommended by ICRU rept. 83, but clinical
experience has shown that this should be achievable. Further investigation of the plan and
QA measurements by an expert is needed when the mean gamma value is greater than 0.5.
Low-dose regions should be discarded to avoid false positives due to low signal-to-noise
ratios. The cut-off value of these low-dose regions depends on the treatment site, equipment
used an whether a 2D or 3D gamma evaluation is performed. A gamma analysis based on
absolute dosimetry is recommended. In case this is not possible, the normalisation constants
should be monitored and should not deviate substantially from their expected values.
The actual gamma criterion and pass rate used in clinical practice can even be more
stringent than the above mentioned values and should be determined locally based on
experience with the equipment, the treatment site and TPS used. The criterion may be
different for various class solutions depending on required accuracy and the amount of
intensity modulation in the plan.
4.6.3 Class solutions
During the development of a new class solution a dummy run procedure is required to test
the plan transfer and the dosimetric accuracy of the delivery. Once class solutions for VMAT
treatments have been successfully implemented and are in routine clinical use, periodic
checks (4 plans every three months) should be performed. This is best done by measuring
the dose distribution from randomly selected patients, making sure that each class solution is
regularly checked. When multiple treatment units are used, one should ensure that these
measurements are regularly performed on all treatment units and not only on a single
machine. The purpose of these checks is to ensure that the class solution still delivers the
same plan quality as during its initial introduction. A time trend analysis can furthermore help
in assessing the achievable accuracy in one’s own institution, detecting (small) systematic
errors in the treatment process, and improve the overall quality of the entire radiotherapy
chain [56].
4.6.4 Frequency and type of patient-specific QA
The frequency and type of QA required for conventional IMRT has been extensively
discussed in NCS report 22. When class solutions have been implemented, the same
guidelines as for conventional IMRT QA also hold for VMAT treatment, a more stringent QA
regime is not necessary. A summary of the recommendations from NCS 22 can be found in

58
Table 6, the reader is referred to NCS 22 for an explanation of the classes for dosimetric and
spatial accuracy.
When starting with VMAT treatments, prior experience with conventional IMRT is highly
recommended. The results from IMRT treatments can be more easily interpreted than
measurements from a VMAT plan. As a result, more insight can be gained in the dosimetric
limitations of the TPS for small, irregular fields and highly modulated beams. Participating in
a dosimetry audit might furthermore be useful (also for experienced centres) to determine the
quality of the treatments compared to other centres. By comparing the results of different
centres (with different workflows and/or equipment), more insight can be gained in improving
the quality.
QA results are more dependent on the planning parameters (e.g. inverse planning
objectives, max. treatment time) when dealing with VMAT [29]. When the amount of
experience in VMAT is limited, a more extensive dummy run procedure is recommended
during the development of a class solution to get more insight in this behaviour. After
acceptance of a class solution, thorough checks need to be performed to see whether the
treatment plans conform to the class solution, even when an institution has extensive
experience with VMAT. This can be done by examining the planning objectives and other
planning parameters, or by looking into the amount of modulation in the treatment plans
through visual inspection by an expert RTT or physicist. More advanced methods to analyse
the modulation level of a plan have been developed for conventional IMRT (see e.g. [57,58]),
and a complementary paper concerning VMAT has recently been published [26]. However,
this methodology does not take the dynamic parameters into account and only shows limited
Table 6 Number of pre-treatment verifications and minimally required class of dosimetric
accuracy and resolution of a QA device for different experience levels. Definition of the
classes can be found in NCS 22)
Experience level # of patients
Pre-treatment
Dosimetric
accuracy
Spatial
resolution
No experience with VMAT, development of new
class solution
30 Class I Class I
Experience with VMAT, development of new class
solution similar to existing solutions
5 Class I Class II
Experience with VMAT, development of new class
solution dissimilar to existing solutions
10 Class I Class II
Experience with VMAT (> 100 pts total), existing
class solution
All patients Class IV -
Re-evaluation of class solution 1 Class I Class II

59
correlation with dosimetric accuracy. At the time of writing, no other methodologies with
extensions to VMAT have been published. Similar approaches might be useful to quantify the
complexity of a treatment plan, but in the case of VMAT delivery, dynamic parameters like
the leaf travel speed and dose rate variation should be included.
Once a certain level of experience is gained in VMAT delivery and a sufficient number of pre-
treatment verifications have been performed, a MU calculation may suffice as pre-treatment
verification. Although the usefulness of performing pre-treatment MU calculations as a
means of detecting errors is currently under debate.
At the time of writing there is insufficient support from the community for replacing this by a
type-V plausibility check only, where only a MU range check or similar is performed. When
the MU calculation is however based on a fairly simple algorithm, it can be used to detect
plans that do not conform to the class solution (e.g. by having more small, off-axis segments
resulting in larger errors in the MU calculation). The use of the simple MU calculation
algorithms might thus have added value compared to the more advanced ones. Furthermore,
when the MU calculation is based on the beam parameters from the R&V system, it can be
used as a plan transfer check for each patient.

60
Acknowledgements
The authors would like to thank the external reviewers James Bedford, Siete Koch and Geert
Pittomvils for their valuable and extensive comments.

61
References
[1] The Netherlands Comission for Radiation Dosimetry. Quality Control of Medical Linear Accelerators. Delft, The Netherlands: 1996.
[2] The Netherlands Comission for Radiation Dosimetry. Code of Practice for the Quality Assurance and Control for Intensity Modulated Radiotherapy. Delft, The Netherlands: 2013.
[3] Webb S. Intensity-Modulated Radiation Therapy. London: IoP; 2001.
[4] Van Elmpt W, De Ruysscher D, van der Salm A, Lakeman A, van der Stoep J, Emans D, et al. The PET-boost randomised phase II dose-escalation trial in non-small cell lung cancer. Radiother Oncol 2012;104:67–71.
[5] Lips IM, van der Heide UA, Haustermans K, van Lin EN, Pos F, Franken SP, et al. Single blind randomized Phase III trial to investigate the benefit of a focal lesion ablative microboost in prostate cancer (FLAME-trial): study protocol for a randomized controlled trial. Trials 2011;12:255.
[6] Heukelom J, Hamming O, Bartelink H, Hoebers F, Giralt J, Herlestam T, et al. Adaptive and innovative Radiation Treatment FOR improving Cancer treatment outcomE (ARTFORCE); a randomized controlled phase II trial for individualized treatment of head and neck cancer. BMC Cancer 2013;13:84.
[7] Teoh M, Clark CH, Wood K, Whitaker S, Nisbet a. Volumetric modulated arc therapy: a review of current literature and clinical use in practice. Br J Radiol 2011;84:967–96.
[8] Palma DA, Verbakel WFAR, Otto K, Senan S. New developments in arc radiation therapy: a review. Cancer Treat Rev 2010;36:393–9.
[9] Otto K. Volumetric modulated arc therapy: IMRT in a single gantry arc. Med Phys 2008;35:310.
[10] Woudstra E, Heijmen BJM, Storchi PRM. Automated selection of beam orientations and segmented intensity-modulated radiotherapy (IMRT) for treatment of oesophagus tumors. Radiother Oncol 2005;77:254–61.
[11] Breedveld S, Storchi PRM, Voet PWJ, Heijmen BJM. iCycle: Integrated, multicriterial beam angle, and profile optimization for generation of coplanar and noncoplanar IMRT plans. Med Phys 2012;39:951.
[12] Ling CC, Zhang P, Archambault Y, Bocanek J, Tang G, Losasso T. Commissioning and quality assurance of RapidArc radiotherapy delivery system. Int J Radiat Oncol Biol Phys 2008;72:575–81.
[13] Van Esch A, Huyskens DP, Behrens CF, Samsoe E, Sjolin M, Bjelkengren U, et al. Implementing RapidArc into clinical routine: a comprehensive program from machine QA to TPS validation and patient QA. Med Phys 2011;38:5146–66.

62
[14] Ezzell GA, Galvin JM, Low D, Rosen I, Sharpe MB, Yu CX. Guidance document on delivery , treatment planning , and clinical implementation of IMRT : Report of the IMRT subcommittee of the AAPM radiation therapy committee. Radiat Oncol 2003:2089–115.
[15] Sastre-Padro M, Lervåg C, Eilertsen K, Malinen E. The Performance of Multileaf Collimators Evaluated by the Stripe Test. Med Dosim 2009;34:202–6.
[16] DICOM RT standard. ftp://medical.nema.org/medical/dicom/final/sup11_ft.pdf 1997.
[17] Mancuso GM, Fontenot JD, Gibbons JP, Parker BC. Comparison of action levels for patient-specific quality assurance of intensity modulated radiation therapy and volumetric modulated arc therapy treatments. Med Phys 2012;39:4378–85.
[18] Chandraraj V, Stathakis S, Manickam R, Esquivel C, Supe SS, Papanikolaou N. Consistency and reproducibility of the VMAT plan delivery using three independent validation methods. J Appl Clin Med Phys 2011;12:3373.
[19] Qian J, Xing L, Liu W, Luxton G. Dose verification for respiratory-gated volumetric modulated arc therapy. Phys Med Biol 2011;56:4827–38.
[20] Bzdusek K, Friberger H, Eriksson K, Hårdemark B, Robinson D, Kaus M. Development and evaluation of an efficient approach to volumetric arc therapy planning. Med Phys 2009;36:2328.
[21] Yu CX, Tang G. Intensity-modulated arc therapy: principles, technologies and clinical implementation. Phys Med Biol 2011;56:R31–54.
[22] Webb S, McQuaid D. Some considerations concerning volume-modulated arc therapy: a stepping stone towards a general theory. Phys Med Biol 2009;54:4345–60.
[23] The Netherlands Comission for Radiation Dosimetry. Quality assurance of 3-D treatment planning systems for external photon and electron beams. Delft, The Netherlands: 2005.
[24] Feygelman V, Zhang G, Stevens C. Initial dosimetric evaluation of SmartArc - a novel VMAT treatment planning module implemented in a multi-vendor delivery chain. J Appl Clin Med Phys 2010;11:3169.
[25] Guckenberger M, Richter A, Krieger T, Wilbert J, Baier K, Flentje M. Is a single arc sufficient in volumetric-modulated arc therapy (VMAT) for complex-shaped target volumes? Radiother Oncol 2009;93:259–65.
[26] Masi L, Doro R, Favuzza V, Cipressi S, Livi L. Impact of plan parameters on the dosimetric accuracy of volumetric modulated arc therapy. Med Phys 2013;40:071718.
[27] Li H, Lee AK, Johnson JL, Zhu RX, Kudchadker RJ. Characterization of dose impact on IMRT and VMAT from couch attenuation for two Varian couches. J Appl Clin Med Physics; Vol 12, No 3 2011.

63
[28] Mihaylov IB, Bzdusek K, Kaus M. Carbon fiber couch effects on skin dose for volumetric modulated arcs. Med Phys 2011;38:2419.
[29] Yang K, Yan D, Tyagi N. Sensitivity analysis of physics and planning SmartArc parameters for single and partial arc VMAT planning. J Appl Clin Med Phys 2012;13:3760.
[30] Masi L, Casamassima F, Doro R, Francescon P. Quality assurance of volumetric modulated arc therapy: evaluation and comparison of different dosimetric systems. Med Phys 2011;38:612–21.
[31] Bouchard H, Seuntjens J. Ionization chamber-based reference dosimetry of intensity modulated radiation beams. Med Phys 2004;31:2454–65.
[32] Capote R, Sánchez-Doblado F, Leal A, Lagares JI, Arráns R, Hartmann GH. An EGSnrc Monte Carlo study of the microionization chamber for reference dosimetry of narrow irregular IMRT beamlets. Med Phys 2004;31:2416–22.
[33] Stasi M, Baiotto B, Barboni G, Scielzo G. The behavior of several microionization chambers in small intensity modulated radiotherapy fields. Med Phys 2004;31:2792–5.
[34] Woo MK, Nico A. Impact of multileaf collimator leaf positioning accuracy on intensity modulation radiation therapy quality assurance ion chamber measurements. Med Phys 2005;32:1440–5.
[35] Louwe RJW, Wendling M, Monshouwer R, Satherley TW, Day RA, Greig L. Time-resolved dosimetry using a pinpoint ionization chamber as quality assurance for IMRT and VMAT. Med Phys n.d.
[36] Mijnheer B, Beddar S, Izewska J, Reft C. In vivo dosimetry in external beam radiotherapy. Med Phys 2013;40:070903.
[37] Crijns W, Maes F, van der Heide U a, Van den Heuvel F. Calibrating page sized Gafchromic EBT3 films. Med Phys 2013;40:012102.
[38] Van Battum LJ, Hoffmans D, Piersma H, Heukelom S. Accurate dosimetry with GafChromic EBT film of a 6 MV photon beam in water: what level is achievable? Med Phys 2008;35:704–16.
[39] Devic S. Radiochromic film dosimetry: Past, present, and future. Phys Medica 2011;27:122–34.
[40] Micke A, Lewis DF, Yu X. Multichannel film dosimetry with nonuniformity correction. Med Phys 2011;38:2523.
[41] Mayer RR, Ma F, Chen Y, Miller RI, Belard A, McDonough J, et al. Enhanced dosimetry procedures and assessment for EBT2 radiochromic film. Med Phys 2012;39:2147–55.
64
[42] Dobler B, Streck N, Klein E, Loeschel R, Haertl P, Koelbl O. Hybrid plan verification for intensity-modulated radiation therapy (IMRT) using the 2D ionization chamber array I’mRT MatriXX--a feasibility study. Phys Med Biol 2010;55:N39–N55.
[43] Boggula R, Birkner M, Lohr F, Steil V, Wenz F, Wertz H. Evaluation of a 2D detector array for patient-specific VMAT QA with different setups. Phys Med Biol 2011;56:7163–77.
[44] Steciw S, Warkentin B, Rathee S, Fallone BG. Three-dimensional IMRT verification with a flat-panel EPID. Med Phys 2005;32:600–12.
[45] Wendling M, McDermott LN, Mans A, Sonke J-J, van Herk M, Mijnheer BJ. A simple backprojection algorithm for 3D in vivo EPID dosimetry of IMRT treatments. Med Phys 2009;36:3310–21.
[46] Nijsten SMJJG, van Elmpt WJC, Jacobs M, Mijnheer BJ, Dekker ALAJ, Lambin P, et al. A global calibration model for a-Si EPIDs used for transit dosimetry. Med Phys 2007;34:3872–84.
[47] Nicolini G, Fogliata A, Vanetti E, Clivio A, Cozzi L. GLAaS: an absolute dose calibration algorithm for an amorphous silicon portal imager. Applications to IMRT verifications. Med Phys 2006;33:2839–51.
[48] Nicolini G, Clivio a, Vanetti E, Krauss H, Fenoglietto P, Cozzi L, et al. Evaluation of an aSi-EPID with flattening filter free beams: applicability to the GLAaS algorithm for portal dosimetry and first experience for pretreatment QA of RapidArc. Med Phys 2013;40:111719.
[49] Mans A, Remeijer P, Olaciregui-Ruiz I, Wendling M, Sonke J-J, Mijnheer B, et al. 3D Dosimetric verification of volumetric-modulated arc therapy by portal dosimetry. Radiother Oncol 2010;94:181–7.
[50] Louwe RJW, McDermott LN, Sonke JJ, Tielenburg R, Wendling M, van Herk MB, et al. The long-term stability of amorphous silicon flat panel imaging devices for dosimetry purposes. Med Phys 2004;31:2989–95.
[51] Low DA, Harms WB, Mutic S, Purdy JA. A technique for the quantitative evaluation of dose distributions. Med Phys 1998;25:656–61.
[52] Nelms BE, Zhen H, Tomé WA. Per-beam, planar IMRT QA passing rates do not predict clinically relevant patient dose errors. Med Phys 2011;38:1037–44.
[53] Stasi M, Bresciani S, Miranti A, Maggio A, Sapino V, Gabriele P. Pretreatment patient-specific IMRT quality assurance : A correlation study. Med Phys 2012;39:7626–34.
[54] Olch AJ. Evaluation of the accuracy of 3DVH software estimates of dose to virtual ion chamber and film in composite IMRT QA. Med Phys 2012;39:81.
[55] Hussein M, Rowshanfarzad P, Ebert MA, Nisbet A, Clark CH. A comparison of the gamma index analysis in various commercial IMRT/VMAT QA systems. Radiother Oncol 2013;109:370–6.

65
[56] Pawlicki T, Whitaker M, Boyer AL. Statistical process control for radiotherapy quality assurance. Med Phys 2005;32:2777–86.
[57] McNiven AL, Sharpe MB, Purdie TG. A new metric for assessing IMRT modulation complexity and plan deliverability. Med Phys 2010;37:505–15.
[58] Nauta M, Villarreal-Barajas JE, Tambasco M. Fractal analysis for assessing the level of modulation of IMRT fields. Med Phys 2011;38:5385.