coaxial fiber-optic chemical-sensing excitation–emission matrix fluorometer
TRANSCRIPT

Coaxial fiber-optic chemical-sensing excitation–emissionmatrix fluorometer
Yoon-Chang Kim,1 James A. Jordan,2,† Diana Chávez,1 and Karl S. Booksh1,*1Department of Chemistry and Biochemistry, University of Delaware, Newark, Delaware 19716, USA
2National Geospatial-Intelligence Agency, Reston, Virginia 20191, USA*Corresponding author: [email protected]
Received June 1, 2010; revised August 11, 2010; accepted September 15, 2010;posted December 8, 2010 (Doc. ID 128978); published January 26, 2011
Great reductions in the overall size and complexity of high throughput multichannel UV–visible fluorometers wereachieved by coupling a compact optical fiber array to compact dispersive transmission optics. The coaxial config-uration centers on the insertion of a silica/silica optical fiber into the hollow region of a UV-fused silica capillarywaveguide. The outer core delivers the maximum power of the narrowwavelength region of the excitation spectrumcreated by coupling a xenon arc discharge lamp to a compact spectrometer. The molecular fluorescence resultingfrom the interaction of light emitted at the distal end of the hollow waveguide and the sample matrix is received andtransmitted to a CCD via a compact dispersive grating-prism (grism) optical assembly. A linear array of the coaxialoptical fibers permits a full excitation–emission matrix spectrum of the analyte matrix to be projected onto the faceof the CCD. The in situ identification and monitoring of polycyclic aromatic hydrocarbons was carried out for theinitial application testing for this prototype. © 2011 Optical Society of AmericaOCIS codes: 060.2370, 110.2350, 280.4788, 300.6280.
Excitation–emission matrix (EEM) fluorescence (alsoknown as total luminescence) spectra are traditionallycollected with two spectrometers arranged orthogonallyrelative to the sample. Benchtop instrumentation usuallyemploys two scanning monochrometers, one to deliver anarrow band of excitation light (λex) and the second toassist a sensitive single-channel detector in collecting anarrow band of emitted light (λem) [1]. These hλex; λemidyads are arranged into a matrix for further analysis.Field portable EEM fluorometers tend to employ imagingexcitation and emission spectrometers and a planar CCDdetector to collect all the EEM spectra at once [2]. TheCCD option trades some spectral resolution for sensitiv-ity and shorter analysis time. However, the orthogonalorientation of the spectrometers is physically cumber-some and not conducive to making small, field portableinstruments. EEM spectrometers employing optical fiberprobes offer alternative compact designs that eliminatethe physical constraints on the spectrometers and allowin situ measurements without a loss of performance.Employing an array of coaxial optical fiber probes to
simplify EEM fluorescence instrumentation is a novel de-sign and application. Numerous single- and dual-fiberconfigurations have been employed for spectroscopic ap-plications [3]. In a single-fiber probe, the fiber that deli-vers the light to the sample is also utilized for collectionof the fluorescent signal. The overlap is complete and in-dependent of the distance from the probe tip. However,the returning emitted/scattered light needs to be sepa-rated from the excitation light by an optical device suchas an optical circulator or a dichroic beam splitter, whichcan result in interference problems [4]. Dual-fiber probestypically use one fiber to deliver the excitation lights andthe other fiber to collect the signal that is generated bythe sample. The efficiency of fiber-optic fluorescenceprobes depends on the spatial overlapping between thecone in which the excitation light propagates and thefluorescence collection cone [5].Center-to-center distance increases and increases
of the turbidity of the matrix change the volume of
interrogation. Sample matrix changes influence thephoton path length, which in turn affects the signal-to-Rayleigh and Mie backscattering ratios; thus there couldbe limitations on fiber-optic probes that geometricarrangements alone will not solve. Dual-fiber probes ty-pically offer poor overlap between the excitation and col-lection cones, because they utilize separate fibers forexcitation and collection and the symmetry axes of thecorresponding cones do not coincide [5]. The design con-sidered in this Letter was based on coaxial configurationutilizing a silica/silica optical fiber inserted into the coreof a light-guiding fused silica capillary. The outer capil-lary tube conducted the excitation irradiance to the sam-pling volume, and the inner optical fiber conductedemitted fluorescence to the CCD detector. The opticalfiber is concentrically surrounded by the capillary in themanner of a 6-around-1 or 18-around-1 fiber bundle, onlywithout the collection gaps among the outer fibers.
Polycyclic aromatic hydrocarbons (PAHs) constitute awell-known priority pollutant group owing to their carci-nogenic and mutagenic effects in humans [6]. MultiplePAHs have overlapping fluorescence profiles. Thus, asingle-wavelength hλex; λemi measurement has a limitedability for analyzing complicated multicomponent PAHsamples or even for analyzing spectra of simple mixtures,which are highly overlapping. A conventional fluores-cence spectrum presents fluorescence only within onespectral region and does not provide enough data to dis-tinguish between two or more closely related molecules.This disadvantage of a conventional fluorometer can beovercome by extending the dimensionality of the fluores-cence measurements such as EEM fluorescence spectro-scopy [6]. Described in this Letter is a coaxial opticalfiber array designed for simultaneous acquisition of en-tire two-dimensional (2D) EEM spectral arrays.
An imaging spectrometer implemented with a multi-optical fiber array provides a powerful tool for simulta-neous measurement of spatial and spectral maps [7]. Agrating prism (grism) was employed as the dispersivecomponent in the imaging spectrometer by placing a
February 1, 2011 / Vol. 36, No. 3 / OPTICS LETTERS 355
0146-9592/11/030355-03$15.00/0 © 2011 Optical Society of America
transmission grating on the face of a prism. Grisms areuseful in spectrometers that require in-line presentationof the spectrum, and a grism spectrometer design hasbeen presented in which the angular dispersion withrespect to wavelength is nearly constant [8]. The light dif-fracted by the grating is bent back in line by the refractingeffect of the prism. Although the dispersion of a grism isnot perfectly linear, because the dispersive effects ofthe prism and grating are superimposed, the additionof another prism corrects this problem and provides agreat deal of linear dispersion over a wide range ofwavelengths.The excitation source in the EEM fluorometer was an
Oriel ApexArc Lamp Source [75 WXe (Newport Corpora-tion, Irvine, Calif.)]. The Oriel MS125 Spectrograph (New-port Corporation) with a ruled grating (600 l=mm of linedensity and 200 nmof blazewavelength) served as the dis-persion unit with a 180–500 nm excitation range. Theemission spectrometer was based on the grism designand composed of two UV camera lenses [105 mm F/4 UV-Micro-Apo, (Coastal Optical Systems, West Palm Beach,Fla.)], a wedge prism [2 in: of OD and 25 deg of wedgeangle, (Mark Optics Incorporated, Santa Ana, Calif.)], aUV transmission grating [1200 grooves=mm (Thorlabs,Newton, N.J.)], and an 8 mm × 8 mm CCD detector[iXonEMþ 855 EMCCD, (Andor Technology, Belfast,UK)] with 1000 8 μm square pixels in each dimension.The software used to collect spectroscopic data wasAndor SOLIS for Imaging (version 4.5.0.0) (Andor Tech-nology). At the entrance portion of the emission spectro-meter, the emission fibers are held in a column by ananodized aluminum plug, which is interfaced to this spec-trometer for emission collection.To construct the coaxial fiber array, a length of high
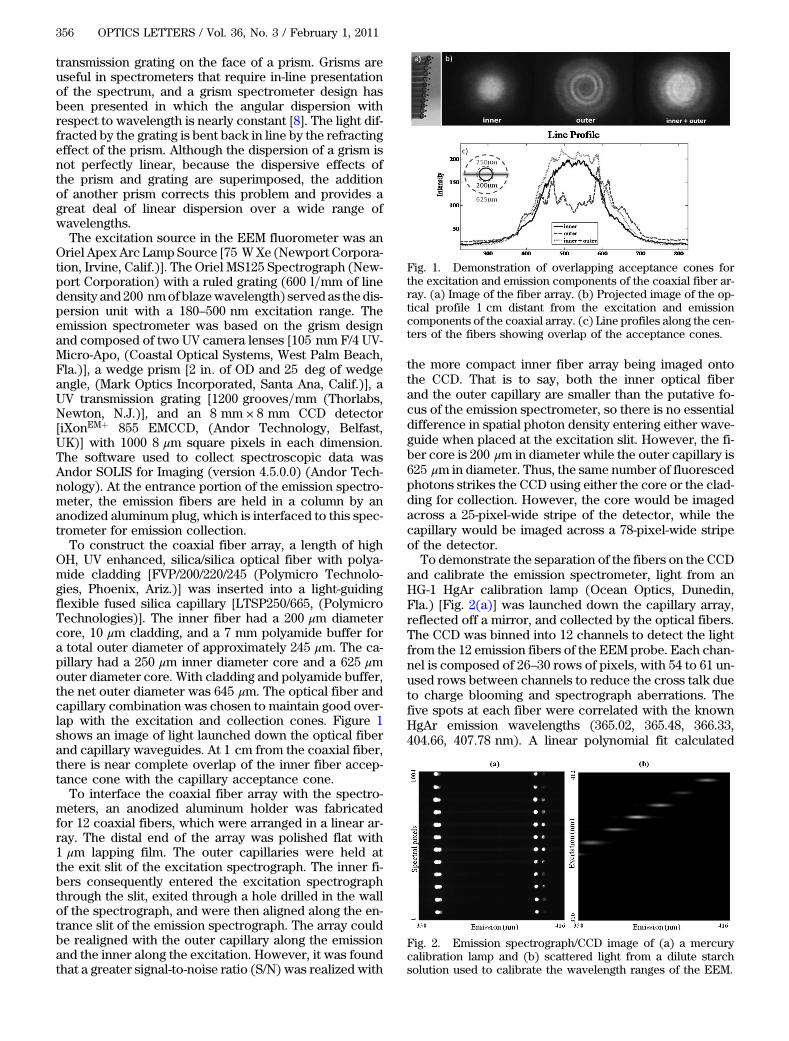
OH, UV enhanced, silica/silica optical fiber with polya-mide cladding [FVP/200/220/245 (Polymicro Technolo-gies, Phoenix, Ariz.)] was inserted into a light-guidingflexible fused silica capillary [LTSP250/665, (PolymicroTechnologies)]. The inner fiber had a 200 μm diametercore, 10 μm cladding, and a 7 mm polyamide buffer fora total outer diameter of approximately 245 μm. The ca-pillary had a 250 μm inner diameter core and a 625 μmouter diameter core. With cladding and polyamide buffer,the net outer diameter was 645 μm. The optical fiber andcapillary combination was chosen to maintain good over-lap with the excitation and collection cones. Figure 1shows an image of light launched down the optical fiberand capillary waveguides. At 1 cm from the coaxial fiber,there is near complete overlap of the inner fiber accep-tance cone with the capillary acceptance cone.To interface the coaxial fiber array with the spectro-
meters, an anodized aluminum holder was fabricatedfor 12 coaxial fibers, which were arranged in a linear ar-ray. The distal end of the array was polished flat with1 μm lapping film. The outer capillaries were held atthe exit slit of the excitation spectrograph. The inner fi-bers consequently entered the excitation spectrographthrough the slit, exited through a hole drilled in the wallof the spectrograph, and were then aligned along the en-trance slit of the emission spectrograph. The array couldbe realigned with the outer capillary along the emissionand the inner along the excitation. However, it was foundthat a greater signal-to-noise ratio (S/N) was realized with
the more compact inner fiber array being imaged ontothe CCD. That is to say, both the inner optical fiberand the outer capillary are smaller than the putative fo-cus of the emission spectrometer, so there is no essentialdifference in spatial photon density entering either wave-guide when placed at the excitation slit. However, the fi-ber core is 200 μm in diameter while the outer capillary is625 μm in diameter. Thus, the same number of fluorescedphotons strikes the CCD using either the core or the clad-ding for collection. However, the core would be imagedacross a 25-pixel-wide stripe of the detector, while thecapillary would be imaged across a 78-pixel-wide stripeof the detector.
To demonstrate the separation of the fibers on the CCDand calibrate the emission spectrometer, light from anHG-1 HgAr calibration lamp (Ocean Optics, Dunedin,Fla.) [Fig. 2(a)] was launched down the capillary array,reflected off a mirror, and collected by the optical fibers.The CCD was binned into 12 channels to detect the lightfrom the 12 emission fibers of the EEM probe. Each chan-nel is composed of 26–30 rows of pixels, with 54 to 61 un-used rows between channels to reduce the cross talk dueto charge blooming and spectrograph aberrations. Thefive spots at each fiber were correlated with the knownHgAr emission wavelengths (365.02, 365.48, 366.33,404.66, 407:78 nm). A linear polynomial fit calculated
Fig. 1. Demonstration of overlapping acceptance cones forthe excitation and emission components of the coaxial fiber ar-ray. (a) Image of the fiber array. (b) Projected image of the op-tical profile 1 cm distant from the excitation and emissioncomponents of the coaxial array. (c) Line profiles along the cen-ters of the fibers showing overlap of the acceptance cones.
Fig. 2. Emission spectrograph/CCD image of (a) a mercurycalibration lamp and (b) scattered light from a dilute starchsolution used to calibrate the wavelength ranges of the EEM.
356 OPTICS LETTERS / Vol. 36, No. 3 / February 1, 2011
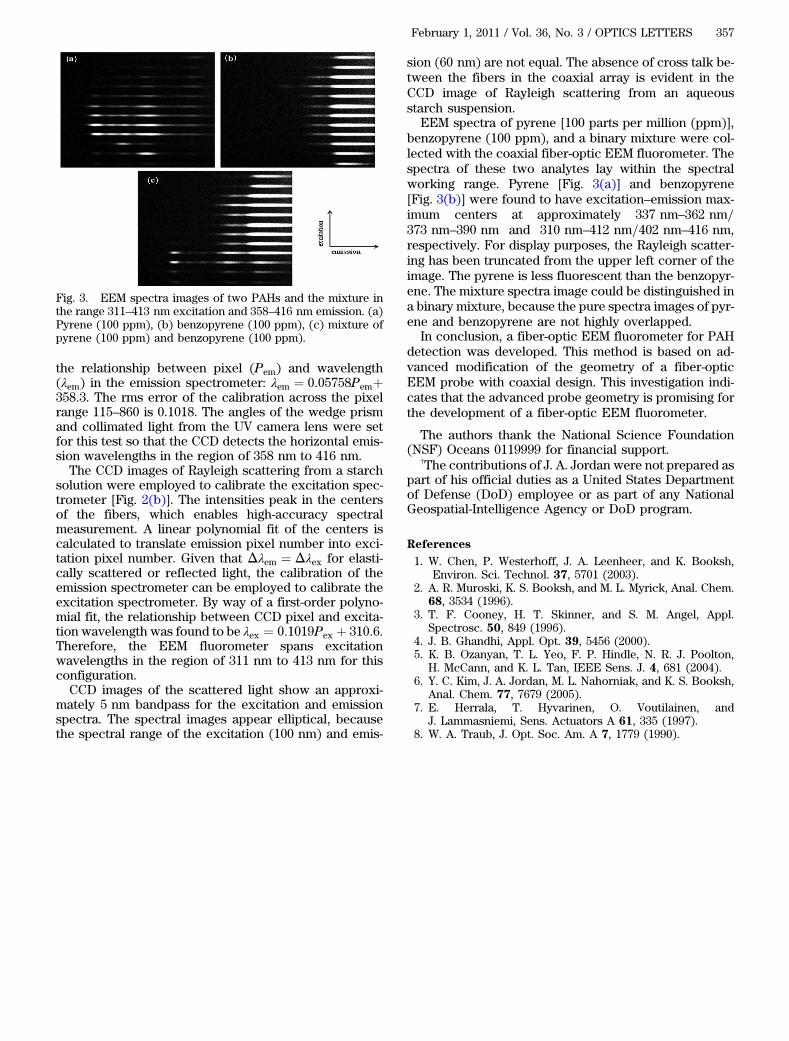
the relationship between pixel (Pem) and wavelength(λem) in the emission spectrometer: λem ¼ 0:05758Pemþ358:3. The rms error of the calibration across the pixelrange 115–860 is 0.1018. The angles of the wedge prismand collimated light from the UV camera lens were setfor this test so that the CCD detects the horizontal emis-sion wavelengths in the region of 358 nm to 416 nm.The CCD images of Rayleigh scattering from a starch
solution were employed to calibrate the excitation spec-trometer [Fig. 2(b)]. The intensities peak in the centersof the fibers, which enables high-accuracy spectralmeasurement. A linear polynomial fit of the centers iscalculated to translate emission pixel number into exci-tation pixel number. Given that Δλem ¼ Δλex for elasti-cally scattered or reflected light, the calibration of theemission spectrometer can be employed to calibrate theexcitation spectrometer. By way of a first-order polyno-mial fit, the relationship between CCD pixel and excita-tion wavelength was found to be λex ¼ 0:1019Pex þ 310:6.Therefore, the EEM fluorometer spans excitationwavelengths in the region of 311 nm to 413 nm for thisconfiguration.CCD images of the scattered light show an approxi-
mately 5 nm bandpass for the excitation and emissionspectra. The spectral images appear elliptical, becausethe spectral range of the excitation (100 nm) and emis-
sion (60 nm) are not equal. The absence of cross talk be-tween the fibers in the coaxial array is evident in theCCD image of Rayleigh scattering from an aqueousstarch suspension.
EEM spectra of pyrene [100 parts per million (ppm)],benzopyrene (100 ppm), and a binary mixture were col-lected with the coaxial fiber-optic EEM fluorometer. Thespectra of these two analytes lay within the spectralworking range. Pyrene [Fig. 3(a)] and benzopyrene[Fig. 3(b)] were found to have excitation–emission max-imum centers at approximately 337 nm–362 nm=373 nm–390 nm and 310 nm–412 nm=402 nm–416 nm,respectively. For display purposes, the Rayleigh scatter-ing has been truncated from the upper left corner of theimage. The pyrene is less fluorescent than the benzopyr-ene. The mixture spectra image could be distinguished ina binary mixture, because the pure spectra images of pyr-ene and benzopyrene are not highly overlapped.
In conclusion, a fiber-optic EEM fluorometer for PAHdetection was developed. This method is based on ad-vanced modification of the geometry of a fiber-opticEEM probe with coaxial design. This investigation indi-cates that the advanced probe geometry is promising forthe development of a fiber-optic EEM fluorometer.
The authors thank the National Science Foundation(NSF) Oceans 0119999 for financial support.
†The contributions of J. A. Jordan were not prepared aspart of his official duties as a United States Departmentof Defense (DoD) employee or as part of any NationalGeospatial-Intelligence Agency or DoD program.
References
1. W. Chen, P. Westerhoff, J. A. Leenheer, and K. Booksh,Environ. Sci. Technol. 37, 5701 (2003).
2. A. R. Muroski, K. S. Booksh, and M. L. Myrick, Anal. Chem.68, 3534 (1996).
3. T. F. Cooney, H. T. Skinner, and S. M. Angel, Appl.Spectrosc. 50, 849 (1996).
4. J. B. Ghandhi, Appl. Opt. 39, 5456 (2000).5. K. B. Ozanyan, T. L. Yeo, F. P. Hindle, N. R. J. Poolton,
H. McCann, and K. L. Tan, IEEE Sens. J. 4, 681 (2004).6. Y. C. Kim, J. A. Jordan, M. L. Nahorniak, and K. S. Booksh,
Anal. Chem. 77, 7679 (2005).7. E. Herrala, T. Hyvarinen, O. Voutilainen, and
J. Lammasniemi, Sens. Actuators A 61, 335 (1997).8. W. A. Traub, J. Opt. Soc. Am. A 7, 1779 (1990).
Fig. 3. EEM spectra images of two PAHs and the mixture inthe range 311–413 nm excitation and 358–416 nm emission. (a)Pyrene (100 ppm), (b) benzopyrene (100 ppm), (c) mixture ofpyrene (100 ppm) and benzopyrene (100 ppm).
February 1, 2011 / Vol. 36, No. 3 / OPTICS LETTERS 357