simple and inexpensive 3d printed filter fluorometer
TRANSCRIPT

Simple and Inexpensive 3D Printed Filter Fluorometer Designs: User-Friendly Instrument Models for Laboratory Learning and OutreachActivitiesLon A. Porter, Jr.,* Cole A. Chapman, and Jacob A. Alaniz
Department of Chemistry, Wabash College, Crawfordsville, Indiana 47933, United States
*S Supporting Information
ABSTRACT: In this work, a versatile and user-friendlyselection of stereolithography (STL) files and computer-aideddesign (CAD) models are shared to assist educators andstudents in the production of simple and inexpensive 3D printedfilter fluorometer instruments. These devices are effectiveresources for supporting active learners in the exploration ofinstrument design and performance. In contrast to sophisticatedcommercial-grade fluorometers, the models provided here areopen source, customizable for a variety of applications, andeasily assembled by students in activities that directly confrontthe “black box” perception of analytical instrumentation. In order to aid beginner CAD and 3D printer users, these models arecompatible with accessible software packages, such as 123D Design and Inventor Professional. Additionally, CAD tutorials andextensive slicer settings are supplied to assist educators and students in modifying digital designs and obtaining reliable 3D prints.The provided filter fluorometer models are printed quickly, consume about a dollar’s worth of plastic, and do not requirecomplex support structures when 3D printed. Once fabricated and assembled, these devices perform well in a range of laboratoryactivities, including the quantitative determination of luminescent analytes at the ppm or ppb level.
KEYWORDS: High School/Introductory Chemistry, First-Year Undergraduate/General, Second-Year Undergraduate,Analytical Chemistry, Public Understanding/Outreach, Hands-On Learning/Manipulatives, Instrumental Methods,Laboratory Equipment/Apparatus, Quantitative Analysis, Spectroscopy
■ INTRODUCTION
Fluorescence techniques serve as powerful analytical methodsfor elucidating important chemical, biochemical, and biologicalphenomena. Luminescent probes and innovative labelingstrategies allow for protein detection, investigation of lipiddynamics, and tracking of cellular processes, among others.1
Beyond these significant applications, fluorescence remains animportant subject in the undergraduate chemistry curriculum asa fundamental excitation−emission process.2 These topics aremost effectively explored in the laboratory, where students arechallenged to investigate complex phenomena within anapplied and relevant context. However, the prohibitive cost ofresearch-grade instrumentation restricts the infrastructureavailable for laboratory learning activities. While few, previousarticles have described portable filter fluorometers for studentuse.3−6 These devices are near-commercial in appearance andoperation. While they are effective analytical tools, instrumentsof this type require intricate assemblies, employ complexcircuitry, and are encased in a way that hides away importantcomponents. As with many modern instruments that featurethe convenience of “push-button” data acquisition, significantand fundamental aspects of student learning are lost. In aneffort to directly confront this “black box” perception ofinstrumentation, the filter fluorometer designs shared here
purposely make major components accessible and are easilyassembled by students during laboratory activities. The simplemodels presented provide an effective entry point for studentdesign and construction of functional instrumentation. Theseintroductory tools are meant to support discovery learningrelated to the technology and fundamental principles ofanalysis.7 In this way, students explore instrumental designdirectly and participate in active learning exercises related toexcitation source selection, filter choice, and simple circuitbuilding during assembly and data acquisition.In order to assist educators and students in the fabrication of
simple and inexpensive 3D printed filter fluorometer instru-ments, a versatile and user-friendly selection of computer-aideddesign (CAD) models and stereolithography (STL) files areshared in this report (Figure 1). These instrument files providea convenient and customizable starting point in developingpurpose-built devices for use in fluorescence-based analyticallaboratory activities and outreach projects. Increased access toconsumer-grade 3D printers via university fabrication centersand community maker spaces provides exciting opportunities
Received: July 4, 2016Revised: November 5, 2016Published: December 6, 2016
Technology Report
pubs.acs.org/jchemeduc
© 2016 American Chemical Society andDivision of Chemical Education, Inc. 105 DOI: 10.1021/acs.jchemed.6b00495
J. Chem. Educ. 2017, 94, 105−111

for educators and students to create innovative new learningtools. Recent examples include designs for visualizing molecularmodels,8 symmetry elements,9 and potential energy surfaces,10
among others. However, while CAD and 3D printing areincreasingly employed in the customization and design ofresearch-grade analytical instrumentation,11 few previous effortshave focused on applying this versatile technology in thedevelopment of new educational tools for student laboratorylearning.12−15 Three-dimensional printing offers a powerful andprecise alternative to instruments produced from shoeboxesand other household items. It represents a fundamentally newfabrication paradigm for engaging educators and students in theproduction of inexpensive and customizable analytical tools viadeliberate digital design. This new technology transcends thelimitations of conventional tooling and grants access tocustomized analytical devices for exploring activities andfundamental concepts inaccessible to more conventionalinstruments.However, 3D printing equipment and CAD software are
often associated with a steep learning curve that presents abarrier to entry for novice users. Similarly, the myriad settingsassociated with converting stereolithography (STL) files intothe G-code files required for reliable 3D printing provide yetanother hurdle. In order to assist beginner CAD and 3D printerusers, the designs reported are compatible with accessiblesoftware packages, such as 123D Design and InventorProfessional. Several step-by-step CAD tutorials are presentedin the Supporting Information with notes on how users mightcustomize the instruments reported here. Additionally,extensive slicer settings are supplied in the SupportingInformation to help educators and students in obtainingconsistent 3D prints. The majority of the provided filterfluorometer models require approximately 3 h of print time,
consume about a dollar’s worth of plastic, and may be printedwithout any complex support structures. While the timerequired to print the instruments shared here is minimal, it isstill not feasible to both fabricate the devices and use themwithin a typical laboratory period. Therefore, the 3D printedfilter fluorometers should be printed and collected into kitsbefore use in laboratory and outreach activities. However, theopportunity to engage in digital design, customization, and 3Dprinting might warrant a separate laboratory or activity period.Once assembled by students, these devices perform well in avariety of laboratory activities, including the quantitativedetermination of luminescent analytes at the ppm or ppb level.
■ DESIGN AND ASSEMBLY
Building upon on our previous work in developing simple 3Dprinted colorimeters,13 the filter fluorometer models reportedhere were designed to provide students with hands-onopportunities to explore fundamental spectroscopic principlesand instrument performance via quantitative analysis experi-ments. However, these instrument designs are also suitable forinvestigating chemical kinetics, fluorescence quenching, and ahost of other significant applications. The devices shared herehave been successfully used in Wabash College laboratorycoursework and are appropriate for high school and outreachactivities. These 3D printed filter fluorometers are provided tostudents in the form of an unassembled kit when used as part ofboth verification and inquiry-based experiments. Kit compo-nents include the 3D printed instrument body, optical filters ifrequired, circuit components (e.g., batteries, resistors, LEDsource, phototransistor detector, and alligator clip leads), andan inexpensive digital multimeter. A detailed list of materialsand commercial sources is provided in the SupportingInformation. An entire filter fluorometer instrument, including
Figure 1. (a) Example multipart CAD model assembly rendering for a filter fluorometer instrument. (b) Complete filter fluorometer designfabricated via 3D printing using polylactic acid (PLA) plastic. Both LED source (left) and CdS photocell (right) are displayed after mounting in 3Dprinted docks. (c) Simplified wiring diagram with LED (left) and detector (right) dock inserted, shown alongside an assembled and fully functionalfilter fluorometer. (d) In order to reduce the required number of 3D printed components for novice users, the alternate design shown here employsrubber stopper source and detector mounts in place of the 3D printed docks.
Journal of Chemical Education Technology Report
DOI: 10.1021/acs.jchemed.6b00495J. Chem. Educ. 2017, 94, 105−111
106

optical filter, digital multimeter, and batteries, can be obtainedfor less than $50, which presents a significant savings whencompared to commercial instruments.The inexpensive nature of the instrument design provides the
opportunity for each student laboratory partnership or group toutilize a 3D printed filter fluorometer for the entire activityperiod. This is in contrast to typical models of studentengagement with fluorometry activities, where one instrumentmust serve an entire class of students. It also increases thepossibility of introducing fluorescence-based experiments intohigh school, introductory undergraduate, and courses intendedfor nonmajors. Similarly, advanced level analytical, physical, andbiochemistry courses may adapt the instrument modelspresented here to activities appropriate for more in-depthexplorations of relevant fundamental content and applications.Enhanced engagement via active learning strategies involvingstudent construction of functional instrumentation is aneffective way to assist learners in discovering the technologyand fundamental principles of analysis. The precision, flexibility,and cost savings offered through the combination of CAD and3D printing empowers educators and students to fabricatecustomized analytical tools for exploring a variety of conceptsand analytical applications.In a departure from conventional filter fluorometer designs,
the 3D printed instrument models described here purposefullyavoid case-styled enclosures, circuit boards with complexelectronics, and expensive optical components. Instead, all ofthe major electrical components remain exposed and are easilyaccessed by students during assembly and use. The single-piece,3D printed instrument body was modeled to provide a simple,stable, and durable design (Figure 1a) that prints quickly andtakes up minimal bench space. While quartz sample cells arerecommended, the device is compatible with the glass andplastic cuvettes more frequently encountered in the introduc-tory undergraduate and high school laboratory. Digital designaffords a great deal of flexibility for quick and simple alterationsto accommodate any variety of cell geometries. For example, analternate filter fluorometer model is displayed in Figure 2b thatcontains a cylindrical sample housing for use of 1/2 in.diameter glass test tube cells. A variety of additional CADdesigns are provided in the Supporting Information.The excitation and emission light path arms are oriented 90°
to each other in order to reduce the amount of scattered LEDexcitation light from reaching the detector (Figure 1b). Eacharm may incorporate a capped optical filter housing that iscompatible with a wide range of glass or plastic filters. Usingsimple CAD alterations, these housings may be adapted forcircular, square, or almost any optical filter geometry. Dockingports terminate the light path arms, facilitating simple insertionand alignment of the excitation source and detector. Thismodular configuration allows for the incorporation of a widevariety of LEDs and solid-state detector choices. A simplerectangular cap secures each end-cap dock in place during use(Figure 1c). Alternatively, source and detector elements may beheld in place using size 000 rubber stoppers so that the numberof 3D printed parts required is reduced (Figure 1d). Botharrangements result in a secure fit that provides a consistentalignment and prevents gaps that might allow stray light toenter the instrument. The simple geometry of the designminimizes the plastic required for printing, thereby reducingprinting time. It also avoids any overhang features that require3D printer software generated support scaffolds. These support
structures often complicate fabrication and prove difficult forsome software packages.Instructions for instrument preparation, operation, and a
simple wiring diagram are provided in the SupportingInformation. While more sophisticated electronics may beadapted to enhance instrument performance for advancedstudents, two simple voltage divider circuits are employed forintroductory-level applications (Figure 1c). Similarly, alligatorclip connectors avoid the need for soldering and allow for facileassembly and troubleshooting during use. This open designleaves major components of the instrument exposed in an effortto avoid the “black box” perception of instrumentation. Inaddition to wiring diagrams, instructors may supply studentswith prelaboratory data, such as analyte excitation and emission
Figure 2. (a) Absorption spectrum of 5.00 ppm aqueous sodiumfluorescein with an overlay of the normalized emission spectra forviolet (370 nm), indigo (405 nm), blue (465 nm), and green (525nm) LEDs. Absorbance data was acquired using a PerkinElmerLambda 40 UV−vis spectrophotometer and emission spectra wereobtained using an Ocean Optics USB-650 spectrometer. (b) 3Dprinted filter fluorometers for use with cuvette (left) and test tube(right) sample cells are shown here with caps, LED source, and aphotocell detector. (c) Standard calibration curves obtained forfluorescein using a 465 nm LED source, 495 nm cutoff filter, and CdSphotocell detector employing 3D printed filter fluorometer designs foruse with a (●) cuvette and (■) test tube sample cell.
Journal of Chemical Education Technology Report
DOI: 10.1021/acs.jchemed.6b00495J. Chem. Educ. 2017, 94, 105−111
107

spectra, so that lab groups are challenged with selectingappropriate LED source, optical filter, and solid-state detectorchoices during assembly. This provides the opportunity toemploy inquiry-based learning experiences as an alternative tosimple verification approaches. While each circuit may bepowered by a separate 9 V battery for field locations,inexpensive ac to dc power supplies were found to be morestable, convenient, and sustainable options for use in the typicallaboratory setting.The 3D printed filter fluorometers shared here are
compatible with a wide range of commercially available LEDsthat offer low-voltage, long-lived, and inexpensive light sources.These light sources are available for a wide range of visible andultraviolet wavelengths, allowing for analysis of a diverse rangeof substances. While several solid-state detectors may beemployed, simple and inexpensive cadmium sulfide (CdS)photocells proved to offer reliable performance. The significantflexibility offered by CAD and 3D printing allows educators andstudents the ability to enlarge or reshape the instrument designin order to accommodate any number of source, detector, oroptical filter components. Similarly, the provided CAD filesmay be revised and customized to allow for the integration oflenses to increased performance. While appropriate foradvanced students, more complex circuitry may be alsoincorporated to decrease signal noise, enhance detection limits,and increase sensitivity by inclusion of diodes, capacitors, andamplifiers, as desired.
■ OPERATION AND PERFORMANCE
Following assembly, collection of quality data is simple usingthe 3D printed filter fluorometer devices described here.Students are provided with an inexpensive digital multimeter tomake all voltage measurements. First, a series of voltagereadings should be recorded for a cuvette filled with puresolvent (Vreference). Once the average reference voltage isdetermined, replicate sample measurements (Vsample) areobtained, and the resulting fluorescence signal for each sampleis determined via eq 1. Cadmium sulfide photocell detectorsrequire a short time to reach a stable reading at low light levels,so a consistent acquisition delay of about a minute should bemaintained for all voltage measurements. Data collected in thisway presents an opportunity for students to explore themathematical power of proper curve fitting for both linear andnonlinear relationships. Similarly, these measurements allow forstudent determination of appropriate figures of merit for the3D printed filter fluorometer instrument. While less convenientfor unknown determination, nonlinear calibration curves arealso worth consideration in exploration of the more generalunderstanding of fluorescence intensity as a function of analyteconcentration.
= −V Vfluorescence signal ( )sample reference (1)
When used in inquiry-based activities at the introductorylevel, students are provided with absorption and emissionspectra for the analyte of interest. More advanced students aretasked with obtaining this information directly from theprimary literature. Data provided in preparation for thelaboratory activity prompts student teams to more effectivelyengage in formulating an analysis strategy and facilitate much ofthe instrument design planning. The absorption spectrumshould aid in stimulating a student discussion leading to anappropriate LED excitation source selection for a particular
analyte. Advances in semiconductor fabrication have yielded agreat variety of commercially available LEDs. While theseinexpensive light sources are versatile, it is important torecognize that they are not tunable. Thus, students should takecare to select an LED source with greatest emission intensitynear the analyte absorption maximum. Figure 2a displays theemission spectra for several LED sources superimposed ontothe visible absorbance spectrum for aqueous sodiumfluorescein. Of the available LEDs available to the students,discussion should arrive at the conclusion that the blue (465nm) LED best matches the excitation spectrum for fluorescein.This LED source results in the most appropriate choice ofexcitation source for the instrument design. When possible,similar discussions may be prompted to focus on optical filterselection for excitation and emission, as well as solid-statedetector choice.The 3D printed filter fluorometers are well-suited for
introductory quantitative analysis activities. These simple andinexpensive instrument designs are both sensitive and adaptablefor a wide range of laboratory learning applications. Standardcalibration curves for aqueous sodium fluorescein (D&CYellow #8) are shown in Figure 2c. Fluorescein is widelyused in fluorescence labeling methodologies and oftenemployed in undergraduate laboratory activities due to itsstability and high quantum yield. Data was collected using ahigh-power 465 nm LED (∼20 mW), quartz cuvette, and CdSdetector. While glass filters are optional, an emission cutofffilter (495 nm) is suggested for best results. Information onthese components, along with sourcing and pricing, is providedin the Supporting Information. The calibration curve yielded alinear fit from 1.8 to 108 ppb. Increasing sample concentrationsbeyond this range resulted in increasingly significant deviationsfrom linearity. While quartz and glass cuvettes produced themost accurate results, inexpensive glass test tube sample cellsare often preferred for outreach activities or when a largenumber of students must be accommodated. The plots shownin Figure 2c demonstrate that both 3D printed filterfluorometer sample configurations resulted in linear standardcalibration curves for fluorescein.Figure 3a displays both the excitation and emission spectra
for dilute aqueous solutions of tris(2,2′-bipyridine)ruthenium-(II) chloride. This complex is an excellent choice for exploringthe quantitative determination of metal species and is also usedin fluorescence-based thermal imaging. As in the case offluorescein above, providing excitation and emission spectra tostudents encourages active engagement in the determination ofinstrument configuration and operation. The ability to modifydigital designs to produce adaptable devices is a testament tothe power of rapid prototyping made possible by modern 3Dprinting technology. The filter fluorometer CAD modelsprovided here may be easily customized as needed for studentuse. Instrument variants shown in Figure 3b display devicesincorporating zero, one, or two optical filters. Filter selectionprovides a simple, yet important opportunity to engage activelearners. While small tungsten and halogen sources may beused, the emission spectra of high-quality LED excitationsources is often narrow enough to preclude the use of low-costbandpass excitation filters. Most economy-grade optical glassfilters contain transmission bands that are wider than theemission spectra of quality LEDs. Although narrow bandpassfilters (±10 nm) may be purchased, the limited increase inperformance often fails to justify the increased cost of thesefilters. However, the large Stokes shift exhibited by [Ru(bpy)3]-
Journal of Chemical Education Technology Report
DOI: 10.1021/acs.jchemed.6b00495J. Chem. Educ. 2017, 94, 105−111
108
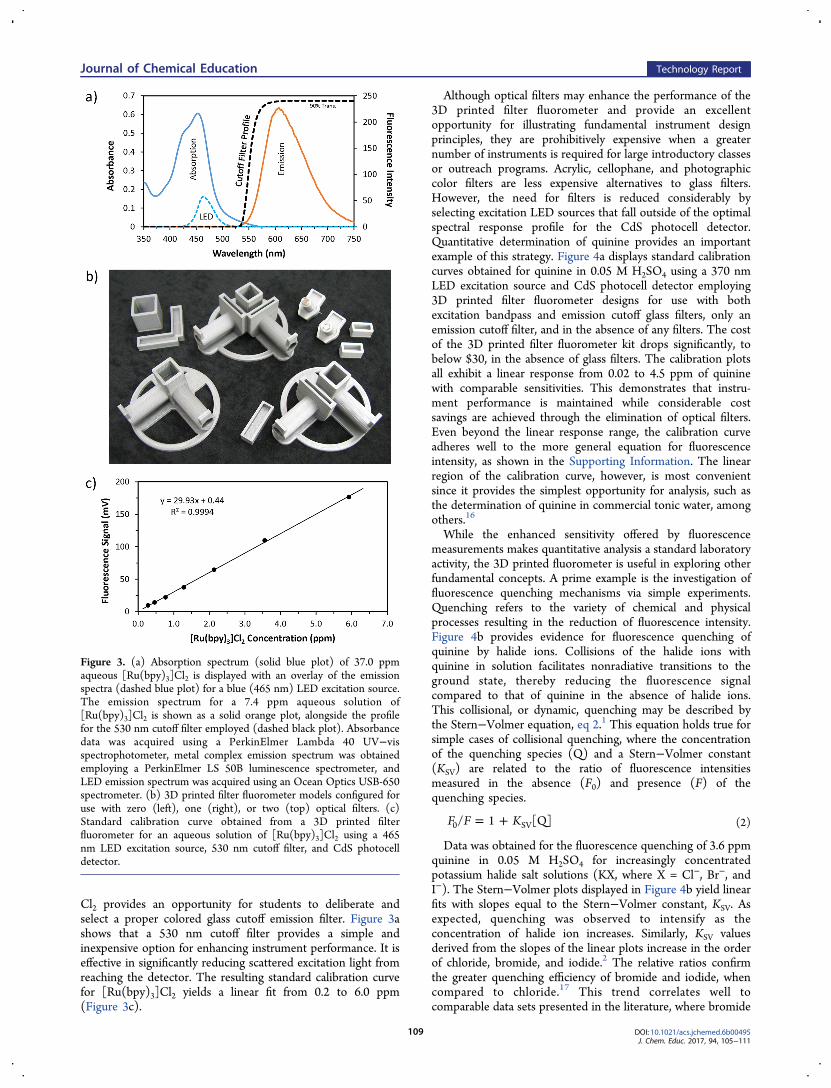
Cl2 provides an opportunity for students to deliberate andselect a proper colored glass cutoff emission filter. Figure 3ashows that a 530 nm cutoff filter provides a simple andinexpensive option for enhancing instrument performance. It iseffective in significantly reducing scattered excitation light fromreaching the detector. The resulting standard calibration curvefor [Ru(bpy)3]Cl2 yields a linear fit from 0.2 to 6.0 ppm(Figure 3c).
Although optical filters may enhance the performance of the3D printed filter fluorometer and provide an excellentopportunity for illustrating fundamental instrument designprinciples, they are prohibitively expensive when a greaternumber of instruments is required for large introductory classesor outreach programs. Acrylic, cellophane, and photographiccolor filters are less expensive alternatives to glass filters.However, the need for filters is reduced considerably byselecting excitation LED sources that fall outside of the optimalspectral response profile for the CdS photocell detector.Quantitative determination of quinine provides an importantexample of this strategy. Figure 4a displays standard calibrationcurves obtained for quinine in 0.05 M H2SO4 using a 370 nmLED excitation source and CdS photocell detector employing3D printed filter fluorometer designs for use with bothexcitation bandpass and emission cutoff glass filters, only anemission cutoff filter, and in the absence of any filters. The costof the 3D printed filter fluorometer kit drops significantly, tobelow $30, in the absence of glass filters. The calibration plotsall exhibit a linear response from 0.02 to 4.5 ppm of quininewith comparable sensitivities. This demonstrates that instru-ment performance is maintained while considerable costsavings are achieved through the elimination of optical filters.Even beyond the linear response range, the calibration curveadheres well to the more general equation for fluorescenceintensity, as shown in the Supporting Information. The linearregion of the calibration curve, however, is most convenientsince it provides the simplest opportunity for analysis, such asthe determination of quinine in commercial tonic water, amongothers.16
While the enhanced sensitivity offered by fluorescencemeasurements makes quantitative analysis a standard laboratoryactivity, the 3D printed fluorometer is useful in exploring otherfundamental concepts. A prime example is the investigation offluorescence quenching mechanisms via simple experiments.Quenching refers to the variety of chemical and physicalprocesses resulting in the reduction of fluorescence intensity.Figure 4b provides evidence for fluorescence quenching ofquinine by halide ions. Collisions of the halide ions withquinine in solution facilitates nonradiative transitions to theground state, thereby reducing the fluorescence signalcompared to that of quinine in the absence of halide ions.This collisional, or dynamic, quenching may be described bythe Stern−Volmer equation, eq 2.1 This equation holds true forsimple cases of collisional quenching, where the concentrationof the quenching species (Q) and a Stern−Volmer constant(KSV) are related to the ratio of fluorescence intensitiesmeasured in the absence (F0) and presence (F) of thequenching species.
= +F F K/ 1 [Q]0 SV (2)
Data was obtained for the fluorescence quenching of 3.6 ppmquinine in 0.05 M H2SO4 for increasingly concentratedpotassium halide salt solutions (KX, where X = Cl−, Br−, andI−). The Stern−Volmer plots displayed in Figure 4b yield linearfits with slopes equal to the Stern−Volmer constant, KSV. Asexpected, quenching was observed to intensify as theconcentration of halide ion increases. Similarly, KSV valuesderived from the slopes of the linear plots increase in the orderof chloride, bromide, and iodide.2 The relative ratios confirmthe greater quenching efficiency of bromide and iodide, whencompared to chloride.17 This trend correlates well tocomparable data sets presented in the literature, where bromide
Figure 3. (a) Absorption spectrum (solid blue plot) of 37.0 ppmaqueous [Ru(bpy)3]Cl2 is displayed with an overlay of the emissionspectra (dashed blue plot) for a blue (465 nm) LED excitation source.The emission spectrum for a 7.4 ppm aqueous solution of[Ru(bpy)3]Cl2 is shown as a solid orange plot, alongside the profilefor the 530 nm cutoff filter employed (dashed black plot). Absorbancedata was acquired using a PerkinElmer Lambda 40 UV−visspectrophotometer, metal complex emission spectrum was obtainedemploying a PerkinElmer LS 50B luminescence spectrometer, andLED emission spectrum was acquired using an Ocean Optics USB-650spectrometer. (b) 3D printed filter fluorometer models configured foruse with zero (left), one (right), or two (top) optical filters. (c)Standard calibration curve obtained from a 3D printed filterfluorometer for an aqueous solution of [Ru(bpy)3]Cl2 using a 465nm LED excitation source, 530 nm cutoff filter, and CdS photocelldetector.
Journal of Chemical Education Technology Report
DOI: 10.1021/acs.jchemed.6b00495J. Chem. Educ. 2017, 94, 105−111
109

and iodide are reported to be approximately 1.5 and 2 times aseffective, respectively.16 Dynamic quenching experiments suchas these present simple activities that illustrate more advancedlevel explorations of fundamental excitation−emission phenom-ena.Fluorometric titration curves are another activity well-suited
for the 3D printed filter fluorometer instrument designsreported here. The plot in Figure 4c demonstrates the pHdependence of the fluorescence signal for 3.6 ppm quinine. Thequinine samples were buffered at various pH values and excitedby a 370 nm LED using a 3D printed filter fluorometerequipped with a CdS detector. Both the plot and inset
photographs displayed in Figure 4c confirm that thefluorescence intensity of quinine is quenched with increasingpH, as the dication is deprotonated to the monocation form.18
Inspection or first-derivative analysis of the titration curvereveals a pKa value comparable to that reported in the literature.The utility demonstrated by the 3D printed filter fluorometer isfurther supported by its use in exploring solvent effects onfluorescence, demonstrations of Rayleigh scattering vianephelometric analysis, and other examples presented in theSupporting Information.
■ CONCLUSIONProviding increased opportunities for student interaction withanalytical instrumentation in significant and diverse ways is animportant curricular goal. While the 3D printed filterfluorometer designs presented here are not intended to replacecommercial instrumentation, they do provide an inexpensiveand versatile set of tools for engaging students at all levels in theexploration of hands-on quantitative analysis. Most signifi-cantly, these novel devices allow greater student engagementwith instrumentation, as opposed to sharing just onefluorometer across an entire class. These models aim to assisteducators in dispelling the “black box” notion of instrumentdesign by empowering students to assemble their own devices.Like our previous work in producing 3D printed colorimeters,13
this report demonstrates that user-friendly and customizabledesigns provide access to a fundamentally different means ofinstrument exploration for active learners. While gainingpopularity in the research literature, the combination of CADand 3D printing also offers educators and students a newmethod for developing innovative designs for the learninglaboratory.
■ ASSOCIATED CONTENT*S Supporting Information
The Supporting Information is available on the ACSPublications website at DOI: 10.1021/acs.jchemed.6b00495.
Slicer settings, material lists, wiring diagrams, assemblyand operation instructions, calibration plots, photo-graphs, and introductory laboratory activity (PDF)Autodesk 123D Design CAD Tutorial (ZIP)Autodesk Inventor CAD Tutorial (ZIP)Example 3D Printing Tutorial (PDF)Autodesk 123D Design CAD and STL files (ZIP)Autodesk Inventor CAD and STL files (ZIP)
■ AUTHOR INFORMATIONCorresponding Author
*E-mail: [email protected]
Lon A. Porter Jr.: 0000-0002-1092-2776Notes
The authors declare no competing financial interest.
■ ACKNOWLEDGMENTSThe authors gratefully acknowledge financial support of thiswork by Wabash College and the Department of Chemistrythrough the Haines Chemistry Fund. The Wabash College 3DPrinting and Fabrication Center, supported through a BallBrothers Foundation Venture Fund Grant, is thanked for
Figure 4. (a) Standard calibration curves obtained for quinine in 0.05M H2SO4 using a 370 nm LED source and CdS photocell detectoremploying 3D printed filter fluorometer designs for use with (●) bothexcitation bandpass and emission cutoff glass filters, (▲) only anemission cutoff glass filter, and (■) in the absence of any glass filters.(b) Stern−Volmer plots obtained at room temperature using a 3Dprinted filter fluorometer (370 nm LED) for the fluorescencequenching of 3.6 ppm quinine in 0.05 M H2SO4 by KX (X = Cl−,Br−, and I−). (c) The pH dependence of the fluorescence signal for 3.6ppm quinine obtained using a 3D printed filter fluorometer equippedwith a 370 nm LED and CdS photocell detector. The inset photoshows the visible change in fluorescent intensity over the same pHrange for samples illuminated by a commercially available “black light”.
Journal of Chemical Education Technology Report
DOI: 10.1021/acs.jchemed.6b00495J. Chem. Educ. 2017, 94, 105−111
110

facilities and instrumentation support. We are most grateful toRichard F. Dallinger for his expertise and assistance. WabashCollege students Mazin H. Hakim, Douglas A. Rourke, and theCHE331 (Advanced Analytical Chemistry) classes are acknowl-edged for additional instrument testing and feedback.
■ REFERENCES(1) Jameson, D. M. Introduction to Fluorescence; Taylor & Francis:Boca Raton, FL, 2014.(2) Lakowicz, J. R. Principles of Fluorescence Spectroscopy, 3rd ed.;Springer: New York, 2011.(3) Wahab, M. F. Fluorescence Spectroscopy in a Shoebox. J. Chem.Educ. 2007, 84 (4), 1308−1312.(4) Algar, W. R.; Massey, M.; Krull, U. J. Assembly of a ModularFluorimeter and Associated Software: Using LabVIEW in an AdvancedUndergraduate Analytical Chemistry Laboratory. J. Chem. Educ. 2009,86 (1), 68−71.(5) Wigton, B. T.; Chohan, B. S.; McDonald, C.; Johnson, M.;Schunk, D.; Kreuter, R.; Sykes, D. A Portable, Low-Cost, LEDFluorimeter for Middle School, High School, and UndergraduateChemistry Labs. J. Chem. Educ. 2011, 88 (8), 1182−1187.(6) Wigton, B. T.; Chohan, B. S.; Kreuter, R.; Sykes, D. TheCharacterization of an Easy-to-Operate Inexpensive Student-BuiltFluorimeter. J. Chem. Educ. 2011, 88 (8), 1188−1193.(7) Wang, J. J.; Nunez, J. R. R.; Maxwell, E. J.; Algar, W. R. BuildYour Own Photometer: A Guided-Inquiry Experiment To IntroduceAnalytical Instrumentation. J. Chem. Educ. 2016, 93 (1), 166−171.(8) Scalfani, V. F.; Vaid, T. P. 3D Printed Molecules and ExtendedSolid Models for Teaching Symmetry and Point Groups. J. Chem.Educ. 2014, 91 (8), 1174−1180.(9) Casas, L.; Estop, E. Virtual and Printed 3D Models for TeachingCrystal Symmetry and Point Groups. J. Chem. Educ. 2015, 92 (8),1338−1343.(10) Kaliakin, D. S.; Zaari, R. R.; Varganov, S. A. 3D PrintedPotential and Free Energy Surfaces for Teaching FundamentalConcepts in Physical Chemistry. J. Chem. Educ. 2015, 92 (12),2106−2112.(11) Prikryl, J.; Foret, F. Fluorescence Detector for CapillarySeparations Fabricated by 3D Printing. Anal. Chem. 2014, 86 (24),11951−11956.(12) Mendez, J. An Inexpensive 3D Printed Colorimeter. Chem.Educator 2015, 20, 224−226.(13) Porter, L. A., Jr.; Washer, B. M.; Hakim, M. H.; Dallinger, R. F.User-Friendly 3D Printed Colorimeter Models for Student Explorationof Instrument Design and Performance. J. Chem. Educ. 2016, 93 (7),1305−1309.(14) Grasse, E. K.; Torcasio, M. H.; Smith, A. W. Teaching UV−VisSpectroscopy with a 3D-Printable Smartphone Spectrophotometer. J.Chem. Educ. 2016, 93 (1), 146−151.(15) Stewart, C.; Giannini, J. Inexpensive, Open Source Epifluor-escence Microscopes. J. Chem. Educ. 2016, 93 (7), 1310−1315.(16) O’Reilly, J. E. Fluorescence Experiments with Quinine. J. Chem.Educ. 1975, 52 (9), 610−612.(17) Jayaraman, S.; Verkman, A. S. Quenching Mechanism ofQuinolinium-Type Chloride-Sensitive Fluorescent Indicators. Biophys.Chem. 2000, 85 (1), 49−57.(18) Schulman, S. G.; Threatte, R. M.; Capomacchia, A. C.; Paul, W.L. Fluorescence of 6-Methoxyquinoline, Quinine, and Quinidine inAqueous Media. J. Pharm. Sci. 1974, 63 (6), 876−880.
Journal of Chemical Education Technology Report
DOI: 10.1021/acs.jchemed.6b00495J. Chem. Educ. 2017, 94, 105−111
111