coating of pellets with aqueous dispersions of enteric polymer by
TRANSCRIPT

Coating of Pellets with
Aqueous Dispersions of Enteric Polymer by
using a Wurster-based Fluidized Bed
Apparatus
A Dissertation submitted in Partial Fulfillment
of the Requirements for the Degree of Doctor of Natural Science
(Dr. rer. nat)
University of Hamburg Faculty of Chemistry Institute of Pharmacy
Department of Pharmaceutical Technology
by
Mont Kumpugdee
from Bangkok/Thailand
Hamburg 2002

Überziehen von Pellets mit wässrigen,
magensaftresistenten Polymerdispersionen in
der Wirbelschichtanlage
Dissertation
Zur Erlangung des Doktorgrades des Fachbereiches Chemie der Universität Hamburg
vorgelegt von
Mont Kumpugdee
aus Bangkok/Thailand
Hamburg 2002

ACKNOWLEDGEMENT
It is my particular desire to express my sincere gratitude and appreciation to my
supervisor Prof. Dr. Jobst B. Mielck for all his encouraging support, guidance and
suggestions for making every necessary facility during the time of my doctoral work.
I would also like to express my thanks to the Deutscher Akademischer Austauschdienst
(DAAD) for the financial support and to all the companies i.e. Werner’s Feine Dragees /
Tornesch, Syntapharm / Mülheim-Ruhr, Seppic / France, Lehmann & Voss / Hamburg,
Clariant / Frankfurt am Main, Hoechst / Burgkirchen, and BASF / Ludwigshafen for the
substances used for the research work.
I also thank Dr. Kunick, Dr. Wieking, Mrs. Pies and Mrs. Wackendorff for the
discussions and measurements of NMR and IR; Dr. Keyser and Mrs. Walter for the
support of SEM-measurements.
I also express my particular appreciation for the kind assistance, encouragement and
friendship granted to me by all my colleagues and special thanks to Mr. Schüler, Mr.
Stockhusen, Mr. Struss, Mr. Ruth, Mrs. Borbe and Mrs. Belda for the laboratory and
technical help.
I am also very thankful to all friends and persons who assisted me during the doctoral
work although not mentioned in this acknowledgement.
Finally it is my great wish to express my cordial and deep thanks to my parents for their
continuous and permanent love, support and care which was a great help to me during
the time of my study and research work.
Mont Kumpugdee
2002

The use of general descriptive names, registered names, trademarks, etc. in this
publication does not imply, even in the absence of a specific statement, that such
names are exempt from the relevant protective laws and regulations and therefore free
for general use.
Referees: Prof. Dr. Jobst B. Mielck
Prof. Dr. Hans-Ulrich Moritz
Date of oral presentation and disputation: 12.07.2002
Table of contents i
Table of contents i
List of abbreviations x
List of tables xiii
List of figures xvi
1. Introduction 1
1.1 Literature review 1
1.1.1 Coating techniques 1
1.1.2 Enteric coats 3
1.1.2.1 Enteric coating process differentiated by polymer formulations 4
1.1.2.1.1 Organic-based formulations 4
1.1.2.1.2 Ammonia-based formulations 5
1.1.2.1.3 Water-based formulations 6
1.1.2.2 Enteric coating process differentiated by the type of polymers 7
1.1.2.2.1 Non-cellulosic polymers 8
1.1.2.2.2 Cellulose derivatives 8
1.1.2.2.2.1 Cellulose acetate phthalate (CAP) 8
1.1.2.2.2.2 Hydroxypropyl methylcellulose acetate succinate (HPMCAS) 14
1.1.3 Some types of defects in enteric coated dosage forms 15
1.1.4 Interaction between a drug and enteric polymers 16
1.1.5 Coating formulations with different additives 17
1.1.6 Coating with non-ionic polymers 18
1.1.6.1 Hydroxypropyl methylcellulose (HPMC) 18
1.1.6.2 Ethyl cellulose (EC) 19
1.1.6.3 Polyvinyl alcohol (PVA) 20

ii Table of contents
1.2 Statement of the problem 22 2. Experimental part 24
2.1 Materials 24
2.1.1 Core materials: Sugar spheres 24
2.1.2 Neutral polymer: Hydroxypropyl methylcellulose (HPMC) 25
2.1.3 Neutral polymer: Sepifilm LP 010 26
2.1.4 Neutral polymer: Ethyl cellulose (EC) 27
2.1.5 Neutral polymer: Polyvinyl alcohol (PVA) 29
2.1.6 Enteric polymer: Cellulose acetate phthalate (CAP) 31
2.1.6.1 Aquateric CD-910 32
2.1.6.2 Aquacoat CPD-30 33
2.1.7 Enteric polymer: Hydroxypropyl methylcellulose acetate
succinate (HPMCAS) 34
2.1.8 Model indicator: Methyl orange (MO) 36
2.1.9 Model drug: Nicotinamide 37
2.1.10 Colour 38
2.1.10.1 Blue colour 38
2.1.10.2 Red colour 38
2.1.10.3 Orange colour 38
2.1.10.4 Green colour 38
2.1.11 Plasticizers 39
2.1.11.1 Polyethylene glycol (PEG) 39
2.1.11.2 Dibutyl sebacate (DBS) 40
2.1.11.3 Diethyl phthalate (DEP) 41
2.1.11.4 Triethyl citrate (TEC) 42
2.1.12 Additives 43
2.1.12.1 Magnesium stearate 43
2.1.12.2 Talc 43
2.1.12.3 Colloidal silicon dioxide 44
2.1.12.4 Polysorbate 80 45
2.1.12.5 Poloxamer 407 45

Table of contents iii
2.2 Analytical methods 46
2.2.1 Determination of thickness and morphology of pellets by scanning
electron microscope (SEM) 46
2.2.2 Determination of diameter of pellets 46
2.2.2.1 Calibration and validation 46
2.2.2.2 Measurement of diameters of pellets 47
2.2.3 Sieve analysis of pellets 47
2.2.4 Weighing of pellets 48
2.2.5 Determination of form and size of particles 48
2.2.5.1 Calibration 48
2.2.5.2 Measurement of form and size of particles 49
2.2.6 Determination of swelling 49
2.2.6.1 Calibration and validation 50
2.2.6.2 Measurement of swelling of pellets 50
2.2.7 Determination of colour change of methyl orange
of CAP coated pellets 51
2.2.8 Determination of the content of methyl orange in coated pellets 52
2.2.8.1 Calibration and validation 52
2.2.8.2 Measurement of content of methyl orange in one pellet 55
2.2.9 Calculation of phthalyl content in coated pellets 55
2.2.10 Determination of the content of nicotinamide in coated pellets 56
2.2.10.1 Calibration and validation 57
2.2.10.2 Measurement of content of nicotinamide in one pellet 60
2.2.11 Determination of salt formation by FTIR and NMR 60
2.2.11.1 FTIR-technique 61

iv Table of contents
2.2.11.2 NMR-technique 61
2.2.12 Postdrying (curing) studies of enteric coated pellets 61
2.2.13 Optical characterization of pellets after storage 62
2.2.14 Determination of water content by Karl-Fischer-Titration 64
2.2.14.1 Calibration and validation 64
2.2.14.2 Measurement of water content in pellets 65
2.2.15 Determination of free phthalic acid by HPLC 66
2.2.15.1 Calibration and validation 70
2.2.15.2 Measurement of free phthalic acid in coated pellets 71
2.2.16 Release studies 72
2.2.16.1 Calibration and validation 72
2.2.16.2 Release studies of coated pellets 73
2.2.17 Optical appearance after the release study 74
2.3 Coating apparatus 75 2.3.1 Coating apparatus (MP-1) with inserted filters 75
2.3.2 Coating apparatus (MP-1) in connection with a cyclone 79
2.3.3 Calibration 86
2.3.3.1 Calibration of thermocouples 86
2.3.3.2 Calibration of the Hygrolog hygrometer 86
2.3.4 Determination of spraying angles 87
2.3.5 Signals from the data recording device 89
2.3.5.1 Coating process by using Aeromatic MP-1 with inserted filters 89
2.3.5.2 Coating process by using Aeromatic MP-1 with a cyclone 91
2.4 Preparative methods 94
2.4.1 Preliminary Experiments 94
2.4.1.1 Coating of tablets 94
2.4.1.2 Coating of sugar spheres 98
2.4.1.2.1 Trials with HPMC 100
2.4.1.2.2 Trials with Sepifilm LP 010 101

Table of contents v
2.4.1.2.3 Trials with other additives 102
2.4.1.2.4 Trials with polyvinyl alcohol (PVA) 104
2.4.1.2.5 Trials with ethyl cellulose (EC) 104
2.4.1.2.6 Trials with a combination of EC and PVA ar two ratios 105
2.4.2 Determination of a moisture barrier property of films coated
on pellets 105
2.4.3 Preliminary studies of layering of nicotinamide onto pellets 108
2.4.4 Preparation of placebo 109
2.4.4.1 Preparation of HPMC solution 109
2.4.4.2 Coating process 109
2.4.5 Preparation of a product containing HPMC and methyl orange 113
2.4.5.1 Preparation of a solution containing HPMC and methyl orange 113
2.4.5.2 Coating process 113
2.4.6 Preparation of products containing nicotinamide with or without
a subcoat 114
2.4.6.1 The first layer: HPMC 115
2.4.6.2 The second layer: Nicotinamide-HPMC 115
2.4.6.2.1 Preparation of a solution containing nicotinamide 116
2.4.6.2.2 Coating process 116
2.4.6.3 The third layer: Different intermediate coats (subcoats) 116
2.4.6.3.1 Subcoat from HPMC 116
2.4.6.3.2 Subcoat from EC 117
2.4.6.3.2.1 Preparation of a dispersion containing Aquacoat ECD and DBS 117
2.4.6.3.2.2 Coating process 117
2.4.6.3.3 Subcoat from E&P 117
2.4.6.3.3.1 Preparation of a dispersion containing Aquacoat ECD and PVA 117
2.4.6.3.3.2 Coating process 118
2.4.6.3.4 Subcoat from P&E 118
2.4.6.3.4.1 Preparation of a dispersion containing PVA and Aquacoat ECD 118
2.4.6.3.4.2 Coating process 118
vi Table of contents
2.4.7 Preliminary studies of enteric coating with CAP and different
plasticizers 119
2.4.7.1 Enteric coating of pellets using Aquateric 119
2.4.7.2 Enteric coating of pellets using Aquacoat CPD-30 120
2.4.7.3 Enteric coating process of pellets containing nicotinamide 120
2.4.7.3.1 Discussion of preliminary studies of coating processes of pellets
with CAP and DEP 121
2.4.7.3.2 Discussion of preliminary studies of coating processes of pellets
with CAP and DBS 125
2.4.7.4 Enteric coating process of pellets containing methyl orange 126
2.4.7.4.1 Discussion of preliminary studies of coating processes of pellets
with CAP and TEC 127
2.4.8 Main part of studies 132
2.4.8.1 Enteric coating of pellets using Aquateric and DEP 132
2.4.8.2 Enteric coating of pellets using Aquateric and DBS 133
2.4.8.3 Enteric coating of pellets using Aquacoat CPD and DEP 134
2.4.8.4 Enteric coating of pellets using Aquacoat CPD, TEC and/or
additives 135
2.4.8.5 Enteric coating of pellets using Aquacoat CPD, TEC and
Aqoat-AS-MF 137
3. Results and discussion 149
3.1 Pellets with methyl orange 149
a) Placebo: HPMC pellets 149
b) Methyl orange loaded pellets: MO pellets 149
c) Enteric coated pellets: CAP-MO pellets 149
3.1.1 Film quality, diameter and weight of pellets 151
3.1.2 Colour change of methyl orange of coated pellets 154
3.1.3 Swelling 161
3.1.4 Content of methyl orange in pellets 162
3.1.5 Release of methyl orange from coated pellets 162
3.1.6 Optical appearance after the release study 168
Table of contents vii
3.1.7 Content of phthalyl in coated pellets 170
3.1.8 Hypothesis of salt formation between methyl orange and CAP 172
3.1.8.1 FTIR 173
3.1.8.2 NMR 178
3.2 Pellets with nicotinamide and HPMC as a subcoat 184
a) Placebo: HPMC pellets 184
b) Nicotinamide loaded pellets: Nico pellets 184
c) HPMC as subcoat: HPMC-Nico pellets 185
d) Enteric coated pellets: CAP-HPMC-Nico pellets 185
3.2.1 Film quality, diameter and weight of pellets 186
3.2.2 Sieving 194
3.2.3 Swelling 194
3.2.4 Content of nicotinamide in one pellet 197
3.2.5 Release of nicotinamide from coated pellets 197
3.2.6 Optical appearance after the release study 200
3.2.7 Postdrying (curing) of enteric coated pellets 203
3.2.8 Optical characterization of pellets after storage 206
3.2.9 Discussion of results of related coating experiments in the
literature 207
HPMC 207
CAP films from aqueous dispersions 209
Stability of products coated with CAP 213
3.2.10 Present conclusions 214
3.3 Pellets with nicotinamide and EC as a subcoat 215
a) Placebo: HPMC pellets 215
b) Nicotinamide loaded pellets: Nico pellets 215
c) EC as a subcoat: EC-Nico pellets 215
d) Enteric coated pellets: CAP-EC-Nico pellets 215
3.3.1 Film quality, diameter and weight of pellets 216
3.3.2 Swelling 222

viii Table of contents
3.3.3 Content of nicotinamide in one pellet 222
3.3.4 Release of nicotinamide from coated pellets 223
3.3.5 Optical appearance after the release study 224
3.3.6 Content of free phthalic acid in coated pellets 225
3.3.7 Discussion 231
3.4 Pellets with nicotinamide and a combination of EC and PVA (100 parts + 30 parts) as a subcoat 236
a) Placebo: HPMC pelllets 236
b) Nicotinamide loaded pelllets: Nico pellets 236
c) A combiantion of EC and PVA as a subcoat: E&P-Nico pellets 236
d) Enteric coated pellets: CAP-E&P-Nico pellets 236
3.4.1 Film quality, diameter and weight of pellets 236
3.4.2 Swelling 241
3.4.3 Content of nicotinamide in one pellet 242
3.4.4 Release of nicotinamide from coated pellets 243
3.4.5 Optical appearance after the release study 245
3.4.6 Discussion of results with similar systems and comparison with
present findings 248
3.5 Pellets with nicotinamide and a combination of PVA and EC (100 parts + 30 parts) as a subcoat 261
a) Placebo: HPMC pellets 261
b) Nicotinamide loaded pellets: Nico pellets 261
c) A combination of PVA and EC as a subcoat: P&E-Nico pellets 261
d) Enteric coated pellets: CAP-P&E-Nico pellets 261
3.5.1 Film quality, diameter and weight of pellets 261
3.5.2 Swelling 267
3.5.3 Content of nicotinamide in one pellet 267
3.5.4 Release of nicotinamide from coated pellets 268
3.5.5 Optical appearance after the release study 269
3.5.6 Optical characterization of pellets after storage 269

Table of contents ix
3.5.7 Discussion 273
3.6 Pellets with nicotinamide but without any subcoat 275
a) Placebo: HPMC pellets 275
b) Nicotinamide loaded pellets: Nico pellets 275
c) Enteric coated pellets: CAP-Nico pellets 275
3.6.1 Film quality, diameter and weight of pellets 275
3.6.2 Swelling 279
3.6.3 Content of nicotinamide in one pellet 280
3.6.4 Release of nicotinamide from coated pellets 280
3.6.5 Optical appearance after the release study 281
3.6.6 Discussion 282
4. Comparative discussion 283
5. Conclusion 288
6. References 290
7. List of instruments and software 306
8. Summary 311
9. Zusammenfassung 316
10. Curriculum vitae 322

x List of abbreviations
BP British Pharmacopoeia
µg Microgram
µm Micrometer
CAP Cellulose acetate phthalate
CAP-E&P-Nico pellets Pellets containing nicotinamide with a subcoat from a
combination from ethyl cellulose and polyvinyl alcohol (100+30) then coated with cellulose acetate phthalate
CAP-EC-Nico pellets Pellets containing nicotinamide with a subcoat from ethyl cellulose then coated with cellulose acetate phthalate
CAP-HPMC-Nico pellets Pellets containing nicotinamide with a subcoat from hydroxypropyl methylcellulose then coated with cellulose acetate phthalate
CAP-MO pellets Pellets containing methyl orange coated with cellulose acetate phthalate
CAP-Nico pellets Pellets containing nicotinamide coated with cellulose acetate phthalate
CAP-P&E-Nico pellets Pellets containing nicotinamide with a subcoat from a combination from polyvinyl alcohol and ethyl cellulose (100+30) then coated with cellulose acetate phthalate
CAT Cellulose acetate trimellitate
cP Centipoise (s)
DBS Dibutyl sebacate
DEP Diethyl phthalate
DSC Differential scanning calorimetry
et al. et alii
E&P A combination of ethyl cellulose and polyvinyl alcohol (100 parts + 30 parts)
E&P-Nico pellets Pellets containing nicotinamide coated with a subcoat from a combination of ethyl cellulose and polyvinyl alcohol (100 parts + 30 parts)
EC Ethyl cellulose

List of abbreviations xi
EC-Nico pellets Pellets containing nicotinamide coated with a subcoat from ethyl cellulose
EtOH Ethanol
FTIR Fourier transform infrared
g Gram
GMPs Good manufacturing practices
HCl Hydrochloric acid
HPLC High performance liquid chromatography
HPMC Hydroxypropyl methylcellulose
HPMCAS Hydroxypropyl methylcellulose acetate succinate
HPMC-Nico pellets Pellets containing nicotinamide coated with a subcoat from hydroxypropyl methylcellulose
HPMCP Hydroxypropyl methylcellulose acetate phthalate
KBr Calcium bromide
MeOH Methanol
MFFT Minimum film forming temperature (°C)
Mgst Magnesium stearate
min Minute (s)
ml Milliliter
mmH2O Millimeter water (1 mmH2O = 9.79 Pa)
mmole Millimole
MO Methyl orange
MP-1 Aeromatic MP-1, Fluidized bed apparatus
MW Molecular weight
Nico Nicotinamide
NMR Nuclear magnetic resonance
No. Number

xii List of abbreviations
P&E A combination of polyvinyl alcohol and ethyl cellulose
(100 parts + 30 parts)
P&E-Nico pellets Pellets containing nicotinamide coated with a subcoat from a combination of polyvinyl alcohol and ethyl cellulose (100 parts + 30 parts)
Pa Pascal
PEG Polyethylene glycol
Ph.Eur. European Pharmacopoeia
psi Pounds per square inch (1 psi = 6895 Pa)
PVA Polyvinyl alcohol
PVP Polyvinyl pyrrolidone
q.s. quantum satis
r.h. Relative humidity
r.t. Room temperature about 25 °C
rpm round per minute
SEM Scanning electron microscopy
Td Dew point (°C)
TEC Triethyl citrate
Tg Glass transition temperature (°C)
TiO2 Titanium dioxide
Tm Melting point
USA United State of America
USP The United State Pharmacopeia
UV Ultraviolet
vol Volume

List of tables xiii
1.1 Summarization of some publications reporting on the evaluation of various CAP products such as powder, free films, coated tablets, capsules and pellets 9
1.2 Summarization of some publications reporting on the chemical
stability of various CAP products such as powder, dispersion, free films and of coated tablets/capsules/pellets 9
1.3 Summarization of some publications reporting on the type of a
plasticizer used in CAP formulations 9 1.4 Summarization of some publications reporting on the type of coating
process used to coat product by using the CAP formulations 10 1.5 Summarization of some publications reporting on the type of coating
formulation prepared from CAP 10 2.1 Batches and properties of sugar spheres used as cores 24 2.2 Properties of three types of plasticizers 42 2.3 Validation data as diameter of the spherical balls with the purpose
of determination of diameters of pellets 47 2.4 Validation data as diameter of the spherical balls with the purpose
of determination of swelling of pellets 50 2.5 Postdrying conditions using a hot air oven and/or saturated salt 62 2.6 Storage conditions of coated pellets after Nyqvist for the optical
characterization 63 2.7 Conditions of HPLC in the preliminary trials 69 2.8 Pressure differences or absolute pressure (Pa) of air in different
positions of Aeromatic MP-1 with inserted filters, without pellets 83 2.9 Pressure differences or absolute pressure (Pa) of air in different
positions of Aeromatic MP-1 with inserted filters, loaded with 100 g of coated pellets 84
2.10 Pressure differences or absolute pressure (Pa) of air in different
positions of Aeromatic MP-1 with inserted filters or with cyclone 85 2.11 Coating conditions of different processes X1 to X6 96 2.12 Coating conditions of different processes X7 to X12 97 2.13 Percentage of water in the product after a period of storage under different conditions 107

xiv List of tables
2.14 Sieving analysis of HPMC-coated pellets compared to cores 111 2.15 Different coating formulations (R1-R7) 112 2.16 Composition and coating conditions of coating processes with
aqueous dispersions of CAP and DEP (PR1-PR5) 121 2.17 Composition and coating conditions of coating processes with
aqueous dispersions of CAP and DEP (PR6-PR10) 123 2.18 Composition and coating conditions of coating processes with
aqueous dispersions of CAP and DEP (PR11-PR14) 124 2.19 Composition and coating conditions of coating processes with
aqueous dispersions of CAP and DBS (PR15-PR18) 126 2.20 Composition and coating conditions of coating processes with
aqueous dispersions of CAP and TEC (PR19-PR24) 128 2.21 Composition and coating conditions of coating processes with
aqueous dispersions of CAP and TEC (PR25-PR30) 130 2.22 Different coating formulations (R8-R14) 140 2.23 Coating conditions of different processes X13 to X18 141 2.24 Coating conditions of different processes X19 to X23 142 2.25 Products with a thin layer of HPMC containing methyl orange
resulting from different combinations of a formulation and process conditions 143
2.26 Products with a subcoat from HPMC resulting from different
combinations of a formulation and process conditions 144 2.27 Products with a subcoat from ethyl cellulose resulting from different
combinations of a formulation and process conditions 145 2.28 Products with a subcoat from a combination of ethyl cellulose and
Mowiol 4-98 resulting from different combinations of a formulation and process conditions 146 2.29 Products with a subcoat from a combination of Mowiol 4-98 and
ethyl cellulose resulting from different combinations of a formulation and process conditions 147 2.30 Products without subcoat resulting from different combinations of a
formulation and process conditions 148

List of tables xv
3.1 Properties of different products showing weight gain of total batch, thickness of the layer, weight of pellet, diameter of pellet, coating amount, release within the first five minutes 156 3.2 Swelling property of different products in 0.1 N HCl, 22 °C 161 3.3 Phthalyl content in one pellet of different products containing methyl
orange (MO) and the ratio between the phthalyl content and methyl orange 171
3.4 Properties of different products showing weight gain of total batch, thickness of the layer, weight of pellet, diameter of pellet, coating amount, release within the first five minutes 189 3.5 Sieve analysis of different products (Product SS-NN) 194 3.6 Swelling property of different products in 0.1 N HCl, 22 °C 195 3.7 The highest humidity at each temperature that still allowed the
placebo pellets (Product P) and the enteric coated pellets and a HPMC as a subcoat (Product EE) to flow after 30 days of storage 206
3.8 Properties of different products showing weight gain of total batch, thickness of the layer, weight of pellet, diameter of pellet, coating amount, release within the first five minutes 218 3.9 Swelling property of different products in 0.1 N HCl, 22 °C 222 3.10 Properties of different products showing weight gain of total batch, thickness of the layer, weight of pellet, diameter of pellet, coating amount, release within the first five minutes 238 3.11 Swelling property of different products in 0.1 N HCl, 22 °C 242 3.12 Properties of different products showing weight gain of total batch, thickness of the layer, weight of pellet, diameter of pellet, coating amount, release within the first five minutes 263 3.13 Swelling property of different products in 0.1 N HCl, 22 °C 267 3.14 The highest humidity at each temperature that still allowed the
enteric coated pellets and a combination of PVA and EC (100 + 30 parts) as subcoat (Product cc) to flow after 30 days of storage 269
3.15 Properties of different products showing weight gain of total batch, thickness of the layer, weight of pellet, diameter of pellet, coating amount, release within the first five minutes 276 3.16 Swelling property of different products in 0.1 N HCl, 22 °C 280
xvi List of figures
2.1 Structural formula of HPMC 25 2.2 Structural formula of EC 27 2.3 Structural formula of PVA 29 2.4 Structural formula of CAP 31 2.5 Structural formula of HPMCAS 34 2.6 Colour changing of methyl orange in acidic or basidic medium 36 2.7 Structural formula of nicotinamide 37 2.8 Structural formula of DBS 40 2.9 Structural formula of DEP 41 2.10 Structural formula of TEC 42 2.11 UV-spectrum of methyl orange (0.4871 mg/100 ml) in 0.1 N HCl 53 2.12 Residual plot of 45 values of the calibration curve of methyl orange in 0.1 N HCl, using UV-method 54 2.13 UV-spectrum of nicotinamide (1.8702 mg/100 ml) in buffer pH 6.8 57 2.14 Residual plot of 48 values of the calibration curve of nicotinamide in 0.1 N HCl, using UV-method 59 2.15 Residual plot of 48 values of the calibration curve of nicotinamide in buffer pH 6.8, using UV-method 59 2.16 Residual plot of 15 values of the calibration curve of the standard substance, using Karl-Fischer titration 65 2.17 UV-spectrum of phthalic acid (5.96 mg/100 ml) in a mixture of MeOH and water (50+50 ml) 67 2.18 UV-spectrum of a standard mixture of phthalic acid (4.864 mg/100 ml) and nicotinamide (0.752 mg/100 ml) in a mixture of MeOH and water (50+50 ml) 67 2.19 HPLC chromatogram of a standard mixture containing nicotinamide (2.15 mg/100 ml) and phthalic acid (1.92 mg/100 ml) at a flow rate of 0.8 ml/min and a mixture of 0.025 M phosphate buffer and MeOH (80+20 ml) as an eluent 68
2.20 Residual plot of 72 values of the calibration curve of the solution of phthalic acid in water, using HPLC-method 71

List of figures xvii
2.21 A Wurster-based fluidized-bed apparatus (Aeromatic MP-1, Powder Coater) with a cyclone for the coating of pellets 82 2.22 Setting of the spraying unit and the receiver of the atomizing liquid
for the determination of the spraying angle outside the coating apparatus 89
2.23 Aeromatic MP-1 with inserted filters, process X18, for the production
of Product hH 92 2.24 Aeromatic MP-1 with a cyclone, process X21, for the production
of Product oO 93 2.25 Two types of fluidized beds; a) incipiently bed, b) bubbling bed 99 2.26 HPMC-coated pellet (Product P) shows bubbles in the HPMC film
layer 101 2.27 Microscopic picture of talc dispersed in glycerol 85 % 103 2.28 SEM-micrograph of nicotinamide recrystallized on the surface of
HPMC-coated pellet 108 2.29 Finished enteric coated pellets with a layer containing dissolved
methyl orange 114 2.30 Finished enteric coated pellets with different subcoats 115 2.31 Microscopic picture of an aqueous enteric dispersion of Aquacaot CPD, TEC and Aqoat-AS-MF 138 3.1 SEM pictures of coated pellets; a) the top view of a pellet coated with CAP, TEC (Product K), magnification 110x; b) the cross-section of a
pellet coated with CAP and TEC (Product B to L), magnification 1,000x 157
3.2 SEM pictures of coated pellets; a) the cross-section of a CAP and
TEC layer (Product B to L), magnification 20,000x; b) the surface of a pellet coated with CAP, TEC (Product B to L), magnification 1,600x 158
3.3 SEM pictures of coated pellets; a) the cross-section of a pellet coated
with CAP, TEC and Mgst (Product M),magnification 3,500x; b) the surface of a pellet coated with CAP, TEC and Mgst (Product M) or CAP, TEC, Mgst and EC (Product N), magnification 1,000x 159
3.4 Colour changing of a pellets coated with CAP and TEC (Product K) with a primary thin coat of HPMC containing methyl orange in 0.1 N HCl at 22 °C; a) pellet at the start; b) pellet after 10 min 160

xviii List of figures
3.5 Dissolution profiles of differently coated pellets containing methyl orange in 0.1 N HCl at 37 °C without (Product A) and with enteric coats containing TEC as a plasticizer (Product B to N) 164 3.6 Optical appearance of CAP coated pellets containing methyl orange (Procduct K); a) before and; b) after exposure to 0.1 N HCl, 37°C for 30 min 169 3.7 A scheme shows a possible salt formation between nitrogen atom of methyl orange and oxygen atom of phthalyl group of CAP 172 3.8 FTIR spectra of four samples; a) methyl orange (MO) powder in KBr;
b) MO-protonated by dispersing powder in 1 N HCl and subsequent drying at r.t., in KBr; c) film from CAP and TEC in dichloromethane on NaCl disc; d) dried mixture from CAP, TEC and MO in KBr 175
3.9 FTIR spectra of substances; a) methyl orange (MO) powder in KBr;
b) MO-protonated by dispersing powder in 1 N HCl and subsequent drying at r.t., in KBr 176
3.10 FTIR spectra of four samples; a) methyl orange (MO) powder in KBr;
b) MO-protonated by dispersing powder in 1 N HCl and subsequent drying at r.t., in KBr; c) film from CAP and TEC in dichloromethane on NaCl disc; d) dried mixture from CAP, TEC and MO in KBr 177
3.11 1H-NMR spectrum of methyl orange (MO) yellow coloured powder in
DMSO 180 3.12 1H-NMR spectrum of MO-protonated by dispersing powder in 1 N HCl and subsequent drying at r.t., red coloured powder in DMSO 181 3.13 1H-NMR spectrum of film from CAP and TEC in DMSO 182 3.14 1H-NMR spectrum of a dried mixture from CAP, TEC and MO in DMSO 183 3.15 SEM pictures of coated pellets; a) the cross-section of a HPMC-Nico pellet (Product BB), magnification 680x; b) the surface of a pellet coated with CAP and DEP (Product EE), magnification 1,570x 190 3.16 SEM pictures of enteric coated pellets; a) the top view of a pellet coated with CAP and DEP (Product EE), magnification 65x; b) the top view of a pellet coated with CAP and DBS (Product GG), magnification 49x 191 3.17 SEM pictures of coated pellets; a) the cross-section of a pellet coated with CAP and DBS (Product GG), magnification 740x; b) the cross-section of a pellet coated with CAP and TEC (Product NN), magnification 1,400x 192

List of figures xix
3.18 SEM pictures of pellets coated with CAP and TEC (Product NN); a) the surface of a pellets, magnification 10,050x; b) the top view of a pellet, magnification 109x 193 3.19 Dissolution profiles of differently coated pellets containing nicotinamide in 0.1 N HCl at 37 °C without (Product DD) and with enteric coats containing different plasticizers (Product EE to NN) 198 3.20 Optical appearance of CAP-coated pellets containing nicotinamide and HPMC as a subcoat (Procduct EE) after exposure to 0.1 N HCl, at 37°C for 30 min 201 3.21 Optical appearance of CAP-coated pellets containing nicotinamide
and HPMC as a subcoat (Procduct NN); a) before and; b) after exposure to 0.1 N HCl, at 37°C for 30 min 202 3.22 SEM pictures of enteric coated pellets; a) the cross-section of a pellet coated with CAP and TEC (Product Jj), magnification 607x; b) the surface of a pellet coated with CAP and DEP (Product Ff or Gg), magnification 1,540x 219 3.23 SEM pictures of enteric coated pellets; a) the cross-section of a pellet coated with CAP and DBS (Product Hh), magnification 400x; b) the cross-section of a pellet coated with CAP and TEC (Product Jj), magnification 101x 220 3.24 SEM pictures of enteric coated pellets with CAP and TEC; a) the cross-section of a pellet (Product Jj), magnification 1,700x; b) the surface of a CAP-EC-Nico pellet (Product Jj or Kk), magnification 10,100x 221 3.25 Dissolution profiles of differently coated pellets containing nicotinamide in 0.1 N HCl at 37 °C without (Product Cc and Ee) and
with enteric coats containing different plasticizers (Product Ff to Jj) and Product Ee as cores 224
3.26 Pellets coated with a subcoat from EC (Product Ee) after exposure to different media at 37 °C, for 120 min; a) 0.1 N HCl; b) phosphate buffer pH 6.8 228 3.27 Enteric coated pellets with CAP and DEP (Product Ff) after exposure to different media at 37 °C; a) 0.1 N HCl for 30 min;
b) phosphate buffer pH 6.8 for 120 min 229 3.28 Coated pellets after exposure to different media at 37 °C for 120 min; a) pellets coated with a subcoat from EC (Product Cc) after exposure to phosphate buffer pH 6.8; b) enteric coated pellets with CAP and TEC (Product Kk), still wet after exposure to 0.1 N HCl 230

xx List of figures
3.29 SEM pictures of coated pellets; a) the cross-section of E&P-Nico pellet (Product cC), magnification 809x; b) the cross-section of a coated pellet with CAP and TEC (Product nN), magnification 640x 239 3.30 SEM pictures of enteric coated pellets; a) the surface of a coated pellet with CAP and TEC (Product gG to nN), magnification 1,600x; b) the surface of a coated pellet with CAP, HPMC-AS and TEC (Product oO), magnification 1,640x 240 3.31 SEM picture of the cross-section of an enteric coated pellet with
CAP, HPMC-AS and TEC (Product oO), magnification 168x 241 3.32 Dissolution profiles of differently coated pellets containing nicotinamide in 0.1 N HCl at 37 °C without (Product bB and cC) and
with enteric coats containing different plasticizers (Product dD to mM) and Product cC as cores 244
3.33 Coated pellets with a subcoat from EC and PVA (Product cC) after exposure to different media at 37 °C for 120 min; a) 0.1 N HCl; b) phosphate buffer pH 6.8 246 3.34 Enteric coated pellets after exposure to 0.1 N HCl, 37 °C for 30 min;
a) Pellets coated with CAP and DEP (Product dD); b) Pellets coated with CAP and TEC (Product nN) 247
3.35 SEM pictures of coated pellets; a) the cross-section of a pellet
coated with a subcoat from PVA and EC (100 + 30 parts) (Product bb), magnification 600x; b) the cross-section of an enteric coated pellet with CAP and DBS (Product ee), magnification 430x 264
3.36 SEM pictures of enteric coated pellets with CAP and DEP
(Product cc); a) the cross-section of a coated pellet, magnification 2010x; b) top view of a coated pellet, magnification 67x 265
3.37 SEM pictures of enteric coated pellets with CAP and TEC
(Product jj); a) the cross-section of a coated pellet, magnification 725x; b) top view of a coated pellet, magnification 117x 266
3.38 Dissolution profiles of differently coated pellets containing nicotinamide in 0.1 N HCl at 37 °C without (Product bb) and with
increasing thicknesses of enteric coats in mg cm –2 (Product ff to jj) and Product bb as cores 268
3.39 Enteric coated pellets with CAP and DEP (Product cc) after exposure to different media at 37 °C, for 30 min; a) 0.1 N HCl; b) phosphate buffer pH 6.8 271 3.40 Enteric coated pellets with CAP and TEC (Product jj); a) before and;
b) after exposure to 0.1 N HCl, 37 °C, for 30 min 272

List of figures xxi
3.41 SEM pictures of enteric coated pellets; a) the cross-section of a pellet coated with CAP abd DEP (Product kk), magnification 560x; b) the cross-section of a pellet coated with CAP and DBS (Product mm), magnification 350x 277
3.42 SEM pictures of enteric coated pellets; a) the top view of a pellet
coated with CAP abd DBS (Product mm), magnification 64x; b) the cross-section of a pellet coated with CAP and TEC (Product oo), magnification 1060x 278
3.43 A SEM picture of the surface of a pellet coated with CAP and TEC
(Product oo), magnification 5,000x 279 3.44 Dissolution profiles of differently coated pellets containing nicotinamide in 0.1 N HCl at 37 °C without subcoat but with enteric
coats containg different plasticizers (Product kk to oo) and Product aA as cores 281
3.45 Optical appearance of pellets coated with CAP and TEC
(Procduct oo) after exposure to 0.1 N HCl, 37°C, for 30 min 282


Introduction 1
1. Introduction
The coating is an important process in the pharmaceutical industry. This technique has
many benefits which include: improving esthetic qualities of the product, masking of
unpleasant taste and odor, enabling the product to be easily swallowed by the patient,
facilitating handling, improving product stability and modifying drug-release
characteristics. In former times the coating processes were a kind of art which were
hence developed to the compliance with good manufacturing practices (GMPs). The
design of new equipment as well as the development of new coating materials have
contributed to improve the products to today‘s standard <143,12>.
1.1 Literature review 1.1.1 Coating techniques
The differentiation of coating techniques is variable. Some experts classified the coating
into three techniques. They are pan coating, top-spray fluid-bed coating and Wurster-
based fluid-bed coating <206>. Other experts divided the coating by differentiating the
spraying techniques. There are three techniques which can be used, i.e. the top-
spraying using a conventional fluid-bed granulator, the bottom-spraying using a Wurster
column and the tangential spraying using a rotor granulator. However, if all possible
coating techniques are considered there will be five coating methods i.e. the fluidized-
bed coating, the pan coating, the compression coating, the melting coating and the
encapsulation <150>.
Fluidzed-bed technology has been widely used for drying, granulating and coating of
pharmaceutical products. Due to its highly efficient drying capacity this technique seems
to be ideal for coating beads and particles which tend to agglomerate in a wet condition.
It was reported that the coatings can be reproducibly performed by this technique with
minimal defects of products. Therefore this technique was preferred for many
formulations. The overview of the fluidized bed coating system was reported <150>.
Typical components of a fluid-bed processing system are an air conditioning unit, a
ventilator, a product container, exhaust filters, a spray nozzle, a solution delivery unit,
and a control panel. Nevertheless, fluidized-bed coating is a complicated process. Many

2 Introduction parameters will affect film formation, and are highly dependent on the characteristics of
a given polymer. Therefore, it is necessary to investigate the processing conditions
during product development. Because of the possibility to vary the coating parameters a
special control of these parameters with a calibration is necessary. The combination of
parameters should be carefully selected in order to optimize the process, as many
factors can affect the fluidized bed process <65>.
The fundamental principle behind fluidized-bed coating in general and the Wurster-
technique in particular is to suspend materials in an upward-moving column of warm air
during the coating process. In summary the coating process consists of three phases:
the start-up phase, the coating phase, and the drying/cooling phase. During the start-up
phase, the heat supplied by the process air is used to heat the apparatus and the
starting material, which is already in the fluidized state, to the desired temperature.
During the coating phase, several processes take place simultaneously. These are:
atomization of the film solution/suspension, transport of the film droplets to the
substrate/core, adhesion of the droplets to the substrate, film formation, drying of film (at
least partially) and the repetition of this cycle of the substrate. The final drying/cooling
phase takes place without further spraying and is nescessary for the development of the
desired properties of the whole film.
The Wurster fluidized bed technique is different from the conventional technique. The
basic Wurster fluidized-bed coating apparatus consists of four parts. The first part is a
coating chamber which is essentially cylindrical in its shape with the axis of the cylinder
in the vertical plane. The second part is the inner partition which is called the Wurster
column. The coating step is performed only inside the Wurster column. The third part is
the air-distribution plate which is designed to help loading the material such as particles,
beads, or tablets to enter the coating zone. The forth part is the spray nozzle which is
located at the center of the air-distribution plate. During a normal operation the fluidizing
air rapidly accelerates the particles or tablets up through the inner partition, where the
coating takes place. The coated particles or tablets leave the cylinder upward and
deceleration occurs in the region of the expansion chamber causing the product to drop
back into the coating chamber in the region confined by the walls of the chamber and
the Wurster column. The product moves down to the bottom of the coating chamber
where the cycle begins again. The Wurster-based coating process is therefore very
different from the top-spray coating process and optimization should be performed from
a completely different angle of view <36,206>.

Introduction 3
The fluidized-bed technology has also disadvantages in the way that it gives a porous
product in comparison with a coating process in a coating pan or other equipment. The
high air velocity will cause a fast drying process which sometimes can be too fast so
that the polymer particles cannot fuse together to bring about a homogeneous film layer.
Moreover, this high air velocity will cause a spray-drying effect which causes a high
amount of fine dust. Most of it are polymer particles and only a small portion will be core
component. Cores layered with drug with low binding force at the surface of the core will
cause high friability. This causes a loss of drug content. The other disadvantage is the
possibilty of a dust explosion, whenever combustible powders in fine particle size are
present in large volumes of air or oxygen. To avoid an explosion, the process air has to
be exchanged by an inert gas. However, such a process is only economic by
recirculation of the inert gases in a closed system. The use of such a system allows also
the control of both the temperature and the humidity of the circulating gas. When
discussing the coating process it is important to consider properties of the core e.g. the
density and the diameter <36>.
Mehta, Valazza and Abele <98> reported about the effect of three techniques of fluid-
bed coating (top-spraying, bottom-spraying or tangential-spraying) on the morphology of
applied films and on drug release rates. They found that both caffeine pellets and
aspirin granules can be successfully coated with an aqueous enteric coating system
using any of the three fluid-bed processing methods.
1.1.2 Enteric coats
An enteric coat resists disintegration or dissolution in acidic gastric media but
disintegrates or dissolves in intestinal fluids <143>. The definitions and the
requirements in different Pharmacopoeia were different which has been discussed by
Heckenmüller <69>.
One of the main reasons for using an enteric coat is to protect the stomach wall from
the effect of the drug contents in a dosage form. Another main reason is to protect the
drug contents in a dosage form from the harmful effect of gastric contents. Enteric coat
can also be used to deliver the active ingredients to a particular region of the intestine
such as the upper part of the small intestine or they can be incorporated into a tablet
formulation for a direct compression process to form sustained release tablets or in a

4 Introduction wet granulation process to form particulates or beads which exhibit controlled-release
characteristics in the gastrointestinal tract <143>.
Many factors can influence the preparation of enteric coated dosage forms e.g. the
properties of the substrate such as the nature of drugs, additives or core. The properties
of the polymer such as molecular weight, pH-dependent solubility, the pKa value, the
total free carboxylic acid content or the degree of substitution of the polymer can also
affect the preparation. The ionic strength of the dissolution fluid, the thickness of the
coat, the permeability to gastric fluid and the presence or absence of plasticizers, other
non-enteric components in the coat and defects can influence the dissolution of enteric
coats <150,51>.
1.1.2.1 Enteric coating process differentiated by polymer formulations
The alcoholic enteric coating formulation was since long used in the pharmaceutical
fields. The coating process using organic solvents was reported to have an advantage
so far as it takes a shorter processing time because of the low heat of vaporization
characteristic of the solvents. However, in the late 1960s, a drastic increase in the price
of organic solvents and new strict limitations on the exposure of workers to toxic
chemicals and on the discharge of such substances into the atmosphere created a re-
newed interest in the use of water as a solvent and vehicle for the coating process.
Initially, aqueous systems were viewed with skepticism because of their lengthy
processing times and because the appearance of products coated with aqueous films
was inferior to that one of products coated using organic systems <65>.
1.1.2.1.1 Organic-based formulations
The mechanism of film formation from organic solution is completely different from the
formation of film from a dispersion. When polymers are in solution they can exist as
extended long chains or coils in the solvent depending on temperatures and shear.
Chain extensions and partial immobilization of the solvated molecules make the solution
highly viscous, even at low concentrations. At the beginning of the coating process the
initial rapid evaporation of solvent from the atomized droplets of coating liquid occured
and caused an increase in polymer concentration and contraction in volume of the
droplets. After that there was a further loss of solvent from the film at a slower rate

Introduction 5
which is now controlled by the rate of diffusion of solvent through the polymer matrix.
The following step was the immobilization of the polymer molecules at the solidification
point. This process created shrinkage stresses that contributed to the internal stress
within the coating and it will be related to some of the mechanical properties of the
coated dosage form. The last step was the further gradual solvent loss from the film at a
very much reduced rate. It was mentioned that the solvent loss from the film coat will be
continuous but at an ever-decreasing rate. Solvent loss from the polymer matrix is
governed by the amount of space between the polymer molecules which usually termed
the free volume. As solvent loss progressed the glass transition temperature (Tg) of the
polymer film increased and the free volume decreased. Ultimately, the free volume
became so small that further removal of solvent from the coating became almost
impossible. Indeed, total solvent removal requires the heating of films to a temperature
significantly above the Tg of the solvent-free polymer. Since the Tg of some polymers
such as HPMCP, CAP was very high (more than 150 °C), it was difficult to produce
solvent-free film coating from these polymers.
Many factors can influence the quality of the finished coated product. For example: the
interaction between the core material and the applied coat, the drying process and the
uniformity of distribution of the coating material <143,65>.
In order to reduce the Tg of the pure polymer additives for example a plasticizer have
been used. Some examples of such organic enteric formulations were discussed in this
respect. Lovgren, et al. <91> have reported the use of an enteric organic coating
formulation containing HPMCP and cetyl alcohol. They used this mixture for enteric
coating of pellets containing omeprazole and alkaline compound. Cores, however, were
first coated with a subcoat containing PVP and ethanol before the finishing enteric
coating was performed. Chopra <35> used an aqueous ammonium alcoholic
suspension consisting of CAP and TEC for coating of tablets. The coated tablets
developed a rupture in the coat if they were in a simulated gastric fluid more than 60
min or in simulated intestinal fluid for 12 min.
1.1.2.1.2 Ammonia-based formulations
The ammonia-based formulations have been formulated to replace the organic based
coating systems due to the safety, toxicity and environmental concerns. For example;
Gordon, et al. <64> studied the possibilty of different aqueous polymeric dispersion for

6 Introduction producing an enteric coated tablet. They manufactured the CAP aqueous dispersion by
mixing two dispersions together. The first dispersion was prepared by dispersing CAP
powder in water and then adding strong ammonia solution. The second dispersion was
prepared by dispersing diethyl phthalate and polyvinyl alcohol in water. The naproxen
sodium tablets cores were coated using a coating pan. The coated tablets
demonstrated excellent physical resistance to acid medium with 0 % drug dissolved
after 2 h. The tablets were also stored for 9 months at room temperature. Now these
tablets bloated after 2 h in a gastric fluid. The dissolution test of aged tablets coated
with CAP by using this ammonia-based formulation did not maintain their integrity in 0.1
N HCl medium. More studies concerning the ammonia-based formulations are
mentioned in part 1.1.2.2.2.1.
1.1.2.1.3 Water-based formulations
The use of organic solvents in the coating of pharmaceutical dosage forms has become
problematic due to regulatory requirements, flammability and limits on solvent residues
in the coated product. The alternative aqueous coating systems can overcome these
problems but suffer from certain limitations. The aqueous systems are susceptible to
microbial contamination when preservatives were not added. The long processing time
is caused by the higher energy of evaporation of water. Moisture-sensitive cores e.g.
dry extracts, enzymes or substances prone to hydrolysis, can be damaged by the
coating process. In addition, substances readily soluble in water can be incorporated
into the film and problems of long-term stability can arise due to the inclusion of water. It
is important to avoid sedimentation or coagulation of the film-former when dispersions
are used. The incomplete film formation is the important problem. One of the factors
that causes incomplete coalescence is the evaporation of the plasticizer <185>.
There are two aqueous based systems that are used in the pharmaceutical fileds i.e.
latex systems and the redispersed polymer. The latex systems have been used for
coating for several years. The dried powder resulted by removing water from the
aqueous polymeric dispersion. This dried powder can be redispersed again before use
as an aqueous dispersion <65>.
In an aqueous dispersion system the polymer is dispersed as small particles rather than
fully-entangled chains as it is in the solution. The mechanism of film formation of this
system is different from the organic solution system. For example; the first step of the

Introduction 7
mechanism of film formation from aqueous dispersions is the rapid evaporation of the
aqueous medium, which brings the particles of dispersed polymer into close contact
with one another. Then the individual polymer particles must be deformed and coalesce
into a clear continuous film. The driving force for fusion comes from the capillary forces
caused by high interfacial tension between water and the polymer and between water
and air as water evaporates. Electrostatic charges must also be present but the
capillary forces are the main force for overcoming the electrostatic repulsion. This more
complex mechanism of film formation may lead to the differences in functional
performance of aqueous based films compared to organic based films <10,65>.
This process of film formation is very sensitive to process conditions used during film
coating. The coalescence of the latex particles will be very dependent on the free
volume which influences the movement of polymer molecules between individual latex
particles. Consequently, aqueous polymeric dispersions must be processed at
temperatures in excess of the Tg of the polymer or plasticized polymer. However,
incomplete coalescence occured even at temperatures in excess of 20 °C above the Tg.
Thus the optimum processing conditions for aqueous polymeric dispersions occur over
a narrow range of temperatures <10,65>.
1.1.2.2 Enteric coating process differentiated by the type of polymers
The variation in pH that occurs, as an oral administered drug delivery system moves
down the gastrointestinal tract has been very widely used as the trigger to cause the
release of drug from enteric-coated drug delivery system. Polymers such as modified
cellulosic polymers and synthetic acrylic polymers are commonly known as enteric
coating polymers. These polymers contain ionizable carboxylic groups. In the low pH
stomach environment the carboxylic groups remain un-ionized so that the polymeric
coat remains insoluble but disintegrates or dissolves at the higher pH of the intestinal
environment to allow the release of drug contents <12>.
The enteric coating polymers are divided into two groups i.e non-cellulosic and
cellulosic polymers as listed below <12>.

8 Introduction 1.1.2.2.1 Non-cellulosic polymers
a) Methacrylic acid polymers
b) Polyvinylacetate phthalate, PVAP
c) Shellac
The non cellulosic polymer such as methacrylic acid polymers were investigated by
many researchers. Eudragit L-30 D was widely used as aqueous dispersion for coating
of products e.g. theophylline particles <5>, theophylline pellets <62>, caffeine tablets
<19>. Dietrich and Ney <48, 49> have reported about the use of a dispersion of
Eudragit L-30D and TEC for coating of pantoprazole and of omeprazole tablets.
1.1.2.2.2 Cellulose derivatives
a) Cellulose acetate phthalate, CAP
b) Hydroxypropylmethylcellulose acetate succinate, HPMC-AS
c) Cellulose acetae trimellitate, CAT
d) Hydroxypropylmethylcellulose phthalate, HPMCP
The cellulosic polymers <12> were used by many researchers but in the present work
only two types of cellulosic polymers, i.e. CAP and HPMC-AS were used. Therefore
their details are discussed in comparison with other enteric polymers.
1.1.2.2.2.1 Cellulose acetate phthalate (CAP)
The Table 1.1 to 1.5 summarized the research works concerned with CAP polymer. The
evaluation of CAP powder, the free films of CAP from different media, the CAP coated
tablets, capsules and pellets can be found in many reports mentioned in Table 1.1. The
chemical stability of different CAP products such as powder, dispersion, free films, and
of coated tablets/capsules and pellets was studied by many researchers as
demonstrated in Table 1.2. Different types of plasticizers (Table 1.3) and the different
coating techniques (Table 1.4) have been studied with CAP. Three types of coating
formulations with CAP based on organic solvent, ammonia and water as dispersion
medium were used (Table 1.5).

Introduction 9
Evaluation of CAP products No. of literature powder 42,155,161,204
free films organic solvent-based 147,148,70,177,176,178,83,161,145,191
ammonia-based 14,70
water-based 147,164,117
coated tablets/capsules 144,164,186,18,34,131,170,65,82,130,70,64
coated pellets 200,31
Table 1.1: Summarization of some publications reporting on the evaluation of various
CAP products such as powder, free films (prepared from organic solvent-
based, ammonia-based or water-based system), coated tablets, capsules
and pellets.
Chemical stability of CAP products No. of literature powder 155
dispersion 20,41
free films 191,43
coated tablets/capsules 185,82,190,188,189,187,170,65,130,186,34
coated pellets 185
Table 1.2: Summarization of some publications reporting on the chemical stability of
various CAP products such as powder, dispersion, free films, and of
coated tablets/capsules/pellets.
Type of a plasticizer used with CAP No. of literature Triethyl citrate (TEC) 185,117,14,41,186,83
Diethyl phthalate (DEP) 200,31,65,117,130,147,83,148,144,41,64,34,
131
Triacetin or other plasticizers 147,148,70,41,18
Table 1.3: Summarization of some publications reporting on the type of a plasticizer
used in CAP formulations.
10 Introduction Type of coating process with CAP No. of literature fluidized-bed 200,130,70,34,131
pan coating or other techniques 115,14,64,82,144,65
Table 1.4: Summarization of some publications reporting on the type of coating
process used to coat product by using the CAP formulations.
Coating formulation with CAP No. of literature organic-based 130,14,65,31,82,70,144
ammonium-based 31,64,130,70
aqueous-based 164,131,65,31,18,34
Table 1.5: Summarization of some publications reporting on the type of coating
formulation prepared from CAP. Evaluation of CAP products
Bauer, Lehmann and Osterwald <12> reported that the glass transition temperature
(Tg) of CAP was about 100 °C. Roxin, Karlsson and Singh <155> have studied Tg of
CAP powder by using DSC. They found that the Tg of fresh CAP powders was in the
range of 172 - 174 °C, whilst the Tg of CAP after storage under climatic stress (40 °C,
89 % r.h.) was in the range of 155 – 175 °C. Karlsson and Singh <83> have also
determined the Tg of free films prepared from CAP in acetone by using thermal
mechanical analysis. They found that the Tg was in the range of 151-167 °C which may
be due to residual solvent content in the film. Since it was reported that the Tg of pure
CAP was very high, the addition of a suitable plasticizer was nescessary to reduce the
Tg to a temperature at which a coating process can be performed.
As reported by FMC <7>, plasticizers suitable for Aquacoat CPD were diethyl phthalate,
triethyl citrate and triacetin at the amount of 20 to 24 % of the latex solids. The Tg of
Aquacoat CPD could be reduced to 34 °C by a content of 25 % DEP. Higher amounts of
DEP did not further reduce the Tg. With TEC as a plasticizer, however, 10 % and 30 %
TEC to latex solids resulted in Tg of 38 °C and 32 °C, respectively.

Introduction 11
Studies on the application of CAP polymer on coated enteric formulations with various
active compounds have been reported <65,121>. Applications from organic solvent
systems were used before and the use of aqueous dispersion of CAP were recently
described <186>. Schmidt and Teuber <170> have critically discussed the problems of
enteric dosage forms. They studied the differences between coating polymers such as
HPMCP, PVAP, Eudragit L. They also mentioned that the type of the incorporated drug
had an important affect on the stability of the CAP film coated products. For example;
the CAP coated product contained sodium sulfathiazol. An ionic exchange happened
between the protons of the acid groups of CAP and the sodium ions at the nitrogen
atom of amide group of the drug. They used cobalt chloride as a model indicator for the
determination of water diffusion through different polymer films, e.g. Eudragit L 100-55,
Eudragit L 30 D and HPMCP coated onto pellets. The colour changed from blue to pink
because the complex of cobalt-(II)-hexahydrate was formed. The coating amount on the
pellets was about 4.2 mg/cm2. The maximum time until the colour changed to pink was
12.5 min. They also studied the resistance against artificial gastric fluid (0.1 N HCl) by
using methyl orange as an indicator. The results of aqueous dispersions of different
polymers were also discussed. The worst result was shown by bisacodyl pellets coated
with aqueous dispersion of polyvinyl acetate phthalate. Almost 90 % of bisacodyl were
released from these pellets after one hour in 0.1 N HCl. The SEM pictures showed the
lack of coalescence in the structure of films prepared from aqueous dispersion of
HPMCP or carboxymethyl ethylcellulose. The film layers contained pores and canals.
Films from an organic solution of Eudragit L showed very smooth structures without
pores. Only the aqueous system from Eudragit L 30 D brings the result of the enteric
coated pellets which resisted to 0.1 N HCl.
Obara and McGinity <116,117> studied the effect of processing conditions on the
properties of free films prepared from polymers by the spray method. They reported that
whilst the casting of CAP dispersion resulted in transparent films, poor film formation
was observed with the spray method.
Chang <31> reported a non-enteric performance of CAP-coated theophylline beads
prepared from Aquateric by a fluidized-bed process. The authors proposed that either
the Pluronic F-68, a surfactant, in Aquateric may have had an adverse effect or the
polymer was sensitive to the formulation variables, coating process and active
substances.

12 Introduction Williams III and Liu <200> have studied the influence of fluidized-bed processing
conditions as well as curing parameters with and without humidity on drug release from
pellets. Theophylline pellets were prepared by extrusion-spheronization and then coated
with diethyl phthalate-plasticized CAP dispersion (Aquacoat CPD) using a fluidized-bed
coater. The parameters investigated were plasticizer level, outlet temperature, spray
rate during coating application and fluidizing air velocities using a half-factorial design.
They observed that the processing temperature during coating applications was a
critical factor among the variables investigated. The release rate significantly decreased
when the beads were coated at 36 °C compared to those coated at 48 °C. Higher
coating efficiencies and better coalescence of films were obtained at the lower coating
temperature. They mentioned that above the MFFT the drug release in acidic medium
was decreased as the coating temperature was decreased. The curing at 60 °C can
significantly reduce the drug release from pellets that were coated at 32 °C, but had no
significant effect on the drug release from pellets which were coated at temperatures
above 36 °C. The curing at 50 °C in an atmosphere containing 75 % r.h., irreversibly
improved film formation by a better coalescence and improved the mechanical
properties. The curing with heat and humidity for the film formation of CAP on the
pellets was dependent on the curing temperature and on the moisture. The curing
process with an addition of humidity was found to be more effective than without <200>.
Mr. Carlin <25> recommended that if the use of a plasticizer with a phthalate group was
not wanted then triethyl citrate (TEC) can be used. The coating formulation containing
1 part of TEC and 4 parts of Aquacoat CPD was recommended. The Tg of the film
prepared from this formulation will be below 35 °C. The product bed temperature should
be kept low to avoid stickiness at temperatures above the Tg. The curing at a high
temperature is not required, merely an additional 10 min drying at the recommended
process temperature range of 32 – 36 °C. The dispersion of 15 % w/w solid content was
recommended to be used as a starting concentration for the optimizations. The
fluidized-bed apparatus as Aeromatic-MP1 will have a risk to create sticking due to
overheating the bed (> 36 °C) or due to the overwetting (small drying rate). Therefore
the low spraying rates were recommended and the product bed temperature should be
held at 32 – 36 °C. Due to the large surface area of pellets a solid loading of 10 – 20 %
Aquacoat CPD with a plasticzer on the pellets may be necessary to obtain a minimum
thickness that resists a gastric fluid.

Introduction 13
Many studies (Table 1.1) showed that CAP, in the form of an aqueous dispersion,
provided adequate acid resistance on coated products at sufficient coating levels. Most
of these coating studies were carried out on tablets or gelatin capsules, whereas only
few studies reported on pellets. Pellets possess an advantage compared to tablets,
such as low absorption variability and less propensity for dose dumping. Since they
have a much larger surface area they required a higher amount of enteric polymer to
achieve a desired property. However, they are of interest for controlling drug release.
Chemical stability of CAP products
CAP can be easily degraded by a hydrolysis. Roxin, Karlsson and Singh <155> have
investigated different methods to observe the stability of CAP powder after storage at
different temperatures and humidities (20 - 60 °C, 11 - 95 % r.h.). Especially the HPLC-
method was suitable for determine the amount of free phthalic acid, which is one of the
degradation products from CAP. Other methods, for example: infrared spectroscopy or
gas chromatography can be used with acceptable results. Differential scanning
calorimetry (DSC) is suitable for the determination of the Tg but not suitable to follow
the stability of CAP. However, the water content can be well determined by this
technique. They have found that the relative humidity has a greater effect on the
storage stability of CAP powder than temperature. The authors have also found the new
degradation product of CAP, formic acid, by using head-space gas chromatography-
mass spectroscopy. The other known degradation products of CAP such as acetic acid,
phthalic acid and phthalic anhydride can also be determined by the GC-method <155>.
The following examples show the stability of CAP-coated dosage forms under the stress
test. Eshra <53> has reported on the stability of CAP film prepared from organic or
aqueous formulations. In freshly prepared films of CAP from organic solution 3.2 % of
free phthalic acid was measured, whereas films from an aqueous system 4.0 % free
phthalic acid was found. After stress storage conditions at room temperature and 100 %
r.h., the content of free phthalic acid in films from aqueous systems reached 8.0 %.
Films from organic systems on the other hand had only 6.2 % free phthalic acid. Eshra
also showed the effect of the pKa and the solubility in water of the drug incorporated in
the free films on the hydrolysis of phthalyl groups of the polymer. The hydrolysis
increased when the pH of the water-soluble drug increased. For example: the content of
free phthalic acid after storage of the film containing nicotinamide (pH 6.3, pKa 3.35) or

14 Introduction procain HCl (pH 5.3, pKa 5.0) for 80 days at r.t. and 80 % r.h. was about 18 % and
14 %, respectively. These two drugs catalysed the hydrolytic reaction by the hydroxide
ions (OH -). However, this catalytic effect was different for the drug maleic acid
(pH 1.25, pKa 1.92) because the reaction was induced by the hydrogen ions ( H +).
However, hydrogen ions had less potential to the reaction compared to hydroxide ions.
Therefore the content of free phthalic acid after 80 days at the same conditions was
only 13 %. Eshra mentioned that the hydrolytic effect may be reduced if the extent of
dissolved drug, caused by the absorbed water, was low. Therefore the contents of free
phthalic acid of films containing insoluble drugs such as phenobarbital, tolbutamide and
salicylic acid after storage were 8.0, 7.0, and 6.5 %, respectively, which means the
content of free acid was significantly lower than that from soluble model drugs
(nicotinamide, procain HCl and maleic acid) at the same storage condition. The result of
CAP-coated tablets containing different drugs such as nicotinamide, phenobarbital
maleic acid, etc. which were stored under r.t. and different humidities were also shown.
For example, the content of free phthalic acid of tablets containing nicotinamide and
coated with an organic or aqueous formulation of CAP was 16 % after storage for
180 days at r.t. and 80 % r.h.. Not only the chemical stability of these tablets was lost
but also the physical properties such as the resistance against artificial gastric fluid and
the disintegration time in a buffer medium. Eshra found that these tablets were not
resistant to the acidic medium after storage. The reason for this result was the migration
of the drug, especially the water soluble one, into the outer film layer containing CAP.
The stability of enteric coated tablets was also studied by Thoma and Kräutle <187>.
They have found that applying a barrier coat prior to the enteric coating consisting of
aqueous dispersion of hydroxypropyl methylcellulose phthalate or CAP resulted in
reduced swelling of the tablets.
1.1.2.2.2.2 Hydroxypropyl methylcellulose acetate succinate (HPMCAS)
Some researchers have reported about the use of HPMCAS <106>. The properties of
free films prepared from aqueous dispersion containing HPMCAS were studied by
Obara and McGinity and the results were also compared with films prepared from
Eudragit L 30D and CAP <116>. The water soluble plasticizers such as TEC or triacetin
showed greater compatibility to HPMCAS than the water insoluble as DBS <61>. The
comparison of the results in form of isolated films and caffeine enteric coated tablets

Introduction 15
from the aqueous dispersion of HPMCAS and other enteric polmyers such as Aquateric,
HP 55, Kollicoat MAE 30D was demonstrated <164>. The effect of some additives such
as magnesium stearate and calcium stearate on the dissolution profiles of diltiazem
hydrochloride from press-coated tablets with HPMCAS in the outer shell was studied by
Fukui, Miyamura and Kobayashi <60>. Schmidt and Niemann <168,169> used
HPMCAS for coating of bisacodyl pellets and compared the results with pellets coated
with other enteric polymers such as CAT, and Eudragit L 30D. They also compared the
results of aqueous based and the organic-solvent based formulations. The enteric
coating process of pellets with an aqueous dispersion of HPMCAS in a fluidized bed
was mentioned <87>.
The novel enteric coating method called dry coating by using HPMCAS was mentioned
<115>. This method involves direct feeding of coating polymer powder and
simultaneous spraying of a plasticizing agent without either organic solvent or water,
using a centrifugal fluidized-bed apparatus. For film formation, a curing step was then
necessary. The new method required a higher coating amount for gastric resistance
compared with the conventional coating, but the processing time was dramatically
reduced. The stability of HPMC-AS was determined in comparison with CAP in which
the coating material Aqoat-AS-MF and CAP was stored at 60 °C and 100 % r.h. for
many days. It was found that after 14 days the free acid content in form of succinic acid
was about 1.8 % w/w. The enteric polymer CAP, on the other hand, produced free
phthalic acid more than 5 % w/w after only 6 days at the same condition. That means
HPMC-AS is more chemically stable than CAP <6>.
1.1.3 Some types of defects in enteric coated dosage forms
The defects that could be found in the enteric film coating were picking, twinning,
orange peel roughness, edge erosion, film cracking, logo bridging and film splitting or
peeling <143,10,154>. The picking defect resulted when for example the coating on two
adjacent cores is not sufficiently dry before contact occurs between them. Some
process conditions included low spray rates coupled with excessive drying conditions
and the use of excessive atomizing air pressure, which accentuate premature drying of
the droplets of coating liquid and this can cause the orange peel roughness. This
problem may also be compounded by attempting to spray coating liquids with
excessively high viscosities. The cores especially tablets whose edges were often

16 Introduction exposed to the attritional effects had the fracture at this point what was not uncommon
and resulted in edge erosion. Cracking or peeling of film coatings occured when the
internal stress developed within the coating and drying exceeded the tensile strength of
that coating.
If one of these defects occured then the properties of the enteric coated products will be
altered. Down and Booth <51> reported on the effect of pinholes on the dissolution
behaviour of enteric coated tablets.
1.1.4 Interaction between a drug and enteric polymers
Eshra <53> showed that the hydrolytic process of phthalyl groups of CAP was
increased after storage when the coated tablets contained some drugs such as
nicotinamide, maleic acid and phenobarbital compared to tablets without any drug. This
occurance was due to the diffusion of the drug into the film layer and the drug acted as
a catalysor for the hydrolytic process. He has also mentioned that the salt bonding
between nicotinamide and the free phthalic acid of tablets coated with CAP formulations
may be responsible for the longer disintegration time of more than 60 min.
Some publications <3,4,75> showed that the tertiary amine drugs such as naltrexone
and morphine will form hydrogen bonds with Eudragit L, whereas the secondary amine
drugs such as carteolol hydrochloride, phenylephrine and pseudoephedrine will form
salt bonds.
The interactions between erythromycin and enteric polymers such as CAP using
different techniques such as IR-spectroscopy, X-ray diffraction analysis and NMR-
spectroscopy were reported <163>. The amine salt interaction between the carboxyl
group of the acid polymer and the nitrogen atom of erythromycin was demonstrated by
this former work.
Gordon, et al. <64> studied the properties of naproxen sodium tablets coated with the
CAP aqueous dispersion and found that there was an inability of these tablets to
maintain their integrity during dissolution testing. This may be due to an interaction
between the enteric coat (CAP) and the drug (naproxen sodium) since this drug is a
weak base. Incompatibilities with acid-sensitive drugs (e.g. omeprazole) are possible
because CAP has free carboxylic acid <12,88>.

Introduction 17
1.1.5 Coating formulation with different additives
The primary coating materials, usually polymeric, will often require the addition of other
excipients, such as plasticizers, pore formers, or antiaggregation agents, in order that
the product is conveniently manufactured in the desired quality. It is therefore
appropriate to give attention to some of these types of excipients.
Most of the polymers that are used in pharmaceutical film coating procedures are
amorphous to partially crystalline in nature. One characteristic of these polymers is that
as the temperature is lowered the Tg is reached, below which a critical cessation of
molecular motion on the local scale appears. Under these temperature conditions, the
polymer exhibits many of the properties of inorganic glasses, including toughness,
hardness, stiffness and brittleness. For this reason the Tg is described as one below
which a polymer is brittle and above which it is flexible. Normally the Tg of typical
polymers used in the film coating process was high, therefore the modification of the
polymer to achieve a resonable Tg was nescessary. The addition of a plasticizer into
the coating formulations seemed to be suitable. The plasticizer when chosen correctly
and employed in the right level alters the physical properties of polymers and enhances
their film-forming characteristics. When a plasticizer interacts with a polymer it is
believed to interpose itself between the polymer chains to neutralize the forces holding
the chains together to increase the free volume or intramolecular space and eventually
to soften the polymer matrix. The Tg of the polymer will be reduced and impart more
flexibility. The basic requirements to be met by a plasticizer are permanence and
compatibility. The permanence dictates that the plasticizer should have a low vapor
pressure and low diffusion rate within the polymeric film. The high molecular weight
plasticizers were then favourite. The compatibility demands that the plasticizer should
be miscible with the polymer and exhibit similar intermolecular forces to those present
within the polymer.
Plasticizers used with pseudolatex dispersions dissolved in the colloidal or near colloidal
particles soften them and thereby promote their coalescence during film formation.
Although some authors have conducted intensive research to correlate plasticizer
efficiency in film formation with physical properties such as molecular weight of the
plasticizer or the Tg and intrinsic viscosity of the polymer dissolved in the plasticizer, the
fact remains that the polymer and plasticizer must have mutual solubility in order to
interact effectively and provide continuous flexible films. Thus plasticizers must be

18 Introduction chosen from materials that have been shown to be useful for a particular polymer.
Plasticizers commonly used in the pharmaceutical fields are triethyl citrate, diethyl
phthalate, dibutyl sebacate, triacetin, glycerol, and polyethylene glycol, etc. <143,150>.
The non-traditional plasticizers such as methyl paraben, ibuprofen, chlorpheniramine
maleate and theophylline were studied to find out the influence of these substances on
the thermal and mechanical properties of the polymeric films <202,203>
Some excipients may be used in coated pharmaceuticals for one purpose and be used
in other pharmaceuticals to fulfill a different function. Thus, magnesium stearate (Mgst),
most commonly used in pharmaceutical technology as a lubricant <11> has been used
to prevent agglomeration of coated particles <150>. Some research works reported
about the unconventional way of adding additives in the coating formulations e.g.
magnesium stearate <151>, talc <195>, colloidal silicon dioxide <195> and titanium
dioxide <17>.
1.1.6 Coating with non-ionic polymers
Basic actives such as sodium salicylate may interact with CAP and create a micro pH
greater than 5.5. A suitable subcoat layer was then required <65>. The subcoat or
isolating layer was usually used to separate the core material from the enteric coating
polymers. This layer should hinder or reduce the effect from the core, as pH values, to
the enteric layer.
Thoma and Kräutle <187> have used HPMC as a barrier coat prior to the enteric
coating consisting of aqueous dispersion of coating agent HPMCP or CAP. TEC was
used as a plasticizer. The result showed that the swelling of CAP enteric coated tablets
can be reduced, whereas the HPMCP coated pellets were not influenced by this
subcoat. The subcoat from an aqueous system of HPMC was often used, though the
effect from the subcoat on the stability of the enteric dosage form was not well studied.
The following polymers were generally used as subcoats because of non-ionic property
and the authors have investigated their effect on the dosage form.
1.1.6.1 Hydroxypropyl methylcellulose (HPMC)
HPMC was used by many researchers, for example: as a film forming agent
<10,97,89,106>, a matrix for producing tablets <13,196> or for layering of drug <149>.
The use of HPMC was reviewed in the literature <1,162>. The physical properties of

Introduction 19
free films from HPMC such as crystallinity, Tg, intrinsic viscosity were investigated
<71,107,95>.
Mc Philips, Craig, Royall and Hill <95> have shown that the glass transition temperature
(Tg) of HPMC powder measured by modulated temperature differential scanning
calorimetry (MTDSC) was about 162 °C and the Tg of HPMC films was about 164 °C –
167 °C. Lehtola et al. <88> studied the Tg of free films prepared from aqueous based
HPMC plasticized with different types of polyethylene glycol (PEG 400, 1500 and 4000).
By using the DSC technique they have found that the Tg of free film from HPMC alone
was 119 °C. The Tg of HPMC with PEG 400 was between 119 - 138 °C depending on
the concentration of PEG which was varied from 10 to 30 % w/w. If the concentration of
PEG was increased then the Tg was reduced. The Tg of HPMC plasticized with PEG
was higher than that of HPMC without plasticizer. This may be due to the higher
moisture content of unplasticized HPMC film. The Tg of HPMC and PEG 1500 or PEG
4000 surprisingly kept almost constant at 130 and 136 °C, respectively though the
concentration of PEGs was varied from 10 to 30 % w/w. The free film from HPMC
plasticized with 20 % w/w PEG 400 and 20 % w/w TiO2 showed the Tg of 134 °C which
was higher than the Tg of the same film without TiO2. This appearance seems to be due
to the hindering of mobility of polymer chains in the presence of pigment particles.
1.1.6.2 Ethyl cellulose (EC)
Physical properties such as crystallinity, Tg or swelling of ethyl cellulose have been
reported <167,58,124>. Ethyl cellulose generates very hard or tough films and needs a
plasticizer to soften the film, i.e., to improve flexibility and reduce brittleness. The Tg of
EC is 120 °C which is defined as the temperature above which EC is in a rubbery state.
Thus an unplasticized EC film would be in the glassy state at temperatures at which
products are manufactured and stored and would not perform its intended function. The
plasticizer must be able to dissove the polymer to promote chain mobolity and flexibility.
Thus a comparison of the solubility parameters of plasticizers with that of EC is
predictive of effectiveness. Alternatively free films can be prepared with various
plasticzers at different levels and examined thermomechanically to investigate
effectiveness <67>. For example; the softening temperature of Aquacoat ECD and 24 %
w/w DBS was reported to be 54 °C. A number of plasticizers were reported to be

20 Introduction compatible with Aquacoat ECD e.g. DEP and DBS because of the value of the solubility
parameter <67>.
It is reported that the Tg of Aquacoat ECD is lowered as the concentration of a
plasticizer such as DBS, DEP or TEC is increased. This appearance will promote
coalescence of polymer particles. The Tg of unplasticized Aquacoat ECD was 129 °C,
whereas the Tg of Aquacoat ECD film plasticized with 20 % w/w DBS, DEP or TEC was
44 °C, 44 °C and 36 °C, respectively. The optimum plasticizer level was reported to be
20 – 24 % w/w <179>. Another report showed that the Aquacoat ECD dispersions
plasticized with DBS at 15 %, 25 % and 30 % gave intact clear films above 34 °C, 28 °C
and 27 °C, respectively. TEC at the same concentrations exhibited a MFFT of 32 °C,
30 °C and less than 23 °C, respectively <117>. The solubility parameter of EC, DEP
and DBS was reported to be 21.1, 20.5 and 18.8 (J/m3)1/2 x 10–3, respectively.
Therefore, DEP and DBS seemed to be more efficient as a plasticizer for Aquacoat
ECD than TEC. Pellets coated with aqueous based systems using Aquacoat ECD were
widely studied <118,205,21>. The curing was an important factor for a good
coalescence of EC. The combination of EC and other polymers such as HPMC was
also studied <59,67,116,117,118,149,179,205>.
1.1.6.3 Polyvinyl alcohol (PVA)
PVA is available in different viscosity grades. It was used as excipient in many fields
e.g. production of paper, polymerisation, textile, foils and ceramic <142>. In the
pharmaceutical field it can be used as stabilizer in dispersion <85,105>, filler in
tabletting <146>, in pelletisation <142>, in microencapsulation <142>, for microparticles
<24,173> or sponges <142> but PVA alone as a film forming agent is not published.
Therefore it is of interest to study the possibility to use PVA for coating of pellets.
The possibility to incorporate PVA instead of gelatine in the sugar coating formulations
was studied and the authors mentioned that PVA was a good stabilizer for the sugar
coating suspensions <105>. It was also reported that PVA can be used as a stabilizer in
the aqueous phase for preparation of microencapsulation using cellulose acetate
butyrate <85>. Microspheres of PVA containing diclofenac sodium can be prepared by
an emulsion-chemical cross-linking method <33>. The cross-linked PVA was reported
to be used for preparing microparticles for the controlled-release oral solid dosage form
<173>. In the tabletting process PVA can be used as a matrix for producing the

Introduction 21
compressed tablets containing a water soluble drug <146>. The release- and swelling-
behaviour of these tablets were studied.
The possibility of using PVA for the ocular drug delivery was studied in form of
liposomes and nanoparticles <24> and the delivery of protein was also studied <68>.
The incorporation of bovine serum albumin into PVA hydrogel films was successfully
performed and the effect of the freezing and thawing process and its subsequent
release behaviour were reported.
It was reported that PVA can be used to produce the complex containing phenobarbital
using spray drying technique <81>. The crystallization of the drug in the polymer PVA
shown under a light microscope, by SEM, DSC or X-ray diffraction depended on the
concentration of the incorporated drug.
The chemical stability of PVA was studied <2,96>. As PVAs contain residual acetate
groups they can therefore be degraded by the hydrolytic process. The elastic behaviour,
the internal stress and the swelling of PVA were also studied <174,175>.
The mixture of PVA and HPMC was reported to be used as film forming agents applying
PEG 6000 as a plasticizer <160>. The moisture permeation properties of HPMC
containing PVA and filled with talc or titanium dioxide have been evaluated using the
sorption-desorption technique <119>.
22 Statement of the problem
1.2 Statement of the problem
The stability of cellulose acetate phthalate (CAP)-coated dosage forms <86,121>
especially when the dosage forms contained a basic drug was reported <53>. Therefore
the possibility to increase the stability of the dosage form and to avoid the hydrolysis of
the CAP polymer was of interest.
A suitable model for this intention was therefore a model which provided a direct contact
between a basic drug and the enteric polymer (CAP). In order to produce such a model
sugar spheres in the size range of 800 - 1000 µm or 1000 - 1180 µm were used as
cores. These cores shall be coated with a layer of solid basic drug and finally coated
with CAP.
The desirable observation of chemical or physical interaction between a model drug and
the outer enteric layer (CAP) may be well performed with this arrangement. That
means, only the effect of the contact between drug and polymer can be observed and
additional effects of other excipients will be avoided as they may occur in form of tablets
<53>.
In this present work the spherical model will have a thin layer of a water soluble, weak
basic drug (nicotinamide). This thin layer will represent the effect of an interaction which
may have occured because of a direct contact with the enteric polymer (CAP). When
the drug diffuses to the outer layer it will change the properties of CAP. This diffusion
can be avoided by using a seal coat (subcoat). Moreover, the subcoat may hinder the
interaction between the basic drug and the enteric polymer (CAP). Different non-ionic
polymers such as hydroxypropyl methylcellulose (HPMC), ethyl cellulose (EC) and
polyvinyl alcohol (PVA) shall be tested to find out the possibility to use one of them as a
subcoat. HPMC was used as a subcoat in some recent studies <15,86,109>. In this
present work HPMC will be used to compare the result with EC and PVA. The effect of
each subcoat on the CAP-coated pellets containing nicotinamide shall be tested.
However, before the stability of the enteric coated pellets can be investigated the
physical properties of the coated pellets should be acceptable. The important physical
property is the resistance against artificial gastric fluid (0.1 N HCl). If the enteric coated
pellets have passed this test the chemical stability test by storage of the coated pellets
under different combinations of temperatures and humidities can then be performed.
Therefore first of all a coating process and a suitable formulation of an aqueous
dispersion of CAP to produce enteric coated pellets have to be developed. The coating
Statement of the problem 23
processes will be performed by using a Wurster-based fluidized bed apparatus
(Aeromatic-MP1). The two commercial CAP products in the form of the spray dried
powder (Aquateric) and a ready-to-use aqueous dispersion (Aquacoat CPD) will be
investigated. Different types of plasticizers are added into the aqueous dispersions of
CAP. One plasticizer is a water soluble i.e. triethyl citrate (TEC). The other two
plasticizers are water insoluble i.e. diethyl phthalate (DEP) and dibutyl sebacate (DBS).
For the coating processes using Aquacoat CPD and TEC as a plasticizer the coating
formulations and parameters shall be developed based on the combination of the
publications by Williams and Liu <200>, Carlin <25> and the product information of
Aquacoat CPD <7>. Model pellets containing methyl orange shall be used to develop
the coating process using Aquacoat CPD and TEC <170>. The pellets containing
nicotinamide will be coated with the formulation containing Aquacoat CPD and TEC as
well. On the other hand, for the coating processes using Aquateric or Aquacoat CPD
and DEP or DBS as a plasticizer the coating formulations and parameters will be
developed on the basis of the studies by Chang <31>, the product information of
Aquateric <9> and Aquacoat CPD <7>.
The products with different subcoats will be combined and applied as a loading material
for a common coating process using an aqueous dispersion of CAP and a plasticizer.
This assures the same coating conditions and reduces the number of trials. Therefore
the differentiation of products with different subcoats after finishing the process must be
possible. The different colours (red, green, orange and blue) are therefore used as a
marker for each product for the identifcation.
The effect of post-drying at different temperatures and humidities outside the coating
apparatus were studied with some CAP-coated pellets.
The determination of different properties of the products such as morphology, thickness,
diameter, swelling and the resistance against artificial gastric fluid was performed.
As the water content in the dosage form is the important factor that can affect the
hydrolytic process of the polymer especially CAP, the determination of the water content
will therefore be investigated by Karl-Fischer Titration.
The chromatographic method as HPLC will be used to determine the content of free
phthalic acid, which is the indicator for the chemical stability of CAP. Some CAP-coated
pellets will be optically observed after storage under different temperatures and
humidities. The long time stabilty test can be done only after the CAP-coated pellets
have passed the enteric resistance test.

24 Experimental Part / Materials
2. Experimental part 2.1 Materials 2.1.1 Core materials: Sugar spheres Sugar spheres defined by the USP XXIV <181> should contain not less than 62.5 %
and not more than 91.5 % of sucrose (C12H22O11), calculated on the dried basis, the
remainder consisting chiefly of starch. They consist of approximately spherical particles
of a labeled nominal size range. The loss on drying at 105 °C for 4 h should not be more
than 4 % w/w. The particle size test is in accordance with the procedure for coarse
powders. Not less than 90 % of it should pass the coarse sieve size and not more than
10 % should pass the finer sieve size stated in the labeling.
Sugar spheres are solid drug excipients of spherical size. They are characterized by
their geometry, whereas the process of manufacture and the composition are variable
according to special uses. In contrast to the well-known granulates the pellets have
nearly ideal spherical form. Normally, the diameter of pellets is below one millimeter
<198>.
Materials used in this work: Sugar spheres used in this work were manufactured by Werner´s Feine Dragees,
Hanns G. Werner GmbH+Co., Tornesch.
They contained 62.5 - 91.5 % saccharose, 8.5 - 37.5 % corn strach and up to 4 %
purified water. The values from the certificate of analyisis of different batches used in
this work are shown in the following table.
Batch number Nominal size fraction
(µm)
Actual content
in size fraction
(% w/w)
Loss on drying
at 4 h, 105 °C
(% w/w)
08430427 850-1000 91.5 1.58
08430993 850-1000 94.5 1.51
08530984 1000-1180 92.7 1.91
08530099 1000-1180 96.2 1.13
Table 2.1: Batches and properties of sugar spheres used as cores.

Experimental Part / Materials 25
2.1.2 Neutral polymer: Hydroxypropyl methylcellulose (HPMC)
Figure 2.1: Structural formula of HPMC
Hydroxypropyl methylcellulose is cellulose 2-hydroxypropyl methyl ether and is known
as Hypromellose, Hydroxypropylcellulosum, hypromellosum. HPMC is a propylene
glycol ether of methylcellulose. It is characterized by different mean substitution
degrees: -OCH3 1.12 - 2.0 and -OCH2 - CHOH - CH3 0.1 - 0.34, this means in the
number of methoxy groups (16.5 – 30 %) and hydroxypropoxy groups (4 – 32 %) per
glucose unit <77,78,79>.
HPMC is an odorless, tasteless, white or creamy-white fibrous or granular powder and
has no ionic charge. It dissolves in cold water in all proportions and binary organic
solvents systems such as methylene chloride with methanol, ethanol or isopropanol
offer a good solubility <79>. HPMC has the glass transition temperature (Tg) at 40 °C -
45 °C and the melting point (Tm) of HPMC is 190 - 305 °C <77>.
Low viscosity grades of HPMC such as Pharmacoat 603 are used in aqueous film
coating, while high viscosity grades are used in organic solvent film coating. For film
coating, concentrations reaching 80 - 100 cP are optimum. These viscosities
correspond to the concentrations of 6 - 10 % w/w. Films prepared from HPMC are not
brittle but to obtain a highly flexible film an addition of a plasticizer such as polyethylene
glycol (PEG 6000) is required. Sometimes titanium dioxide or talc was recommended to
H
O
CH2OROR
OR
R = -H, -CH3 or -CH2 -CH-O H
CH3
m
O
O
H
H
H
H H
HH
H
H O OR
OR
CH2OR n

26 Experimental Part / Materials
be added in a large amount to HPMC e.g. 20 % w/w. However, addition of inorganic
substances such as TiO2 may cause a marked decrease in the tensile strength, often
leading to occurrence of cracking and detachment. Therefore, it should be added when
a relative high viscosity grade (high molecular weight) of HPMC was used such as
Pharmacoat 645W or Pharmacoat 606. The addition of a water-insoluble polymer such
as ethylcellulose to HPMC may delay the dissolution of the film or drug. The examples
of the mixed film prepared from HPMC and EC showed that the mixing ratio of
HPMC:EC at 5:5 caused a film that was nearly insoluble in simulated gastric fluid,
whereas the mixing ratio at 7:3 caused a film soluble in this fluid.
Materials used in this work: The products of Pharmacoat were manufactured by Shin-Etsu Chemical Co., Ltd.,
Pharmaceutical Materials Department, Tokyo, Japan and they are distributed by
Syntapharm GmbH, Mülheim-Ruhr.
The following batches of HPMC were used in this work;
Pharmacoat 645W, Lot No. 605231. This batch contained, as mentioned in the
certificate of analysis, 28.8 % methoxy content and 9.5 % hydroxypropoxyl content. The
pH of it was 6.7 and the apparent viscosity measured after EP was 4.46 mPa.s.
Pharmacoat 603W, Lot No. 612646. This batch contained, as mentioned in the
certificate of analysis, 29 % methoxy content and 9.5 % hydroxypropoxyl content. The
pH of it was 7.2 and the apparent viscosity measured after EP was 3.28 mPa.s.
2.1.3 Neutral polymer: Sepifilm LP 010 Sepifilm LP is a ready to use product. It is composed of hydroxypropyl methylcellulose,
microcrystalline cellulose and stearic acid.
Sepifilm LP is in granular form and because of the presence of cellulose it is almost fast
and easy to make a dispersion of Sepifilm. The size of grains is 0.2 to 2 mm, which
allows a good flow and is dust-free with an easy handling. It is easy to be wetted and
because of the porosity of the grains it allows a fast dispersion within 30 min at room
temperature. The manufacturer indicated a good adhesion and a good quality with
homogeneous film. Therefore it can be used as a film forming composition intended for
gastrosoluble film coating of tablets and microgranules sensitive to moisture. The
dissolution profile and the disintegration were not different between tablet coated with

Experimental Part / Materials 27
Sepifilm LP and non film-coated tablets both at pH = 1 and pH = 5.5. Comparing the
property of protection against moisture of film prepared from Sepifilm LP and HPMC, it
was found that the moisture intake of fumitory tablets under stressfull condition (40 °C,
90 % r.h.) was halved when the tablets were coated with Sepifilm LP in comparison with
HPMC <171,172>. Material used in this work: Sepifilm LP 010, Lot No. 64211 was manufactured and distributed by Seppic, Paris,
France.
As mentioned in the certificate of analysis, the batch used in this work contained 4.3 %
volatile matter and 8 % stearic acid. The viscosity of 12 % dispersion was 678 cP.
2.1.4 Neutral polymer: Ethyl cellulose (EC)
Figure 2.2: Structural formula of EC
Ethyl cellulose is stated in many pharmacopoiea such as EP 1997, BP and USP. EC is
an ethyl ether of cellulose. When EC was dried at 105 °C for 2 h, it should contain not
less than 44 percent and not more than 51 percent of ethoxy (–OC2H5) groups <55,56>.
EC is an odorless, tasteless, white or creamy-white granular powder and has no ionic
charge. It is insoluble in water but soluble in organic solvent such as methanol, ethanol,
ethyl acetate, acetone or chlorinated hydrocarbon. Molecular weight of EC varied from
150,000 to 300,000 <54>. The glass transition temperature (Tg) of EC is 129 °C. The
H
O
CH2OROR
OR
R = - C2H5
O
O
H
H
H
H H
HH
H
H O OR
OR
CH2OR n

28 Experimental Part / Materials
degradation temperature of EC is > 200 °C and minimum film forming temperature
(MFFT) of EC and 20 % DEP is 75 °C.
Ethyl cellulose has a nonionic and moisture barrier properties, therefore EC can be
used as a coating material. The reason why EC can be used as a moisture barrier may
be due to the fact that EC itself is insoluble and does not absorb moisture. In addition, a
latex film of any polymer seems to be more dense than a solution cast film. This
property may improve the barrier property of the latex film from EC. Therefore EC may
be better than HPMC as a subcoat for hindering the moisture or the diffusion of the
substance or water. HPMC is a water soluble polymer and therefore may absorb
moisture into or through its film. This may be the result that HPMC is not a good
polymer film used for hindering the moisture <8>.
The ethyl cellulose aqueous dispersion was also mentioned in USP XXIV <55>. It is a
colloidal dispersion of ethyl cellulose in water. It should contain not less than 90 percent
and not more than 110 percent of the labeled amount of ethyl cellulose. It can contain
suitable amounts of cetyl alcohol and sodium lauryl sulfate, which assist in the formation
and stabilization of the dispersion. It may contain suitable antifoaming and antimicrobial
agents. The pH of the EC dispersion is between 4 and 7. The commercial available EC
dispersion are for examples Aquacoat ECD and Surelease. The detail of Aquacoat ECD
will be discussed further on because it will be used for this work.
Material used in this work: Aquacoat ECD-30 was manufactured by FMC Corporation, Pharmaceutical Division,
Philadelphia, USA and distributed by Lehmann & Voss & Co., Hamburg.
The following batch of ethylcellulose dispersion was used in this work;
Aquacoat ECD 30, Lot No. J8381. This product contained cellulose ethyl ether
[CAS.No. 9004-57-3], hexadecan-1-ol [CAS.No. 36653-82-4] and sodium dodecyl
sulphate [CAS.No. 151-21-3]. As mentioned in the certificate of analysis it contained
26.2 % ethylcellulose, 1.3 % sodium lauryl sulfate and 2.5 % cetyl alcohol. The viscosity
of this dispersion was 11 cP and pH was 6.3.

Experimental Part / Materials 29
2.1.5 Neutral polymer: Polyvinyl alcohol (PVA)
Figure 2.3: Structural formula of PVA Polyvinyl alcohol defined in USPXXIV is a polymer in which the average value of n lies
between 500 - 5000. Various grades with different viscosities and molecular weights are
commercially available such as products from Mowiol or Poval, etc <140,141>.
A commercial product Mowiol is obtained by hydrolysis of polyvinyl acetate in methanol
using sodium hydroxide as catalyst. The differance in concentration of catalyst, reaction
temperature, and reaction time will result in various residual amounts of acetyl groups,
i.e. fully hydrolysed or partially hydrolysed. The distribution of acetyl groups in partially
hydrolysed polyvinyl alcohol will be controlled by the catalyst and solvent. That is why
the alkaline alcoholysis results in a block-type distribution of acetyl groups, while the
acidic reaction gives mostly statistically distributed acetyl groups. Most of these types
contain about 11 % acetyl, that means the degree of hydrolysis is 88 mol %. The fully
hydrolysed polyvinyl alcohol has a degree of hydrolysis of about 97 to 100 mol %. It has
a high crystallization tendency and crystallinity. This is the main reason for a reduction
in the cold-water solubility of the polyvinyl alcohol.
Mowiol has different grades and was classified by the degree of polymerization and
hydrolysis. They are supplied in the form of fine granules, some grades are available in
a fine particle size. The nomenclature of Mowiol is that the first position means the
viscosity (mPa.s) of 4 % w/w of the substance in water at 20 °C and the second position
means the degree of hydrolysis of the polyvinyl acetate (mol %) on which it is based
(partially and fully hydrolysed Mowiol grades). For example: Mowiol 4-88 is a partially
hydrolysed type, this grade has a viscosity of 4 ± 0.5 mPa.s, the degree of hydrolysis is
CH2
OH
CH
n

30 Experimental Part / Materials
87.7 ± 1 mol % and the residual content of acetyl group is 10.8 ± 0.8 % w/w, whereas
Mowiol 4-98 is a fully hydrolysed type <142>.
Apart from water there are other solvents for Mowiol e.g. dimethyl sulphoxide,
formamide, dimethyl formamide and phosphoric acid. Mono- and multivalent alcohol
such as methanol, ethanol, glycerine or ethylene glycol may cause certain Mowiol
grades to swell but will not dissolve them. The glass transition temperature of Mowiol is
about 40 to 80 °C depending on the type. The melting point range of the crystall is 180
to 240 °C.
Mowiols can be used as emulsifier, protective colloid, plasticizer, filler in pelletization or
coating material. The microencapsulation, sponges or emulsion can be also prepared
from Mowiols. The low molecular, partially hydrolysed grades such as Mowiols 3-83,
4-88 and 5-88 are preferred as binders for pelletizing because they cause no problems
for the production of sprayable solutions with variable solids content. The partially
hydrolysed Mowiols grades are from the low and medium viscosity range and they are
preferably used as co-binder for microencapsulation. For coating purposes Mowiols
3-98, 4-98, 6-98 and also 5-88 are preferably used. As it was reported from the
company Clariant, although Mowiols is not hygroscopic, films from Mowiols absorb
some moisture. The amount of moisture absorbed depends on the partial pressure of
the water vapour. In order to measure water absorption, they used 0.3 mm films which
were cast from 10 % aqueous solution from Mowiol solution and then dried in air at 23
°C and 50 % r.h. These films were afterwards stored for 7 days at 23 °C and at various
relative humidities between 15 and 92 %. The water absorption was measured by
gravimetric weight analysis under comparable conditions. The result showed that films
prepared from partially hydrolysed Mowiol such as 4-88, 8-88, 18-88, 26-88 or 40-88
had a water content of about 6 % w/w, whereas films prepared from fully hydrolysed
Mowiol such as 4-98, 10-98, 20-98 or 28-99 had a water content of about 7.5 % w/w.
That means in general the fully hydrolysed films absorb slightly more water at low
humidities than the partially hydrolysed ones. The water resistance of dried Mowiol films
rises with increasing molar mass and the degree of hydrolysis <142>.
Materials used in this work: Mowiol products were manufactured by the company Clariant GmbH, Frankfurt am Main
and distributed by Hermann Ter Hell & Co. GmbH, Hamburg.

Experimental Part / Materials 31
The following batches in a granulate form were used in this work.
Mowiol 3-83, Lot No. 601B25192
Mowiol 3-98, Lot No. DEBC009711
Mowiol 4-88, Lot No. 601B29217
Mowiol 4-98, Lot No. DEBC003522
Mowiol 8-88, Lot No. 601BE0352
Mowiol 10-98, Lot No. DEBC006732
Mowiol 18-88, Lot No. DEBC003543
Mowiol 20-98, Lot No. 601BH0081
Mowiol 26-88, Lot No. DEBC006525
2.1.6 Enteric polymer: Cellulose acetate phthalate (CAP)
Figure 2.4: Structural formula of CAP Cellulose acetate phthalate (CAP) known as cellulosi acetas phthalus in the Ph.Eur.
1997, cellacefate in the USP XXIV, and cellacephate in the BP 1993. Other synonyms
such as cellulose acetate hydrogen 1,2 - benzenedicarboxylate, cellulose acetate
monophthalate or cellulose acetylphthalate are mentioned <29>. CAP is a reaction
product of phthalic anhydride and a partial acetate ester of cellulose. It contains not less
than 21.5 percent and not more than 26 percent of acetyl (C2H3O) groups and not less
HCC
CO OH
CH3
O
O
O
O
ORH
OCH2OR
H
HOR
H H
= R
n

32 Experimental Part / Materials
than 30 percent and not more than 36 percent of phthalyl (o-carboxyl-benzoyl, C8H5O3)
groups, calculated on the anhydrous, acid free basis <26>. The limit of phthalyl content
stated in EP1997 and BP 1993 however is different from the USP that is 30 - 40 %. The
limit of free acid of CAP in USP XXIV, EP 1997 and BP 1993 is the same that means no
more than 3 %, whereas the limit in USPXXIII is higher namely not more than 6 %,
calculated as free phthalic acid. The free acid was determined by the titration method
using dilute methanol as sovent, 0.1 N sodium hydroxide as titrant and phenolphthalein
as an indicator <27,28,30>.
CAP is a white, free-flowing powder or colourless flakes, tasteless, odourless or may
have a slight odor of acetic acid. It is a hygroscopic substance, practically insoluble in
water, alcohols, hydrocarbons and chlorinated hydrocarbons but soluble in dilute
solutions of alkalis, a number of ketones, esters, ether alcohols, cyclic ethers and in
certain solvent mixtures such as acetone : ethanol, acetone : methanol or ethyl acetate :
isopropanol. The relative molecular weight of CAP is ca. 30,000. The glass transition
temperature (Tg), melting point (Tm) and minimum film forming temperature (MFFT) of
CAP is 160 – 170 °C, 192 °C and 56 °C, respectively <29>. The pKa value of CAP is
4.4 - 4.7 depends on phthalyl content <29>.
There are two commercially available CAP products to be used as a coating dispersion
<7,9>. One is in form of redispersing powder called Aquateric CD, the other one is in
form of a ready-to-used dispersion called Aquacoat CPD. Both these two products will
be discussed in details in the following part because they will be used in this work.
2.1.6.1 Aquateric CD-910
Aquateric is composed of solid or semi-solid polymer spheres of cellulose actate
phthalate ranging in size from 0.05 to 3 µm with average particles of 0.2 µm. Aquateric
was accomplished by a special mechanical emulsion technique to produce the
submicron size particles and subsequent spray drying after addition of suitable physical
barrier materials. In its initial form Aquateric is a dry, white water-insoluble powder. It is
then dispersed in water to create the reconstituted latex film coating system. A typical
dispersion may consist of 10 - 30 % solids, yet have a viscosity in the 50 - 100 cP
range. Aquateric consisted of 70 % CAP, the remainder comprises polyoxypropylene-
polyoxyethylene block co-polymer and acetylated monoglycerides for stabilizing the
physical property of the product. Diethyl phthalate (DEP) has been found to be an

Experimental Part / Materials 33
effective plasticizer for use in Aquateric because of its effective interaction with CAP
polymer. It was also reported that propylene glycol showed a good plasticization effect.
Mixed plasticizer systems including DEP, polyethylene glycol (PEG) 400 have been
reported to provide fully continuous films for enteric performace as well. PEG 400, on
the other hand, tended to over soften the film and resulted in twinning or sticking . In
summary the following plasticizers were recommended to be used with Aquateric: the
water insoluble plasticizer DEP, the water soluble triacetin, triacetin citrate or propylene
glycol and the combination of DEP and triacetin at 1:1 ratio.
Materials used in this work: The following batches of Aquateric , which was produced by FMC Corporation,
Pharmaceutical Division, Philadelphia, USA and distributed by Lehmann & Voss & Co.,
Hamburg, were used in this work.
Lot. No. L6271, This batch according to the certificate of analysis contained 70 %
cellulose acetate phthalate and 2.1 % free phthalic acid.
Lot. No. L9242, This batch as mentioned in the certificate of analysis contained 70 %
cellulose acetate phthalate and 1.3 % free phthalic acid.
2.1.6.2 Aquacoat CPD- 30
Aquacoat CPD contained 23 % cellulose acetate phthalate [CAS.No. 9004-38-0], 7 %
poloxamer [CAS.No. 9003-11-6] and 70 % water [CAS.No. 7732-18-5]. It is
commercially available as a 30 percent by weight dispersion. The typical coating level
for enteric coated beads using Aquacoat CPD is 10-15 %. Because of a high surface
area of dosage form beads need more coating substances than tablets which need only
6-10 % coating level. Recommended plasticizers for use with Aquacoat CPD include
diethyl phthalate (DEP), triethyl citrate (TEC) and triacetin. The amount of 20-24 %
plasticizers to Aquacoat CPD latex solids was recommended for the most applications.
For example; if DEP was used at 20 % to solid content of latex, the glass transition
temperature (Tg) of Aquacoat CPD was reduced to 34 °C, but using TEC at the same
concentration, the Tg was reduced to 35 °C.

34 Experimental Part / Materials
Materials used in this work: The following batches of Aquacoat CPD, which was manufactured by FMC Corporation,
Pharmaceutical Division, Philadelphia, USA and distributed by Lehmann & Voss & Co.,
Hamburg, were used in this work.
Lot No. K9261, This batch as mentioned in the certificate of analysis contained total
solid content of 30.2 %. The content of cellulose acetate phthalate was 24 % and of free
phthalic acid was 0.4 %. The pH of this dispersion was 2.7 and the viscosity was 12 cP.
Lot No. K0061, This batch as mentioned in the certificate of analysis contained total
solid content of 29.5 %. The content of cellulose acetate phthalate was 22 % and of free
phthalic acid was 0.5 %. The pH of this dispersion was 2.6 and the viscosity was 13 cP.
Lot No. K9441, This batch as mentioned in the certificate of analysis contained total
solid content of 29.6 %. The content of cellulose acetate phthalate was 22 % and of free
phthalic acid was 0.5 %. The pH of this dispersion was 2.7 and the viscosity was 12 cP.
Lot No. K9251, This batch as mentioned in the certificate of analysis contained total
solid content of 30.2 %. The content of cellulose acetate phthalate was 24 % and of free
phthalic acid was 0.7 %. The pH of this dispersion was 2.8 and the viscosity was 12 cP.
2.1.7 Enteric polymer: Hydroxypropyl methylcellulose acetate succinate (HPMCAS)
Figure 2.5: Structural formula of HPMCAS
O
HCH3
CH2CHCH3
OR
H
CH2OR
H
H
OR
H
H
= R
n
OH
O
O
CH2OR
H
H
H
H
OR
OR
CH2CHCH3
OCOCH3
OCOCH2CH2COOH
COCH3
COCH2CH2COOHCH2CH(OH)CH3

Experimental Part / Materials 35
Hydroxypropyl methylcellulose acetate succinate (HPMCAS) was not mentioned in any
Pharmacopoeia but was mentioned in the Japanese Pharmaceutical Excipients 1998.
There are different grades of HPMCAS available depending on the molecular weight
distribution as mentioned from the Company ShinEtsu, Japan. The commercial
available product is Aqoat in the form of dried powder. Aqoat type AS-LF has the
highest molecular weight, type AS-HF has the lowest molecular weight, and type AS-MF
has the middle molecular weight. Only the properties of Aqoat type AS-MF will be
discussed in details because it will be used in this work.
Aqoat type AS-MF should contain 21 - 25 % methoxyl content, 5 - 9 % hydroxypropylxyl
content, 7 - 11 % acetyl content and 11 - 14 % succinoyl content. The free succinic
should not be more than 1 %. The average particle size should not be more than 10 µm,
the size through 75 µm should not be less than 99 % and the size retained on 53 µm
should not be more than 10 % <6>. It is a white powder without odour. It is not soluble
in water but it is soluble in acetone, buffer solutions of pH more than 6, a mixture of
some solvent such as a mixture of methylene chloride and ethanol (1:1) or a mixture of
ethanol and water (8:2). The recommended plasticizers are TEC, triacetin and
propylene carbonate. The pKa of HPMCAS is 4.8-5.0, therefore it is less acidic than
CAP.
Material used in this work: Aqoat AS-MF, Lot No. 910049, distributed by Syntapharm GmbH, Mülheim an der Ruhr,
was used for this work. The content of different groups in this batch is 23.4 % methoxyl,
7 % hydroxypropylxyl, 9 % acetyl, and 11.2 % succinoyl. The free succinic acid content
is 0.03 %. The average particle size is 4.6 µm and the 90 % cumulative of the particle
size is 10.2 µm.

36 Experimental Part / Materials
2.1.8 Model indicator: Methyl orange (MO)
Figure 2.6: Colour changing of methyl orange in acidic or basidic medium
Methyl orange has many synonyms such as 4-[[(4-Dimethylamino) phenyl]-azo]
benzenesulfonic acid sodium salt, sodium p-dimethylaminoazobenzene-sulfonate,
helianthine B, acid orange 52, orange III, gold orange or tropaeolin D. The chemical
formula is C14H14N3NaO3S with the molecular weight of 327.33 g/mol. It was prepared
from sulfanilic acid sodium nitrite and dimethylaniline <99 - 104>.
Methyl orange is a yellow powder or crystalline scales. It is soluble in 500 parts of cold
water and more soluble in hot water but practically insoluble in alcohol. At pH 3.1,
methyl orange has the maximum absorption at wavelength range of 501 - 504 nm
( λ1), whereas at pH 4.4, methyl orange has the maximum absorption at wavelength
range of 467 - 471 nm ( λ2). The specific absorption A (1%, 1 cm) at λ1 is 1050 - 1150,
whereas the specific absorption A (1%, 1 cm) at λ2 is 750 - 850.
It was normally used as indicator in 0.1% aqueous solution. The colour of methyl orange
at pH of 4.4 is yellow and at pH of 3.1 is red. That means it produces a red colour in
moderately acidic solutions and a yellow colour in weakly acidic and alkaline solutions
<99 - 104>
Material used in this work: Methyl orange, Art. No. 1322, Lot No. 003 L687522, E.Merck, Darmstadt
N N N
CH 3
O3SCH 3
N N N
CH 3
O3SCH 3H
+
N N N
CH 3
O3SCH 3
+
H
+ OH-
++ H-
-
-
Sodium salt of MO
(Yellow)
Protonated form of MO
(Pink-red)

Experimental Part / Materials 37
2.1.9 Model drug: Nicotinamide
Figure 2.7: Structural formula of nicotinamide
Nicotinamide has many synonyms such as Nicotinamidum, Niacinamide, Nicotinic acid
amide, Nicotylamide, vitamine B3, vitamine PP and Pyridine-3-carboxamide. The
chemical structure is C6H6N2O, with the molecular weight of 122.1 g/mol.
Nicotinamide has the actions described under nicotinic acid but it has no vasodilator
action. Nicotinamide is therefore used as an alternative to nicotinic acid for the
prevention and treatment of pellagra. Pellagra is characterised by loss of appetite,
lethargy, weakness, diarrhoea, dermatitis and mental changes.
It is a white crystalline powder or colourless crystals with a faint characterictic odour and
a salty and bitter taste. The melting point is 128 to 131 °C. It absorbs insignificant
amounts of moisture at relative humidities up to about 90 % at 25 °C. It is soluble in
water (1:1), in alcohol (1:1.5) and in glycerol (1:10). It is slightly soluble in chloroform
and ether. A 5 % w/v solution in water has a pH of 6 to 8. The pKa is 3.3 at 20 °C. The
solution of nicotinamide 1 part in 50,000 part of water has a ratio of ultraviolet
absorption of A 245nm/A262nm between 0.63 and 0.67. The values of specific absorption of
nicotinamide in different media are A (1 %, 1 cm) = 410 at 260 nm in 0.1 M HCl, A (1 %,
1 cm) = 221 at 262 nm in MeOH, A (1 %, 1 cm) = 231 at 262 nm in 0.1 M NaOH. The IR
spetrum of nicotinamide in KBr shows bands in the following regions; 3360, 3140, 1660,
1590, 1400, 1370, 1185, 1010, and 660 cm –1 <110 - 113>.
N
C
NH2
O

38 Experimental Part / Materials
Materials used in this work: Nicotinamide, Art. No. 183830, Batch No. 96010810, Synopharm GmbH, Hamburg
Nicotinsäureamid Testsubstanz, Art. No. 6828, Batch No. K 16823528, Merck KGaA,
Darmstadt
2.1.10 Colour Four different colours used as markers will be discussed in details in the following part
<39,57>. 2.1.10.1 Blue colour
The blue colour was achieved from Indigotin blue. The synonyms of indigotin blue are
such as indigo carmin, indigo-Karmin, L-Blau 2, E 132, food blue 1, acid blue 74. It is a
synthetical organic substance.
2.1.10.2 Red colour
The red colour was achieved from L-Rot Z 3020, extra conc bes.rein, G.Siegle &
Co.GmbH, Stuttgart. This colour has many synonyms such as erythrosin BS, LB-Rot 1,
L-Rot 11, E127, food red 14, acid red 51. It is a synthetical organic substance.
2.1.10.3 Orange colour
The orange colour was achieved from L-Orange Z 2010, extra conc bes.rein, G.Siegle &
Co.GmbH, Stuttgart. This colour has many synonyms such as Gelborange S, jaune
orange S, jaune soleil, sunset yellow FCF, L-Orange 2, E 110. It is a synthetical organic
substance.
2.1.10.4 Green colour
The green colour was achieved from L-Grün Z 6130, extra conc bes.rein, G.Siegle &
Co.GmbH, Stuttgart. This colour is the mixture of E 102 and E 132. E102 is known as
tartrazine and E 132 is indigotin which was mentioned before.

Experimental Part / Materials 39
2.1.11 Plasticizers 2.1.11.1 Polyethylene glycol (PEG) Empirical formula:
HOCH2(CH2OCH2)mCH2OH when m represents the average number of oxyethylene groups.
Polyethylene glycol is an addition polymer of ethylene oxide and water. PEG has many
synonym such as Carbowax, Macrogol, Macrogolum and Lutrol. The CAS registry
number is 25322-68-3 <135,136>.
Polyethylene glycol is available in different grades. PEG grades 200 - 600 are liquids
whilst grades 100 and above are solids at ambient temperatures. Liquid grades occur
as clear, colorless or slightly yellow-coloured, viscous liquids. They have a slight but
characteristic odor and bitter, slightly burning taste. The liquid form is very hygroscopic,
although hygroscopicity decreases with increasing molecular weight. The example of
the liquid form is PEG 400 which has an average molecular weight of 380 - 420, its
value of hydroxy is 264 - 300. Solid grades are white or off-white in color, and range in
consistency from pastes to waxy flakes. They have a faint, sweet odor. The solid form is
not hygroscopic. The example of the solid form is PEG 4000 which has an average
molecular weight of 3000 - 4800, its value of hydroxy is 30 - 36. The pH of 5 % w/v
solution of PEG 4000 is 4.5 - 7.5. All grades of PEG are soluble in water and miscible in
all proportions with other PEGs. The liquid form is soluble in acetone, alcohol, benzene,
glycerin and glycols. The solid form is soluble in acetone, dichloromethane, ethanol and
methanol. They are slightly soluble in aliphatic hydrocarbons and ether but insoluble in
fats, fixed oils and mineral oil.
Polyethylene glycols are widely used in a variety of pharmaceutical formulations
including parenteral, topical, ophthalmic, oral and rectal preparations. They function as
an ointment base, a plasticizer, a solvent or a lubricant in tablet or capsule formulations.
Materials used in this work: Polyglykol 400, Product No. IOPC10, Lot No.E06396218, Hoechst AG, Burgkirchen.
From the certificate of analysis this batch has an average molecular weight of 380 - 420,
its value of hydroxy is 267 - 295. The pH of 10 % solution is 6.9.

40 Experimental Part / Materials
Polyglykol 4000S, Product No. IOPI20, Lot No.E06395713, Hoechst AG, Burgkirchen.
From the certificate of analysis this charge has an average molecular weight of 3700 -
4500, its value of hydroxy is 25 - 30. The pH of 10 % solution is 6.4.
2.1.11.2 Dibutyl sebacate (DBS)
CH3 (CH2)3 – O –C (CH2)8 C– O –(CH2)3– CH3
Figure 2.8: Structural formula of DBS Dibutyl sebacate consists of the ester of n-butanol and saturated dibasic acids,
principally sebacic acid. DBS has many synonyms such as butyl sebacate, decanedioic
acid dibutyl ester, dibutyl decanedioate, dibutyl 1,8-octanedicarboxylate or sebacic acid
dibutyl ester. The chemical mane is di-n-butyl sebacate. The CAS registry number is
109-43-3. The empirical formular is C18H34O4 with a molecular weight of 314.47.
DBS is a clear, colourless, oily liquid with a bland to slight butyl odor. It is soluble in
ethanol, propan-2-ol and mineral oil but practically insoluble in water.
DBS can be used in oral formulations as a plasticizer for film coatings. It can also be
used as a synthetic flavor and flavor adjuvant in food products e.g. ice cream and
nonalcoholic beverages <44,45>.
Material used in this work: Dibutyl sebacate, Lot No. 374235/1 13998 and 384343/1 33399, Fluka Chemie AG,
Buchs, Switzerland
O O

Experimental Part / Materials 41
2.1.11.3 Diethyl phthalate (DEP)
Figure 2.9: Structural formula of DEP Diethyl phthalate has many synonyms such as ethyl phthalate, palatinol A, phthalic acid
ethyl ester or ethyl benzene-1,2-dicarboxylate. The chemical structure of DEP is
C12H14O4 with a molecular weight of 222.24. The chemical name is 1,2-benzene-
dicarboxylic acid, diethyl ester. The CAS registry number of DEP is 84-66-2. DEP
should contain not less than 98 percent and not more than 102 percent of C12H14O4,
calculated on the anhydrous basis.
DEP is a clear, colourless, oily liquid. It is practically odorless, or with a very slight
aromatic odor and a bitter, disagreeable taste. The solubility of DEP is 1 g in 1 L water.
It is miscible with ethanol, acetone, dichloromethane or isopropanol. DEP can be used
as a plasticizer for film coating on tablets, beads and granules. It is also used as an
alcohol denaturant or as a perfume fixative in the perfumery <46,47>.
Material used in this work: Diethyl phthalate, Lot No. 8223231000, S 24263749, Merck-Schuchardt, Hohenbrunn
O
O
CH3
CH3
O
O

42 Experimental Part / Materials
2.1.11.4 Triethyl citrate (TEC)
Figure 2.10: Structural formula of TEC
Triethyl citrate has many synonyms such as citric acid ethyl ester, ethyl citrate and
Citroflex 2. The chemical name is 2-Hydroxy-1,2,3-propanetricarboxylic acid, triethyl
ester. The CAS registry number is 77-93-0. The empirical formula is C12H20O7 with a
molecular weight of 276.29.
TEC occurs as a bitter tasting, odorless, practically colorless, oily liquid. The solubility of
TEC is 1 part in 125 parts of peanut oil, 1 part in 15 parts of water. It is miscible with
95% ethanol or ether. The viscosity at 25 °C is 35.2 mPa.s. TEC can be used as a
plasticizer for aqueous based coatings in oral formulations. Moreover, in the food
products it can be used as sequestrant and in cosmetics as a deodorizing agent
<193,194>.
Material used in this work: Triethyl citrate, p.a., Lot No. S24374806, Merck-Schuchardt, Hohenbrunn
Plasticizer Boiling point Vapor density Vapor pressure Water solubility (°C) (air = 1) (mmHg) (% w/w)
DEP 295 7.66 100 at 220 °C 0.15
DBS 349 10.80 10 at 200 °C 0.01
TEC 294 9.7 1 at 107 °C 6.5
Table 2.2: Properties of three types of plasticizers <179,205>.
CH2COOC2H5
COOC2H5
CH2COOC2H5
HO C

Experimental Part / Materials 43
2.1.12 Additives 2.1.12.1 Magnesium stearate Empirical formula:
[CH3(CH2)16COO]2Mg
Magnesium stearate is a compound of magnesium with a mixture of solid organic acids
obtained from fats and consists chiefly of variable proportions of magnesium stearate,
magnesium palmitate and magnesium oleate. Magnesium stearate has many synonyms
such as magnesium octadecanoate, magnesii stearas, stearic acid magnesium salt.
The chemical name is octadecanoic acid magnesium salt. The CAS registry number is
557-04-0. The empirical formula is C36H70MgO4 with a molecular weight of 591.27.
Magnesium stearate is a fine, white, precipitates or milled, impalpable powder of low
bulk density, having a faint, characteristic odor and taste. The powder is greasy to the
touch and readily adheres to the skin. It is practically insoluble in ethanol, ether and
water but slightly soluble in warm benzene and warm ethanol. Magnesium stearate is primarily used as a lubricant in capsule and tablet formulations
at the concentration between 0.25 - 5 %. Because of its hydrophobicity it may retard the
dissolution of a drug from a solid dosage form, therefore the lowest possible
concentration is preferred to be use <94>.
Material used in this work: Magnesium stearate, Lot No. 91320, Riedel-de Haen, Seelze
2.1.12.2 Talc Empirical formula:
Mg6(Si2O5)4(OH)4
The synonyms of talc are such as French chalk, purified talc, talcum, soapstone or
steatite. It is a purified, hydrated, magnesium silicate which may contain a small variable
amounts of aluminium silicate and iron. The CAS registry number is 14807-96-6
<182,183>.

44 Experimental Part / Materials
Talc is a fine, white to grayish white, impalpable, odorless, crystalline powder. It is
unctuous, adheres readily to skin, soft to touch and free from grittiness. It is insoluble in
water, organic solvents, cold acids and dilute alkalis. The particle size distribution varies
with the source and grade of talc but normally 73 - 90 % were less than 2 µm. The
concentration of 1 - 10 % w/w can be used as lubricant or glidant in tablet and capsule
manufacture, whereas at the concentration of 5 - 30 % w/w, it is used as filler for tablets
and capsules. It was used as a dust powder at the concentration of 90 - 99 % w/w.
Material used in this work Talc, asbest-free, Batch No. 97030190, Synopharm GmbH, Barsbüttel
2.1.12.3 Colloidal silicon dioxide
Colloidal silicon dioxide has many synonyms such as colloidal anhydrous silica, high
dispersed silicium dioxide, silica colloidalis anhydrica, silicium dioxydatum dispersum.
The CAS registry number is 7631-86-9. Colloidal silicon dioxide is a submicroscopic
fumed silica prepared by the vapor-phase hydrolysis of a silicon compound. It contains
not less than 99 percent and not more than 100.5 percent of SiO2.
Colloidal silicon dioxide is a light, fine and white amorphous powder. It is odourless and
has a particle size of about 15 nm. It is practically insoluble in water and in mineral acids
with the exception of hydrofluoric acid. It dissolves in hot solutions of alkali hydroxides.
Colloidal silicon dioxide can be used as a glidant in oral formulations such as tablets
and capsule. Sometimes it is used as a stabilizer in a suspension or as an adsorbance
for drying of hygroscopic powder or granules <37,38>.
Material used in this work: Aerosil 200, Lot No. 28002, Degussa, Frankfurt

Experimental Part / Materials 45
2.1.12.4 Polysorbate 80 The synonym of polysorbate 80 is polyoxyethylene 20 sorbitan monooleate. The
chemical name is sorbitan, mono-9-octadecenoate poly(oxy-1,2-ethanediyl) derivatives.
The CAS registry number is 9005-65-6. Polysorbate 80 is an oleate ester of sorbitol and
its anhydrides copolymerized with approximately 20 moles of ethylene oxide for each
mole of sorbitol and sorbitol anhydrides. It is a yellow to amber coloured oily liquid with
a mild odour and a bitter taste. It is soluble in water, ethanol but not soluble in mineral
oil. Normally it is used as a surfactant <137-139>.
Material used in this work: Tween 80, Lot No. 394974/1, 20599, Sigma-Aldrich Chemie GmbH, Steinheim
2.1.12.5 Poloxamer 407 General formula:
HO(C2H4O)101(C3H6O)56(C2H4O)101H
Poloxamer 407 is a polyoxyethylene – polyoxypropylene – blockcopolymer. Poloxamer
has many synonyms such as Pluronic, poloxalkol, polyethylene - propylene glycol
copolymer, or Supronic. The content of polyoxyethylene in Poloxamer 407 is about
70 %. The CAS registry number is 9003-11-6.
Poloxamer 407 is white, coarse-grained powder. The molecular weight (MW) is 9840-
14600 g/mol. The pH of a 2.5 % solution in water is 5 - 7.5. It is soluble in water, ethanol
95 % and iso-propanol but it is not soluble in ether, paraffin and fatty oil. Poloxamer 407
can be used as a thickening agent, a gel formation agent or a co-emulsifier. It can also
be used as a stabilizer for topical or oral suspensions because it has an effect to the
viscosity of the formulation <132-134>.
Material used in this work: Lutrol F127, Batch No. 380184, BASF Aktiengesellschaft, Ludwigshafen
All substances were received from the companies in Germany with the exception of
those substances where the other countries have been indicated.

46 Experimental part / Analytical methods
2.2 Analytical Methods 2.2.1 Determination of thickness and morphology of pellets by scanning
electron microscope (SEM)
The thickness and the morphology of pellets has been determined by using the
scanning electron microscope {55,56}. Both the whole and the cut pellets were
investigateded under SEM. Three coated or layered pellets can be well devided into two
parts by using a surgical blade {57} and then the samples of 6 half pellets or three of the
whole pellets (n = 3) from different products were fixed onto the aluminium plate which
was covered with double-sided carbon tape. The mounted samples were coated with
gold under vacuum before investigation at 10 - 12 kV under SEM. The best suited
magnifications for revealing the film thickness and morphology were selected. One
picture was taken from each of half a pellet so that at the end 6 pictures were resulted.
The mean thickness of each product was calculated from 6 values (n = 6).
2.2.2 Determination of diameter of pellets
The size of pellets in form of a diameter before and after each coating process was
determined in order to follow up the running process.
2.2.2.1 Calibration and validation
Calibration
The image analysis system {35,36} coupled with a digital camera {37} connected to a
Nikon-camera {9} using an adapter was calibrated before use by utilizing a standard
glass-plate {49}, which gave the value of pixel per micrometer. The following data show
values of the calibration for this condition of the image analysis.
Scale X = 16.15 ± 0.02 µm/pixel (n = 3, p < 0.05), Total picture size = 48 µm
Scale Y = 16.23 ± 0.02 µm/pixel (n = 3, p < 0.05), Total picture size = 35 µm
Validation
The validation to prove the accuracy of the system was performed by using metallic
spherical balls {59} in three sizes. These metallic balls have exactly defined diameters

Experimental part / Analytical methods 47 with a known standard deviation as shown in Table 2.3 and therefore they are an ideal
object for the validation. Ten balls (n = 10) at each size were used for the validation.
The balls were arranged on a lustreless black surface of velour-type paper. A top light
{42} was used to light up the pellets. The colour pictures of pellets were taken. These
pictures were converted with a help of software {S3} into grey pictures, which afterwards
have been converted again into binary pictures. The binary pictures have been
analysed by the software integrated in the image analyser. The diameter (D), equivalent
to the sphere which had the same projected area as the object, was automatically
calculated by the computer {35}. Data of the validation of this combination were shown
in Table 2.3.
Theoretical diameter (µm)
(n = 10) Experiential diameter (µm)
(n = 10) 2002 ± 1 2020 ± 20
1500 ± 1 1520 ± 20
1001 ± 1 1020 ± 20
Table 2.3: Validation data as diameter of the spherical balls with the purpose of
determination of diameters of pellets.
2.2.2.2 Measurement of diameters of pellets
The number of 100 - 150 pellets of each product were measured by using the image
analyser combined with a camera as described above. Pellets were arranged so that
they did not touch each other on a lustreless black surface of velour-type paper
{No. 024750/2, Herlitz PBS AG, Berlin}. The pictures of these pellets were taken and
converted in the same way as mentioned in 2.2.2.1. Finally, the mean diameter with
standard deviation for each product was calculated and reported.
2.2.3 Sieve analysis of pellets
In order to know the size distribution of the pellets before and after the coating process,
the sieve analysis was performed. This test in the combination with the test from 2.2.2
will give more details about size and size distribution of coated pellets or cores. For this

48 Experimental part / Analytical methods test the amount of about 20 g per product were fractioned by applying a sieve set of 6
sieve sizes i.e. 800, 1000, 1120, 1250, 1400 and 1600 µm {4} and these sieves were
fixed at the two dimensional vibrating sieve machine {58} at the medium vibrating level
and shaking for 5 min. After finishing the vibration the product laying on each sieve size
was collected and weighed using an analytical balance {1}.
2.2.4 Weighing of pellets
The weight of each product was measured in order to know the real mass of coating
materials layered on the surfaces of cores. The weighing process was carried on with all
products such as sugar spheres, HPMC coated pellets, nicotinamide layered pellets and
enteric coated pellets. Up to100 pellets of each product have been weighed on an
analytical balance {2}: Portions of 10 pellets were counted and then weighed up to a
total number of 100 pellets. The weight of 10 pellets was noted and the mean weight
and the standard deviation of these 10 measurments calculated. The weight of one
pellet can be calculated from these 10 values.
2.2.5 Determination of form and size of particles
The form and size of some particles such as additives or polymer used in the coating
formulation was important. Normally the particle size of substances used in this
formulation should be as small as possible in order to avoid the blockage of the
spraying nozzle. The simple method to observe form and size was the use of the
microscopic method which, however, gave only the two dimensional information. This
method was simplified by combination with a video camera and imaging system
integrated with a software programm.
2.2.5.1 Calibration
The image analysis system {35,36}, coupled with a digital camera {37} connected to a
light microscope {40} with an objective of 10x using an adapter and a top light {41}, was
calibrated before use by utilizing a standard glass-plate {50}, which gave the value of
pixel per micrometer. Data below show values of the calibration of this combination.

Experimental part / Analytical methods 49 Scale X = 1.3296 ± 0.0017 µm/pixel (n = 3, p < 0.05), Total picture size = 1021 µm
Scale Y = 1.3362 ± 0.0017 µm/pixel (n = 3, p < 0.05), Total picture size = 758 µm
2.2.5.2 Measurement of form and size of particles
Particle size and form of substances that are not water soluble such as talc or
magnesium stearate were detemined in order to use the data for supporting the
decision whether these substances can be incorporated into the coating dispersion or
not. Talc or magnesium stearate may hinder the twins formation during or after finishing
the coating process but their size should be fine enough to avoid a blockage of the
nozzle during spraying. For this test the substance was first dispersed in glycerol 85 %
{Glycerin, Lot No. 933 K 12503393, E.Merck, Darmstadt} in a dilute dispersion on the
glass plate {Microscope slides, 76 x 26 mm, ready to use, Lot No. 1243380, Carl Roth,
Karlsruhe} before pictures of them were taken. Only the big particle size that can be
seen under the microscope was considered. Fine particles that were in the high portion
were not considered as they may not cause problems of blockage. Moreover, two types
of talc i.e. before and after grinding with a jet mill {38}, were determined to observe the
effect of the milling process.
The formulations containing CAP, TEC and HPMC-AS were also investigated by the
microscopic method before using as a coating dispersion in the process in order to
determine the big particles or aggregates that may happen after the mixing process or
during processing time.
2.2.6 Determination of swelling
Enteric coated products should not swell after contact with an acidic medium. However,
if this process occurs, this will cause a failure of resistance against artificial gastric fluid.
Some works <185,187> had mentioned a problem of swelling of enteric coated
polymers especially cellulose derivatives. Mostly the weighing method was used in this
case to determine the swelling property. In this work, however, the diameter of the
products under a light microscope was used to calculate the percentage of swelling.
This method allows to follow up the swelling or dissolving of coated products against
time and therefore problems by eliminating a medium were not involved.

50 Experimental part / Analytical methods 2.2.6.1 Calibration and validation
Calibration
The image analysis system {35,36}, coupled with a digital camera {37} connected to a
light microscope {41} with the objective of 16x using an adapter and a ring-light from the
top, was calibrated before use by utilizing a standard glass-plate {50}, which gave the
value of pixel per micrometer. Data below show values of the calibration.
Scale X = 6.0288 ± 0.0096 µm/pixel (n = 3, p < 0.05), Total picture size = 4630 µm
Scale Y = 6.0350 ± 0.0086 µm/pixel (n = 3, p < 0.05), Total picture size = 3422 µm
Validation
Validation was performed with the metal balls as mentioned before. The validation data
using metallic balls {59} are show in Table 2.4.
Theoretical diameter (µm) (n = 10)
Experiential diameter (µm) (n = 10)
2002 ± 1 2020 ± 10
1500 ± 1 1515 ± 9
1001 ± 1 1015 ± 6
Table 2.4: Validation data as diameter of the spherical balls with the purpose of
determination of swelling of pellets.
2.2.6.2 Measurement of swelling of pellets
To observe the swelling process the pellets have been fixed onto a glass plate and laid
into the glass petridish. The acid medium 0.1 N HCl was poured into the petridish. The
first colour picture of pellet was taken by using the image analyser coupled with a light
microscope (as described before in 2.2.6.1) after the image was focused as soon as
possible, normally after less than 30 sec. The second colur picture was taken after the
diameter reached a maximum swelling level or after 2 h. The comparison between the
diameters at the beginning and the end gives the information about the swelling or

Experimental part / Analytical methods 51 dissolving of coated pellets. The percentage of the swelling can be calculated as shown
below;
% swelling = (D2 - D1) x 100
D1
D1 = Diameter (µm) of the pellet at the starting time in 0.1 N HCl after adjusting the
sharpness of an image
D2 = Diameter (µm) of the pellet after 2 h or at the highest swelling in 0.1 N HCl
2.2.7 Determination of colour change of methyl orange of CAP coated pellets
As the colour of methyl orange can change from yellow (basidic medium) to pink (acidic
medium) as mentioned before in the part 2.1.8, it can be used as an indicator for a fast
test of a resistance against artificial gastric fluid. The use of methyl orange in the
preformulation of enteric coated products was also mentioned in the work of Schmidt
and Teuber <170>, therefore the use of methyl orange was also carried out in this work.
The observation of colour change of methyl orange can be easily done by using a light
microscope coupled with a video camera and an image system as mentioned in the part
2.2.6. This system allowed the follow-up of the process of colour changing. If the enteric
coated products were resistant against acidic medium their colour did not change. If the
colour changed from yellow to pink after a certain time this indicated that the enteric
coated layer cannot hinder the diffusion of acidic medium into the core.
This test was therefore carried out by using 6 pellets per product. They were fixed onto
a glass plate by double-sided tape, which laid in a glass petridish. The acidic medium
(0.1 N HCl) was poured into the petridish. The colour picture of each pellet was
recorded by the image analyser, coupled with a light microscope {41} and the objective
of 16x, as fast as possible after the pellet contacted the acid medium. Normally it took
less than 30 sec. After this, one picture was taken every minute with an automatic
software programm up to 30 min for each product. The time at which the colour of the
pellet changed to pink and had constant intensity was recorded as judged by the
experienced eye. This time period demonstrated the diffusion of 0.1 N HCl into the inner
HPMC-MO layer.

52 Experimental part / Analytical methods 2.2.8 Determination of the content of methyl orange in coated pellets
It was important to determine the content of methyl orange incorporated in coated
pellets because this value will reveal the amount of coated pellets that should be used
for release studies in the part 2.2.16. Moreover, the ratio of methyl orange and phthalyl
groups in the CAP-polymer can be calculated as mentioned in the part 2.2.9. The
simple method for determination of the content is to make use of ultraviolet-
spectrophotometer. As methyl orange can absorb UV light at different wavelengths as
mentioned in the part 2.1.8, this property will therefore allow the determination of the
content both in an acidic or a basic medium.
2.2.8.1 Calibration and validation
Calibration
First of all the wavelength at which the maximum absorption occured should be found.
The solution of methyl orange in 0.1 N HCl should be prepared. The absorption curve
versus wavelength of this solution was determined by the UV-spectrophotometer {68}
using a 1 cm quartz-cuvette {11} scanned from 300 to 600 nm. The example of the UV-
spectrum was shown in Figure 2.11. It shows that the maximum absorption occured at
the wavelength of 508 nm. The absorbance at 508 nm is 0.4736 in this figure and the
concentration of methyl orange is 0.4871 mg/100 ml. This wavelength of 508 nm was
used later on to determine the concentration of known solutions to create the calibration
curve of methyl orange in 0.1 N HCl.

Experimental part / Analytical methods 53
Figure 2.11: UV-spectrum of methyl orange (0.4871 mg/100 ml) in 0.1 N HCl.
To create the calibration curve, three stock solutions were prepared by accurately
weighing {2} methyl orange of about 0.006 g. This amount of methyl orange was then
placed into a 100 ml-volumetric flask {Volumetric flask 100 ml, tolerance ± 0.1 ml,
Brand, Wertheim}, 0.1 N HCl {Hydrochloric acid 0.1 N, Merck KGaA, Darnstadt} was
added to have an acquired volume of 100 ml. To increase the solubility of methyl
orange in 0.1 HCl, this flask was placed in the ultrasound bath for 30 min. Each of the
stock solutions was diluted into 5 concentrations by pipetting 1.00, 1.50, 2.00, 2.50 and
3.00 ml, repectively {Volumetric pipettes 1, 2, 3 ml, tolerance ± 0.01 ml, measuring
pipettes 5 ml, tolerance ± 0.02 ml, Brand, Wertheim} and filling to 25.00 ml {Volumetric
flask 25 ml, tolerance ± 0.04 ml, Brand, Wertheim} with 0.1 N HCl. The absorbances of
these solutions were measured at 508 nm in triplicate. Therefore from each stock
solution there were 15 values of absorbance. At the end there were 45 values for use to
calculate the regression line by using the statistic programm Toccata {S4}. The result of
45 values showed the linearity and the homogenity at the confidential level of 95 %. The
equation (Eq-1) was used for calculating the concentration of the unknown solution of
methyl orange in 0.1 N HCl. The residual plot of absorbances versus concentrations
was shown in Figure 2.12.
0.0
0.1
0.2
0.3
0.4
0.5
0.6
350 400 450 500 550 600Wavelength (nm)
Abs
orba
nce

54 Experimental part / Analytical methods Y = 0.9727 X ......................... ( Eq-1) Y was absorbance at 508 nm
X was concentration of methyl orange (mg/100 ml) in 0.1 HCl
The standard deviation of the slope was 5.0 x 10 –5. Therefore the specific absorption A
(1 %, 1 cm) of methyl orange in 0.1 N HCl from this work was 973. The limits of
detection and determination were 3.3047 x 10 –4 and 6.6094 x 10 –4
mg/100 ml, respectively.
Figure 2.12: Residual plot of 45 values of the calibration curve of methyl orange in
0.1 N HCl, using UV-method.
Validation
The validation was carried out by using the known solution at the concentration of 0.5
mg/100 ml. This is notified as a theoretical concentration. This solution was pumped
using a peristaltic pump {51} at the pump rate of 5 g/min through the tubing set which
contained two types of tubes i.e., the flexible tube {Tygon-Schlauch D, 1.6 x 0.8 mm,
Art. No. 132050, Lot No. 9903251, R3603, Desaga, Heidelberg} for a peristaltic pump
and the non-adhesion tube {PTFE, 1.6 x 3.2 mm, Art. No. 2717300090 VE1, Otto
Steiner, Hamburg} for transportation of solution into the 1 cm-quartz flow-through
cuvettes {12}. The absorption at 508 nm was noted and the real concentration of the
-0.0005
-0.0003
-0.0001
0.0001
0.0003
0.0005
0.0 0.1 0.2 0.3 0.4 0.5 0.6 0.7 0.8
Concentration of methyl orange in 0.1 N HCl (mg/100ml)
Res
idua
l of a
bsor
banc
es

Experimental part / Analytical methods 55 solution was calculated by using the calibration curve. The result showed that the real
concentration was not signifcantly different from the theoretical concentration.
2.2.8.2 Measurement of content of methyl orange in one pellet
The amount of methyl orange in one pellet was determined by using the equation „Eq-1“
from 2.2.8.1, at a maximum absorption of methyl orange at 508 nm in 0.1 N HCl. About
71 mg or 68 pellets of methyl orange-loaded pellets were accurately weighed {5} and
dissolved in a 10 ml-volumetric flask {Volumetric flask 10 ml, tolerance ± 0.04 ml, Brand,
Wertheim}. The volume was adjusted to 10 ml by adding 0.1 N HCl. This flask was put
into an ultrasound bath {67} for 30 min to dissolve methyl orange from the pellets. The
dispersion was filtered through 0.45 µm pore size filter {Rotilabo Spritzenfilter, Art No.
P8161, PTFE, Carl Roth, Karlsruhe} to have a clear solution before measuring the
absorbance at 508 nm in a UV-spectrophotometer {68}. For example if this solution has
the absorption of 0.5, the concentration of methyl orange in 100 ml is 0.51 mg. Five
samples from each batch were measured after this procedure. The results are shown
together with the standard deviation of the content in absolute weight (mg) and % w/w
which was calculated on the basis of the mean weight of one methyl orange-loaded
pellet.
2.2.9 Calculation of phthalyl content in coated pellets
It was important to know the content of phthalyl in coated pellets in order to calculate
the ratio between methyl orange and phthalyl groups in CAP polymer. This ratio may
indicate the possible salt formation between hydrogen atom of phthalic acid group of
CAP and nitrogen atom of methyl orange, as indicated in the part 2.2.11. The
calculation will be done only with the product containing methyl orange in order to have
an idea about possible salt formation.
As mentioned in Ph.Eur. <30> or BP <27>, CAP should contain not less than 30 % and
not more than 40 % of phthalyl groups, whereas the limit in USP XXIV <26> is 30 % -
36 %. Therefore for this work the mean content of 35 %, based on Ph.Eur. 1997 <30>,
will be used for calculation. As mentioned in the certificate of analysis of Aquacoat CPD,
the dispersion of Aquacaot CPD contained 29 - 32 % of solid content and therefore the

56 Experimental part / Analytical methods mean value of 30 % will be used for the calculation. This amount of solid content had
19 - 27 % of CAP, so that the mean value of 23 % will be used for the calculation.
The increase of coated solid amount on the cores will surely increase the amount of
phthalyl content. Therefore the calculation was done on basis of different products. The
result of calculated phthalyl content (µg or mmole) and its ratio to methyl orange will be
demonstrated.
Hereafter an example of the result from the calculation is given:
Product B has a weight gain of 4.5 % w/w from the coating formula R 11, Table 2.25,
the mean weight of one pellet is 1.07 mg, part 3.1.1
The amount of solid content of coating materials in one pellet (A1 = mg) can be
calculated as follows;
A1 = (% weight gain x weight of one pellet) / 100 .............. Eq-2
The amount of Aquacoat in one pellet (A2 = mg) can be calculated as follows;
A2 = (100 x A1) / 125 .............. Eq-3
The amount of CAP in one pellet (A3 = µg) can be calculated as follows;
A3 = (23 x 1000 x A2) / 100 .............. Eq-4
The experiental amount of phthalyl in one pellet (A4 = µg) can be calculated as follows;
A4 = (A3 x 35) / 100 .............. Eq-5
The ratio of methyl orange and content of phthalyl in one pellet (A5 = µg) can be
calculated as equation Eq-6. The molar content of phthalyl (A6 = mmole) can be
calculated by dividing A5 by the molecular weight of phthalyl groups i.e. 149.
A5 = (amount of methyl orange in µg) / A4 .............. Eq-6
A6 = A5 / 149 .............. Eq-7
2.2.10 Determination of the content of nicotinamide in coated pellets
It was necessary to determine the content of nicotinamide incorporated in coated pellets
because this value will reveal the amount of coated pellets that should be used for
release studies in the part 2.2.15. The simple method for determining the content is to
use UV-spectrophotometer {68}. Nicotinamide can absorb UV light at different
wavelengths as mentioned in the part 2.1.9. This property will therefore allow the
determination of content whether in 0.1 N HCl, buffer pH 6.8 <126>, 1.5 NaCl or a
mixture of MeOH and water (50 + 50 ml). This work showed the values of the specific

Experimental part / Analytical methods 57 absorption of nicotinamide in different media as follows; A (1 %, 1 cm) = 420 at 261 nm
in 0.1 N HCl, A (1 %, 1 cm) = 255 at 262 nm in buffer pH 6.8, A (1 %, 1 cm) = 254 at
262 nm in 1.5 NaCl, and A (1 %, 1 cm) = 263 at 262 nm in a mixture of MeOH and
water.
2.2.10.1 Calibration and validation
Calibration
First of all the wavelength at which the maximum absorption occured should be found.
The solution of nicotinamide in two media e.g. 0.1 N HCl or buffer pH 6.8 <126> should
be prepared. The absorption curve versus wavelength of this solution was determined
by the spectrophotometer {68} using a 1 cm quartz-cuvette {11} scanned from 240 nm
to 290 nm. The example of the UV-spectrum was shown in Figure 2.13, which shows
the maximum absorption of nicotinamide in buffer pH 6.8 at the wavelength of 262 nm,
whereas the maximum absorption in 0.1 N HCl occured at 261 nm (data not shown). In
Figure 2.13 the absorbance at 262 nm is 0.4776 and the concentration of the known
concentration of nicotinamide is 1.8702 mg/100 ml. The ratio between absorption at
245 nm and 262 nm was 0.663. This was in agreement with the reference <111>. One
of these two wavelengths i.e., 261 and 262 nm was used for detection of nicotinamide
later on in the medium of 0.1 N HCl or buffer pH 6.8, respectively.
Figure 2.13: UV-spectrum of nicotinamide (1.8702 mg/100 ml) in buffer pH 6.8.
0.0
0.1
0.2
0.3
0.4
0.5
0.6
240 250 260 270 280 290Wavelength (nm)
Abs
orba
nce

58 Experimental part / Analytical methods To create the calibration curve for each medium (0.1 N HCl or buffer pH 6.8), two stock
solutions were prepared by accurately weighing {3} nicotinamide of about 0.01 g in a
250 ml-volumetric flask {Volumetric flask 250 ml, tolerance ± 0.15 ml, Brand, Wertheim}.
0.1 N HCl or buffer was then added to have an acquired volume of 250 ml. Each stock
solution was diluted in 7 concentrations by pipetting 2.00, 3.00, 3.50, 4.00, 4.50, 5.00,
and 6.00 ml, respectively {Volumetric pipettes 2, 3, 4, 5, 6 ml with tolerance ± 0.01 ml,
measuring pipittes 5 ml tolerance ± 0.02 ml, Brand, Wertheim} and filling to 10.00 ml
with 0.1 N HCl or buffer. The absorbance at 261 nm for 0.1 N HCl or at 262 nm for
buffer pH 6.8 of these solutions were measured in triplicate. Therefore from each stock
solution there are 24 values of absorbances. At the end there are 48 values for use to
calculate the regression line by using the statistic programm Toccata {S4}. The result of
48 values showed the linearity and the homogenity at the confidential level of 95 %. The
two equations, i.e. Eq-7 or Eq-8 were used for calculating the concentration of the
unknown solution of nicotinamide in 0.1 N HCl or buffer. The residual plots of
nicotinamide in 0.1 N HCl or buffer were in Figure 2.14 or Figure 2.15, respectively.
Y = 0.4197 X ................. (Eq-7)
Y was absorbance at 261 nm
X was concentration of nicotinamide in 0.1 HCl (mg/100 ml)
The standard deviation of the slope was ± 5.7 10 –5. The limits of detection and
determination were 2.9638 x 10 –3 and 5.9276 x 10 –3 mg/100 ml, respectively.
Y = 0.2554 X ................. (Eq-8)
Y was absorbance at 262 nm
X was concentration of nicotinamide in buffer pH 6.8 (mg/100 ml)
The standard deviation of the slope was ± 1.7 10 –5. The limits of detection and
determination were 1.8404 x 10 –3 and 3.6808 x 10 –3 mg/100 ml, respectively.
Validation
The validation was carried out by using the known solution at the concentration of 2.0
mg/100 ml. This is notified as a theoretical concentration. This solution was pump using
peristaltic pump at the pump rate of 5 g/min through the tubing set into the 1 cm quartz

Experimental part / Analytical methods 59 flow-through cuvettes. The absorption at 261 nm was noted and the real concentration
of the solution was calculated by using the calibration curve. The result showed that the
real concentration was not signifcantly different from the theoretical concentration.
Figure 2.14: Residual plot of 48 values of the calibration curve of nicotinamide in
0.1 N HCl, using the UV-method.
Figure 2.15: Residual plot of 48 values of the calibration curve of nicotinamide in
buffer pH 6.8, using the UV-method.
-0.004
-0.003
-0.002
-0.001
0.000
0.001
0.002
0.003
0.004
0.0 1.0 2.0 3.0 4.0 5.0
Concentration of nicotinamide in 0.1 N HCl (mg/100ml)
Res
idua
l of a
bsor
banc
es
-0.0015
-0.0010
-0.0005
0.0000
0.0005
0.0010
0.0015
0.0 1.0 2.0 3.0 4.0 5.0
Concentration of nicotinamide in buffer pH 6.8 (mg/100ml)
Res
idua
l of a
bsor
banc
es

60 Experimental part / Analytical methods 2.2.10.2 Measurement of content of nicotinamide in one pellet
The amount of nicotinamide in one pellet was determined by using the equation from
2.2.8.1, at a maximum absorption of nicotinamide at 262 nm in buffer pH 6.8. About
0.01 g or 15 pellets of loaded pellets or equivalent to about 1 mg of nicotinamide were
used. The pellets were accurately weighed {2} and dissolved in a 100 ml-volumetric
flask. The volume was adjusted to 100 ml by adding buffer pH 6.8. Flasks containing
nicotinamide loaded pellets were put into an ultrasound bath for 30 min to dissolve
nicotinamide from the pellets. The dispersion was filtered through 0.45 µm pore size
filter {Rotilabo Spritzenfilter, Art No. P8161, PTFE 0.45 µm, Carl Roth, Karlsruhe} to
have a clear solution before measuring the absorbance under UV-spectrophotometer
{68} at 262 nm. This test was done in triplicate for each batch. The mean value of the
three values will be shown together with the standard deviation of the content in
absolute weight (mg) and % w/w which was calculated on the basis of the mean weight
of one nicotinamide loaded pellet with or without subcoats.
2.2.11 Determination of salt formation by FTIR and NMR
First of all four products should be prepared for the test using FTIR or NMR. The first
product was a coprecipitate of 5.0 g of solid Aquacoat CPD or about 17.0 g of the
dispersion, 1.25 g of TEC and 5.0 g of methyl orange powder in 1 N HCl {Hydrochloric
acid 1 N, Ref. No. 00287/87, Carl Roth, Karsruhe}, which was prepared by dispersing all
materials together. The solvent was removed in a glass petridish under ambient
temperature in order to avoid chemical degradation of the substances. The second
product was a film from 5.0 g of solid Aquacoat CPD or about 17.0 g of the dispersion
and 1.25 g of TEC. They were prepared by removing water from the dispersion of
Aquacoat CPD and TEC in a glass petridish at ambient temperature. The third product
was methyl orange in a recrystallized form. It can be recrystallized from HCl and was
used as a reference substance for methyl orange in its protonated form of a pink colour.
The fourth product was methyl orange in the sodium salt form as a powder which was
used as received from the company. This product has a yellow colour.

Experimental part / Analytical methods 61 2.2.11.1 FTIR-technique
For recording FTIR spectra about 1 mg of each product was mixed together with
potassium bromide {Potassium bromide for spectroscopy, Uvusol, Lot No. 015B222007,
E.Merck, Darmstadt} and then compressed to a tablet of 8 mm diameter on a hand-
operated press {32} at 8 tons for 2 min. The film resulted from CAP and TEC was
dissolved in dichloromethane {LiChrosolv, Lot No. K 18537344, E-Merck, Darmstadt}
and the solution was spread on a sodium chloride disc {Sodium chloride disc for IR
spectroscopy, size 22 x 38.5 x 4, Korth Kristalle GmbH, Altenholz-Kiel}. This tablet or
disk was then placed in a FTIR chamber {24} and was scanned from 400 to 4000 cm–1.
FTIR sprectra {S5} were recorded and compared to find out a shifting of bands or new
ones.
2.2.11.2 NMR-technique
Both 1H and 13C were measued by using NMR-scpectroscopy {47}. TMS
{Tetramethylsilane 99.9 %, NMR grade, Lot No. 26907029, Sigma-Aldrich Chemie,
Steinheim} was taken as an internal standard, whereas DMSO {Dimethyl sulfoxide-d6
99.8 %, Lot No. B 4950, Deutero, Kastellaum} as a solvent. The four above mentioned
products were measured and the resulted NMR spectra {S6} were compared to find out
the difference or shift of bands.
2.2.12 Postdrying (curing) studies of enteric coated pellets
As it was mentioned <380,151> that postdrying of coated pellets may improve the film
properties. These trials were therefore carried out. Enteric coated pellets using CAP and
DEP or CAP and DBS were put in glass vials or porcelain bowl without cover and then
placed into a hot air oven {26} controlling the temperature (condition 1 and 2) or put into
the control temperature and humidity by using hygrostatic glass container containing
saturated salt and put in hot air ovens {25,26} at different temperatures (conditions 3 -
6). NaCl {Sodium chloride, Lot No. K 10352600, E.Merck, Darmstadt} used for creating
the desired humidity was analytical grade.
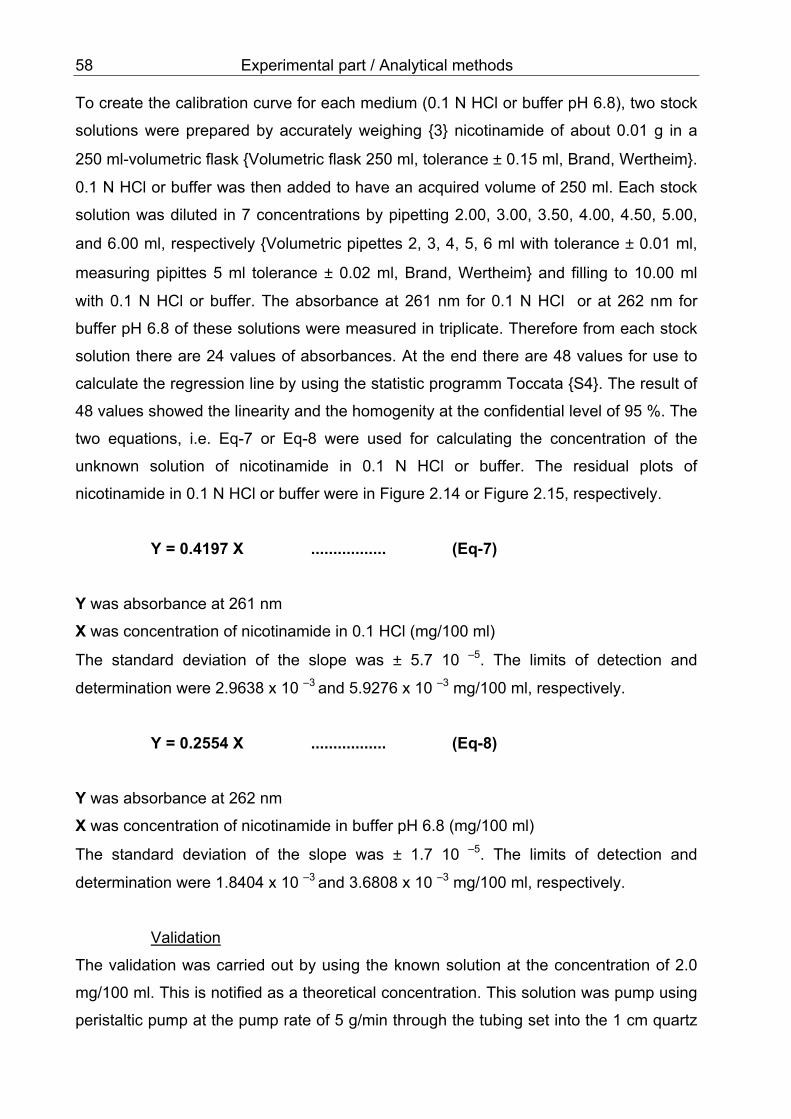
62 Experimental part / Analytical methods
Number of condition Salt Temperature(°C) Humidity (% r.h.) 1 without salt 70 -
2 without salt 80 -
3 NaCl 40 75
4 NaCl 50 75
5 NaCl 60 75
6 NaCl 70 75
Table 2.5: Postdrying conditions using a hot air oven and/or saturated salt <114>.
2.2.13 Optical characterization of pellets after storage
HPMC coated pellets without nicotinamide (Product P, part 2.4.2), which were used as
comparison products, and enteric coated pelles were determined. Only enteric coated
pellets using CAP and DEP with different subcoats, i.e. HPMC (Product EE, Table 2.26)
and a combination of PVA and EC (Product cc, Table 2.29), were put in glass vials
{Glass vials 5 ml, Lot No. B101095, Soffieria Bertolini, Torino, Italy} without cover and
then placed into the hygrostatic glass container containing different saturated salts. The
temperature of these containers were controlled by using hot air ovens {25} or a cabinet
{10} at different temperatures. The combination of salt and temperature gave the
required humidity, which was well demonstrated in Table 2.6. The products were
optically investigated in order to observe the change in colour, shiny, stickiness, etc.
over a period of time over 30 days. All substances used to create different humidities
such as NaBr {Sodium bromide, Lot No. 90310, Riedel-de Haen, Seelze}, KI {Potassium
iodide, Lot No. B 438440, E.Merck, Darmstadt}, NaNO3 {Sodium nitrate, Lot No. A
254937, E.Merck, Darmstadt}, NaCl {Sodium chloride, Lot No. K 10352600, E.Merck,
Darmstadt}, KBr {Potassium bromide, Art No. 4907, E.Merck, Darmstadt}, and
MgBr2.6H2O {Magnesium bromide-6-hydrate pure, Lot. No. 42650, Riedel-de-Haen,
Seelze} were analytical grade.

Experimental part / Analytical methods 63
Number of condition Temperature (°C) Humidity (% r.h.) Salt 1 25 {10} 57.5 NaBr
2 68.9 KI
3 74.2 NaNO3
4 75.3 NaCl
5 80.9 KBr
6 30 {25} 30.4 MgBr2.6H2O
7 56.0 NaBr
8 67.8 KI
9 73.1 NaNO3
10 75.1 NaCl
11 80.3 KBr
12 35 {25} 30.2 MgBr2.6H2O
13 54.0 NaBr
14 67.0 KI
15 79.8 KBr
16 40 {25} 30.0 MgBr2.6H2O
17 53.1 NaBr
18 66.1 KI
19 79.5 KBr
20 45 {25} 29.8 MgBr2.6H2O
21 52.0 NaBr
22 70.0 NaNO3
23 74.7 NaCl
24 79.2 KBr
25 50 {25} 29.7 MgBr2.6H2O
26 50.9 NaBr
27 79.0 KBr
Table 2.6: Storage conditions of coated pellets after Nyqvist <114> for optical
characterization.

64 Experimental part / Analytical methods 2.2.14 Determination of water content by Karl-Fischer-Titration
Water content was determined by using Karl-Fischer Titration apparatus {39}. The
method was modified from Werner <199>. The dispersing medium for pellets was the
combination of 20 ml Hydranal Solvent {Hydranal-Solvent, Art No. 34800, Lot No.
70270, Riedel-de-Haen, Seelze} and 10 ml formamide {Formamide p.a. grade, Art No.
96841000, Lot No. 250K18921184, E-Merck, Darmstadt}. The Hydranal Titrant-5
{Hydranal Titrant 5, Art No. 34801, Lot No. 72180, Riedel-de-Haen, Seelze} was used
as titrant. The dry titration of the system was first done and then the titration with
samples. These samples were prepared as follows; a standard substance or pellets
were put into the glass container containing the dispersing medium while constantly
stirring. The dispersion time for each sample was 5 min and the titration was done from
from 100 mV to 0 mV which was an endpoint. The titration rate in the first period was at
the high rate (about 2 ml/min) and near to the endpoint the rate was reduced to about
0.5 ml/min.
2.2.14.1 Calibration and validation
Calibration
The calibration of the method was done by using non-hygroscopic standard substance
for volumetric Karl-Fischer Titration. The standard substance is Hydranal Eichstandard
5, Art No. 34813, Lot No. 90330, Riedel-de-Haen, Seelze. This substance 1 ml consists
of 5.02 mg of water or 1 g consists of 5.91 mg of water. Normally the drift was not more
than 0.007 ml/min and the titer of the Titrant-5 was 4.9305 mg of water/1 ml. The result
from the determination by using this substance and the above described method
showed homogenity and linearity after Toccata {S4}. The equation used for calculating
the content of water in coated pellets was therefore as follows;
Y = 1.2118 X .................... (Eq-10)
Y was volume of Titrant-5 used (ml)
X was the weight of the standard substance (g)
The standard deviation of the slope was ± 0.0073 (ml). The limit of detection was
0.02745 g of standard substance or equivalent to water of 0.1622 mg. The limit of

Experimental part / Analytical methods 65 determination was 0.05490 g of standard substance or equivalent to water of 0.3244
mg. The residual plot showed also the well performed method for determining the
content of water in the samples because the residuals were not more than ± 0.04 ml.
Figure 2.16: Residual plot of 15 values of the calibration curve of the standard
substance, using Karl-Fischer titration.
Validation
The validation was performed by using standard substances {Hydranal Eichstandard 5,
Art No. 34813, Lot No. 90330, Riedel-de-Haen, Seelze}. The result showed that there
was no significant difference between the theoretical value of water content and the
experimental one. Consequently, this is the suitable method for determining water in the
product.
2.2.14.2 Measurement of water content in pellets
Samples of 10 - 15 mg of pellets were analyzed by dispersing them in the mixture of the
above mentioned solvent for 5 min and then the titration by using Titrant-5 was
performed.
-0.06
-0.04
-0.02
0.00
0.02
0.04
0.06
0.00 0.20 0.40 0.60 0.80 1.00 1.20 1.40
Weight of standard substance (g)
Res
idua
l of v
olum
e of
Titr
ant-5

66 Experimental part / Analytical methods 2.2.15 Determination of free phthalic acid by HPLC
The simple spectroscopic method such as UV-spectroscopy {68} was first used to see
whether it was possible to separate the two reference substances i.e. phthalic acid and
nicotinamide or not. First of all the UV-spectra of phthalic acid in different media such as
0.1 N HCl, MeOH {Methanol, LiChrosolv, Lot No. K 25904418849, Merck KGaA,
Darmstadt}, THF {Tetrahydrofuran, LiChrosolv, Lot No. I 912101949, Merck KGaA,
Darmstadt}, water, NaOH {Sodium hydroxide granules, p.a. grade, EWG No. 2151855,
Lot No. B828069618, Merck KGaA, Darmstadt} and a mixture of MeOH and water were
done by using the standard substance {Phthalic acid, Lot No. 42130, Riedel-de-Haen,
Seelze}. The values of specific absorption of phthalic acid in different media are A (1 %,
1 cm) = 77 at 275 nm in 0.1 N HCl, A (1 %, 1 cm) = 75 at 275 nm in MeOH, A (1 %, 1
cm) = 85 at 275 nm in THF, A (1 %, 1 cm) = 85 at 280 nm in water and A (1 %, 1 cm) =
52 at 272 nm in NaOH. The example of UV-spectrum of phthalic acid solution was
shown in Figure 2.17. The spectrum showed the maximum absorption at 283 nm with a
specific absorption A (1 %, 1 cm) = 87. The concentration of phthalic acid in a mixture of
MeOH and water (50 + 50 ml) was 5.96 mg/100ml.
The next step was to determine the mixture of phthalic acid and nicotinamide by using
UV-spectrophotometer. Therefore the solution of the standard mixture in a mixture of
MeOH and water (50 + 50 ml) was prepared. The concentration of phthalic acid was
4.864 mg/100ml and nicotinamide was 0.752 mg/100ml. The UV-spectrum of this
mixture was shown in Figure 2.18. It was found that the maximum absorption peaks of
phthalic acid (~ 283 nm) and nicotinamide (~ 262 nm) were not well separated and
therefore it was not possible to use UV-technique to determine the content of free
phthalic acid in the combination with nicotinamide.

Experimental part / Analytical methods 67
Figure 2.17: UV-spectrum of phthalic acid (5.96 mg/100 ml) in a mixture of MeOH
and water (50+50 ml).
Figure 2.18: UV-spectrum of a standard mixture of phthalic acid (4.864 mg/100 ml)
and nicotinamide (0.752 mg/100 ml) in a mixture of MeOH and water
(50+50 ml).
0.0
0.2
0.4
0.6
0.8
1.0
1.2
250 260 270 280 290 300 310 320
Wavelength (nm)
Abs
orba
nce
0.0
0.5
1.0
1.5
2.0
2.5
3.0
209 229 249 269 289 309Wavelength (nm)
Abs
orba
nce

68 Experimental part / Analytical methods Some authors <155,20> have reported about the determination of free phthalic acid by
using HPLC-method. Therefore in this work the modified method based on the former
reports was used. The 0.025 M phosphate buffer <125> in mixture with MeOH in
different ratio was used as eluent. Different flow rates were applied as trials in order to
reduce the retention time of the substances. However, the conditions should not be
performed with a high pressure to maintain the life of the column and other parts of the
system. Three samples, i.e. phthalic acid (1.12 mg/100ml), nicotinamide
(1.06 mg/100ml) and their mixture were prepared. If nescessary the pH {53} was
adjusted below 3 using ortho-phosphoric acid {Ortho-phosphoric acid 85 0%, p.a. grade,
Lot No. 83560, Riedel-de-Haen, Seelze}. Each solution was filled in HPLC vials with
caps {Vials N11-1, Art No. 70214, Amber glass 1 ml, Macherey-Nagel, Düren} then
measured by different conditions demonstrated in Table 2.7. The best suitable condition
was then selected basing on the presented low pressure and the well separated peaks
of nicotinamide and phthalic acid with an acceptable retention time. The example of the
HPLC-chromatogram was shown in Figure 2.19. At the region of 3.0 min ( O ) were
peaks of the injection, at 4.4 min ( I ) was a peak of nicotinamide and at 10.8 min ( II )
was a peak of phthalic acid.
Figure 2.19: HPLC chromatogram of a standard mixture containing nicotinamide
2.15 mg/100ml ( I ) and phthalic acid 1.92 mg/100ml ( II ) at a flow rate
of 0.8 ml/min and a mixture of 0.025 M phosphate buffer and MeOH
(80+20 ml) as an eluent.
O
I
II

Experimental part / Analytical methods 69 Substance Mobile phase Flow rate Pressure Retention time
(ml+ml) (ml/min) (bar) (min) buffer * + MeOH nicotinamide phthalic acid
nicotinamide 80 + 20 1.2 270 2.9 -
1.0 230 3.5 -
0.8 187 4.4 -
phthalic acid 80 + 20 1.2 270 - 7.1
1.0 230 - 8.6
0.8 187 - 10.8
std mixture 80 + 20 1.2 270 2.9 7.1
1.0 230 3.5 8.6
0.8 187 4.4 10.8
nicotinamide 70 + 30 0.8 - 3.6 -
phthalic acid 0.8 - - 7.2
std mixture 0.8 - 3.6 7.2
nicotinamide 50 + 50 0.8 - 3.2 -
phthalic acid 0.8 - - 4.1
std mixture 0.8 - 3.2 4.1
Table 2.7: Conditions of HPLC in the preliminary trials; nicotinamide
(1.06 mg/100 ml), phthalic acid (1.12 mg/100ml), std mixture contained
nicotinamide (2.15 mg/100 ml) and phthalic acid (1.92 mg/100ml),
buffer * = 0.025 M phosphate buffer <125>, and - means not measured
The following conditions will therefore be used for characterization of free phthalic acid
in coated pellets containing nicotinamide.
HPLC conditions: Column {28}: Nucleosil 5µ C18, 100 °A
Dimensions: 250 x 4.6 mm
Mobile Phase: 0.025 M Phosphate Buffer-Methanol (80 + 20 ml, pH 3)
Flow rate {31}: 0.8 ml/min
Detection {30}: UV @ 210 nm
Temperature: ambient
Injection {27}: 20 µL

70 Experimental part / Analytical methods 2.2.15.1 Calibration and validation
Calibration
The conditions as mentioned above were applied to create a calibration curve of
phthalic acid in water. The mobile phase containing 0.025 M phosphate buffer and
methanol was first filtered through the filter set containing a cellulose nitrate filter paper
{Lot No. 0899113079901503, 0.2 µm, Sartorius, Göttingen} and then the solution was
degassed by putting the volumetric flask into the ultrasound bath {67} for 15 min. This
solution of mobile phase was pumped {31} through the degas unit {29} into the HPLC-
column {28}.
The solution of the standard substance {Phthalic acid, C8H6O4, Lot No. 42130, Riedel-
de-Haen, Seelze} was prepared by dissolving free phthalic acid in CO2-free water and
the pH was adjusted below 3 using ortho-phosphoric acid {Ortho-phosphoric acid 85 %,
p.a. grade, Lot No. 83560, Riedel-de-Haen, Seelze}. The solutions of 8 different
concentrations of 0.34, 0.51, 0.68, 1.02, 1.53, 5.00, 10.00, 17.00 mg/100 ml were
prepared in triplicate and each concentration was measured three times. At the end
there were 72 values for calculation of the regression line. After the test of linearity and
homogenity at the confidential level of 95 % using the statistical programm Toccata
{S4}, the regression line using the area under the curve of HPLC-chromatogram
showed a slope of 1114782 with a standard deviation of ± 2153. The limits of detection
and determination were 0.02309 mg/100ml and 0.14064 mg/100ml, respectively. On the
other hand the regression line using the height of the curve of HPLC-chromatogram
showed a slope of 69.77 with a standard deviation of ± 0.144. The limits of detection
and determination were 0.02899 mg/100ml and 0.15723 mg/100ml, respectively. The
example of the residual plot using the area of 72 values was shown in Figure 2.20.
Validation
The validation was performed by measuring the known standard solution of phthalic
acid (2.0 mg/100ml) and nicotinamide (2.0 mg/100ml) in CO2-free water for three days.
Each solution was freshly prepared at every day of the measurement in triplicate and
every solution was measured three times. The measured values of the area under the
curve or the height were calculated to receive the concentration. The data calculated by
using regression line based on the area under the curve gave the values of recovery of
99.0 ± 0.1 %, whereas the values using the regression line based on the height of the

Experimental part / Analytical methods 71 peak gave the values of recovery of 98.0 ± 0.5 %. This means this method is suitable
for detecting of free phthalic acid in a mixture with nicotinamide.
Figure 2.20: Residual plot of 72 values of the calibration curve of the solution of
phthalic acid in water, using HPLC-method.
2.2.15.2 Measurement of free phthalic acid in coated pellets
The exact amount of about 2.50 g of enteric coated pellets (Product Ff, Table 2.27) was
weighed {2} and then they were put in a 100 ml-volumetric flask, 10 ml of
tetrahydrofuran {Tetrahydrofuran, LiChrosolv, Lot No. I 912101949, Merck KGaA,
Darmstadt} was added, followed by about 70 ml of distilled water. The samples were
vibrated in the ultrasound bath for 30 min. The pH of the dispersion was adjusted to
lower than 3 by adding ortho-phosphoric acid {Ortho-phosphoric acid 85%, p.a. grade,
Lot No. 83560, Riedel-de-Haen, Seelze} and then the total volume of 100 ml was
adjusted by distilled water. After well mixing the dispersion was filtered through 0.45 µm
PTFE-filter {Rotilabo Spritzenfilter, Art No. P8161, 0.45 µm, Carl Roth, Karlsruhe}
before analysis by HPLC at the condition as mentioned before. Five samples were
prepared after the above mentioned method. Every sample was measured three times
and therefore at the end there were 9 values for one product. The mean value of free
-100000
-50000
0
50000
100000
150000
200000
250000
0 5 10 15 20
Concentration of phthalic acid in water (mg/100ml)
Res
idua
l of a
rea

72 Experimental part / Analytical methods phthalic acid in the samples was calculated using both the regression lines based on
the area and the height of the HPLC-chromatograms.
2.2.16 Release studies
The resistance against artificial gastric fluid can be tested by the release studies. If
enteric coated products were totally resistant to the artificial gastric fluid there will not be
any amount of the model indicator or drug in the release test medium (0.1 N HCl). The
concentration of the model indicator or drug can be calculated by using UV-
spectroscopy and the regression line of model indicator or drug from the part 2.2.8.1 or
2.2.10.1, respectively. However the release profile was mostly demonstrated in the
percentage of release of the model indicator or drug. That means the cumulative
percentage of drug at a certain time was compared to the total corporated amount in the
coated product that was used in each test.
Moreover, the release of some products containing nicotinamide which were coated
with ethyl cellulose or with a combination of ethyl cellulose and polyvinyl alcohol in the
buffer pH 6.8 <126> were tested because the subcoat should not have any sustained
release effect both in 0.1 N HCl and buffer pH 6.8 <126>.
2.2.16.1 Calibration and validation
Calibration for methyl orange
The regression line was taken from part 2.2.8.1. That means the equation used for
calculating the concentration of methyl orange in the coated pellets was as follows;
X = Y
0.9727
Y was absorbance at 508 nm
X was a concentration of methyl orange (mg/100 ml) in 0.1 N HCl

Experimental part / Analytical methods 73 Calibration for nicotinamide
The regression line was taken from part 2.2.10.1. That means the equation used for
calculating the concentration of nicotinamide in the coated pellets was as follows;
X = Y
0.4197
Y was absorbance at 261 nm
X was a concentration of nicotinamide (mg/100 ml) in 0.1 N HCl
The other equation for calculating the concentration of nicotinamide in buffer pH 6.8
<126> was as follows;
X = Y
0.2554
Y was absorbance at 262 nm
X was a concentration of nicotinamide (mg/100 ml) in buffer pH 6.8 <126>
Validation
The dissolution test was performed in a 6 - vessel dissolution test apparatus with the
paddle method as described in the USP XXIII. The dissolution apparatus consisted of a
UV-spectrophotometer {68} with a computer, a peristaltic pump {51}, a water bath {18}
fitted with variable-speed stirring unit and a heater in order to have an automatic
construction assembly. The six cylindrical curved-bottomed glass vessels were filled
with 400 ml of acid medium (0.1N HCl) or buffer pH 6.8 <126> which were warmed to
37 °C ± 0.5 °C and temperature was kept constant during the dissolution test.
Solutions of the known concentration of methyl orange (0.5 mg/100 ml) or nicotinamide
(2.0 mg/100 ml) was used. The results showed that this method gave the recovery of
98 ± 0.5 % for both the substances.
2.2.16.2 Release studies of coated pellets
Pellets containing methyl orange
CAP coated pellets equivalent to about 0.8 mg of methyl orange (MO) were accurately
weighed {2} and then placed into one glass vessel containing 400 ml of 0.1 N HCl. The
rotational speed of paddle was adjusted to 100 rpm. The sampling was performed

74 Experimental part / Analytical methods automatically every 5 min by using a peristaltic pump with six flow-through cuvettes
{12}. Ultraviolet detection was at λ maximum of methyl orange i.e. 508 nm at a time
period of every five minutes. The percentage of MO dissolved in an artificial gastric fluid
(0.1 N HCl) medium was observed until the steady level was obtained or for 2 h. All the
experiments were performed in duplicate. The results will be shown in form of
dissolution profiles and percentages of MO released during the first five minutes. These
values were compared between different products.
Pellets containing nicotinamide
CAP coated pellets equivalent to about 8 mg of nicotinamide were accurately weighed
{2} and then placed into one glass vessel containing 400 ml of 0.1 N HCl or buffer pH
6.8 <126>. The rotational speed of paddle the sampling method and the detection time
period were the same as mentioned above. Only the ultraviolet detection was at λ
maximum of nicotinamide i.e. 261 nm in 0.1 N HCl and 262 nm in buffer pH 6.8. All the
experiments were performed in duplicate and the results will be shown in form of
dissolution profiles and percentages of nicotinamide released during the first five
minutes as well.
2.2.17 Optical appearance after the release study
This test was done in the dissolution test apparatus (as described in 2.2.16) in order to
demonstrate the same conditions as in the release study. About 200 pellets were put
into each glass vessel containing 400 ml of 0.1 N HCl or buffer pH 6.8 <126>. About
10 pellets were taken at an interval of 15 minutes over 2 h and were observed under an
image analyser coupled to a light microscope {41}, as mentioned in the part 2.2.6.
Pictures of these pellets have been taken and the time that pellets stayed in the medium
and they began to break was recorded.

Experimental part / Coating apparatus 75
2.3 Coating apparatus
The fluidized bed apparatus, Aeromatic MP-1 {20}, is a pilot scale machine which can
be used for coating of fine particles, pellets, granules or tablets <120>. Two
combinations of Aeromatic MP-1 served for this present work. The first combination is
MP-1 with inserted filters. The second one is MP-1 connected with a cyclone. The
details of these two combinations will be discussed.
2.3.1 Coating apparatus (MP-1) with inserted filters
Figure 2.21 shows its component which consists of a conical product container (no. 14)
made from acrylic glass, perforated bottom with different percentage of free holes
(no. 11), the Wurster column (no. 13) with a diameter of 6 cm and a heigh of 18 cm. The
spraying unit (no. 15) was in a position in between the Wurster column. The partition
part (no. 12) between the end of the Wurster column and the perforated plate can be
varied. However, normally 0.8 cm was used in this work. Products inside the container
will be fluidized from the process air from the bottom to the upper part and at the same
time they will be coated with the fluid that was atomized by the air. In the region outside
the Wurster column the product will flow downward and flow into the center through the
partition part. The product will be blown upward again from this center with continuous
coating cycles. During the upward flow of the product the drying phase was carried out
by the heated process air. Because of the interchange of water content between the
process air and products the process air carried more water content. Consequently,
there was a temperature decrease of the process air. This process air flows through the
filters and the outlet air tube by the sucking process from the ventilator (no. 19).
The important variables during a coating process were measured inside the coating
apparatus. Different sensors were installed at different positions i.e. three positions for
temperature (no. 1 to 3), one position for temperature and humidity using dew point
(no. 4), two positions for air flow (no. 5 and 6) and one position for mass flow of coating
liquid (no. 7). The signals from these 7 channels were collected at the data recording
device {14} at the same time. These signals were both demonstrated on the display of
the data recording device and automatically saved on a disc. This process facilitates to
observe changes of process conditions which may happen during the coating process.
This permits a fast manual regulation.

76 Experimental part / Coating apparatus
As mentioned before the product container is made from acrylic glass and therefore
very suitable for the visual observation of the coating process. A free downward flow of
the product at the sight of the acrylic glass product container is one of the indications of
a good fluidization but such limited observation could be misleading. In addition it is
possible to supervise this situation by monitoring the outlet air temperature. Every
product has an unique constant drying period in which the bed temperature remains
relatively constant for a significant length of time. Therefore, if the outlet air temperature
rises more rapidly than expected, it is an indication that fluidization is incomplete <122>.
In our work the temperature profiles of temperatures at four positions were
demonstrated on the display of the data recording device. These four temperatures
were measured using thermocouples {63}. These sensors should be calibrated before
used, see part 2.3.3.1. Therefore values of inlet air temperature before heating, inlet air
temperature after heating, product bed temperature and outlet air temperature can be
observed and shown in degree celcius (°C). These temperature profiles will allow better
control of the coating process. The effective drying and coating phases can be
monitored. Guidelines and exemplary values are given and discussed in the literature
and therefore can be used as a guideline for the preliminary experiments. After suitable
temperatures for a process were chosen the control of these temperatures could easily
be done.
As heated air was used to dry the product during the coating process, the drying
capacity of the air must be carefully monitored. The drying capacity of the air depends
upon the relative humidity (r.h.) of the incoming air. At 100 % r.h. the air is holding the
maximum amount of water but if the temperature of the air is raised the relative humidity
drops and the air can hold more moisture. If air is saturated with water vapor at a given
temperature, a drop in temperature will force the air mass to release some of its
moisture through condensation. The temperature at which moisture condenses is the
dew point temperature. Dew point and vapor pressure are directly related. Thus, the
drying capacity of the air varies significantly during processing. By dehumidifying the air
to a pre-set dew point, one can maintain constant drying capacity and, hence, a
constant process time. If absolute humidity varies during the year, changes in the
relative humidity of the heated, fluidizing air will result. For this reason the air humidity
may actually be lower than desirable during cold and dry seasons and a
rehumidification or a wetting process may be necessary <122>.

Experimental part / Coating apparatus 77
In this present work the relative humidity of the outlet air was measured using the
Hygrolog-hygrometer {33}. This was also calibrated before use, see part 2.3.3.2. This
relative humidity can be calculated by using the outlet air temperature and its dew point.
This value showed the water content inside the coating column during coating process.
It can be affected by the content of water in the inlet air as mentioned before and
therefore the water content of the inlet air should be controlled by using a dehumidifying
unit {15}. The inlet air of room temperature was cooled down to about 5 °C by a
condensing process. This air then has a humidity of about 98 % r.h., which means that
this cool air contains 5 g of water in one kg of air. This cool air will then be used as inlet
air into the Aeromatic MP-1 before heating. After heating this air will have a lower
relative humidity whereas the absolute water content of the air remains the same as
before heating. For example, if the process air was heated to 65 °C then the relative
humidity of this air will be 3.5 % r.h. However, it was problematic when the process was
carried out in the winter season because the relative humidity of the inlet air for the
dehumidifying unit was already low. The water from the air could not be further removed
and after heating in the coating apparatus, the relative humidity was extremely low. If a
high relative humidity is needed for the coating process this inlet air should be wetted
before use. The wetting process, however, was not possible in our laboratory because
no humidifier was available. Therefore the coating process had to be carried out in the
season with high relative humidity so that the dehumidifying process could be
performed. The profile of the relative humidity of the outlet air shows the range which
must be controlled to maintain the same coating conditions.
The spraying rate can be observed by using a mass flow rate. That means the
decreasing of mass or weight (g) over the time was recorded. A digital balance {17}
connected with a digital/analog converter served for the observation. The analog (mA)
values were collected in the data recording device and they were converted into digital
values again. These digital values were the base for the calculation of the spraying rate
over the time.
The air flow in the Wurster fluidized bed system is a combined air flow of the fluidization
air and the atomizing air at the nozzle. Air and substrate velocities are not uniform
across the upper part of the product bed. The velocities at the center are significantly
higher than those along the walls. There is a risk that the substrate might fall down
along the wall of the Wurster column, and that clusters of particles might be formed at
certain process conditions in the upper part of the product bed. The terminal velocity of

78 Experimental part / Coating apparatus
particles in the upper part is limited by the height of the expansion chamber.
Unfortunately, the terminal velocity of the particles cannot be calculated. The product
concentration in the mist region of the upper part must be high enough to secure
adherence of all spray droplets to substrate particles. The region where the product
flows down outside the Wurster column is a slightly expanded bed where the air rate is
below the minimum fluidization velocity. This is the region where sticking mostly occurs,
since the movement is gentle and the particles are in close contact to each other <36>.
As the velocity of the process air during the coating process is an important factor which
affects the flow pattern of the product, the control of this velocity allows to regulate a
desired process. In this present work the mass flow of the atomizing air and the volume
stream of the process air were measured using flowmeters {21,22} and their values
were shown in the form of volume of air over time (m3h-1). These two values were
separately measured at the positions demonstrated in Figure 2.21.
Moreover, the flow pattern can be affected by the perforated air distributor plate. This
plate is defined by its percentage of open area. In this present work there were five
different openings available i.e. 6 %, 8 %, 11 %, 13 % and 20 % {52}. These
interchangeable plates provide a range of loading capacities so that batches of various
sizes can be produced efficiently and with a uniform quality. To prevent channeling a
plate that provides the optimum lift properties should be selected. This plate was
afterwards covered with a finer screen (e.g. screen size 100 µm) which provides
appropriate means of supplying air to the bed.
To move air in a fluidized bed apparatus, an exhaust ventilator mounted outside of the
processing area imparted the motion and the pressure to the air by action of a turbine-
wheel. The moving air acquires a force or pressure component in its direction of motion
because of its weight and inertia. Thus, a negative static pressure will exist on the inlet
side of the ventilator. The pressure drops (∆ P) can be determined by all the
components of the complete system. As filters can cause a significant pressure drop,
many process failures result from the selection of filter media with a wrong pore size.
The process failure can also occur when the filter clogs because of excessive
fluidization of fine powder or when filters are improperly cleaned after finishing the
process. A too fine filter will impede fluidization, causing excessive ∆ P, and a too coarse
filter will cause loss of valuable product carried by the process air <122>. In our coating
apparatus the pressure difference between inside the product container and behind the
filters was demonstrated in millimeter of water (mm H2O) on the pressure gauge at the

Experimental part / Coating apparatus 79
control panel of the coating apparatus. The value of about 250 mm H2O or 2450 Pa
shows the critical point, that means filters were blocked with fine dust or particles and
the coating process had to be stopped.
2.3.2 Coating apparatus (MP-1) in connection with a cyclone
A Wurster fluidized bed apparatus as mentioned before connected with a cyclone
instead of inserting filters was used to coat the products as shown in Figure 2.21. All
sensors were positioned and recorded on the data recording device as mentioned in
part 2.3.1.
Before the coating process was carried out using this setup, the coating apparatus was
tested under different process conditions, especially the flow pattern of different types of
products and the loading weight at different air flow regulating positions (0 - 10). The
absolute pressure and the pressure differences (∆ P) at 3 different positions, were
measured. The first position was the pressure difference between air inside the product
container and air inside the exhaust air tube after having passed the cyclone (∆ P1).
This value (mm H2O) was shown on the pressure gauge, Magnehelic-Barometer {7}, at
the control panel of the coating apparatus. The second point was the pressure
difference between air in the product container and room air (∆ P2). This value was
shown on the display of a Baratron-Barometer {6} in Torr. The last position was the
pressure difference between air above and below the perforated bottom plate. This
value was shown also on the pressure gauge, Magnehelic-Barometer {7}, at the control
panel in mm H2O. However, before the values from these two gauges on the control
panel were used in the experiment they were compared to the respective values
measured by using the Baratron-Barometer. It was found that there was a deviation of
only ± 2 mm H2O between the value shown on the gauges on the control panel and that
from the Baratron-Barometer. This evidence was judged as sufficient for the accuracy
as of the Magnehelic-Barometer and the values were then directly taken from these two
gauges.
The air flow rate was also measured by the sensor integrated inside the coating
apparatus (No. 23 in Figure 2.21) and the value was shown in percentage on the control
panel. This value of percentage did not show the physical values. Therefore another
measurement using a flowmeter as mentioned before 2.3.1 was ued. This measurement

80 Experimental part / Coating apparatus
results in values with the desired physical dimension of m3h-1 on the display of the data
recording device {14}.
In order to study the affect of the cyclone compared to the originally inserted filters, the
preliminary test was performed. Air in the laboratory at room temperature was used as a
reference {5}. The absolute pressure of it was 100508 Pa. Conditions of all trials (Table
2.8 to 2.10) were as follows: diameter of nozzle 1.2 mm, atomizing pressure
2.5 - 2.6 m3h-1, perforated plate 8 %, room temperature and relative humidity 23 - 25 °C,
50 - 52 % r.h.. First the test with a fluidized bed with inserted filters and varying air flows
(about 70 to 150 m3h-1) with or without pellets was carried out. The pressure difference
between air inside product container (MP-1) and room air (∆ P2) was measured by a
Baratron-Barometer, in Torr. These values were converted into Pascal by multiplying
with 133.3. The pressure difference between air inside MP-1 and air inside exhaust air
tube behind the filters or the cyclone was shown on the control panel in mm H2O, the
data were converted into Pascal by multiplying by 9.8.
The result as seen in Table 2.8 showed that without cyclone and loading product the air
flow can be increased to the maximum of about 150 m3h-1. The resistance from filters
(∆ P1) increased when the air flow was increased by adjusting the regulator. However,
the highest resistance from the filters was about 176 Pa. The same behavior can be
found with the resistance from the perforated bottom plate (∆ P3) by increasing the air
flow. Absolute pressures were calculated at two different positions i.e. air inside the
product container (Pii) and air inside the exhaust air tube (Piii) because the pressure of
air in the laboratory room (Pi) was known. The data show that the absolute pressure of
air inside MP-1 (Pii) and the absolute pressure of air in the exhaust air tube (Piii) were
decreased by increasing air flow.
After loading the fluidized apparatus with 100 g of coated pellets (Table 2.9) and 250 g,
respectively, the resistance from filters at the same air flow of about 90 m3h-1 was not
significantly different, i.e. ∆ P1 was about 80 Pa (data not shown). The comparison
between different loading amounts at the same air flow of about 90 m3h-1 for the
combination of a fluidized bed apparatus with inserted filters or with a cyclone instead
shown in Table 2.10. By using a cyclone, the air flow at the maximum position of the
regulator was about 90 m3h-1. The resistance of the cyclone was about 2400 Pa (∆ P1)
and almost the same for all three loading amounts (0 g, 100 g and 250 g). This pressure
difference was almost the same as that seen after performing a fluidized bed process
with inserted filters which then were covered with fine dust which caused the highest

Experimental part / Coating apparatus 81
filter-resistance (2450 Pa) as mentioned before. However, under this condition of the
highest process air flow the product flow cannot be increased further if required.
Therefore further trials by spraying the polymer dispersion to the product to increase the
weight were carried out. The product flow was monitored during the coating process to
see whether it needed the regulation of the air flow or not. The result was that after
spraying the pellets with the polymer dispersion there was an increase of weight but
further increase of the air flow was not nescessary. This means the further coating trial
by using a fluidized bed apparatus in connection with a cyclone can be well carried out.
Details of the installation of accessories and equipments <120> for Figure 2.21.
1. Sensor for inlet air temperature before heating {66}
2. Sensor for inlet air temperature after heating {63}
3. Sensor for product bed temperature {63}
4. Sensor for outlet air temperature and humidity {33}
5. Sensor for volume stream of process air {22}
6. Sensor for mass flow of atomizing air {21}
7. Digital balance with digital output for mass flow of coating liquid coupled with a
digital/analog converter {17}
8. Dehumidifying unit {15}
9. Filter for inlet air
10. Heater for inlet air
11. Perforated bottom plate {52}
12. Partition part between a Wurster column and perforated bottom plate
13. Wurster column
14. Product container
15. Spraying unit
16. Peristaltic pump {51}
17. Container for spraying solution or dispersion
18a. Filters
18b. Cyclone with a glass flask {13}
19. Ventilator
20. Sound absorber
21. Data recording device {14} for sensors no. 1 to 7
22. Printer {54}
23. Flowmeter integrated inside Aeromatic MP-1 {23}

82 Experimental part / Coating apparatus
7
21
22
1
2
3
4 5
6
20
8
1617
18a 18b
19
9
1011
1213
14
15
Figure 2.21: A Wurster-based fluidized-based apparatus (Aeromatic MP-1,Powder Coater) with a cyclone for the coating of pellets;Arrows show the direction of the air flow.
23

Experimental part / Coating apparatus 83
No. Air flow ∆P1 ± SD ∆P2 ± SD ∆P3 ± SD Pi Pii Piii
of regulator (m3h-1) (Pascal, Pa)
5.0 77±2 0±6 560±13 480±13 100508 99948 99948
5.8 90±2 79±6 773±13 587±13 100508 99735 99656
6.4 98±2 99±6 1013±13 693±13 100508 99495 99396
7.2 112±2 108±6 1346±13 880±13 100508 99162 99054
8.0 127±2 147±6 1720±13 1093±13 100508 98788 98641
9.8 143±2 176±6 2173±13 1360±13 100508 98335 98159
10.0 147±2 176±6 2306±13 1386±13 100508 98202 98026
Table 2.8: Pressure differences or absolute pressure (Pa) of air in different
positions of Aeromatic MP-1 with inserted filters, without pellets (n = 3); Pi = Pressure of room air, Pii = Pressure of air inside MP-1, Piii = Pressure of air in
exhaust air tube after filters or cyclone, ∆P1 = Pii - Piii or pressure difference between
air inside MP-1 and air inside exhaust air tube behind filters or cyclone, ∆P2 = Pi - Pii
or pressure difference between air inside MP-1 and room air, ∆P3 or pressure
difference of air between below and above perforated plate, the highest regulator
position is number 10.

84 Experimental part / Coating apparatus
No. Air flow ∆P1 ± SD ∆P2 ± SD ∆P3 ± SD Pi Pii Piii
of regulator (m3h-1) (Pascal, Pa)
5.9 89±2 79±6 920±13 640±13 100508 99588 99509
6.9 99±2 79±6 1173±13 773±13 100508 99335 99256
7.3 110±2 88±6 1373±13 880±13 100508 99135 99047
7.9 120±2 99±6 1653±13 1053±13 100508 98855 98756
Table 2.9: Pressure differences or absolute pressure (Pa) of air in different
positions of Aeromatic MP-1 with inserted filters, loaded with 100 g of
coated pellets (n = 3); Pi = Pressure of room air, Pii = Pressure of air inside MP-1, Piii = Pressure of air in
exhaust air tube after filters or cyclone, ∆P1 = Pii - Piii or pressure difference between
air inside MP-1 and air inside exhaust air tube behind filters or cyclone, ∆P2 = Pi - Pii
or pressure difference between air inside MP-1 and room air, ∆P3 or pressure
difference of air between below and above perforated plate, the highest regulator
position is number 10.

Experimental part / Coating apparatus 85
No. Air flow ∆P1 ± SD ∆P2 ± SD ∆P3 ± SD Pi Pii Piii
of Product (m3h-1) (Pascal, Pa)
Filters
1 90±1 79±6 773±13 587±13 100508 99735 99656
2 89±1 79±6 920±13 653±13 100508 99588 99509
3 90±1 49±6 1040±13 786±13 100508 99468 99419
Cyclone
1 92±1 2403±90 857±56 623±41 100508 99651 97248
2 92±1 2395±50 884±33 649±56 100508 99624 97229
3 92±1 2382±70 960±27 782±8 100508 99548 97166
Table 2.10: Pressure differences or absolute pressure (Pa) of air in different
positions of Aeromatic MP-1 with inserted filters or with cyclone (n = 3); Pi = Pressure of room air, Pii = Pressure of air inside MP-1, Piii = Pressure of air in
exhaust air tube after filters or cyclone, ∆P1 = Pii - Piii or pressure difference between
air inside MP-1 and air inside exhaust air tube behind filters or cyclone, ∆P2 = Pi - Pii
or pressure difference between air inside MP-1 and room air, ∆P3 or pressure
difference of air between below and above perforated plate, the highest regulator
position is number 10, Product No. 1: no pellets, Product No. 2: coated pellets 100 g,
Product No. 3: coated pellets 250 g

86 Experimental part / Coating apparatus
2.3.3 Calibration 2.3.3.1 Calibration of thermocouples
Thermocouples made from Ni-Cr-Ni {63} were used as sensors for monitoring the
temperature during the coating process. These sensors were connected to the data
recording device as mentioned before. The original values from these sensors were in
mV. These values were then converted into degree Celcius by the integrated program in
the data recording device and the internal reference used. Before the calibration was
performed the value shown on the display of the data recording device was adjusted as
a one point adjustment. After this adjustment the calibration in order to prove the
accuracy of values from each sensor over different temperature ranges was carried out.
The temperature in the range of 0 to 100 °C was created by an ice bath and/or a water
bath with thermostatic control {69}. The temperature of this bath can be controlled with a
deviation of ± 0.5 °C. The reference temperatures from 0 to 100 °C were shown on the
accurate thermometers {64,65}. The results showed that the deviation between the
values from the display and from the thermometers was not more than ± 1 °C at all the
ranges. These deviations were accepted, as the temperature of the coating process
could be well controlled and the deviation could be kept within ± 2 °C of the desired
temperature.
2.3.3.2 Calibration of the Hygrolog hygrometer
The Hygrolog hygrometer was used in the fluidized bed process in order to measure the
relative humidity of the coating process. The principle of this apparatus was to measure
temperature of the process air and the temperature at which the water from this air is
condensed on the peltier-element. This is called dew point (Td). From values of air
temperature and dew point the relative humidity can be calculated. For example, if the
air temperature is 50 °C and Td is 20 °C, then this air has a relative humidity of 19 % or
contains absolute water of 80 g/kg.
The calibration was performed by measuring temperature and humidity of the air in the
room before this hygrometer was used. The values measured with the Hygrolog were
compared with the values resulting from another hygrometer as a reference {34}. It was
found that there were differences between air temperature of 0.5 °C and the relative

Experimental part / Coating apparatus 87
humidity of 2 % r.h. However, these differences were accepted because variations in
the process conditions during the coating process did not affect the quality of the
products.
2.3.4 Determination of spraying angles
The important factor also to be considered in the coating process was the spraying
angle of the dispersion of the polymer. If the spraying angle is not suitable it might
cause problems in the coating process. For example: if the spraying angle is too large, it
would cause a loss of the polymer because of the accumulation of polymer at the inner
surface of the Wurster column. If the spraying angle is too small the polymer would be
concentrated at a small part of the product bed within the Wurster column and create
agglomerations because of a too wet product.
The measurement outside the coating apparatus could easily be performed and
therefore it was suitable to be used as a control method after a long time of coating
process to observe the condition of the spraying unit.
The measurement outside the fluidized apparatus was performed as shown in Figure
2.22. The atomizing pressure was set at the same value as in the coating process, for
example 2.6 m3h-1. The distance between the end of the spraying nozzle and the end of
the air cap was 1.0 mm {8}. The spraying unit (A) and the dispersion delivery device (B)
were the same as in the coating process. About 1.0 g of the water soluble red coloured
powder (L-Rot Z 3020) was added into the 15 % w/w dispersion containing 33.3 g of
Aquacoat CPD-30 and 2.5 g of TEC in order to improve the observation of a spraying
region on the receiving paper (C). The delivery of the dispersion was performed with a
peristaltic pump (D) at a spraying rate of 2 g/min. The spraying time was 1.30 min. After
finishing the spraying the region after spraying was marked on the paper. The border
line of the region was defined as the point where almost no colour could be seen. The
radius of this region was then measured by using a ruler. The distance between the
spraying nozzle and the paper was kept at 18.0 cm because this was the length of the
Wurster column. Therefore the angle of spraying can be calculated as shown in Figure
2.22, at which r1 is the radius (cm) of the spraying region and r2 is the distance (cm)
between the end of the spraying nozzle and the surface of the paper. The result of this
spraying angle was compared to the dimension of the Wurster column which had an
inner diamter of 5.7 cm or a radius of 2.85 cm.

88 Experimental part / Coating apparatus
The result showed that the radius of the spraying regions measured outside the coating
apparatus at the distance of 18 cm was between 7 and 10 cm. This means that the
spraying angles were between 21 and 29 °. When the radius of the spraying region (7.0
– 10.0 cm) was compared to the radius of the Wurster column (2.85 cm) it could be
seen that the radius of the spraying region was much larger than that of the Wurster
column. However, it must be considered that in the real coating process the process air
came from the vertical and this may interfere the spraying angle of the solution or
dispersion. The spraying angle inside the coating apparatus may be smaller than that
without a process air outside the coating apparatus. Moreover, the loaded products may
alter the flow pattern of the air flow. Therefore the observation was performed with the
coating processes by using the coating dispersion and loading products.
After using the suitable setting e.g. atomizing pressure and distance between spraying
nozzle and air cap of the spraying unit in the coating process it was found that the
coating processes was well operated. There was no significant accumulation of coating
materials at the inner surface of the Wurster column which indicated that the setting of
the spraying unit was suitable for the coating. This test was also performed after a
certain period of working time in order to control the condition of the spraying unit
whether there was a blockage inside the spraying unit or not. If the spraying angle at the
same setting was kept constant then this spraying unit could be used furtheron for the
coating process. When the spraying angle was changed from the expected one then the
reason of this occurrence could be found. For example it was found that the blockage or
the damage of the spraying unit was the main reason for the change in spraying angle.

Experimental part / Coating apparatus 89
Figure 2.22: Setting of the spraying unit and the receiver of the atomizing liquid for
the determination of the spraying angle outside the coating apparatus.
2.3.5 Signals from the data recording device
The examples of signals from the coating processes in the Aeromatic MP-1 {20} with
inserted filters or with a cyclone {13} as a dust collector are shown in Figure 2.23 and
2.24, respectively. These signals were collected by a data recording device {14}.
2.3.5.1 Coating process by using Aeromatic MP-1 with inserted filters
Figure 2.23 shows the interruption of the coating process because filters must be
changed and cleaned, X18 (Table 2.23) for the production of Product hH. The first cycle was carried out by pre-warming the coating apparatus without any product for
15 min (between 1 to 15 min) and then the loading material was put into the product
container. The coating apparatus had to be stopped for this procedure but the atomizing
air (# 4) was still in process to avoid the blockage of the spraying nozzle because of the
loading material. The signal from the process air flow (# 5) was immediately decreased
when the coating apparatus was stopped as shown in Figure 2.23 ( a ). After finishing
the loading phase the inlet temperature was set to 35 °C to receive the product
r2
A
C
d = 2 r1θ
B
Angle θ ( ° ) = ( r1 ) / ( r2 )
D
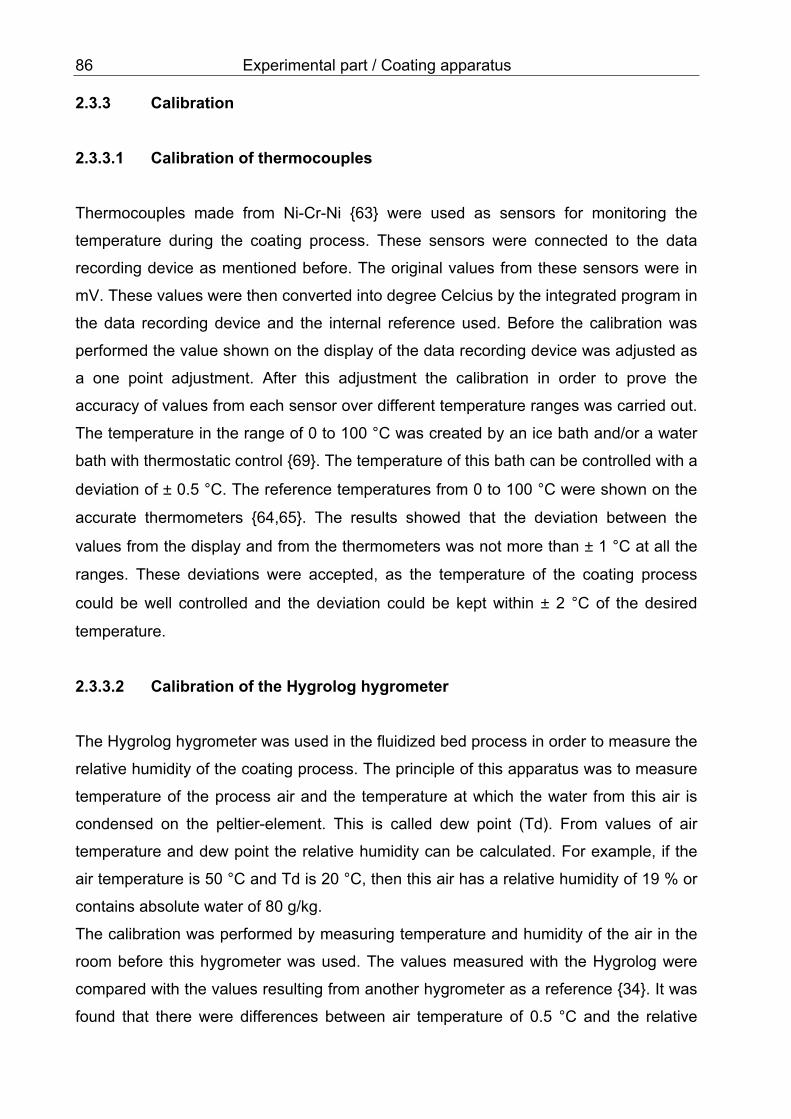
90 Experimental part / Coating apparatus
temperature of about 32 °C. The pre-warming phase with the loading product was
carried on for 15 min (between 15 to 30 min). At the time of 24 min from the beginning
( b ) the peristaltic pump {51} was started with air because this was still the pre-warming
phase. The spraying of the dispersion was made 30 min after the start of the apparatus.
( c ). The process air flow was adjusted so that the flow was between 95 - 100 m3 h-1. If
the flow decreased to 95 m3 h-1 then the higher position at the control switch was used
so that 100 m3 h-1 was achieved. Therefore the signal from the process air flow (# 5)
had a zig-zag character. It was obvious that after the spraying phase the temperatures
of inlet air before heating (# 1 ~ 24°C) and after heating (# 2 ~ 35 °C), the product bed
temperature (# 3 ~ 32 °C), the outlet air temperature (# 7 ~ 32 °C) and its dew point (# 8
~ 14 °C) kept constant over the coating period. The digital signal, coming from the data
collecting device, was between 0.0 and 99.9 g because of the limit of the D/A converter.
Therefore the signal from the used dispersion was decreased over the time. If the signal
arrived 0.0 g then it began with 99.9 again. The spraying rate (g/min) can be calculated
from the values from this decreasing line. For example; this process had a constant
spraying rate of 0.8 g/min. At 85 min the D/A converter was stop and therefore the
signal had minus values. At 88 min the tubes inside a beaker containing coating
dispersion were placed into a beaker containing water to clean the tube-system. At
about 93 min all tubes were taken out of a beaker. At 98 min the spraying of water
started and the spraying was stopped at 106 min. The drying and cooling phase
followed until 116 min. The region between 116 min to 160 min was the stop phase of
Aeromatic MP-1.
The region between 161 to 176 min was the pre-warming phase of the coating
apparatus without a product for the second cycle. After this pre-warming phase of
15 min the loading material, which came from the cycle I and was further dried in the
small scale fluidized bed apparatus (Uniglatt) during the filter change phase, can be put
into the product container again and the same cycle as above mentioned was carried
on. The prewarming phase with a product was performed for 15 min (176 min to 190
min). Air was sprayed from 186 min to 190 min and then followed the spraying with the
dispersion (191 - 265 min). After the spraying with the dispersion the destilled water was
sprayed from 266 min to 269 min. Hereafter the drying phase was carried out for about
15 min.

Experimental part / Coating apparatus 91
The third cycles contained different phases as well i.e. loading of materials, spraying of
air (356 - 360 min), spraying of the dispersion (361 - 376 min), spraying with water
(377 - 381 min), drying (381 - 396 min) and cooling (397 - 410 min).
2.3.5.2 Coating process by using Aeromatic MP-1 with a cyclone
Figure 2.24 shows the continuous process without any interruptions, X21 (Table 2.24)
for the production of Product oO. This process was used to coat pellets with enteric
coating materials containing CAP, TEC and Aqoat-AS-MF. This coating formulation
needs special control of the temperature of the coating dispersion (# 9). The
temperature should be kept lower than 15 °C by using water-ice bath. If the temperature
was increased to about 12 °C because ice was melting then a small amount of ice was
added to the water-ice bath to reduce the temperature of the dispersion to about 9 °C.
The pre-warming phase without a product of this coating apparatus was also 15 min
(1 - 15 min). After this phase the coating apparatus was stopped to put the loading
material into the product container. After finishing the loading then the process was
continued at the set inlet temperature of 35 °C to receive the product temperature of
32 °C. The process air flow was set at the highest position which means 10 at the
control switch. After pre-warming phase with the loading product for 15 min the spraying
with air was performed at 19 - 30 min. Then the spraying with a dispersion started
(31 - 187 min). At about 188 min the tubes were taken from the beaker containing
coating dispersion and were put into the beaker containing water to clean the tubes.
The spraying with water was performed at 198 - 203 min after that the drying phase was
carried on. The last step was the cooling of the coating apparatus to about room
temperature before the process was stopped at about 222 min.
The spraying rate could be calculated from the decreasing line (# 6) which gave the
value of 0.8 g/min. After the spraying phase the temperatures of inlet air before heating
(# 1 ~ 21°C) and after heating (# 2 ~ 35 °C), the product bed temperature (# 3 ~ 32 °C),
the outlet air temperature (# 7 ~ 32 °C) and its dew point (# 8 ~ 3 - 4 °C) and the
process air (# 5) flow kept constant at about 93 - 95 m3 h-1 over the coating period.


94 Experimental part / Preparative methods 2.4 Preparative Methods
2.4.1 Preliminary Experiments The preliminary experiments were performed in order to become familiar with the
fluidized bed apparatus and to select the suitable process conditions and formulation for
preparing the dosage form. The model dosage form used in this present study should
contain a thin layer of nicotinamide and thereafter a layer of a subcoat with different
thicknesses. Different film-forming polymers, i.e. HPMC, PVA and EC which can be
used as a subcoat because of their properties of moisture barrier were tested. They
have different physical properties such as glass transition temperature (Tg), minimum
film-forming temperature (MFFT), compatibility with plasticizers and viscosity. Therefore
the preliminary test was to be carried out for each polymer.
2.4.1.1 Coating of tablets
In order to become familiar with the fluidized bed apparatus and the accessories the
coating trials were carried out by using placebos. The suitable placebo for the first step
were tablets. These tablets were produced by using the direct compression filler -
Ludipress {Batch No. 340402, BASF, Ludwigshafen} and a direct compression
technique. Ludipress is composed of ~ 93 % α-lactose-monohydrate, ~ 3.5 % Kollidon
30 (soluble PVP) and ~ 3.5 % Kollodon CL (insoluble PVP) <156>. This material was
already available in the laboratory and some parameters for the tabletting was already
mentioned <109,156>. Magnesium stearate {Lot No. 91320, Riedel-de Haen, Seelze}
was used as a lubricant at 1.0 % w/w. These two components were mixed in a mixing
machine {45} at a mixing time of 10 min.
The manufacturer of the Aeromatic MP-1 recommended that about 1 kg of loading
substance should be used for one coating process. For this reason about 10 kg of
tablets were produced in a rotary tabletting machine, Korsch PH 106 {60}. Only three
pairs of punches with a curve radius of 3.5 mm and a diameter of 5 mm were used. This
condition gave more uniform tablets with smaller variation in the finished product. The
upper punch produced a carve on the tablets. The rotation speed of the tabletting
machine was 22 - 25 rpm. The height of filling was 6 mm and the height of tablets was

Experimental part / Preparative methods 95 4.6 mm. The hardness of the tablets was regulated by adjusting the upper punch so that
the hardness of about 35 N was achieved.
The resulted tablets had mean weight {1} of 52 ± 2 mg, mean diameter {62} of 5 mm ±
0.5 mm, mean thickness {62} of 2.8 ± 0.5 mm and mean hardness {61} of 35 ± 5 N.
These tablets served to develop the working principle of the coating apparatus. The
solution of 10 % w/w of Pharmacoat 603W in water was used as a coating polymer
because it was easy to be prepared and some coating parameters were known from the
work of Nguyen <109>.
The result showed that these tablets can be coated with the solution of
Pharmacoat 603W and the process number X1 (Table 2.11) in the fluidized bed
apparatus. The resulting tablets showed an acceptable quality of the coating layer.
Therefore the change from tablets to pellets was done because the properties of these
two products were different e.g. friability, surface area, hardness, form, etc.

96 Experimental part / Preparative methods
Process number X1 X2 X3 X4 X5 X6 Parameter
Loading weight (g) 1000 1000 1000 1000 1000 300 Core material T S S S S S Atomizing pressure (m3 h-1) 2.4 2.4 2.4 2.4 2.4 2.4 Orifice diameter (mm) {48} 0.8 0.8 0.8 0.8 0.8 0.8 Distance from bottom to
column (mm) 0.8 0.8 0.8 0.8 0.8 0.8
Perforated bottom (% free) 20 20 20 20 20 13 Pre-warming with product (min) 15 15 15 15 15 15 With dehumidified process air y y y y y y With cyclone instead of filters n n n n n n Room temperature/humidity
(°C, % r.h.) 20, 50 20, 60 22, 50 22, 50 22, 50 22, 50
Inlet temperature (°C) 60 60 60 60 60 60 Product temperature (°C) 54 54 54 54 54 54 Outlet temperature (°C) 52 52 52 52 52 52 Outlet humidity (% r.h.) 18 18 18 18 18 17 Spraying rate (g min-1) 3.0 1.7 1.7 1.7 1.7 0.5 Initial spray air water water water water water Process air velocity (m3 h-1) 50-55 50-55 50-55 50-55 50-55 50-55 Drying in Uni-Glatt (°C, min) - - - - - - Postdrying inside the machine
(°C, min) 54,15 54,15 54,15 54,15 54,15 54,15
Postdrying outside the machine
(°C, h) 22, 24 22, 24 22, 24 22, 24 22, 24 22, 24
Table 2.11: Coating conditions of different processes X1 to X6;
T = Tablets with a diameter of 5 mm
S = sugar spheres size range 1000-1180 µm
y = yes; n = no
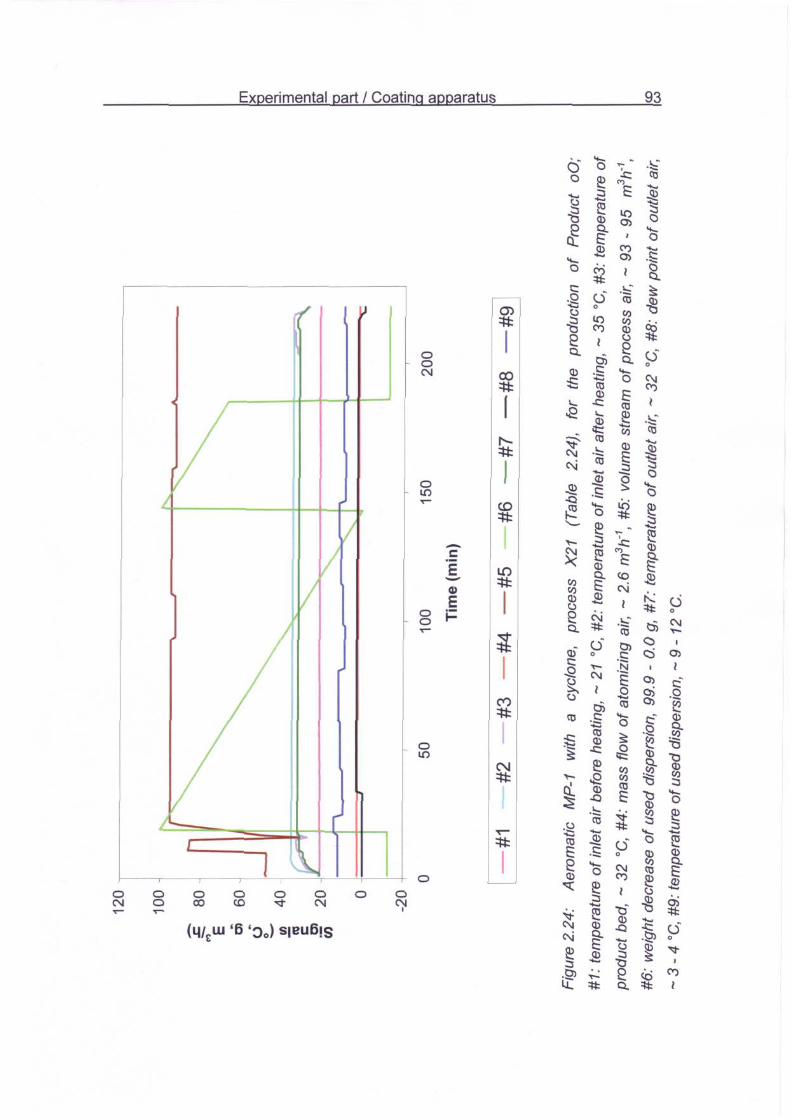
Experimental part / Preparative methods 97
Process number X7 X8 X9 X10 X11 X12 Parameter Loading weight (g) 1000 500 200 200 200 200 Core material SS PP M1 M2 M3 M4 Atomizing pressure (m3 h-1) 2.4 2.4 2.4 2.6 2.6 2.6 Orifice diameter (mm) {48} 0.8 0.8 0.8 1.2 1.2 1.2 Distance from bottom to
column (mm) 0.8 0.8 0.8 0.8 0.8 0.8
Perforated bottom (% free) 20 20 13 13 13 13 Pre-warming with product (min) 15 15 15 15 15 15 With dehumidified process air y y y y y y With cyclone instead of filters n n n n n n Room temperature/humidity
(°C, % r.h.) 22, 50 22, 50 22, 50 23, 50 24, 50 22, 50
Inlet temperature (°C) 60 55 60 60 60 60 Product temperature (°C) 54 50 54 50 55 58 Outlet temperature (°C) 52 48 52 49 50 57 Outlet humidity (% r.h.) 17 18 17 18 18 17 Spraying rate (g min-1) 1.7 0.8 0.8 1.7 1.7 0.8 Initial spray water water water water water water
Process air velocity (m3 h-1) 50-55 55-60 55-60 55-60 55-60 65-70 Drying in Uni-Glatt (°C, min) - - - - - - Postdrying inside the machine
(°C, min) 54, 15 50, 15 54, 15 50, 30 50, 30 50, 15
Postdrying outside the machine
(°C, h) 22, 24 22, 24 22, 24 50, 24 50, 24 50, 24
Table 2.12: Coating conditions of different processes X7 to X12;
SS = sugar spheres size range 800-1000 µm
PP = placebo or HPMC pellets size ~ 800 µm
M1 = Nico pellets (Product AA)
M2 = Nico pellets (Product Aa)
M3 = Nico pellets (Product aA)
M4 = Nico pellets (Product aa)
y = yes; n = no.

98 Experimental part / Preparative methods 2.4.1.2 Coating of sugar spheres
One of the important factors of a coating process is a fluidized flow of the product bed.
Normally if tablets are the loading material then the flow pattern in the product container
outside the Wurster column would be the continuous flow without any bubble in the
product bed. This phenomenon was also recommended by the manufacturer of the
Aeromatic MP-1 <120>. In this present work it was also found out that the continuous
flow without any bubbles or the so called incipiently fluidized bed <122> was suitable
for the coating process because twins or agglomerations of tablets did not occure.
However, if sugar spheres are the loading product then the higher process air flow
should be used. A so called bubbling bed <122> was found to be suitable for the
coating because no big agglomerations occured. The difference between incipiently
fluidized bed and bubbling bed was shown in Figure 2.25. The reason for the difference
of the suitable product bed flow would be the packing of sugar spheres in the product
bed during the coating process. Sugar spheres are almost spherical and therefore they
can create the rhombohedral packing <40>. The small process air flow would allow the
coated pellets to fall too fast to the upper part of the product bed and this air flow would
not be enough to dry the wet pellets before they arrived the upper part of the product
bed. If the wet coated pellets were fallen to the product bed and they have not been
dried then the rhombohedral packing would accelerate the sticking between the wet
coated pellets. This was confirmed by the formation of big agglomerations of pellets. On
the other hand if tablets were used as a loading material their packing will not be
rhombohedral but may be cubic because the tablets did not have a spherical dimension
<40>. The cubic packing may hinder the sticking between tablets. Therefore if tablets
were used as a loading material a smaller air flow can be used in comparison with sugar
spheres.

Experimental part / Preparative methods 99 The different flow pattern of the bed can be achieved with the help of a perforated
bottom with different free holes outside the region of the Wurster column <122>. It was
also found that the different amounts of loading core materials need different free holes
in the perforated bottom outside the region of the Wurster column. For example for
1000, 500 or 100 g of pellets the suitable perforated bottom is 20 %, 13 % and 8 % free
holes, respectively.
Figure 2.25: Two types of fluidized beds; a) incipiently bed, b) bubbling bed; small
circles or ellipsoids demonstrate the air bubbles <122>.
The spraying rate should also be well selected in order to have the continuous flow with
a balance between a wetting phase and a drying phase. If the spraying rate is too high it
may cause the agglomeration of a product bed because of over wetting. If the spraying
rate is too low it may take a long time to finish the coating process and sometimes a
high amount of dust would occur because of spray drying.
The suitable combination was selected from the result that about 1000 g pellets show
well-fluidized flow at a given spraying rate and product bed temperature, no blockage of
the nozzle, and even a film structure with almost no bubbles as demonstrated from the
cross section by SEM.
a b

100 Experimental part / Preparative methods 2.4.1.2.1 Trials with HPMC
HPMC was corpulently used as a subcoat in different works <109,187>. Therefore
HPMC was used in this work in order to compare with the other film-forming polymers
such as PVA or EC. The preliminary study was carried out by using a method modified
from the recommended one <77> to coat the 1000 g sugar spheres.
For this present work the first trials were carried out by using a solution of Pharmacoat
603W at concentrations varying from 5 to 10 % w/w because the spraying rate depends
on the concentration of the polymer solution. Therefore varying of the spraying rate from
1 to 9 g/min was carried out while using the different concentrations of HPMC. The
suitable combination to allow the uniform flow of 1000 g seemed to be a concentration
of 5 % w/w Pharmacoat 603W and a spraying rate of 1.7 g/min, i.e. process number X2,
Table 2.11. However, some twins and small agglomerations of 3 to 5 pellets occured
during the coating process. The resulting HPMC layer at the thickness of about 10 µm
coated on sugar spheres (Product P) with some bubbles in the structure of the HPMC-
layer can be seen in Figure 2.26.
This preliminary study showed that the HPMC film layer was not free from bubbles.
Therefore the other formulations were investigated. According to the literature <77>
there were two types of HPMC i.e. Pharmacoat 603W and Pharmacoat 645W that can
be used as coating materials for sugar spheres. Therefore both types were tested but
no significant difference was found at the same formulation and conditions of coating.
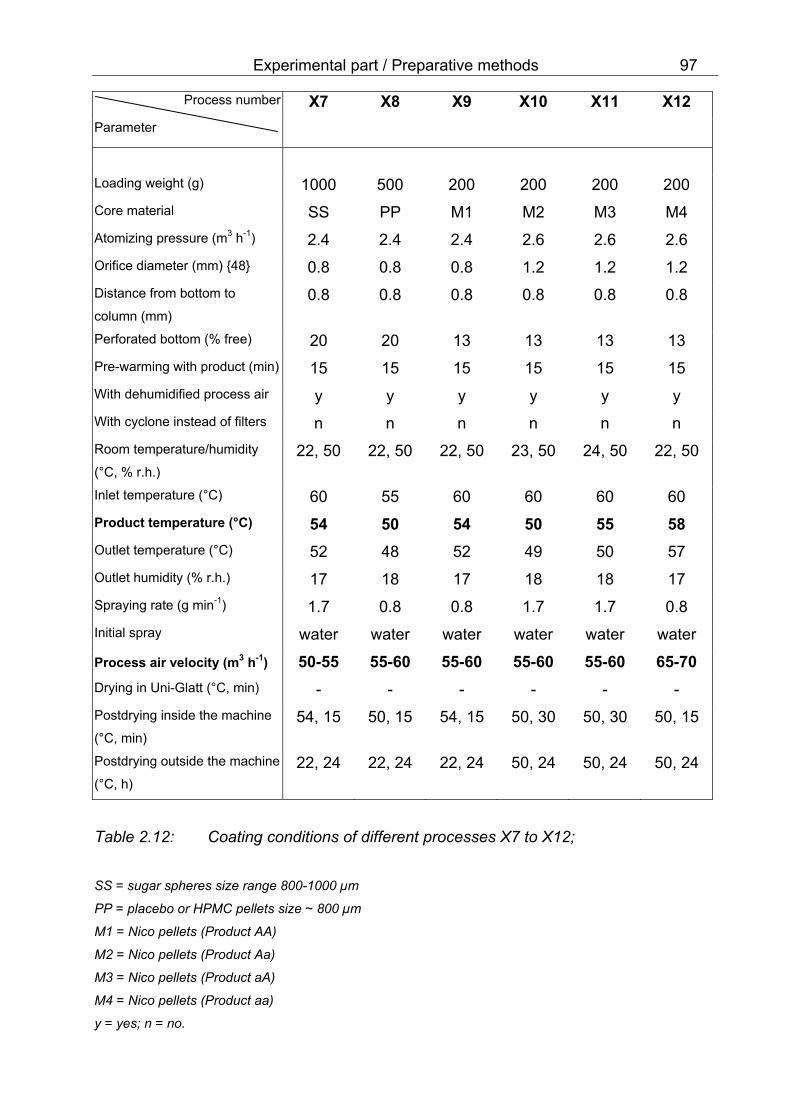
Experimental part / Preparative methods 101
Figure 2.26: HPMC-coated pellet (Product P) shows bubbles in the HPMC film layer.
2.4.1.2.2 Trials with Sepifilm LP 010
The first trial in 2.4.1.2.1 with HPMC as a film-forming polymer alone did not give a
satisfying result and therefore Sepifilm LP 010 was used instead. Sepifilm LP 010 is a
combination of HPMC and other ingredients as already detailed in 2.1.3. Therefore a
better outcome was expected. This polymer may hinder the formation of twins and
agglomerations. The trial was first carried out by varying spraying rates from 1 g/min to
5 g/min and concentrations of aqueous dispersions from 5 to 15 % w/w. The
formulations and coating conditions used in the preliminary test were created on the
basis of the recommended ones <171>.
The formulation containing 5 % w/w Sepifilm LP 010 and the process number X3, Table
2.11 resulted in Product Z1 with a film-thickness of about 10 µm. Films resulted from
this condition showed no significant difference in physical character compared to the
HPMC film (2.4.1.2.1) as demonstrated in the SEM (data not shown). Only the flow
character of pellets during coating was better because almost no agglomeration

102 Experimental part / Preparative methods occured. During the coating process the dispersion tended to sediment and caused
unhomogeneuos dispersion. After a certain coating time blockage of the nozzle
occured. This was not a satisfying result. Therefore Sepifilm LP 010 was not used to
form a subcoat.
2.4.1.2.3 Trials with other additives
As the trial in part 2.4.1.2.1 to 2.4.1.2.2 showed no satisfying result a combination of
HPMC and other additives was tested. The examined additives were water insoluble
(talc, magnesium stearate) or water soluble (polyethylene glycol 400 or 4000).
The particle sizes of the water insoluble additives were determined before they were
added in the coating formulation in order to hinder the blockage of the fluid nozzle as
mentioned before. The example of the measurement of the particle sizes was shown by
using talc.
The largest particle size of talc with or without grinding {38} were 60 ± 10 µm (n = 20
and p < 0.05). There was no difference in the mean largest particle size of talc before
and after grinding. Therefore the grinding was not nescessary before talc was added to
the coating formulation.
Particle size and form of magnesium stearate (Mgst) was determined under a light
microscope as well and the result showed that their largest particles were not biger than
70 ± 10 µm (n = 20 and p < 0.05).
These insoluble additives were added separately at 10 % w/w to a solid content of
Pharmacoat 603W. The total concentration of solid content in water was 10 % w/w. The
result showed that pellets coated with the dispersion containing Pharmacoat 603W and
talc or magnesium stearate using the process number X4, Table 2.11 did not have
better film structure compared to the formula using HPMC alone.
Films resulting from Pharmacoat 603W and talc or Mgst always contained small
bubbles. Moreover these dispersions also caused a sedimentation of insoluble particles
during a long processing time. Therefore the combinations between Pharmacoat 603W
and insoluble additives (talc or Mgst) will not be used to form a subcoat.

Experimental part / Preparative methods 103
Figure 2.27: Microscopic picture of talc dispersed in glycerol 85 %.
The water soluble additive such as PEG was added at 7 % w/w to a solid content of
Pharmacoat 603W. Two types of PEG i.e. PEG 4000 and PEG 400 were used. The
total concentration in water was kept at 10 % w/w. The result of pellets coated with the
10 % w/w solution of Pharmacoat 603W and one of the PEGs using a process number
X5, Table 2.11 showed that during the coating process the spraying nozzle was
blocked. Therefore the solution of 10 % w/w total concentration of Pharmacoat 603W
and PEG 4000 was diluted with water to have a concentration of 5 % w/w. It was found
that this solution can be coated onto pellets at a spraying rate of 1.7 g/min. However,
the film morphology resulting from this combination was not different from Pharmacoat
603W alone (data not shown).
Therefore the combinations between Pharmacoat 603W and soluble additives
(PEG 400 or 4000) will not be used to form a subcoat.
Consequently, the solution to be used to form a subcoat was the formulation R1
(Table 2.15) by using the process number X9 (Table 2.12). This formulation, R1, was
also applied to form the mechanical protecting layer by using the process number X7
(Table 2.12).
scale = 30 µm

104 Experimental part / Preparative methods 2.4.1.2.4 Trials with polyvinyl alcohol (PVA)
PVA was reported to be suitable for use as a miosture barrier film coated on the product
<142>. Therefore different types of PVAs such as Mowiol 3-83, 3-98, 4-88, 4-98, 8-88,
10-98, 18-88, 20-98 and 26-88 as described in the part 2.1.5 were used. The 5 % w/w
solution of each type was prepared in a hot water of 80 °C as a solvent. Batches of 300
g of sugar spheres were coated with each one of these solutions. Spraying rates were
varied from 0.5 to 5 g/min. It was found that only the lowest spraying rate of 0.5 g/min
can be used because in case of higher spraying rates big agglomerates developed and
caused a blockage inside the Wurster column. Consequently 6 different types of PVA
coated pellets (Product Z2 to Z7) using the process number X6, Table 2.11 were
prepared so that the thickness of the PVA-film was about 10 µm. These pellets were
used to determine the moisture barrier property of coated pellets compared to pellets
coated with HPMC and Sepifilm LP 010, details shows in part 2.4.2.
However, the coating process with a PVA solution takes a long time of coating due to a
very low spraying rate of about 0.5 g/min. For this reason a PVA solution alone was not
used as a subcoat because it may take a too long time until the required thickness is
achieved.
2.4.1.2.5 Trials with ethyl cellulose (EC)
Ethyl cellulose was in many cases used as a film-forming agent for the delay released
dosage form <179,118,205,21,67>. The delay of release mostly depends on the
thickness and the structure of EC-film. However, because of the insoluble and non-
hygroscopic property of EC in weakly acidic and basic medium it can be used as a
moisture barrier. The suitable thickness should be selected so that no delay of release
occured.
In this preliminary test the dispersion of EC was prepared from Aquacoat ECD on the
basis of a recommended formula and the coating conditions modified from the
recommended ones <8>. The concentration of dibutyl sebacate based on the solid
content of Aquacoat ECD was varied from 20 to 25 % w/w. The prepared dispersion at
the total concentration of 20 % w/w was for the coating of sugar spheres of about 200 g.
Different spraying rates were tested and the suitable one that did not cause
agglomerations was chosen for the further preparations.

Experimental part / Preparative methods 105 The results show that the suitable coating dispersion was the formulation number R5 in
Table 2.15 which was used to form a subcoat by applying the process number X10 in
Table 2.12.
2.4.1.2.6 Trials with a combination of EC and PVA at two ratios
Because PVA alone will not be used to form a subcoat as mentioned in 2.4.1.2.4, the
possibility to utilize PVA in a combination with another polymer to increase the spraying
rate and to reduce the sticking of coated pellets was tested. Some research works have
used EC in combination with hydrophilic polymer such as HPMC <63,59,149>.
Therefore the comparison by applying a combination of EC and PVA may be of interest.
The dispersion of a combination of EC and PVA for the preliminary test was prepared
according to the modified formula as well as the coating conditions based on the details
mentioned in 2.4.1.2.4 – 2.4.1.2.5. Two different ratios of EC and PVA were prepared to
observe the different physical property after coating. Mowiol 4-98 was used as source
for PVA because it has a low mean molecular mass of about 27000 g/mol and the
4 % w/w solution at 20 °C has a low viscosity of about 4.5 mPa.s. If two polymers have
different chemical structures they should be mixed by adding not more than 30 parts of
the polymer type-I to the polymer type-II to avoid phase separation. DBS was used at
the same concentration to Aquacoat ECD i.e. 20 % w/w to Aquacoat ECD solid content.
PVAs normally do not need any plasticizer and therefore no further amount of DBS was
added.
The results show that the suitable coating dispersion containing 100 parts of
Aquacoat ECD and 30 parts of Mowiol 4-98 was the formulation R6 (Table 2.15). The
suitable coating process was X11 (Table 2.12). The suitable coating formulation
containing 30 parts of Aquacoat ECD and 100 parts of PVA was R7 (Table 2.15) and
the suitable coating conditions was the process number X12 (Table 2.12).
2.4.2 Determination of a moisture barrier property of films coated on pellets
Pellets coated with different types of PVA, HPMC and Sepifilm LP 010 were stored as
mentioned in 2.2.14. They were used to determine the water content as mentioned in
2.2.14 in order to observe the properties of the moisture barrier of films coated on the

106 Experimental part / Preparative methods pellets. The results in Table 2.13 show that the water content of PVA-coated pellets was
not more than 3 % w/w even under a high stress condition of 50 °C and 79 % r.h. This
may indicate that every types of PVAs can protect the core from the vapor water
diffusion and thus may reduce the chemical degradation.
The HPMC-coated pellets (Product P) and the Sepifilm LP 010-coated pellets (Product
Z1) were also stored under the same conditions for a comparison. The determination of
water content after the storage was carried out. The results in Table 2.13 also showed
that the water content of these products was not more than 3 % w/w even under a high
stress condition of 50 °C and 79 % r.h. This means that films from HPMC, Sepifilm
LP010 and different types of PVAs can protect cores from the vapor water diffusion.
Roxin, Karlsson and Singh <155> have used Karl Fischer titration to determine the
water content in the CAP powder. They used methanol and pyridine (1:1) as a solvent
and KF solution A and KF solution B (1:1) as a reagent. The resulted data from KF-
titration was compared with the data from thermogravimetric analysis, DSC-method,
loss on drying test and the certificate. They found that the data of water content were
comparable i.e. the CAP powder contained about 1.5 – 2.5 % w/w water.
Sepifilm LP consists of HPMC (60 - 70 %), microcrystalline cellulose (5 – 15 %) and
stearic acid (20 – 30 %) <171,172>. The number 010 of Sepifilm LP means that it is
uncoloured. The protection against moisture under the stress conditions of 40 °C and
90 % r.h. was reported. The fumitory tablets coated with uncoloured Sepifilm LP 010
were stored for 1 month under the above stress condition. It was found that tablets
coated with Sepifilm LP 010 remained unchanged whereas tablets without coats or
coated with a combination of HPMC and TiO2 contained spots or had a black colour.
The moisture intake of the fumitory tablets coated with Sepifilm LP 010 (5 – 10 % weight
gain) was half of that intake from tablets coated with HPMC and TiO2. This report
showed that Sepifilm LP 010 seems to be suitable for being used as a protection film
against moisture.
Experimental part / Preparative methods 107
Water in the product (% w/w) after a period of storage under different conditions (% r.h., °C, days)
~ 50 % r.h. ~ 80 % r.h. r.t.
25 °C 50 °C 25 °C 50 °C
Product
15 7 14 21 7 14 21 7 14 21 7 14 21
(days)
S 1.8 n n n n n n n n n n n n
P 1.7 1.7 1.7 1.7 1.6 1.5 1.5 2.2 2.4 2.8 2.3 2.8 3.0
Z1 1.7 1.7 1.7 1.7 1.5 1.5 1.5 2.2 2.4 2.5 2.3 2.5 2.8
Z2 1.4 1.4 1.4 1.4 1.4 1.3 1.3 1.5 1.6 1.7 2.3 2.4 2.5
Z3 1.3 1.3 1.3 1.3 1.4 1.2 1.0 1.6 1.9 2.0 2.2 2.3 2.4
Z4 1.5 1.5 1.5 1.5 1.4 1.3 1.1 1.6 1.8 2.0 2.3 2.4 2.7
Z5 1.5 1.5 1.5 1.5 1.5 1.4 1.3 1.6 1.7 1.9 2.0 2.2 2.3
Z6 1.4 1.4 1.4 1.4 1.2 1.1 1.0 2.0 2.1 2.2 2.4 2.5 3.0
Z7 1.4 1.4 1.4 1.4 1.4 1.3 1.3 1.8 1.9 2.0 2.0 2.1 2.2
Table 2.13: Percentage of water in the product after a period of storage under
different conditions; P: HPMC-coated pellets; Z1: Sepifilm-coated
pellets; Z2: Mowiol 3-88 coated pellets; Z3: Mowiol 3-98 coated pellets;
Z4: Mowiol 4-88 coated pellets; Z5: Mowiol 4-98 coated pellets; Z6:
Mowiol 8-88 coated pellets; Z7: Mowiol 10-98 coated pellets; r.t.: room
temperature (22 °C, 50 % r.h.); n: not measured.

108 Experimental part / Preparative methods 2.4.3 Preliminary studies of layering of nicotinamide onto pellets
HPMC was used as a binder to fixed nicotinamide onto the surface of pellets. The
amount of HPMC was varied between 5 - 10 % w/w to nicotinamide content. The
concentration of total solid content between 5 - 20 % w/w was tested whether it can be
sprayed in the layering process or not. It was found from SEM micrograph that
nicotinamide was recrystallized as rods on the surface of the HPMC-coated pellets
(Fig 2.28). The lowest amount of HPMC was selected to produce the Product PN. The
highest concentration of 20 % w/w could not be sprayed at a rate of 1 - 2 g/min.
Therefore the conditions X8 as demonstrated in Table 2.12 was chosen to prepare
nicotinamide-loaded pellets.
Fig 2.28: SEM-micrograph of nicotinamide recrystallized on the surface of HPMC-
coated pellet.
Experimental part / Preparative methods 109 2.4.4 Preparation of placebo
Placebo or HPMC-coated pellets (HPMC pellets) were made in order to have a thin
layer of polymer that protects the inner core (sugar) from a mechanical stress and to
avoid dissolution of the core surface by spraying an aqueous dispersion during the
enteric coating phase. These placebos were prepared in two different sizes i.e. Product
P and Product PP. They were intended for the mixture with the other products to receive
the required amount of loading weight for a coating process.
2.4.4.1 Preparation of HPMC solution
As shown in the formulation R1 in Table 2.15, a 5 % w/w solution of HPMC in water was
prepared from 100.0 g of Pharmacoat 603W. Purified water of about 2/3 of total weight
was heated to 70 °C, before Pharmacoat 603W powder was slowly dispersed into the
warm water constantly stirring with a magnetic stirrer {44}. Pharmacoat 603W was
completely dissolved after the dispersion was cooled down to room temperature. The
rest of the water was added to the solution to achieve a solid content of 5 % w/w.
2.4.4.2 Coating process
HPMC coated pellets (Product P or PP) were prepared by using a combination of the
formulation R1 (Table 2.15) and the process number X2 (Table 2.11). The sugar
spheres fraction size 1000 - 1180 µm, Product S, were cores for preparing Product P
and the sugar spheres fraction size of 800 - 1000 µm were cores for preparing
Product PP.
The fluidized bed apparatus containing filters collected the fine dust that occured during
the process. The loading weight was 1000 g in order to get a big batch for various
further trials. Sugar spheres were used because they have almost spherical geometry
and smooth surfaces. They do not show high friability so that they were suitable as
cores for a coating process with a fluidized bed apparatus. The inlet processing air was
first dehumidified to achieve the constant water content because the room climate was
20 °C and 60 % r.h.. The pre-warming phase was 15 min to achieve the desired
temperature of the product before coating with the polymer solution. The initial spraying
with water was necessary to remove static charges from the product bed during the pre-
heating phase. The inlet air was heated up to a temperature of 60 °C to obtain the

110 Experimental part / Preparative methods product temperature of 54 °C. All the temperatures (inlet air, product bed, outlet) were
varied in the range of ± 2 °C. The solution of HPMC could be well atomized by an air
stream of 2.4 m3 h-1. By spraying the HPMC solution at a spraying rate of 1.7 g min-1
into the coating chamber, the relative humidity increased from 4.3 % r.h. to 18 % r.h.
which was observed from the outlet air. The process air velocity was set at about 50 -
55 m3 h-1 to avoid a high formation of dust, yet allowing a good fluidization of 1000 g of
pellets. The postdrying of coated products was carried out inside the fluidized bed
machine at the product bed temperature of 54 °C for 15 min. Hereafter, the finished
coated pellets have been further dried at room temperature over night before storage.
The resulting real coating level was lower than the theoretical coating level as
demonstrated in Tables 2.25 - 2.26 because of the loss as a fine dust during the
process. The finished coated pellets (Product P or PP) have a white colour because of a
colourless clear film, which was formed around the pellets surface. The quality control
using sieve analysis showed that the product was well prepared because the fraction
sizes were concentrated in the small ranges as stated in Table 2.14. These pellets were
later on used as placebo while mixing with other pellets to get the required total weight
for a coating batch.
The theoretical and real coating level (% w/w) can be calculated as follows;
A theoretical coating level = A X B
D
A real coating level = 100 (C – D)
D
A = concentration of a dispersion used (% w/w)
B = real weight of a dispersion used (g)
C = weight of finished coated pellets (g)
D = weight of loaded pellets (g)

Experimental part / Preparative methods 111
Type of Product / (%w/w) Size fraction (µm)
SS PP S P
< 800 0.5 0.3 0.0 0.0
800 - 1000 95.3 57.3 1.2 0.0
1000 - 1120 4.2 42.3 70.5 4.6
1120 - 1250 0.0 0.1 28.3 93.3
1250 - 1400 0.0 0.0 0.0 2.1
> 1400 0.0 0.0 0.0 0.0
Table 2.14: Sieve analysis of HPMC-coated pellets compared to cores.
For example, Product P, was prepared starting with a loading weight of 1000 g cores,
X2 (Table 2.11). The solution of HPMC totally used was 400.0 g which means the
theoretical weight gain should be 2.0 % w/w. However, after weighing the finished
coated product the real weight gain was only 1.8 % w/w (Table 2.25). For other finished
products the theoretical and real weight gains can be calculated in the same way.
The amount of coating materials on the pellets was also calculated by the ratio between
the amount of coating materials coated on the surface of one pellet to its surface area.
This parameter was calculated as mg cm -2. The amount of coating materials was
calculated by weighing 100 pellets before and after coating. The surface area of pellets
have been calculated from the mean diameter of one pellet basing on an image analysis
method.

112 Experimental part / Preparative methods
Formulation
R1
R2
R3
R4
R5
R6
R7
Ingredients
HPMC solid (g) 100 100 3 100 - - -
Methyl orange (g) - 2 - - - - -
Nicotinamide (g) - - 60 - - - -
L-Orange Z 2010 (g) - - - 2 - - -
Indigotin (g) - - - - - - 2
L-Rot Z 3020 (g) - - - - 2 - -
L-Grün Z 6130 (g) - - - - - 2 -
Polyvinyl alcohol (g) - - - - - 30 100
(Aquacoat ECD liquid (g))
~ Aquacoat ECD solid (g)
-
-
-
-
-
-
-
-
(333)
100
(333)
100
(100)
30
DBS (g) - - - - 20 20 6
Concentration (% w/w) 5 5 20 5 20 20 7
Table 2.15: Different coating formulations (R1- R7);
R1: A 5 %w/w solution of HPMC
R2: A 5 % w/w solution of HPMC and dissolved methyl orange
R3: A 20 % w/w solution of nicotinamide and HPMC
R4: A 5 % w/w solution of HPMC with an orange colour to prepare a
subcoat from HPMC
R5: A 20 % w/w dispersion of EC with a red colour to prepare a subcoat
from EC
R6: A 20 % w/w dispersion of EC and PVA with a green colour to
prepare a subcoat from EC and PVA (100 + 30 parts)
R7: A 7 % w/w dispersion of PVA and EC with a blue colour to prepare
a subcoat from PVA and EC (100 + 30 parts)

Experimental part / Preparative methods 113 2.4.5 Preparation of a product containing HPMC and methyl orange
This product was prepared in order to optimize the formulation and process conditions
of enteric coating containing Aquacoat CPD, TEC and/or other additives. However, the
varying of the enteric formulations and process conditions were based on the
recommendation from the FMC <25,7> and the reasearch work of Williams and Liu
<200>. The coated pellets with a primary thin layer of HPMC containing methyl orange
(MO pellets) were used for the fast test of the resistance to 0.1 N HCl of the film coated
above the pellets. Methyl orange as an indicator allowed the fast observation of the
colour change with naked eyes without any complicated spectroscopic methods. The
details of this characterization method were mentioned in 2.2.7. Figure 2.29 shows the
building up of the finished products.
2.4.5.1 Preparation of a solution containing HPMC and methyl orange
As shown in Table 2.15, R2, a 5 % w/w solution of HPMC containing methyl orange was
prepared from 100.0 g {16} of Pharmacoat 603W and 2.0 g {1} of methyl orange. First
purified water of about 2/3 of total weight was heated to 70 °C. Pharmacoat 603W
powder was slowly dispersed into the warm water constantly stirring with a magnetic
stirrer {44}. Hereafter two parts of methyl orange were slowly distributed into the HPMC
solution after cooling down to room temperature. The mixture was stirred until it became
a gold coloured solution.
2.4.5.2 Coating process
MO pellets (Product A, Table 2.25) were prepared in accordance with the combination
of the formulation number R2, Table 2.15 and the process number X13, Table 2.23. The
coating process was performed using a fluidized bed apparatus inserted with filters in
the same way as already mentioned. Finished coated pellets had a gold colour, which
originated from methyl orange which was used as an indicator. Therefore a mixture of
placebo pellets (Product P) and MO pellets (Product A) will not cause demixing or non
homogeneous flow in the fluidized bed apparatus during the coating process because
they have almost the same size fraction about 1120 µm.

114 Experimental part / Preparative methods
Figure 2.29: Finished enteric coated pellets with a layer containing dissolved methyl
orange.
2.4.6 Preparation of products containing nicotinamide with or without a
subcoat
Coated pellets containing nicotinamide for the main work were prepared with or without
subcoats. Four different subcoats were used i.e. HPMC, EC, and a combination of EC
and PVA at two ratios. Sugar spheres were coated first with HPMC to have a thin layer
of about 10 µm. Hereafter the thin and homogeneuos layer with primary nicotinamide
was coated on the HPMC pellets. Each subcoat was then layered in different
thicknesses. If pellets without any subcoats were required then enteric coat was directly
applied on the nicotinamide loaded pellets. Figure 2.30 shows the building up of the
expected finished products.
1 2 3
1: Sugar sphere 2: HPMC-MO 3: Enteric coat

Experimental part / Preparative methods 115
Figure 2.30: Finished enteric coated pellets containing nicotinamide and different
subcoats.
2.4.6.1 The first layer: HPMC
The first layer made from HPMC was used as a mechanical protecting layer of cores.
HPMC coated pellets (Product PP) were prepared from sugar spheres fraction size
800 - 1000 µm. The preparating technique of the solution, formulation R1, was as
prescribed in 2.4.4.1. The product was manufactured on an Aeromatic MP-1 with
inserted filters and process number X7, Table 2.12.
2.4.6.2 The second layer: Nicotinamide-HPMC
The thin layer containing nicotinamide was prepared by layering the solution containing
nicotinamide and HPMC as a binder by using HPMC coated pellets (Product PP) as a
loading material. These nicotinamide loaded pellets (Product AA, Aa, aA and aa) were
used as a loading material to be coated with different subcoats later on. If no subcoat
1 2 3 4 5
1: Sugar sphere 2: HPMC 3: HPMC-Nicotinamide 4: Subcoat or no subcoat 5: Enteric coat

116 Experimental part / Preparative methods was needed then these nicotinamide loaded pellets (Nico pellets) were used directly as
a loading material for the coating with the dispersion containing CAP and a plasticizer.
2.4.6.2.1 Preparation of a solution containing nicotinamide
As shown in Table 2.15, R3, the 20 % w/w solution of nicotinamide and Pharmacoat
603W as a binder was prepared. Nicotinamide is a well soluble water substance and
therefore it was added into water of 2/3 total amount while stirring. The small amount of
3.0 g of Pharmacoat 603W accurately weighed was slowly dispersed into the solution of
nicotinamide after nicotinamide was totally dissolved while constantly stirring with a
magnetic stirrer {44}.
2.4.6.2.2 Coating process
Coated pellets containing nicotinamide (Nico pellets) were prepared according to the
process number X8, Table 2.12. HPMC coated pellets (Product PP, Pp, pP and pp)
500 g were used as cores to prepare four charges of Nico pellets (Product AA, Aa, aA
and aa), respectively.
2.4.6.3 The third layer: Different intermediate coats ( subcoats )
A subcoat from four different formulations were prepared by using Nico pellets (Product
AA, Aa, aA, aa) as a loading material.
2.4.6.3.1 Subcoat from HPMC
The preparating technique of solution was almost the same as mentioned in 2.4.4.1 on
basis of the formulation R4, Table 2.15. The difference was that the orange colour
powder (L-orange Z 2010, part 2.1.10.3) was added into heated water. Pharmacoat
603W was added after the colour powder was totally dissolved. The process number
X9, Table 2.12 and the Aeromatic MP-1 {20} with inserted filters were used for the
manufacture of this product. The resulted product has an orange colour which came
from the marker incorporated in the subcoat layer.
Experimental part / Preparative methods 117 2.4.6.3.2 Subcoat from EC
2.4.6.3.2.1 Preparation of a dispersion containing Aquacoat ECD and DBS
All substances i.e., Aquacoat ECD, DBS and red colour powder were exactly weighed
using a digital balance {17}. 20.0 g of DBS was added into 333.0 g of Aquacoat ECD-30
while constantly stirring with a magnetic stirrer {43}. After DBS was homogeneuos
dispersed i.e. about 15 min, 2 g of red colour powder (L-Rot Z 3020, part 2.1.10.2) was
added. Finally the rest amount of water was added into the dispersion to receive the
concentration of 20 % w/w. Further mixing for at least one hour followed. The dispersion
was filtered through the 100 µm sieve before use as a coating dispersion and the
constant stirring {43} of the dispersion during the coating process was performed.
2.4.6.3.2.2 Coating process
The formulation R5, Table 2.15 and the process number X10, Table 2.12 and the
Aeromatic MP-1 with inserted filters served for the production. The resulted product has
a pink colour.
2.4.6.3.3 Subcoat from E&P
2.4.6.3.3.1 Preparation of a dispersion containing Aquacoat ECD and PVA
All substances i.e., Aquacoat ECD, DBS, Mowiol 4-98 and green colour powder were
exactly weighed on a digital balance {16,1}. The first liquid was prepared by adding 2.0
g of green colour powder (L-Grün Z 6130, 2.1.10.4) into 1/3 of total required amount of
water which hereafter was heated to 80 °C. 30.0 g of Mowiol 4-98 was slowly added into
this heated water while constantly stirring {44}. The second liquid was prepared by
adding 20.0 g of DBS into 333.0 g of Aquacoat ECD-30 while constantly stirring with a
magnetic stirrer {43}. After DBS was homogeneuosly dispersed i.e. about 15 min, the
first liquid containing green colour was added into the white coloured dispersion while
constantly stirring. The rest amount of water was added into the dispersion to receive
the concentration of 20.0 % w/w. Further mixing for at least one hour followed {43}. The
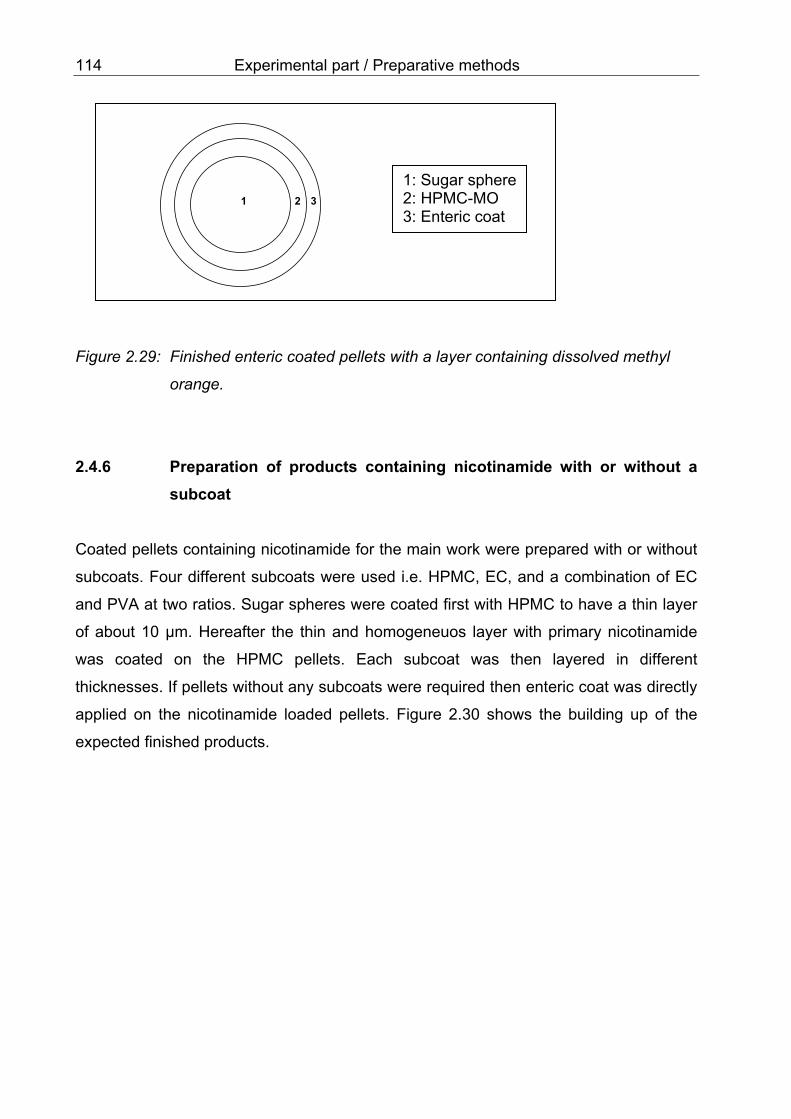
118 Experimental part / Preparative methods dispersion was filtered through the 100 µm sieve before coating and the constant
stirring {43} of the dispersion during the coating process was performed.
2.4.6.3.3.2 Coating process
This product was manufactured on the basis of the formulation R6, Table 2.15 and the
process number X11, Table 2.12 using Aeromatic MP-1 with inserted filters. The
resulted product had a green colour.
2.4.6.3.4 Subcoat from P&E
2.4.6.3.4.1 Preparation of a dispersion containing PVA and Aquacoat ECD
All substances i.e., Mowiol 4-98, Aquacoat ECD, DBS and blue colour powder
(Indigotin, 2.1.10.1) were exactly weighed on a digital balance {16,1}. The first liquid
was prepared by adding 2 g of blue colour powder into 1/3 of total required amount of
water which was then heated up to 80 °C. 100.0 g of Mowiol 4-98 were slowly added
into this heated water while constantly stirring {44}. The second liquid was prepared by
adding 6.0 g of DBS into 100.0 g of Aquacoat ECD-30 while constantly stirring with a
magnetic stirrer {43}. After DBS was homogeneuosly dispersed i.e. about 15 min, the
first liquid containing blue colour was added into the white coloured dispersion while
constantly stirring. The rest amount of water was added into the dispersion to receive
the concentration of 7.0 % w/w. Further mixing for at least one hour followed. The
dispersion was filtered through the 100 µm sieve before use as a coating dispersion and
the constant stirring of the dispersion during the coating process was performed.
2.4.6.3.4.2 Coating process
The product was manufactured according to the formulation R7, Table 2.15 and the
process number X12, Table 2.12 using Aeromatic MP-1 with inserted filters. The
finished coated product has a blue colour.

Experimental part / Preparative methods 119 2.4.7 Preliminary studies of enteric coating with CAP and different
plasticizers.
The dispersion of cellulose acetate phthalate was prepared from Aquateric or
Aquacoat CPD. As mentioned by the supplier, Aquateric needs more plasticizer than
Aquacoat CPD and therefore the formulation of the coating dispersion was prepared
basing on the recommendation. Diethyl phthalate (DEP) and dibutyl sebacate (DBS)
and triethyl citrate (TEC) were used as a plasticizer in the enteric coating formulation.
The formulations and coating conditions were modified on bases of the publications
<200,31,25,7,9>. The concentration of the dispersion was varied from 10 to 20 % w/w
and the highest concentration that allowed good conditions of coating was chosen. After
tests of different spraying rates the highest one which did not cause agglomerations
was chosen.
2.4.7.1 Enteric coating of pellets using Aquateric
Aquateric was the powder product which can be used as an enteric film-forming agent
as already detailed in 2.1.6.1. This product was in the market since long and therefore it
was used to compare the result with formulations using Aquacoat CPD-30 which was
the new ready-to-use 30 %w/w dispersion. The preparating technique of the dispersion
and the process conditions were modified from the recommended ones <9>.
a) Preparation of an enteric coating dispersion by using Aquateric
All substances were accurately weighted on a digital balance {16,1}. Tween 80 was
added as emulsifier to about 2/3 of total amount of purified water and mixed for 5 min.
Plasticizer was slowly added into the above mentioned solution and further mixed for
15 min. Aquateric powder was slowly added by using a magnetic stirrer {43} and mixed
over night without heating or cooling. Purified water was added afterwards to obtain a
required concentration. Further mixing for about 30 min followed. The dispersion was
filtered through the 100 µm sieve before use as a coating dispersion and the constant
stirring of the dispersion during the coating process was performed.

120 Experimental part / Preparative methods 2.4.7.2 Enteric coating of pellets using Aquacoat CPD-30
Aquacoat CPD-30 was used as an enteric film-forming polymer because it is a new
product containing CAP. The ready-to-use 30 % w/w dispersion is already mentioned
before in 2.1.6.2. Therefore it is interesting to compare the result with Aquateric which
needed more steps and substances (e.g Tween 80) to prepared the dispersion. The
preparating technique of the dispersion and the process conditions were modified from
the recommended ones <7>.
a) Preparation of an enteric coating dispersion from Aquacoat CPD and other
additives
If any other additional substances should be added e.g. talc, magnesium stearate, PVA
etc. the following modified method should be used. The first dispersion containing
Aquacoat CPD was prepared by moderately stirring {43} the dispersion of Aquacoat
CPD while a plasticizer e.g. DEP, DBS or TEC was slowly added and further stirring of
about 15 min was required. The second dispersion was prepared from water with or
without Poloxamer 407 as a medium for dispersing magnesium stearate (Mgst) or talc
with a mixer {46}. These two dispersions were mixed together by pouring the second
dispersion to the CAP-dispersion while constantly mixing. Water was added to bring the
required cencentration with additional mixing over night. The plasticized dispersions of
Aquacoat CPD were sieved through a 100 µm sieve prior to coating and they were
continuously mixed {43} during the coating process.
2.4.7.3 Enteric coating process of pellets containing nicotinamide
The white pellets containing nicotinamide (Product PN, part 2.4.3) were used in different
trials to find out the optimum condition for the enteric coated process applying
formulations containing Aquacoat CPD and plasticizer. The pink coloured placebo
pellets were mixed with nicotinamide-loaded pellets (Product PN) to reach a loading
weight for the coating process in different trials. The mixture of these pellets was coated
with different CAP aqueous dispersions (PR1 – PR18) as demonstrated in Tables 2.16-
2.19.

Experimental part / Preparative methods 121 Composition / Coating conditions PR1 PR2 PR3 PR4 PR5
Aquateric (g) Aquacoat CPD (g)
- 527
- 150
- 283
50 -
60 -
Polymer solid (g) 158 45 85 50 60 DEP (% w/w to polymer) 20 20 20 10 40 DBS (% w/w to polymer) - - - - - TEC (% w/w to polymer) - - 20 - - Triacetin (% w/w to polymer) - - - 20 - Tween80 (% w/w to polymer) - - - 1 1 Concentation (% w/w) 20 15 15 15 20
Load (g) 1000 900 850 850 400 Material PN PN PN PN PN Atomizing pressure (m3/h) 2.9 2.9 2.9 2.8 2.7 Orifice diameter (mm) 1.2 1.2 1.2 1.2 1.2 Distance from bottom to column (mm) 0.8 0.8 0.8 0.8 0.8 Perforated bottom (% free holes) 20 20 20 20 20 Pre-warming (min) 15 15 15 15 15 with dehumidifying device (y/n) y y y y y with cyclone (y/n) n n n n n Room temp/humidity (°C, % r.h.) 25, 35 25, 34 24, 30 24, 29 25, 25 Inlet temp (°C) 35 35 35 50 50 Product Temp (°C) 34 34 34 45 45 Outlet temp (°C) 34 34 34 45 45 Outlet humidity (% r.h.) 25 25 25 20 20 Spraying rate (g/min) 1.7 1.7 1.7 1.7 1.7 Initial spray water water water water water Process with stop (y/n) y y y y y Air flow (m3/h) 60-65 60-65 60-65 60-65 55-60 Postdrying in machine (°C, min) 35, 30 50, 30 35, 40 50, 60 60, 30 Postdrying temp/time outside machine (°C, h) 30, 24 50, 24 50, 24 22, 24 50, 24 Coating amount (% w/w) 10 10 10 10 10 Table 2.16: Composition and coating conditions of coating processes with aqueous
dispersions of CAP and DEP (PR1 - PR5).
2.4.7.3.1 Discussion of preliminary studies of coating processes of pellets with CAP and DEP
PR1
It was found that the partition part between the Wurster column and the perforated
bottom of 0.8 mm seemed to be suitable. The product bed temperature was kept at
about 34 °C, spraying rates were varied from 1.3 - 1.8 g/min. The air volume was about
60 m3/h. It was found that the flow of the loading product in the coating apparatus was
not continuous because there were big holes inbetween the product bed during the
spraying of the coating material. The finished coated product was further dried in a hot

122 Experimental part / Preparative methods air oven at 30 °C overnight. However, the coated products after drying overnight were
not resistant to the artificial gastric fluid.
PR2
The smaller concentration of the dispersion was tested to see whether the flow pattern
was improved or not. There was no significant difference between the polymer
concentration in flow pattern. The higher curing temperature did not improve the
structure of the coated pellets as well. The surface still contained crack and non-
coalesced particles. The coated pellets did not resist to 0.1 N HCl.
PR3
The addition of another the plasticizer (TEC) was experimented. However, the coated
pellets after curing sticked together. This may be due to the high amount of plasticizer
mixture which will have a high efficiency to reduce the MFFT and Tg.
PR4
The combination of plasticizers (DEP and Triacetin) were also tested. The coated
pellets after curing also sticked together.
PR5
The higher amount of DEP at 40 % w/w to Aquateric solid content was tested. The
coated pellets, however, were not resistant to 0.1 N HCl which may be due to the
incomplete coalescence.
PR6
The lower product bed temperature of about 27 °C and the higher spraying rate of
2.8 g/min to increse the relative humidity during coating process was tested. The coated
pellets were not resistant to 0.1 N HCl.
PR7
The higher product bed temperature of about 41 °C was used to increase the
coalescence. The structure of film still contained cracks.

Experimental part / Preparative methods 123 Composition / Coating conditions PR6 PR7 PR8 PR9 PR10
Aquateric (g) Aquacoat CPD (g)
150 300 -
87 -
30 -
50 -
Polymer solid (g) 150 300 87 30 50 DEP (% w/w to polymer) 35 35 35 35 35 DBS (% w/w to polymer) - - - - - TEC (% w/w to polymer) - - - - - PVA (% w/w to polymer) - - Talc (% w/w to polymer) - - 10 - - Tween80 (% w/w to polymer) 1 1 1 1 1 Concentration (% w/w) 20 20 20 15 20
Load (g) 360 350 300 100 100 Material PN PN PN PN PN Atomizing pressure (m3/h) 2.6 2.6 2.6 2.2 2.2 Orifice diameter (mm) 1.2 1.2 1.2 1.2 1 Distance from bottom to column (mm) 0.8 0.8 0.8 1 1 Perforated bottom (% free holes) 13 13 13 Uniglatt Uniglatt Pre-warming (min) 15 15 15 15 15 with dehumidifying device (y/n) y y y n n with cyclone (y/n) n n n y y Room temp/humidity (°C, % r.h.) 24, 30 24, 28 24, 24 - - Inlet temp (°C) 35 50 35 65 73 Product Temp (°C) 27 41 30 63 66 Outlet temp (°C) 27 40 30 60 64 Outlet humidity (% r.h.) 35 20 31 - - Spraying rate (g/min) 2.8 2.8 2.8 1.7 1.7 Initial spray water water water water water Process with stop (y/n) y y y n n Air flow (m3/h) 30-35 30-35 30-35 30% 30% Postdrying in machine (°C, min) 60, 30 30, 20 35, 20 70, 60 80, 60 Postdrying temp/time outside machine (°C, h) 35, 24 35, 24 35, 24 50, 24 50, 24 Coating amount (% w/w) 10 10 10 10 10 Table 2.17: Composition and coating conditions of coating processes with aqueous
dispersions of CAP and DEP (PR6 - PR10).
PR8
Talc was added to the coating formulation to improve the resistance to 0.1 N HCl but
the coated pellets were not resistant to gastric fluid. This may be due to the incomplete
coalescence.
PR9 - PR10
The higher product bed temperatures of about 63 - 66 °C were investigated by using the
small scale fluidized bed apparatus {19}. The coated pellets were not resistant to 0.1 N
HCl.

124 Experimental part / Preparative methods Composition / Coating conditions PR11 PR12 PR13 PR14
Aquateric (g) Aquacoat CPD (g)
200 -
30 -
30 -
30 -
Polymer solid (g) 200 30 30 30 DEP (% w/w to polymer) 40 40 40 40 DBS (% w/w to polymer) - - - - TEC (% w/w to polymer) - - - - PVA (% w/w to polymer) - 20 5 5 Tween80 (% w/w to polymer) 1 1 1 1 Concentration (% w/w) 20 15 15 15
Load (g) 100 100 100 280 Material PN PN PN PN Atomizing pressure (m3/h) 2.2 2.2 2.2 2.6 Orifice diameter (mm) 1 1 1 1.2 Distance from bottom to column (mm) 1 1 1 0.8 Perforated bottom (% free holes) Uniglatt Uniglatt Uniglatt 13 Pre-warming (min) 15 15 15 15 with dehumidifying machine (y/n) n n n y process with Uniglatt y y y n Room temp/humidity (°C, % r.h.) - - - 24, 25 Inlet temp (°C) 55 55 54 50 Product Temp (°C) 51-53 54 53 45 Outlet temp (°C) 50-52 51 52 45 Outlet humidity (% r.h.) - - - 19 Spraying rate (g/min) 1.7 1.7 0.8 1.7 Initial spray water water water water Process with stop (y/n) n n n y Position at Uniglatt (%) or air flow (m3/h) 55% 50% 35% 35 Postdrying in machine (°C, min) 60, 30 50, 60 50, 60 50, 60 Postdrying temp/time outside machine (°C, h) 50, 24 50, 24 50, 24 50, 24 Coating amount (% w/w) 10 10 10 10
Table 2.18: Composition and coating conditions of coating processes with aqueous
dispersions of CAP and DEP (PR11 - PR14).
PR11
The lower product bed temperatures of about 51 - 53 °C were tested in Uniglatt {19} but
the coated pellets were not resistant to 0.1 N HCl.
PR12
The addition of PVA as a additional plasticizer was tested, but there was high
agglomeration because of sticking of pellets during coating process.

Experimental part / Preparative methods 125 PR13 – PR14
The concentration of PVA was reduced to 5 % w/w. The product bed temperatures were
between 45 - 53 °C, but the coated pellets were not resistant to 0.1 N HCl.
2.4.7.3.2 Discussion of preliminary studies of coating processes of pellets with CAP and DBS
PR15
The product bed temperature was kept lower than 35 °C. The spraying rate was high at
about 2.8 g/min. It was found that there were holes in between the product bed inside
the product container during the coating process. The flow pattern was not continuous.
This means the possibility to improve the flow pattern should be found. Moreover, the
structure of the coated pellets was not homogeneous. Many uneven regions were
distributed around the surface of the pellets. The coated pellets were not resistant to
0.1 N HCl.
PR16
Talc was added into the formulation to improve the resistance to 0.1 N HCl and
therefore the amount of DBS was increased. However, the coated pellets were not
resistant to 0.1 N HCl.
PR17
A higher product bed temperature and less atomizing pressure was tested. The curing
after coating process was performed at 50 °C for 24 h. The coated pellets were not
resistant to 0.1 N HCl as well. The structure of film still unhomogeneous with uneven
regions.
PR18
The higher product bed temperature of 45 °C was tested. PVA was added to have a
combination of two plasticizers (water-soluble and water-insoluble plasticizer). The
curing was performed at high temperature of 50 °C inside the coating apparatus to
avoid agglomeration at high temperature. The spraying rate was reduced because the
formulation containing PVA tended to cause sticking during the coating process.

126 Experimental part / Preparative methods Composition / Coating conditions PR15 PR16 PR17 PR18
Aquateric (g) Aquacoat CPD (g)
100 -
100 -
100 -
100 -
Polymer solid (g) 100 100 100 100 DEP (% w/w to polymer) - - - - DBS (% w/w to polymer) 35 40 35 30 TEC (% w/w to polymer) - - - - PVA (% w/w to polymer) 10 Talc (% w/w to polymer) - 10 - - Tween80 (% w/w to polymer) 1 1 1 1 Concentration (% w/w) 25 25 20 20
Load (g) 300 300 300 300 Material PN PN PN PN Atomizing pressure (m3/h) 2.6 2.6 2.2 2.6 Orifice diameter (mm) 1.2 1.2 1.2 1.2 Distance from bottom to column (mm) 0.8 0.8 0.8 0.8 Perforated bottom (% free holes) 13 13 13 13 Pre-warming (min) 15 15 15 15 with dehumidifying device (y/n) y y y y with cyclone (y/n) n n n n Room temp/humidity (°C, % r.h.) 24, 25 24, 25 23, 25 24, 25 Inlet temp (°C) 35 35 40 50 Product Temp (°C) 30 30 35 45 Outlet temp (°C) 30 30 35 45 Outlet humidity (% r.h.) 29 29 26 18 Spraying rate (g/min) 2.8 2.8 2.8 1.7 Initial spray water water water water Process with stop (y/n) y y y y Air flow (m3/h) 50 50 50 50 Postdrying in machine (°C, min) 60, 60 60, 60 40, 30 50, 60 Postdrying temp/time outside machine (°C, h) 25, 24 25, 24 50, 24 25, 24 Coating amount (% w/w) 40 40 40 40 Table 2.19: Composition and coating conditions of coating processes with aqueous
dispersions of CAP and DBS (PR15 - PR18).
2.4.7.4 Enteric coating process of pellets containing methyl orange
The gold-yellow pellets were used in different trials to find out the optimum condition for
the enteric coated process applying formulations containing Aquacoat CPD and TEC.
The white coloured placebo pellets (Product P) were mixed with orange coloured
MO-loaded pellets (Product A) to reach a loading weight for the coating process in
different trials. The mixture of these pellets was coated with different CAP aqeuous
dispersions (PR19 - PR30) as demonstrated in Table 2.20 - 2.21.

Experimental part / Preparative methods 127 2.4.7.4.1 Discussion of preliminary studies of coating processes of pellets with
CAP and TEC.
Williams and Liu <200> have studied the effect of process conditions to the finished
CAP-coated pellets. The parameters that they studied were as follows; the outlet
temperatures of 36 or 48 °C, the spray rates of 2 or 3.2 g/min and the fluidizing air
velocities of 50 or 90 m 3 h-1. They used 250 g of theophylline pellets as cores and the
coating process was performed in a fluidized-bed coater assembled with a Wurster
insert. The 1.2 mm spray nozzle was inserted and the atomizing pressure was adjusted
at 1.5 bar. The core pellets were coated with aqueous dispersions containing two levels
of plasticizer DEP i.e. 30 and 35 %.
PR19
The coating process with a high loading weight of about 900 g was performed and the
product bed temperature was kept at about 34 °C. The spraying rate was at 1.5 g/min.
The air flow was set at about 60 m3/h so that the flow pattern of pellets was not higher
than the upper edge of the product container. It was found that big holes occured within
the product bed during the coating process. There was a high amount of twins or
agglomerations of coated pellets. It took a long time until the coating level was
achieved. Therefore it should be tested whether the coating process can be performed
with a smaller loading amount or not. At the coating amount of 16 % w/w the coated
pellets was not resistant to 0.1 N HCl.
PR20
The smaller loading amount was tested and it was possible to perform the coating
process with the loading amount of about 100 - 400 g. The higher product bed
temperature of 45 °C was tested and the spraying rate was at 1.5 g/min. The air flow
was adjusted so that the flow pattern was not higher than the upper edge of the product
container. There was a high amount of fine dust which accumulated at the filters. These
coated pellets were also not resistant to 0.1 N HCl.

128 Experimental part / Preparative methods Composition / Coating conditions PR19
PR20
PR21
PR22
PR23
PR24
Aquateric (g) Aquacoat CPD (g)
- 808
40 -
60 -
- 200
- 200
- 200
Polymer solid (g) 129 40 60 60 60 60 DEP (% w/w to polymer) - - - - - - DBS (% w/w to polymer) - - - - - - TEC (% w/w to polymer) 25 35 35 25 25 25 Triacetin (% w/w to polymer) - - - - - - Talc (% w/w to polymer) - - - - - - Mgst (% w/w to polymer) - - - - 10 10 Poloxamer (% w/w to Mgst) - - - - 1 1 EC (% w/w to polymer) - - - - - - Tween80 (% w/w to polymer) - 1 1 - - - Concentation (% w/w) 15 20 20 15 15 15
Load (g) 870 370 360 300 300 300 Material MO MO MO MO MO MO Atomizing pressure (m3/h) 2.8 2.9 2.6 2.6 2.6 2.6 Orifice diameter (mm) 1.2 1.2 1.2 1.2 1.2 1.2 Distance from bottom to column (mm) 0.8 0.8 0.8 0.8 0.8 0.8 Perforated bottom (% free holes) 20 13 13 13 13 13 Pre-warming (min) 15 15 15 15 15 15 with dehumidifying device (y/n) y y y y n n with cyclone (y/n) n n n n n n Room temp/humidity (°C, % r.h.) 25, 34 25, 26 25, 26 23, 31 21, 59 20, 60 Inlet temp (°C) 35 50 35 40 40 50 Product Temp (°C) 34 45 33 35 36 45 Outlet temp (°C) 34 45 33 35 36 45 Outlet humidity (% r.h.) 26 20 28 21 31 23 Spraying rate (g/min) 1.5 1.5 1.8 1.8 1.8 1.8 Initial spray water water water air air air Process with stop (y/n) y y y y y y Air flow (m3/h) 60 40 44 45 55 55 Postdrying in machine (°C/min) 50, 40 50, 30 60, 15 35, 15 36, 15 45, 15 Postdrying temp/time outside machine (°C, h) 50, 48 50, 3 22, 24 22, 24 22, 24 22, 24 Coating amount (% w/w) 16 20 33 7 - 22 5 8 Table 2.20: Composition and coating conditions of coating processes with aqueous
dispersions of CAP and TEC (PR19 – PR24); MO: Product A (Table 2.25).
PR21
The atomizing pressure was reduced to 2.6 m3/h and the product bed temperature was
reduced to about 33 °C in order to avoid spray drying which means a high loss of
coating materials. Though there was a high amount of coating materials the coated
pellets were not resistant to 0.1 N HCl.
Experimental part / Preparative methods 129 PR22
The coating formulation contained TEC (25 % to Aquacoat solid content) as a
plasticizer. This coating process (PR22) was performed and then compared to the
coating process using Aquateric and TEC (PR21). The postdrying was performed at the
product bed temperature because it was recommended not to use high temperatures
<360>. The resistance test was not satisfactory as well.
PR23
The dehumidifying device was not used because the coating process at a higher
relative humidities should be performed. The incorporation of magnesium stearate was
tested whether it can hinder the formation of the agglomerations or not. It was found
that a smaller amount of agglomerates was formed but non-coalesced polymer particles
were presented under the SEM.
PR24
The higher product bed temperature of 45 °C was used in order to improve the
formation of the well coalesced continuous film, but the non-coalesced polymer particles
were presented under the SEM as well.
PR25
The process number PR25 (Table 2.21), was performed with a low product temperature
of 32 °C and low air velocity of 50 - 55 m 3 h-1. The spraying rate was kept low of 0.8
g/min to avoid agglomerations and uncontinuous flow of product bed inside the
container, but this condition still caused a high agglomeration of the pellets and then a
formation of holes in the outer CAP film layer. The agglomeration of pellets (twins or
groups of more than two pellets) caused defects of the CAP films when they separated
from each other. The film defect can be clearly seen under a light microscope.
PR26
The same condition with a higher product bed temperature of 55 °C, the process
number PR26, Table 2.21 was performed in order to observe the affect of the higher
temperature though it was not recommended <25,200>. The problem of a blockage of
the spraying nozzle occured. For this reason the high process temperature was not
further investigated.

130 Experimental part / Preparative methods Composition / Coating conditions PR25
PR26
PR27
PR28
PR29
PR30
Aquateric (g) Aquacoat CPD (g)
- 200
- 200
- 200
- 217
- 100
- 167
Polymer solid (g) 60 60 60 65 30 50 DEP (% w/w to polymer) - - - - - - DBS (% w/w to polymer) - - - - - - TEC (% w/w to polymer) 25 25 25 54 25 25 Triacetin (% w/w to polymer) - - - - - - Talc (% w/w to polymer) - - - - - - Mgst (% w/w to polymer) - - - - - - Poloxamer (% w/w to Mgst) - - - - - - EC (% w/w to polymer) - - - - - - Tween80 (% w/w to polymer) - - - - - - Concentation (% w/w) 15 15 15 15 15 15
Load (g) 250 250 250 250 250 100 Material MO MO MO MO MO MO Atomizing pressure (m3/h) 2.6 2.6 3.5 3.5 2.6 2.6 Orifice diameter (mm) 1.2 1.2 1.2 1.2 1.2 1.2 Distance from bottom to column (mm) 0.8 0.8 0.8 0.8 0.8 0.8 Perforated bottom (% free holes) 13 13 13 13 13 8 Pre-warming (min) 15 15 15 15 15 15 with dehumidifying machine (y/n) n n n n n n with cyclone (y/n) n n n n n n Room temp/humidity (°C, % r.h.) 22, 45 23, 45 22, 39-43 21, 39 21, 45-53 24, 46-65Inlet temp (°C) 35 60 35 37 35 35 Product Temp (°C) 32 55 33 35 32 32 Outlet temp (°C) 32 52 31 32 32 32 Outlet humidity (% r.h.) 25 20 27-32 25 30-41 35-45 Spraying rate (g/min) 0.8 0.8 0.8 0.8 0.8 0.8 Initial spray air air air air air air Process with stop (y/n) y y y y y y Drying in glatt (°C, min) - - - - - 32, 60 Air flow (m3/h) 50-55 50-55 80-90 90-95 90-95 93-95 Postdrying in machine (°C/min) 32, 15 55, 15 33, 10 35, 15 32, 15 32, 15 Postdrying temp/time outside machine (°C, h) 22, 24 22, 24 22, 24 22, 24 22, 24 22, 24 Coating amount (% w/w) 10 10 8 - 20 5 5 - 11 5 - 30 Table 2.21: Composition and coating conditions of coating processes with aqueous
dispersions of CAP and TEC (PR25 – PR30); MO: Product A (Table 2.25).
PR27
The higher air flow of about 90 m3/h was used in order to avoid agglomerations. The
atomizing pressure (about 1.5 bar) as mentioned in the work of Williams and Liu <200>
was used. The product bed temperature was kept at about 33 °C. Spraying rates higher
than 0.8 g/min were not used in order to avoid a formation of agglomerations. It was
found that a high amount of fine dust was formed because of spray drying. The film
thickness was varied from 8 to 20 % w/w. Even with the highest thickness the coated

Experimental part / Preparative methods 131 pellets were not resistant to 0.1 N HCl. The release of methyl orange achieved 100 %
less than 30 min. The uncoalesced polymer particles can be observed under the SEM.
PR28
The coating formulation was varied by increasing the concentration of the plasticizer to
54 % w/w in order to observe whether the high concentration of TEC can improve the
film formation or not. The comparison with the coating process C35 was performed.
However, the uncoalesced polymer particles still occured.
PR29
Because of a high amount of fine dust in PR27 and PR28 a reduction of an atomizing
pressure was tested. It was found that less amount of fine dust was formed in the
process using atomizing pressure of 2.6 m3/h at the same product bed temperature of
about 32 °C. However, the coated pellets were not resistant to 0.1 N HCl.
PR30
The smaller loading amount of 100 g was tested and the smaller perforated bottom
plate was used to adjust the flow pattern. As the fine dust was accumulated at the
filters, the coating process had therefore to be interrupted after a certain time (about
70 min) and it was nescessary to change the filters. The product was further dried inside
a small scale of a fluidized bed apparatus during the cleaning process.
In summary, it was found that the coating process at the almost high atomizing pressure
of 1.5 bar (about 3.5 m3/h) and a high air velocity of 90 m3/h caused a spray-drying
which produced a lot of fine dust during the process. The spray rate of 2 to 3 g/min
cannot be used in the process running with 100 g loading pellets because of
agglomerations of coated pellets during the coating process after a short time of
coating. Therefore only the spraying rate of 0.8 g/min was used further in this present
study. However, the pellets sticked together during the coating process at the lower air
velocity. They were seperated from each other during the flowing phase, which will
cause a defect of film around the surface. The formation of holes can be seen under a
light microscope (data not shown).

132 Experimental part / Preparative methods 2.4.8 Main part of studies
Products containing nicotinamide with or without subcoats were used as a loading
material. In some cases pellets containing methyl orange were also incorporated as a
loading material. Resulted products are shown in Table 2.25 to 2.30.
2.4.8.1 Enteric coating of pellets using Aquateric and DEP
The particular preparating technique of the dispersion and the coating conditions were
as follows.
a) Preparation of an enteric coating dispersion
All substances were accurately weighted on a digital balance {16,1}. 1.0 g of Tween 80
was added as emulsifier to about 2/3 of total amount of purified water and mixed for
5 min. 35.0 g of DEP was slowly added into the above mentioned solution and further
mixed for 15 min. 100.0 g of Aquateric powder was slowly added by using a magnetic
stirrer {43} and mixed over night without heating or cooling. Purified water was added
afterwards to obtain a concentration of 20.0 % w/w. Further mixing for about 30 min
followed. The dispersion was filtered through the 100 µm sieve before use as a coating
dispersion and the constant stirring of the dispersion during the coating process was
performed.
b) Enteric coating process of pellets containing nicotinamide and subcoats
The Aeromatic MP-1 with inserted filters, the formulation R9, Table 2.22 and the
process number X17, Table 2.23 served for this production. The loading material in this
process was the mixture of five different products i.e. placebo (Product P), pellets
containing nicotinamide and HPMC as a subcoat (Product DD), pellets containing
nicotinamide and EC as a subcoat (Product Ee), pellets containing nicotinamide and
E&P as a subcoat (Product cC), and pellets containing nicotinamide and P&E as a
subcoat (Product bb).
The finished coated pellets were divided into two groups. One half of it was mixed with
0.5 % w/w of Aerosil 200 to avoid sticking during the storage before the dissolution test

Experimental part / Preparative methods 133 was performed. Another half was stored without Aerosil 200 for use as products for the
analysis of thickness, morphology, weight, etc. The enteric coated pellets still contained
their different colours from the markers incorporated in the subcoat layer and therefore
after finishing the coating process they could be seperated from each other by manual
selection. These selected enteric coated pellets were used for further characterizations.
2.4.8.2 Enteric coating of pellets using Aquateric and DBS
a) Preparation of an enteric coating dispersion
Formulation R8, as shown in Table 2.22 was prepared by accurately weighing all the
substances on a digital balance {16,1}. 1.0 g of Tween 80 was added as emulsifier to
about 2/3 of total amount of purified water and mixed for 5 min. 35.0 g of DBS was
slowly added into the above mentioned solution and further mixed for 15 min. The
further procedure is the same as already mentioned in 2.4.8.1.
b) Enteric coating process of pellets containing nicotinamide and subcoats
The formulation R8, Table 2.22, the process number X17, Table 2.23 and the Aeromatic
MP-1 with inserted filters were used for the production. The mixture of products as
mentioned in 2.4.8.1 was used as loading material. The finished coated pellets were
divided into two groups i.e. with and without 0.5 % w/w of Aerosil 200. These finished
enteric coated pellets were manually selected in different colours before they were used
for further characterizations.
c) Enteric coating process of pellets containing nicotinamide without any
subcoats
The formulation R8, Table 2.22, the process number X22, Table 2.24 and the Aeromatic
MP-1 with inserted filters were used for the production. The loading material was the
mixture of the orange coloured pellets (Product A) and nicotinamide loaded pellets
(Product aA). The finished coated pellets were divided into two groups i.e. with and
without 0.5 % w/w of Aerosil 200. These finished enteric coated pellets were manually
selected in different colours before they were used for further characterizations.

134 Experimental part / Preparative methods 2.4.8.3 Enteric coating of pellets using Aquacoat CPD and DEP
The particular preparating technique of the dispersion and the coating conditions were
as follows.
a) Preparation of an enteric coating dispersion
Formulation R10, as shown in Table 2.22 was prepared by moderately mixing the
dispersion of Aquacoat CPD with a magnetic stirrer {43} while 2/3 of total amount of
water was added. 30.0 g of DEP accurately weighed {16} was slowly added to the
dispersion by stirring for about 15 min. This dispersion was stirred over night. Then
purified water was added to bring the total solids content to the required concentration
of 16.0 % w/w with additional mixing for at least 15 min. The dispersion was filtered
through the 100 µm sieve before use as a coating dispersion and the constant stirring of
the dispersion during the coating process was performed.
b) Enteric coating process of pellets containing nicotinamide and subcoats
The formulation R10, Table 2.22, the process number X17, Table 2.23, and the
Aeromatic MP-1 with inserted filters were used for the production. The mixture of
products as mentioned in 2.4.8.1 was the loading material. The finished coated pellets
were divided into two groups i.e. with and without 0.5 % w/w of Aerosil 200. These
finished enteric coated pellets were manually selected in different colours of subcoats
before they were used for further characterizations.
c) Enteric coating process of pellets containing nicotinamide without any
subcoats
The formulation R10, Table 2.22, the process number X22, Table 2.24 and the
Aeromatic MP-1 with inserted filters were used for the production. The loading material
was a mixture of the orange coloured (Product A) and the white coloured nicotinamide
loaded pellets (Product aA). The finished coated pellets were also divided into two
groups i.e. with and without 0.5 % w/w of Aerosil 200. These finished enteric coated

Experimental part / Preparative methods 135 pellets were manually selected in different colours before they were used for further
characterizations.
2.4.8.4 Enteric coating of pellets with Aquacoat CPD, TEC and/or additives
The coating conditions mostly based on the work of Williams and Liu <200> and the
recommendation of the speacialist of FMC <25>. These deatails were already
mentioned in 1.2.
a) Preparation of an enteric coating dispersion from Aquacoat CPD and TEC
Formulation R11, as shown in Table 2.22 was prepared by moderately mixing the
dispersion of Aquacoat CPD with a magnetic stirrer {43} while 2/3 of total amount of
water was added. 25.0 g of TEC accurately weighed {16} was slowly added to the
dispersion by stirring for about 15 min. This dispersion was stirred over night and then
purified water was added to bring the total solid content to the required concentration of
15.0 % w/w with additional mixing for at least 15 min. The further procedure is the same
as already mentioned in 2.4.8.1.
b) Preparation of an enteric coating dispersion from Aquacoat CPD, TEC and
other additives
If any other additional substances should be added e.g. the following modified
formulations number R12 and R13 (Table 2.22) should be used.
For the formulation R12, the first dispersion of Aquacoat CPD was moderately stirred
{43} while TEC was slowly added and further stirring of about 15 min was required. The
second dispersion was prepared from water and Poloxamer 407 as a medium for
dispersing magnesium stearate (Mgst) with a mixer {46}. These two dispersions were
mixed together by pouring the Mgst-dispersion to the CAP-dispersion while constantly
mixing. Water was added to bring the total solid content to 15.0 % w/w with additional
mixing for at least 15 min.
For the formulation R13, the first dispersion containing Aquacoat CPD and TEC was
prepared in the same way as aforementioned. The second dispersion containing Mgst
and EC, however, was prepared by adding Aquacoat ECD into the Mgst-dispersion

136 Experimental part / Preparative methods which contained Poloxamer 407 as a wettening agent. These two dispersions were
mixed together {43}. Water was added to bring the total solid content to 10.0 % w/w
whilst mixing {43} for at least 15 min.
The plasticized dispersions of Aquacoat CPD (Formulations R12 and R13) were sieved
through a 100 µm sieve prior to coating and they were continuously mixed {43} during
the coating process.
c) Enteric coating process of pellets containing methyl orange
The white coloured placebo pellets (Product P) were mixed with yellow coloured
MO-loaded pellets (Product A) to reach a loading weight for the coating process in
different trials. The mixture of these pellets was coated with different CAP aqeuous
dispersions (R11 - R13) as demonstrated in Table 2.22.
The resulted products were demonstrated in Table 2.25. Two different fluidized bed
system, i.e. with inserted filters or with a connection to a cyclone, were used to produce
the enteric coated products.
If the coating process was performed with interruptions as Process No. X15, Table 2.23,
then the intermediate product was dried in the small scale fluidized bed apparatus {19}
to avoid sticking of coated pellets during filter changing period.
The finished coated pellets were divided into two groups i.e. with and without 0.5 % w/w
of Aerosil 200. These finished enteric coated pellets were manually selected in different
colours before they were used for further characterizations.
d) Enteric coating process of pellets containing nicotinamide and subcoats
The formulation R11, Table 2.22 and the different coating conditions were used to
produce enteric coated pellets containing nicotinamide and subcoats. Resulted products
can be seen in Table 2.26 to 2.29. Both the fluidized bed system i.e. with inserted filters
or with a connection to a cyclone served to produce the enteric coated products.
If the coating process was performed with interruptions as Process No. X18, Table 2.23,
then the intermediate product was dried in the small scale fluidized bed apparatus {19}
to avoid sticking of coated pellets during filter changing period.

Experimental part / Preparative methods 137 The finished coated pellets were divided into two groups i.e. with and without 0.5 % w/w
of Aerosil 200. These finished enteric coated pellets were manually selected in different
colours before they were used for further characterizations.
e) Enteric coating process of pellets containing nicotinamide without any
subcoats
The formulation R11, Table 2.22 and the process number X23, Table 2.24 using
Aeromatic MP-1 connected with a cyclone served for the production. The loading
material was the mixture of the yellow coloured pellets (Product A) and nicotinamide
loaded pellets (Product aA). Resulted coated pellets can be seen in Table 2.30.
The finished coated pellets were also divided into two groups i.e. with and without
0.5 % w/w of Aerosil 200. These finished enteric coated pellets were manually selected
in different colours before they were used for further characterizations.
2.4.8.5 Enteric coating of pellets using Aquacoat CPD, TEC and Aqoat-AS-MF
The combination of two enteric polymers i.e. CAP and HPMC-AS (Aqoat-AS-MF) was
tested in order to improve the property of the coating film. The dispersion used for the
preliminary test was prepared by modifying the formula as well as the coating conditions
from the recommended one <6>. The concentration of a plasticizer was kept to the
same level as for the Aquacoat CPD dispersion alone because the content of
Aqoat-AS-MF was only 30 parts to 100 parts of Aquacoat CPD solid content. However,
the special control of the coating dispersion temperature was carried out to avoid the
sedimentation of Aqoat-AS-MF during the coating process.
Before the dispersion containing CAP, TEC and Aqoat-AS-MF was used in the coating
process the size and form was determined under a light microscope as mentioned in
2.2.5.2 regarding the quality of the self prepared enteric dispersion. The dispersion was
determined both before the begining of the coating process and after the coating
process was ended after about 10 h. The result of ten pictures of each dispersion
showed that there was no significant difference between before and after the coating
process. Therefore this dispersion was well prepared and the long coating process did
not affect the particle size of solid particles.

138 Experimental part / Preparative methods Result of the particle sizes and form of the dispersion from the microscopic method:
The largest sizes of solid particles expected to be from Aqoat-AS-MF were 50 ± 5 µm,
n = 10 (p < 0.05), because the particles sizes of Aquacoat CPD were not larger than
5 µm.
Figure 2.31: Microscopic picture of an aqueous enteric dispersion of Aquacoat CPD,
TEC and Aqoat-AS-MF.
a) Preparation of an enteric coating dispersion
Formulation R14, as shown in Table 2.22 was prepared by adding 2/3 of total amount of
water to the dispersion of Aquacoat CPD and while constantly stirring 32.5 g of TEC
was slowly added to the dispersion. This dispersion was stirred over night {43}.
Hereafter the temperature of this homogeneous dispersion containing TEC was kept
below 15 °C using water-ice-bath and then Aqoat-AS-MF of 30.0 g accurately weighed
was slowly added into the cooled dispersion while constantly cooling and stirring for at
least 30 min. Purified water was added to bring the total solid content of 15.0 % w/w
with additional mixing for at least 15 min. This dispersion was sieved through a 100 µm
scale = 30 µm
Experimental part / Preparative methods 139 sieve prior to coating and the temperature of the dispersion was kept below 15 °C while
continuously stirring during the coating process.
b) Enteric coating process of pellets containing nicotinamide with a subcoat
from a combination of EC and PVA (E&P)
The formulation R14 (Table 2.22), the process number X21 (Table 2.24) and the
fluidized bed connected with a cyclone served for the production. The mixture of the
white coloured placebo pellets and the green coloured pellets (Product cC) was the
loading material. They could be separated from each other after finishing the enteric
coating process by manual selection using the different colours.

140 Experimental part / Preparative methods
Formulation
R8
R9
R10
R11
R12
R13
R14
Ingredients
Aquateric solid (g) 100 100 - - - - -
Tween 80 (g) 1 1 - - - - -
(Aquacoat CPD liquid (g))
~ Aquacoat CPD solid (g)
-
-
-
-
(333)
100
(333)
100
(333)
100
(333)
100
(333)
100
Aqoat-AS-MF solid (g) - - - - - - 30
DEP (g) - 35 30 - - - -
DBS (g) 35 - - - - - -
TEC (g) - - - 25 25 25 32.5
Mgst (g) - - - - 10 10 -
Poloxamer 407 (g) - - - - 0.1 0.1 -
(Aquacoat ECD liquid (g))
~ Aquacoat ECD solid (g)
-
-
-
-
-
-
-
-
-
-
(67)
20
-
-
Concentration (% w/w) 20 20 16 15 15 10 15
Table 2.22: Different coating formulations (R8 - R14);
R8: Aquateric and DBS
R9: Aquateric and DEP
R10: Aquacoat CPD and DEP
R11: Aquacoat CPD and TEC
R12: Aquacoat CPD, TEC, Mgst and Poloxamer 407
R13: Aquacoat CPD, TEC, Mgst, Poloxamer 407 and EC
R14: Aquacoat CPD, TEC and HPMC-AS

Experimental part / Preparative methods 141
Process number X13 X14 X15 X16 X17 X18 Parameter
Loading weight (g) 1000 250 100 100 280 100 Core material S M5 M6 M6 M7 M8 Atomizing pressure (m3 h-1) 2.4 2.6 2.6 2.6 2.4 2.6 Orifice diameter (mm) {48} 0.8 1.2 1.2 1.2 1.2 1.2 Distance from bottom to
column (mm) 0.8 0.8 0.8 0.8 0.8 0.8
Perforated bottom (% free) 20 13 8 8 13 8 Pre-warming with product (min) 15 15 15 15 15 15 With dehumidified process air y n n n y n With cyclone instead of filters n n n y n n Room temperature/humidity
(°C, % r.h.) 20, 60 24, 50 24, 50 23, 50 22, 50 24, 50
Inlet temperature (°C) 60 35 35 35 50 35 Product temperature (°C) 54 32 32 32 45 32 Outlet temperature (°C) 52 32 32 32 43 32 Outlet humidity (% r.h.) 18 31 33 35 18 33
Spraying rate (g min-1) 1.7 0.8 0.8 0.8 1.8 0.8
Initial spray water air air air water air
Process air velocity (m3 h-1) 50-55 95-99 95-99 93-95 55-60 95-100 Drying in Uni-Glatt (°C, min) - - 32, 60 - - 32, 60 Postdrying inside the machine
(°C, min) 54,15 32,15 32,15 32,15 45,15 32, 15
Postdrying outside the machine
(°C, h) 22, 24 22, 24 22, 24 22, 24 50, 24 22, 24
Table 2.23: Coating conditions of different processes X13 to X18;
S = sugar spheres size range 1000-1180 µm
M5 = mixture of HPMC pellets (Product P) 200 g and MO pellets (Product A) 50 g
M6 = mixture of HPMC pellets (Product P) 50 g and MO pellets (Product A) 50 g
M7 = mixture of Product DD, Product Ee, Product cC, Product bb each 20 g and Product P 200 g
M8 = mixture of Product DD, Product Ee, Product cC, Product bb, Product A each 20 g
y = yes; n = no

142 Experimental part / Preparative methods
Process number X19 X20 X21 X22 X23 Parameter
Loading weight (g) 100 100 100 280 100 Core material M9 M10 M11 M12 M13 Atomizing pressure (m3 h-1) 2.6 2.6 2.6 2.4 2.6 Orifice diameter (mm) {48} 1.2 1.2 1.2 1.2 1.2 Distance from bottom to
column (mm) 0.8 0.8 0.8 0.8 0.8
Perforated bottom (% free) 8 8 8 13 8 Pre-warming with product (min) 15 15 15 15 15 With dehumidified process air n n n y n With cyclone instead of filters y y y n y Room temperature/humidity
(°C, % r.h.) 22, 32 22, 32 21, 24 22, 50 22, 32
Inlet temperature (°C) 35 35 35 50 35 Product temperature (°C) 32 32 32 45 32 Outlet temperature (°C) 32 32 32 43 32 Outlet humidity (% r.h.) 31 31 15 18 31 Spraying rate (g min-1) 0.8 0.8 0.8 1.8 0.8 Initial spray air air air water air
Process air velocity (m3 h-1) 93-95 93-95 93-95 55-60 93-95 Drying in Uni-Glatt (°C, min) - - - - - Postdrying inside the machine
(°C, min) 32, 15 32, 15 32, 15 45, 15 32, 15
Postdrying outside the machine
(°C, h) 22, 24 22, 24 22, 24 50, 24 22, 24
Table 2.24: Coating conditions of different processes X19 to X23;
M9 = mixture of Product DD, Product Cc, Product bB, Product bb and Product P each 20 g
M10 = mixture of Product Ee, Product cC, Product A each 20 g and Product P 40 g
M11 = mixture of Product cC 20 g and Product P 80 g
M12 = mixture of Product aA 80 g and Product A 200
M13 = mixture of Product aA 80 g and Product A 20
y = yes; n = no

Experimental part / Preparative methods 143
Product Formulation Process number
Weight of dispersion used (g)
Solid content used (g)
Coating level (%w/w)
Theoretical Real
P R1 X2 400 20.0 2.0 1.8
A R2 X13 360 18.0 1.8 1.7
B R11 X14 77 11.5 4.6 4.5
C R11 X14 137 20.5 8.2 6.0
D R11 X14 150 22.5 9.0 8.0
E R11 X14 240 36.0 14.4 11.0
F R11 X14 330 49.5 19.8 17.5
G R11 X14 370 55.5 22.2 19.0
H R11 X15 255 38.3 38.3 31.0
J R11 X15 381 57.2 57.2 45.0
K R11 X16 367 55.1 55.1 45.0
L R11 X16 440 66.0 66.0 56.0
M R12 X14 287 43.0 17.2 11.0
N R13 X14 413 41.3 16.5 11.0
Table 2.25: Products with a thin layer of HPMC containing methyl orange resulting
from different combinations of a formulation and process conditions; Product P: HPMC-coated pellets (HPMC pellets)
Product A: Methyl orange loaded pellets (MO pellets)
Product B to G: CAP-coated pellets (CAP-MO pellets) prepared by using Aquacoat
CPD and TEC, coating process with interruptions
Product H to J: CAP-coated pellets (CAP-MO pellets) prepared by using Aquacoat
CPD and TEC, coating process with interruptions and intermediate drying in the Uni-
Glatt
Product K to L: CAP-coated pellets (CAP-MO pellets) prepared by using Aquacoat
CPD and TEC without interruptions
Product M: CAP-coated pellets (CAP-MO pellets) prepared by using Aquacoat CPD,
TEC, Mgst and Poloxamer 407, coating process with interruptions
Product N: CAP-coated pellets (CAP-MO pellets) prepared by using Aquacoat CPD,
TEC, Mgst, Poloxamer 407 and EC, coating process with interruptions
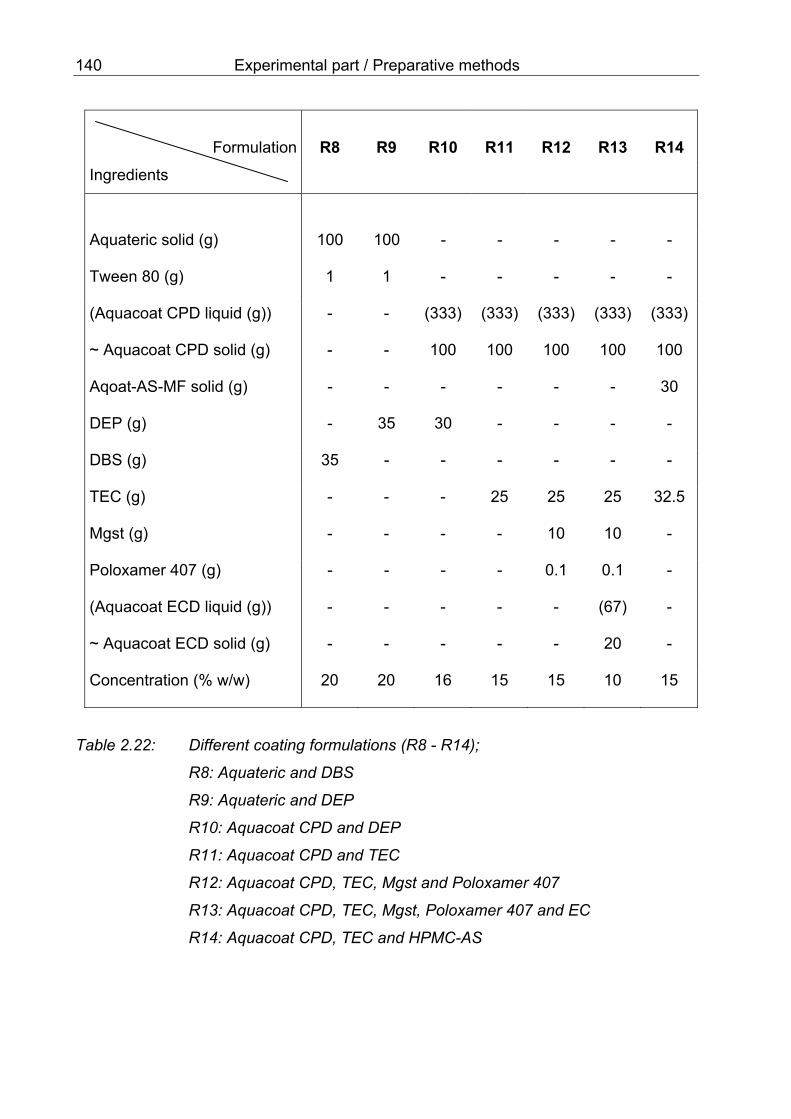
144 Experimental part / Preparative methods
Product Formulation Process number
Weight of dispersion used (g)
Solid content used (g)
Coating level (%w/w)
Theoretical Real
PP R1 X7 700 35 3.5 3.2
AA R3 X8 288 57 11.5 11.3
BB R4 X9 320 16 8.0 7.5
CC R4 X9 620 31 15.5 15.0
DD R4 X9 900 45 22.5 22.0
EE R10 X17 400 64 23.0 12.0
FF R9 X17 490 98 35.0 14.0
GG R8 X17 590 118 42.0 24.0
HH R11 X18 113 17 17.0 14.0
JJ R11 X18 133 20 20.0 17.5
KK R11 X18 167 25 25.0 22.0
LL R11 X18 253 38 38.0 31.0
MM R11 X18 380 57 57.0 45.0
NN R11 X19 367 55 55.0 45.0
Table 2.26: Products with a subcoat from HPMC resulting from different
combinations of a formulation and process conditions; Product PP: HPMC-coated pellets (HPMC pellets)
Product AA: Nicotinamide loaded pellets (Nico pellets)
Product BB to DD: Pellets with a subcoat from HPMC (HPMC-Nico pellets)
Product EE: CAP-coated pellets (CAP-HPMC-Nico pellets) prepared by using
Aquacoat CPD and DEP, coating process with interruptions
Product FF: CAP-coated pellets (CAP-HPMC-Nico pellets) prepared by using
Aquateric and DEP, coating process with interruptions
Product GG: CAP-coated pellets (CAP-HPMC-Nico pellets) prepared by using
Aquateric and DBS, coating process with interruptions
Product HH to MM: CAP-coated pellets (CAP-HPMC-Nico pellets) prepared by using
Aquacoat CPD and TEC, coating process with interruptions and intermediate drying in
the Uni-Glatt
Product NN: CAP-coated pellets (CAP-HPMC-Nico pellets) prepared by using
Aquacoat CPD and TEC, coating process without interruptions

Experimental part / Preparative methods 145
Product Formulation Process number
Weight of dispersion used (g)
Solid content used (g)
Coating level (%w/w)
Theoretical Real
Pp R1 X7 700 35 3.5 3.0
Aa R3 X8 300 60 12.0 9.5
Bb R5 X10 130 26 13.0 11.5
Cc R5 X10 320 64 32.0 29.0
Dd R5 X10 500 100 50.0 48.0
Ee R5 X10 1000 200 100.0 97.0
Ff R10 X17 406 65 23.0 12.0
Gg R9 X17 490 98 35.0 14.0
Hh R8 X17 590 118 42.0 24.0
Jj R11 X20 367 55 55.0 45.0
Kk R11 X19 367 55 55.0 45.0
Table 2.27: Products with a subcoat from ethyl cellulose resulting from different
combinations of a formulation and process conditions; Product Pp: HPMC-coated pellets (HPMC pellets)
Product Aa: Nicotinamide loaded pellets (Nico pellets)
Product Bb to Ee: Pellets with a subcoat from EC (EC-Nico pellets)
Product Ff: CAP-coated pellets (CAP-EC-Nico pellets) prepared by using Aquacoat
CPD and DEP, coating process with interruptions
Product Gg: CAP-coated pellets (CAP-EC-Nico pellets) prepared by using Aquateric
and DEP, coating process with interruptions
Product Hh: CAP-coated pellets (CAP-EC-Nico pellets) prepared by using Aquateric
and DBS, coating process with interruptions
Product Jj to Kk: CAP-coated pellets (CAP-EC-Nico pellets) prepared by using
Aquacoat CPD and TEC, coating process without interruptions

146 Experimental part / Preparative methods
Product Formulation Process number
Weight of dispersion used (g)
Solid content used (g)
Coating level (%w/w)
Theoretical Real
pP R1 X7 800 40 4.0 3.5
aA R3 X8 310 62 12.4 11.0
bB R6 X11 420 84 42.0 36.0
cC R6 X11 770 154 77.0 67.0
dD R10 X17 400 64 23.0 12.0
eE R9 X17 490 98 35.0 14.0
fF R8 X17 590 118 42.0 24.0
gG R11 X18 53 8 8.0 6.0
hH R11 X18 133 20 20.0 17.5
iI R11 X20 233 35 35.0 20.0
jJ R11 X18 253 38 38.0 31.0
kK R11 X18 380 57 57.0 45.0
lL R11 X20 367 55 55.0 45.0
mM R11 X20 367 55 55.0 45.0
nN R11 X19 367 55 55.0 45.0
oO R14 X21 133 28 28.0 20.0
Table 2.28: Products with a subcoat from a combination of ethyl cellulose and
Mowiol 4-98 (100 part + 30 parts) resulting from different combinations
of a formulation and process conditions; Product pP: HPMC-coated pellets (HPMC pellets)
Product aA: Nicotinamide loaded pellets (Nico pellets)
Product bB to cC: Pellets with a subcoat from EC and PVA (E&P-Nico pellets)
Product dD: CAP-coated pellets (CAP-E&P-Nico pellets) prepared by using Aquacoat
CPD and DEP, coating process with interruptions
Product eE: CAP-coated pellets (CAP-E&P-Nico pellets) prepared by using Aquateric
and DEP, coating process with interruptions
Product fF: CAP-coated pellets (CAP-E&P-Nico pellets) prepared by using Aquateric
and DBS, coating process with interruptions
Product gG to nN: CAP-coated pellets (CAP-E&P-Nico pellets) prepared by using
Aquacoat CPD and TEC
Product oO: CAP-coated pellets (CAP-E&P-Nico pellets) prepared by using Aquacoat
CPD, HPMCAS and TEC
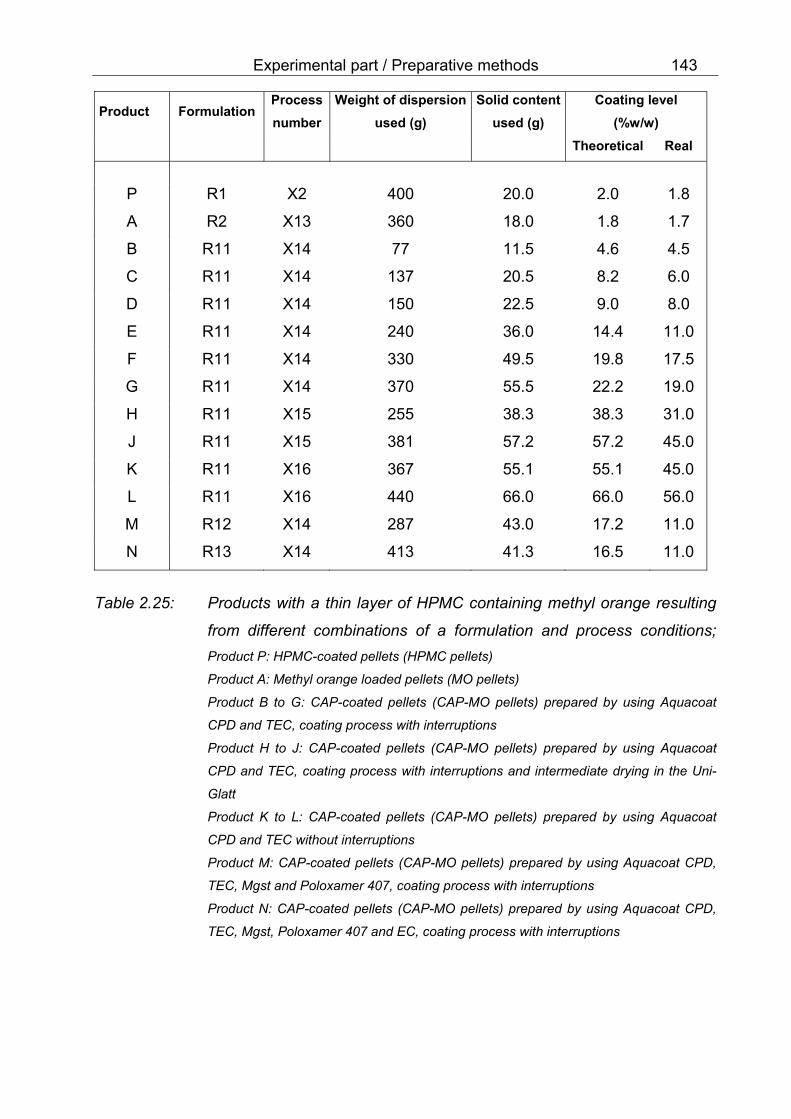
Experimental part / Preparative methods 147
Product Formulation Process number
Weight of dispersion used (g)
Solid content used (g)
Coating level (%w/w)
Theoretical Real
pp R1 X7 800 40 4.0 3.5
aa R3 X8 325 65 13.0 11.4
bb R7 X12 772 54 27.0 20.0
cc R10 X17 400 64 23.0 12.0
dd R9 X17 490 98 35.0 24.0
ee R8 X17 590 118 42.0 14.0
ff R11 X18 133 20 20.0 17.5
gg R11 X18 253 38 38.0 31.0
hh R11 X18 380 57 57.0 45.0
jj R11 X19 367 55 55.0 45.0
Table 2.29: Products with a subcoat from a combination of Mowiol 4-98 and ethyl
cellulose (100 part + 30 parts) resulting from different combinations of a
formulation and process conditions; Product pp: HPMC-coated pellets (HPMC pellets)
Product aa: Nicotinamide loaded pellets (Nico pellets)
Product bb: Pellets with a subcoat from PVA and EC (P&E-Nico pellets)
Product cc: CAP-coated pellets (CAP-P&E-Nico pellets) prepared by using Aquacoat
CPD and DEP, coating process with interruptions
Product dd: CAP-coated pellets (CAP- P&E -Nico pellets) prepared by using Aquateric
and DEP, coating process with interruptions
Product ee: CAP-coated pellets (CAP- P&E -Nico pellets) prepared by using Aquateric
and DBS, coating process with interruptions
Product ff to hh: CAP-coated pellets (CAP- P&E -Nico pellets) prepared by using
Aquacoat CPD and TEC, coating process with interruptions and intermediate drying in
the Uni-Glatt
Product jj: CAP-coated pellets (CAP- P&E -Nico pellets) prepared by using Aquacoat
CPD, and TEC without interruptions

148 Experimental part / Preparative methods
Product Formulation Process number
Weight of dispersion used (g)
Solid content used (g)
Coating level (%w/w)
Theoretical Real
pP R1 X7 800 40 4.0 3.5
aA R3 X8 310 62 12.4 11.0
kk R10 X22 788 126 45.0 19.0
mm R8 X22 840 168 60.0 32.0
nn R11 X23 227 34 34.0 25.0
oo R11 X23 367 55 55.0 45.0
Table 2.30: Products without a subcoat resulting from different combinations of a
formulation and process conditions; Product pP: HPMC-coated pellets (HPMC pellets)
Product aA: Nicotinamide loaded pellets (Nico pellets)
Product kk: CAP-coated pellets (CAP-P&E-Nico pellets) prepared by using Aquacoat
CPD and DEP, coating process with interruptions
Product mm: CAP-coated pellets (CAP- P&E -Nico pellets) prepared by using
Aquateric and DBS, coating process with interruptions
Product nn to oo: CAP-coated pellets (CAP- P&E -Nico pellets) prepared by using
Aquacoat CPD and TEC, without interruptions

Results and discussion 149
3. Results and discussion 3.1 Pellets with methyl orange a) Placebo: HPMC-coated pellets (HPMC pellets)
Placebo HPMC-coated pellets were prepared by using the HPMC solution formulation
R1 in Table 2.15. The process number X2 was chosen as demonstrated in Table 2.11.
Therefore the combination of the formulation and the process number gave Product P,
as demonstrated in Table 2.25.
b) Model pellets: methyl orange loaded pellets (MO pellets)
Model pellets were prepared in order to optimize the formulation and process conditions
of enteric coating. MO pellets were prepared by using the formulation R2 and the
process number X13 to give Product A, as shown in Table 2.25.
c) Enteric coated pellets: CAP-coated pellets (CAP-MO pellets)
The investigations were concentrated according to the conditions recommended in the
three publications <25,200,7>. The small air flow of 50 - 55 m 3 h-1 caused a formation
of twins and agglomerations as already mentioned in part 2.4.7; therefore a higher air
flow was used to perform the coating as seen under the conditions X14 - X16, Table
2.23. The enteric coated pellets have therefore been prepared in different formulations
and process conditions (Table 2.25). Products B to J, and Products M and N were
produced by using the fluidized bed apparatus with inserted filters, whereas Products K
and L were produced by using the apparatus connected with a cyclone.
As reported in the work of Williams and Liu <200>, a high air flow of about 90 m 3 h-1
can hinder the agglomeration of pellets. However, this high air velocity caused a high
amount of dust as seen in Table 2.25, as the real coating level was much lower than the
theoretical one. For example Product G was produced by using 370 g of the CAP
aqueous dispersion equivalent to a solid content of 55.5 g. The theoretical coating
amount on these pellets should be 22.2 % but the coating amount received was only

150 Results and discussion
19 %. This loss of the coating weight resulted from the formation of dust. This was also
confirmed by the blockage of the filters after a short running time of the coating process.
It was found that after the coating process (X14) had been performed for about 70 min,
the filters inside the coating chamber were blocked with the fine dust. The filters had to
be changed before the process could be continued. About 60 min were required for the
change of the filters. This process resulted in the different CAP film thicknesses
(Products B to G, Table 3.1). The process number X15 (Products H and J) was also
performed in an apparatus with filters, but during the phase of filter-change, the coated
pellets have been further dried at 32 °C for 60 min in a small fluidized bed apparatus -
Uni-Glatt {19} - to control the film formation and to avoid the agglomeration of pellets,
because the pellets were not yet completely dried.
To solve the problems regarding the filters, a cyclone {13} as a dust collector was
installed. This construction was the process number X16 for preparing CAP-coated
pellets. A fluidized bed apparatus {20} connected with a cyclone ensured a continuous
process without interruption. The pressure difference from the coating chamber to the
outlet of the cyclone was measured to show the resistance of the cyclone. After loading
the process chamber with 100 g of cores and setting the highest air velocity position at
the control switch, the highest air velocity incresed up to about 93 m 3h-1 - 95 m 3h-1.
The cyclone resistance (∆ P) at this highest velocity was 2400 Pa, at which the process
can be performed as usual. The resistance remained constant over the whole process.
The loading weight was kept low at 100 g in Product H to Product L because a high
coating level will be the result within the short processing time.
Williams and Liu <200> prepared the enteric aqueous dispersion by mixing Aquacoat
CPD with a propeller mixer, and adding DEP slowly to the dispersion whilst stirring. The
dispersion was continuously stirred for 1 h, and then mixed for an additional 23 h using
a magnetic stirring bar. The method was comparable to that used in the present study to
prepare the aqueous Aquacaot CPD dispersion. The stirring overnight was carried out
to ensure a homogenous dispersion of the plasticizer used, because some authors
<58> reported about the positive effect of extended dispersing time on the distribution of
the plasticizer in the polymer preparation.
Normally, when a Wurster-based bottom spray fluidized-bed technique is employed, it is
possible to apply droplets to the substrate surface before evaporation of solvent from
the droplets occurs. The solvent on the surface of the pellets should normally

Results and discussion 151
completely evaporate before the solvent can penetrate the core of pellets. Suspending
the pellets in air keeps them separated from each other and allows an application of
films to the pellets with little or no agglomeration. However, this technique can cause
spray drying of the polymer dispersion, which will develop a high amount of dust inside
the coating column. This dust will accumulate at the filters because of the high air
stream, which is required to suspend pellets. In consequence, the filters may be blocked
and the process will have to be interrupted in order to clean the filters.
This part of the present study shows that inserting a cyclone instead of filters seems to
be suitable for a coating process that causes a high amount of fine dust because the
coating process can be performed without interruption. Moreover, enteric coating of
pellets by cellulose acetate phthalate as a film forming agent using a Wurster-based
fluidized bed apparatus seems to be problematic. The combination of a process and this
polymer needs a special attention. Though some parameters were recommended by
the manufacturer and some authors, the optimization should be done for particular
formulations. This however, will take a long time until the optimum process parameters
would be found.
3.1.1 Film quality, diameter and weight of pellets
The physical properties of the starting pellets (sugar spheres) used for this process and
of the finished products (Product A to N) are shown in Table 3.1.
The mean diameter of the raw material was 1095 ± 40 µm. This standard deviation was
about 2.5 pixel. The thickness of the HPMC layer of Product P was about 8 ± 2 µm. The
structure of this film was homogenous and did not contain cracks. The mean diameter
of Product P as measured by an image analyser was 1120 µm with a standard deviation
of 32 µm. This means the standard deviation of the finished product was about 2 pixel
which was quite acceptable because it was lower than that of the material. The weight
of one HPMC-pellet (Product P) was 1.06 ± 0.01 mg, which, as expected, was higher
than that of sugar spheres, whereas the weight of MO-pellets (Product A) was not
significantly different from HPMC-pellets.
Physical properties of the CAP-coated pellets (Product B – N) are also demonstrated in
Table 3.1. The pellets showed very high roughness of the surface (Figure 3.1a). The
CAP layer contained a porous structure (Figure 3.1b). The SEM photograph of the
cross-section shows that some CAP-particles did not melt together (Figure 3.2a).

152 Results and discussion
Moreover, small cracks at the surface of the coated pellets are detected under high
magnification of SEM (Figure 3.2b). In spite of a combination of CAP and additives as
magnesium stearate (Mgst) and ethyl cellulose (EC), the structure of the films was not
improved. They contained small cracks on the surface (Figure 3.3a) and some CAP-
particles did not melt together (Figure 3.3b) as well.
It is known that the addition of an additive to a polymer film will alter the permeability
characteristics of the film. An example was given by Beckert <16> about tabletting of
enteric coated pellets. Sugar spheres of the size fraction 800 - 1000 µm were used for
layering of bisacodyl. The layering formula consisted of 81.3 g Eudragit L 30 D-55,
244.0 g bisacodyl, 8.1 g TEC, 40.5 g talc and 1305.0 g water. The layering process was
performed using a fluidized bed apparatus. This means a high amount of enteric coating
polymer and talc was already used for layering the drug. Therefore this combination will
protect the release of bisacodyl from the drug-layer. The enteric coating processes were
performed by using a fluidized bed apparatus-Uniglatt with a loading weight of 1 kg. The
enteric coating formula consisted of 416.7 g Eudragit L 30 D-55 as coating polymer,
12.5 g triethyl citrate as a plasticizer and 62.5 g talc as a separation substance. Two
percentages of coating amount were studied i.e. 12.5 and 25.0 % w/w. Beckert found
that the release of bisacodyl was 1.6 and 0.1 % after 2 h in 0.1 N HCl and 97.9 and
95.6 % after 45 min in buffer pH 6.8, respectively. This means that the enteric coated
pellets had passed the requirement of the USP XXIII . The thicknesses of film coated on
the pellets were 20 - 25 µm and 45 - 50 µm at coating amounts of 12.5 % w/w and
25.0 % w/w, respectively. Beckert also found that films from Eudragit L 30 D-55 and talc
were very brittle. The stretching level was less than 5 %. This result was also confirmed
by Okhamafe and York <119>. Beckert studied a combination of polymers (Eudragit L
30 D-55 and Eudragit NE 30 D) as coating polymers as well. Triethyl citrate was used
as a plasticizer and talc as a separating excipient. The coating was applied in two levels
i.e. 12.5 and 25 % w/w. Beckert found that the release of bisacodyl in 0.1 N HCl was 4.0
and 0.9 % and the release in buffer pH 6.8 was also low at 33.1 and 2.9 %, respectively.
The result implied that the enteric coated pellets had not passed the requirement of the
USP. The slow release of bisacodyl in the artificial intestinal fluid may be the effect of
talc which in this case may have a sealing effect and additional effect of the low
solubility of bisacodyl in the neutral medium <16>.
The effect of two hydrophobic substances on the film formation was studied in this
present work. The results were observed with Product M and N. Magnesium stearate

Results and discussion 153
(Mgst) or ethyl cellulose (EC) were used because they may hinder the agglomeration of
pellets which happened in the preliminary studies in 2.4.7.3. The results show that the
dispersion with Mgst was problematic because of the high tendency of sedimentation of
Mgst. This may cause a blockage of the nozzle during the long coating process.
Moreover, the release test shows that this incorporation did not give a better resistance
to the acidic medium. The structure of the film under SEM was not different from the
CAP film without Mgst (Figure 3.3). Some heterogeneous structures could be seen and
particles of polymers still existed. This means the coalescence of CAP was not
completed.
The reason for the inhomogeneous film was most probably the low product bed
temperature, which was 32 °C while the process air temperature was controlled at
35 °C. This product bed temperature was measured in the coating chamber within the
streaming air of the product bed but it was not the temperature at the surface of the
pellets. The surface temperature of the pellets is supposed to be lower. It is well known
that for the coating process the product bed temperature should be higher than the
minimum film forming temperature (MFFT). For instance, Frohoff-Hülsmann <58> has
investigated recently the film formation from an ethyl cellulose aqueous dispersion and
has found that up to 10 °C above the MFFT are necessary to obtain a good
coalescence of polymer particles. CAP is also a cellulose derivative and the coating with
CAP using an aqueous dispersion at a higher product bed temperature than the
respective MFFT may be suitable. In contrast, a specialist of FMC <25> recommended
that the product bed temperature should be kept low to avoid stickiness at temperatures
above the Tg, which is reported <7> to be about 34 °C as mentioned before in
1.1.2.2.2.1.
Moreover, the use of a higher process temperature, for example up to 60 °C, in order to
have a product temperature of 50 - 55 °C, may cause the problem of blockage of the
nozzle during the coating process. The reason was that the fluid bed apparatus used,
Aeromatic MP-1, had a process air flow from the bottom, as shown in Figure 2.21. The
warm air flew from the bottom through the coating chamber and blew out to the outlet
air tube. Before the coating of pellets can be performed, the raw materials should be
warmed in order to have the suitable product bed temperature. This phase of the
process will also heat the nozzle which was inserted in the bottom part. When the
dispersion of CAP was pumped into the spraying set in this phase blockage may be
caused as the polymer was dried inside the orifice. If there is the possiblity to cool the

154 Results and discussion
spraying unit without an affect on the temperature of the air flow it might be possible to
coat pellets at high temperatures without any problem. Nevertheless it is very important
to consider the stability of the dosage form in case of high temperatures. The high
temperature and water which is sprayed onto the surface of the pellets may chemically
degrade the drug in the core, at least in regions close to the surface.
The possibility to get more homogenous films is the curing after the initial coating with
CAP by using elevated temperature and/or humidity as reported by Williams and Liu
<200>. Details were discussed in 3.2.7. Other possibilities to improve the coalescence
were mentioned by Obara and McGinity <116,117>. Details were also discussed in
3.2.9.
3.1.2 Colour change of methyl orange of coated pellets
Methyl orange (MO) as a raw material in powder form has a golden colour. After contact
with an acidic medium, Methyl orange changes into its protonated form which has pink-
red colour. This property provides a fast test of resistance against the diffusion of an
acidic medium through the enteric coat.
The use of methyl orange as an indicator for the test on resistance against artificial
gastric fluid (0.1 N HCl) was studied in the recent work of Schmidt and Teuber <170>.
The percentage of pellets with unchanged color, coated with different enteric polymers
was observed and reported. The result was that 100 % of pellets coated with organic
solution of Eudragit L100 changed the colour into pink after 2 h exposure to 0.1 N HCl,
whereas only 22 % of the pellets coated with organic solution of HPMCP changed the
colour into pink. The increasing of a coating amount of polymer Eudragit L100 up to
8.95 mg/cm2 could reduce the amount to 55 % of pellets which changed their colour
after exposure to 0.1 N HCl for 3 h. This means these pellets were not gastric resistant
though the high amount of coating polymer was used. Only HPMCP at a coating
amount of about 9.5 mg/cm2 brough the result of a gastric resistance against 0.1 N HCl
as none of the pellets has changed ist colour.
This study showed cleary that methyl orange is a suitable indicator for determination of
gastric resistance. The time until the artificial gastric fluid diffused into the core was
demonstrated as the time during which the colour of pellets was changed from yellow or
orange to pink. The amount of coated pellets having changed the colour into pink

Results and discussion 155
showed the unsatisfying gastric resistance property. If the coated pellets were gastric
resistent then none of the coated pellets would have changed its colour.
The result of the colour change of CAP-MO pellets is illustrated in Figure 3.4.
MO Pellets (Product A) coated with CAP had an orange colour instead of gold. This
colour change indicated that the pH at the surface of the inner core had already
changed during the coating process. After the test for colour changing as described in
2.2.7, the time during which the pink colour was constant was recorded. These data are
stated in Table 3.1. The time during which 0.1 N HCl diffused into the inner core
increased from 1 min to 10 min when the polymer amount was increased further with an
increase of the polymer amount from 2 to 27 mg cm- 2 . This time of diffusion was kept
constant at 10 min from 27 to 72 mg cm- 2.
The acid resistance test (Table 3.1) by monitoring the colour changing showed that
0.1 N HCl diffused slowlier into these pellets (Product M and N) than into products
without magnesium stearate (Mgst). This resulted probably from the fact that Mgst can
be hardly wetted. However, the percentage of release during the first five minutes
shows high values which demonstrated the fast release of methyl orange from the core.
This means that the polymer film contained porous structures, at least locally.
These results confirm that methyl orange incorporated in the core by using HPMC as
binder was suitable as an indicator to monitor the resistance against acidic acid of
coated films.

156 Results and discussion

Results and discussion 157
Figure 3.1: SEM pictures of coated pellets; a) the top view of a pellet coated with
CAP and TEC (Product K), magnification 110x; b) the cross-section of a
pellet coated with CAP and TEC (Product B to L), magnification 1,000x.
a
b
CAP+TEC Layer
HPMC-MO Layer

158 Results and discussion
Figure 3.2: SEM pictures of coated pellets; a) the cross-section of a CAP and TEC
layer (Product B to L), magnification 20,000x; b) the surface of a pellet
coated with CAP, TEC (Product B to L), magnification 1,600x.
C11
b
a

Results and discussion 159
Figure 3.3: SEM pictures of coated pellets; a) the cross-section of a pellet coated
with CAP, TEC and Mgst (Product M) magnification 3,500x; b) the
surface of a pellet coated with CAP, TEC and Mgst (Product M) or
CAP, TEC, Mgst and EC (Product N), magnification 1,000x.
CAP+TEC+Mgst Layer
HPMC-MO Layer
a
b

160 Results and discussion
Figure 3.4: Colour changing of a pellet coated with CAP and TEC (Product K) with
a primary thin coat of HPMC containing methyl orange in 0.1 N HCl at
22 °C; a) pellet at the start; b) pellet after 10 min.
b
a

Results and discussion 161
3.1.3 Swelling
The swelling of HPMC pellets (Product P) was at the high value of 22 %, whereas MO
pellets (Product A) had a smaller swelling of 13 % (Table 3.2). The swelling of CAP-MO
pellets was performed with Product K. These pellets dissolved partly during 2 h in 0.1 N
HCl, detected by a reduction in the diameter of the pellets. This may be due to
dissolving both of core material and of the outer layer.
Product D1 ± SD
D2 ± SD (pixel)
∆ D ± SD
Swelling (%)
P 179 ± 1 218 ± 5 39 ± 4 22
A 185 ± 2 210 ± 4 24 ± 5 13
K 218 ± 3 212 ± 4 -6 ± 2 dissolving
Table 3.2: Swelling property of different products in 0.1 N HCl, 22 °C;
D1: diameter before swelling, D2: diameter after swelling,
P: HPMC pellets, A: MO pellets, K: CAP-MO pellets
In this present work the percentage of swelling was used because this study can be
performed easily by an optical measurement, the details of which were mentioned in
2.2.6.
Thoma and Bechtold, 1999 <185> reported about the minimum thickness of CAP films
coated on tablets from an aqueous coating system and an organic system in order to
have a swelling of less than 10 % and a resistance to 0.1 N HCl. Their statement was
that a high thickness of 110 µm CAP film from an aqueous system was necessary for a
resistance to an acidic medium, whereas the thickness of 40 µm was sufficient from an
organic system. The recommended percentage of a polymer solid loading onto the
pellets from the FMC company <7> is only 10 - 20 % to give a minimum thickness that
can resist the acid medium. In the present study the thickness of the CAP film was
already high, e.g. Product J: 90 µm, however, after contact with the acid medium the
film was broken already after a short time. The swelling test gave negative values,

162 Results and discussion
which means CAP-coated pellets dissolved over a certain time in 0.1 N HCl.
Consequently, 0.1 N HCl can diffuse into the coated pellets and therefore dissolves the
indicator (methyl orange) which was released slowly from the coated pellets to the outer
medium as confirmed by the dissolution test (Figure 3.5). As the swelling of HPMC-
coated pellets was very high after contact with 0.1 N HCl (22 %) it may also cause the
explosion of the coated pellets because of the swollen layer.
3.1.4 Content of methyl orange in one pellet
The result showed that one methyl orange loaded pellet (Product A), which had a mean
weight of 1.05 mg, contained about 0.75 ± 0.01 µg methyl orange. Therefore the
content of methyl orange inside one MO pellet was 0.07 ± 0.001 % w/w, calculated on
base of the calibration curve of methyl orange in 0.1 HCl using the UV-method. The
content of methyl orange in one pellet was not high. Therefore a high amount of pellets
could be used for one release test.
3.1.5 Release of methyl orange from coated pellets
The evaluation of enteric performance of the CAP coated pellets was reported by
Williams and Liu <200>. They also used the USP XXIII dissolution Apparatus II (paddle
method). The acidic medium was 0.1 N HCl, with is taken as a model for the gastric
fluid. The acidic medium was heated to 37 °C and the temperature was held at this
temperature. The same condition was also used in this present work but only 400 ml of
the acid medium was used because the concentration of nicotinamide can be well
determined and only a small amount of coated pellets was necessary for this test.
The dissolution test of pellets was performed to support the results of the test for gastric
resistance. If the acid medium diffused through the outer film layer it will not only
change the colour of methyl orange inside the core but also dissolve methyl orange
which will diffuse outwards through the film layer. The rate of appearance of methyl
orange in the release medium will depend on the dissolving rate from inner core and
most probably on the diffusion rate from the inner core to the dissolution medium. The
total amount of methyl orange dissolved in the dissolution medium will give an

Results and discussion 163
information about the resistance property of the outer film layer. The Pharmacopoeia
allows not more than 10 % drug dissolved after testing in acidic medium for 2 h.
The evaluation of the test of delayed-release (enteric-coated) of particles in the USP
XXIII <52> is devided into two stages i.e. an acid- and a buffer-stage. The 0.1 N HCl is
used as a medium in the acid stage and 0.2 M tribasic sodium phosphate is used as a
medium in the buffer stage. After 2 h of operation in 0.1 N HCl the product must be
immediately transfered to the buffer stage. The acceptance limit in the acid stage for the
total 24 sample-units tested is that the mean dissolution of the acitive substance should
not be more than 10 % based on the percentage of the labeled content and no
individual unit, from 24 units, had a dissolution of the active substance greater than
25 %.
The result of the coated pellets in this present study shows that the cumulative
percentage of release during the first five minutes from MO-pellets, which were not
coated with CAP, was the highest one as expected (Table 3.1). The percentage of
release was reduced after coating with CAP. The dissolution profiles of different
products containing methyl orange can be seen in Figure 3.5. The maximum range of
deviation observed for any product was not more than 2 %. Therefore, error bars were
not included in the dissolution profiles to avoid visual complexity of the several
dissolution curves in individual graphs. The CAP-MO pellets were not resistent to 0.1 N
HCl over 2 h, although different thicknesses and combinations of different additives
were used. After 2 h, every kind of CAP-MO pellets (Products B to N) released more
than 20 % of MO. The smallest percentage of release appeared from Products J and K.
The delay of MO release from these two types of pellets may be due to the effect of the
CAP layer which, in this case, had a thickness of about 90 µm. At this thickness the
coating amount was very high i.e. at about 56 mg cm –2. The release result of these
coated pellets did not pass the requirement of USP XXIII. The failure in gastric
resistance of coated pellets containing methyl orange may be due to the formation of
inhomogeneous films. The bad coalescence was confirmed by SEM (Figure 3.1-3.3).
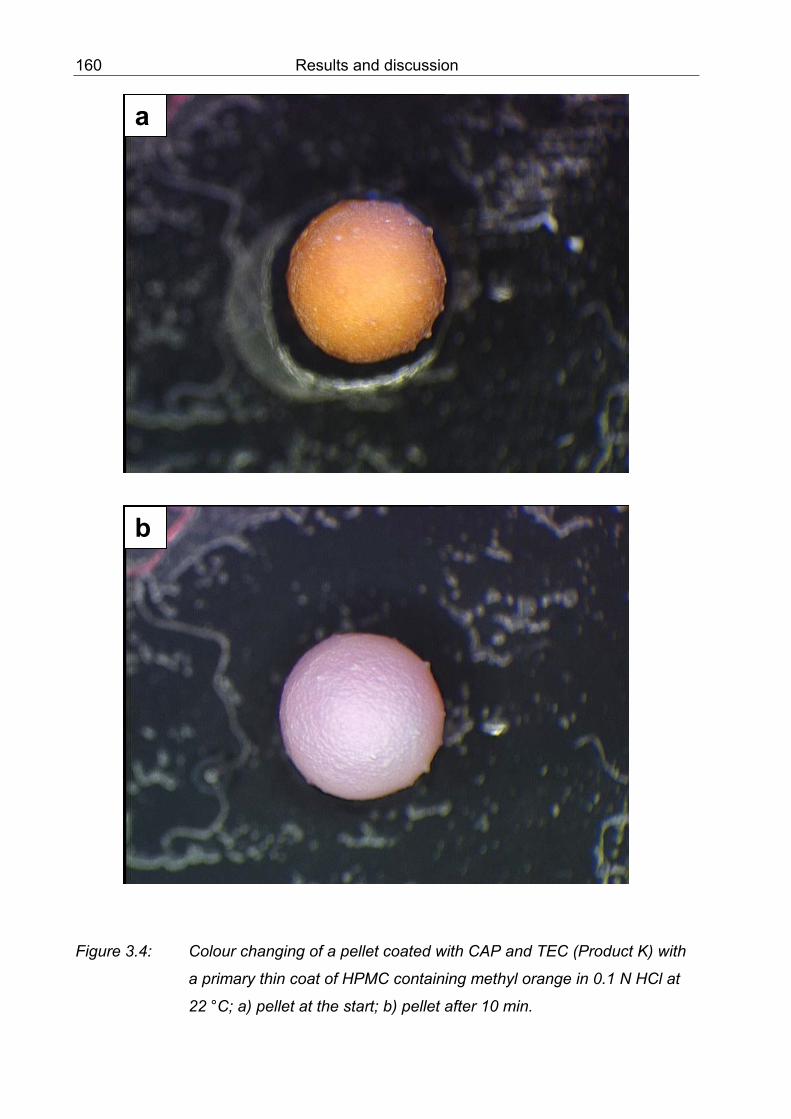
164 Results and discussion
Figure 3.5: Dissolution profiles of differently coated pellets containing methyl
orange in 0.1 N HCl at 37 °C without (Product A) and with enteric coats
containing TEC as a plasticizer (Product B to N); increasing thickness of
enteric coat in mg cm-2 ;
Product B:2, C:6, D:11, E:15, G:33; H:45, J:58, K:55; Product J:
production with intermediate drying phase; Product K: similar to Product
J, but with cyclone instead of filter; Product M: containing 10 parts of
magnesium stearate in CAP, M:16; Product N: similar to Product M, but
with addition of 20 parts of EC in CAP, N:11
0
20
40
60
80
100
0 15 30 45 60 75 90 105 120 135 150 165 180 195
Time (min)
Met
hyl o
rang
e re
leas
ed (%
)
A B C D E GH J K M N

Results and discussion 165
The unsatisfying acidic gastric resistance and the release of drug from the CAP-coated
pellets were also reported by many authors <200,207,117,121>.
Williams and Liu <200> varied the different parameters to determine the effect on the
release. The plasticizer level was 30 and 35 % of DEP based on latex solids. The outlet
temperature was varied between 36 and 48 °C. The spray rate and the air velocity were
also varied between 2 and 3.2 g/min and 50 and 90 m3/h, respectively. The release rate
of all coated pellets was first order. They have found that all pellets coated at 48 °C
released about 80 % of theophylline within 30 min in the acidic medium and that all
these coated pellets lost their integrity after 15 min, indicating that the film was not acid-
resistant. The SEM pictures showed that the polymeric latex particles did not melt
together. This indicated that the high temperature caused drying of the atomized
droplets before they could spread and coalesce on the surface. The high processing
temperature may cause a loss of plasticizer from the polymer structure as well. This can
result in a bad coalescence of the polymer because of too low concentration of a
plasticizer.
Pellets that were coated at 36 °C showed lower drug-release rates compared to the
same conditions but with higher outlet temperature. The pellets that were coated with a
dispersion containing 30 % DEP at the outlet temperature of 36 °C, both with air flow of
50 or 90 m3/h, showed cracks on the surface of pellets which implied that the polymer
coating was under-plasticized.
The smallest release rate resulted from pellets coated with a dispersion containing 35 %
DEP. The coating conditions were an outlet temperature of 36 °C, a spray rate of
3.2 g/min and an air velocity of 50 m3/h. The SEM picture of these pellets demonstrated
the improvement of the coalescence of the film and no cracks occured. However, these
pellets had the highest degree of agglomeration. This may be due to the overwetting of
product inside the coating chamber because water that was sprayed onto the pellets
could not evaporate fast enough from the surface. However, on the other hand, an
agglomeration can also occur from the high processing temperature. If the processing
temperature was higher than the Tg. This should lead to a rubbery state of polymer,
which will cause sticking of pellets resulting in agglomerates.
Normally, if agglomeration occured in the process, the coated pellets will have defect
films. Sieving in order to eliminate twin-pellets cannot be performed with sufficient
precision. Some pellets that have agglomerated would be seperated from each other by
166 Results and discussion
mechanical stress but they will have defect films. These pellets with defective films will
give higher dissolution rate of drug because of drug-diffusion through the defect holes.
Williams and Liu <200> reported that the MFFT of CAP dispersion containing 35 % DEP
based on latex solids was about 29 °C. This means the temperature of 48°C was well
above the MFFT and within the normal coating range of 10 - 20 °C above the MFFT.
However, the SEM picture revealed that coalescence had not taken place under this
coating temperature.
In summary they showed that the release rate was significantly decreased when the
pellets were coated at 36 °C compared to those pellets coated at 48 °C. Higher coating
efficiencies and better coalescence of films were obtained at the lower coating
temperature. They mentioned that the drug release in acid was decreased as the
coating temperature, which was above the MFFT, was decreased.
The unsatisfying result after using a high process temperature was also reported by
Yang and Ghebre-Sellassie <207>. They have studied the effect of product bed
temperature on the microstructure of aqueous dispersion of ethyl cellulose. They used
the bed temperature of 50 °C which was well above the Tg. They found that the films
did not form because the evaporation rate of water may have overcome the diffusion of
water existing inbetween the polymer particles and the surface, and prevented the
development of capillary forces required for particle deformation.
Williams and Liu <200> have also studied the effect of a process temperature on the
release behaviour. They used three different outlet temperatures at 32, 36 and 40 °C in
the study. These temperatures were all above the MFFT. The plasticizer level was at
35 % DEP, the spray rate was 3.2 g/min and the air velocity was 90 m3/h. They reported
that as the temperature was decreased, the release rate was also decreased. However
only the pellets that coated at 32 °C had the release of theophylline lower than 15 % in
0.1 N HCl after 2 h. Other pellets that coated at the outlet temperatures up from 36 °C
released more than 20 % theophylline after 2 h. They mentioned that the outlet
temperature of 32 °C was not low enough to resulting the complete coalescence.
However, the result implied that the lowering of the coating temperature will enhance
the coalescence. The low water evaporation rate possibly gave more opportunities for
the polymer particles to coalesce before the film was dried. The polymer particles were
able to move freely, which led to the formation of a continuous and well-packed film.

Results and discussion 167
Since moisture was present in the film and water molecules could function as a
plasticizer. The release of the drug may vary when moisture that remained in the
coating layer was gradually evaporated. The temporary plasticization with water may
lead to increase the release when water is moved, but if the coalescence was continued
during the water evaporation the drug release will decrease further.
All these data reveal that the temperature was a critical parameter which affects the
drug release. The condition that represented a wet environment for the coating will
result in better coalescence. This means the temperature and air velocity should be low,
the spraying rate should be high so that the overall drying rate was low which led to
better film formation. This finding was consistent with the studies of free films reported
by Obara and McGinity <117>.
The other example of enteric coated products that did not pass the requirement of the
Pharmacopoeia were shown by the work of Oschmann <121>. He studied the property
of resistance against acid medium or the disintregation in the buffer of marketed
products and he showed that about 25 % of total 181 tested products were not in the
requirement of the Pharmacopoeia. Especially the capsule preparations have more
problems to reach the above mentioned requirement. Most of the marketed products
that had CAP as a coating polymer lost their resistance against acid and the time of
disintregation in the buffer increased after a period of storage. Most of the marketed
products containing pancreatin as an active drug lost their resistance against acid and
the time of disintregation in the buffer increased after a period of storage. Perhaps this
problem came from the chemical interaction between pancreatin and CAP. The
enzymatic splitting of CAP because of pancreatin was not the case. Products containing
bisacodyl, phenylbutazon or digitoxin did not have the above mentioned problems. This
could result from the non-ionic property of these drugs. The small amount of drugs
incorporated in the tablets may also be the reason that interaction between the drug and
the enteric polymer did not exist.
On the other hand, the satisfactory acidic gastric resistance of CAP-coated products
was reported by Oschmann <121> in formulations based on organic or ammonia
system. Oschmann used both the formulations to coat tablets and the mean thickness
of film coated on tablets was 48 µm. The alcoholic formulation consisted of 8 parts CAP,
1.5 parts DEP, 42.25 parts ethyl acetate and 42.25 parts iso-propanol, whereas the

168 Results and discussion
ammonia based formulation contained 8 part of CAP and 1.5 parts of triacetin.
Oschmann showed that both tablets coated with the alcoholic and ammonia salt
solution were resistent against acid medium over 4 h. However, tablets coated with the
ammonia salt solution were swollen after 2 h. The disintregation times of these two
products were less than 20 min.
3.1.6 Optical appearance after the release study
The optical appearance of pellets in the acidic dissolution medium was observed with
CAP-MO pellets (Product K). It was found that the greatest portion of the CAP-MO
pellets was broken within 30 min (Figure 3.6). The inner core of the pellets had now a
pink colour, because methyl orange had changed to its protonated form. Only the outer
CAP layer was broken. However, since the pellet below the CAP film was not destroyed
but swollen and/or partly dissolved, it cannot be the CAP film layer, which hindered the
release of methyl orange from the pellets. Therefore further investigations were carried
out to elucidate the delay of the release of methyl orange.

Results and discussion 169
Figure 3.6: Optical appearance of CAP-coated pellets containing methyl orange
(Product K); a) before and; b) after exposure to 0.1 N HCl, 37 °C for
30 min.
a
b

170 Results and discussion 3.1.7 Content of phthalyl in coated pellets
The data of calculated contents of phthalyl groups based on different products are
demonstrated in Table 3.3. The amount of methyl orange in one pellet was already
determined and the mean value was 0.75 µg or 0.002 µmole. The amount of phthalyl in
different enteric coated pellets was calculated both in µg and µmole. The mole ratio of
phthalyl and methyl orange can be calculated as follows; For example Product L had
phthalyl of 0.43 µmole. Therefore the mole ratio between phthalyl and methyl orange
was 0.43/0.002 = 215. This ratio was the highest one compared to all enteric coated
pellets. This means that the content of methyl orange incorporated in one pellet was
very low compared to the content of phthalyl groups. The mole ratio of the samples
used for determination by FTIR and NMR was 0.003/0.015 = 0.2. This means the mole
ratio of phthalyl groups and methyl orange in the FTIR and NMR technique was lower
than that in the released study, but the content of methyl orange incorporated into the
mixture was higher. This may make it possible for determination of salt bonding which
may happen.
Results and discussion 171

172 Results and discussion 3.1.8 Hypothesis of salt formation between methyl orange and CAP
The delay of the release of methyl orange from CAP coated pellets (Figure 3.5,
Products J and K) cannot be caused by the thickness of the CAP layer alone because
the CAP film layer was broken after exposure to 0.1 N HCl for a certain time as already
mentioned in 3.1.6. The other mechanism such as chemical bonding may be
responsible for the delay of release as well. If the chemical structure of methyl orange
(MO) in 0.1 N HCl is considered, it is supposed that the protonated nitrogen atom of
methyl orange could form salt with oxygen atom of the dissociated carboxylic groups in
CAP (Figure 3.7). Therefore two spectroscopic methods i.e. FTIR- and NMR-technique
were used to determine the extent of a possible salt bonding between methyl orange
and the carboxylic groups of CAP.
Figure 3.7: A scheme shows a possible salt formation between the positively
charged nitrogen atom of methyl orange and the oxygen atom of the
phthalyl group of CAP due to an association of the proton from the
carboxylic group with anionic sulfonyl group of methyl orange.
N N N
CH3
HO3SCH3
+H
O
C O
C
O
Cellulose Chains
-

Results and discussion 173
3.1.7.1 FTIR
The interpretation of different bands was performed by using the table of absorption of
different chemical groups demonstrated in the literature <201,72,66>. The comparison
of the spectra of four samples i.e. methyl orange powder as a sodium salt (a), methyl
orange as a protonated form by dispersing powder in 1 N HCl and subsequent drying at
r.t. (b), the dried film of CAP and TEC (c) and the dried mixture of CAP, TEC and MO
(d) was performed. Figure 3.8 shows the characteristic sharp bands of these four
samples. The broad band at the region 3450 cm–1 in Figure 3.8a and Figure 3.8b
indicates the valency vibration of the CH – groups and bands at the region of 2800 cm–1
- 2900 cm–1 indicate the N – CH3 groups in the samples of methyl orange. However, the
broad band in the region of 3450 – 3500 cm–1 and 2800 - 2900 cm–1 in Figure 3.8c
indicates the associated OH - group of CAP. The carbonyl of ester groups shows a
sharp band at 1738 cm–1 and also bands at 1600, 1580, 1490 cm–1. The aromatic band
is at 1450 cm–1. The absorption bands of ester are in the finger print region of
1370 cm–1 and 1230 cm –1. A vibration of valancy of C – O group shows a strong band
at 1100 cm –1. The bands of absorption of aromatic groups are at the regions of
800 cm–1 and lower. Figure 3.8d shows the combination of specific bands from methyl
orange and CAP. Figure 3.9 shows the higher magnification of the spectra between
700 - 1700 cm –1. The typical bands of the chemical group N = N of the sodium salt of
methyl orange can be seen clearly at peaks 1518, 1444, 1421, 1390, 1366, 1313, 1217,
1185, 1119, 1038 and 1007 cm –1 in Figure 3.9 a. The sharp band at 1605 cm –1
indicates the aromatic groups. The bands lower than 900 cm –1 indicate substituents at
the benzene ring. Figure 3.9b shows the typical bands of the chemical group N - N or
N = N of the protonated form of methyl orange i.e. 1404, 1385, 1262, 1235, 1183, 1163,
1114, 1026 and 1006 cm –1. The bands in the region of 1500 - 1650 cm –1 indicate the
aromatic groups and the bands below 900 cm –1 indicate substituents at the benzene
ring of methyl orange as well. Figure 3.10 shows the difference of bands in the region
between 1000 and 1200 cm –1. The new band can be seen at 1069 cm –1 in Figure
3.10d, demonstrated by an arrow, because the spectra of the samples of methyl orange
(Figure 3.10a and Figure 3.10b) and CAP with TEC (Figure 3.10c) does not contain this
band. The new band may correspond to the change of the carbonyl group of CAP as it
was known that the band in the region of 1040 - 1150 cm –1 demonstrates the vibration
of a valancy of C – O in the C - OH group <201,72>. Normally the N - CH3 group shows

174 Results and discussion a medium sharp band in the region of 2820 – 2780 cm –1 <72> and the - OH group of
the carboxylic groups normally shows a broad band in the region of 3200 – 2500 cm –
1. The ammonium salt shows band in the region of about 3000 cm–1. However, the
difference of bands in the region of 2700 - 3500 cm –1 and 3300 – 3500 cm –1 was not
clearly seen in the above mentioned four spectra which may be due to the interference
of chemical bonding of - OH and N - CH3 groups.
The possibility of using FTIR technique to determine the chemical bonding was also
demonstrated in many works <121,165,155>. For example: Oschmann <121> showed
the possibility of using the FTIR technique in studying the stability of films from CAP. He
found that after storing films at 40 °C for 1 year, the intensity of bands was increased
especially at the region of 3500 - 2500 cm –1 which may be due to the increase of the
content of free hydroxyl groups. No significant new bands could be detected after this
storage condition. However, after storage at the higher stress condition of 60 °C and
80 % r.h. for 1 year, two double bands at 2550 and 2750 cm–1, represented the
carboxylic acid groups, could be clearly seen. Moreover there was a shifting of band of
the carbonyl group to lower wavelength numbers which indicated that there was a high
degree of free acid instead of ester groups. This phenomenon was also confirmed by
the presence of a single band at 1580 cm –1 instead of double bands in this region and
double bands at 800 cm –1 also changed into a single band. Oschmann concluded that
the result from the IR technique showed clearly that films from CAP after exposition to
stress conditions contained a higher amount of free phthalic acid which occured from
the splitting of the ester groups of CAP.
Schierz <165> has used IR technique to determine the ammonium salt, which has
bands in the region of 1500 to 1600 cm –1, in different coating formulations and coating
techniques. Schierz also used the IR technique to find out the suitable method to
remove ammonia from the polymer because ammonia contained in the film layer after
finishing the coating process was not desired. For this reason films from the fluidized-
bed technique and from the casting technique were used as samples. Both the aqueous
and alcoholic formulations were observed in comparison.
Roxin, Karlsson and Singh <155> studied the stability of CAP by using IR technique.
They showed the differences in infrared spectra of the fresh powder of CAP and the
CAP powder after storage under a stress condition at 40 °C, 89 % r.h., for 15 weeks.
The spectra of the stored sample showed characteristic bands in the region of 2600,
1700, 1400, 1000 - 400 cm-1 of phthalic acid that were not present in the fresh sample.

Results and discussion 175
Figure 3.8: FTIR spectra of four samples; a) methyl orange (MO) powder in KBr;
b) MO-protonated by dispersing powder in 1 N HCl and subsequent
drying at r.t., in KBr; c) film from CAP and TEC in dichloromethane on
NaCl disc; d) dried mixture from CAP, TEC and MO, in KBr.
5 0 01 0 0 01 5 0 02 0 0 02 5 0 03 0 0 03 5 0 04 0 0 0
5 0 01 0 0 01 5 0 02 0 0 02 5 0 03 0 0 03 5 0 04 0 0 0
5 0 01 0 0 01 5 0 02 0 0 02 5 0 03 0 0 03 5 0 04 0 0 0
5 0 01 0 0 01 5 0 02 0 0 02 5 0 03 0 0 03 5 0 04 0 0 0
a
c
d
b

176 Results and discussion
Figure 3.9: FTIR spectra of substances; a) methyl orange (MO) powder in KBr;
b) MO-protonated by dispersing powder in 1 N HCl and subsequent
drying at r.t., in KBr.
20
30
40
50
60
70
80
7009001100130015001700
W avenumbers (cm -1)
Tran
smitt
ance
(%)
30
35
40
45
50
55
60
65
70
7009001100130015001700
W avenumbers (cm -1)
Tran
smitt
ance
(%)
b
a

Results and discussion 177
Figure 3.10: FTIR spectra of four samples; a) methyl orange (MO) powder in KBr;
b) MO-protonated by dispersing powder in 1 N HCl and subsequent
drying at r.t., in KBr; c) film from CAP and TEC in dichloromethane on
NaCl disc; d) dried mixture from CAP, TEC and MO, in KBr; the arrow
shows new band.
10
20
30
40
50
60
70
100011001200
Wavenumbers (cm -1)
Tra
nsm
itta
nce
(%)
35
40
45
50
55
60
100011001200
Wavenumbers (cm -1)
Tra
nsm
itta
nce
(%)
20
30
40
50
60
70
80
90
100
100011001200
Wavenumbers (cm -1)
Tra
nsm
itta
nce
(%)
35
36
37
38
39
40
41
42
43
44
45
100011001200
Wavenumbers (cm -1)
Tra
nsm
itta
nce
(%)
a b
c d

178 Results and discussion 3.1.7.2 NMR
The residual solvent signal of the deuterated dimethyl sulfoxide (DMSO-d6) is shown at
2.50 ppm and the signal of the internal reference tetramethylsilane (TMS) appears at
0.0 ppm. Only the results from the 1H -NMR spectra are presented because information
from the 13 C -NMR was very limited.
Figure 3.11 to 3.14 show the results from 1H of NMR. Only the region from 0 to 8 ppm is
demonstrated because there are no bands in the region from 8 to 16 ppm. The NMR
spectra of methyl orange as a sodium salt and a protonated form are shown in Figure
3.11 and 3.12, respectively. A shift of one band at 3.35 (Figure 3.11) to 3.42 ppm
(Figure 3.12) and a double bands at 3.18 and 3.17 ppm (Figure 3.11), shown by arrows,
may indicate the change in the nitrogen atom connected to methyl groups at the
periphery. However, the result from 13 C of NMR method showed no significant
difference between methyl orange sodium salt form and its protonated form. Both of
them show the same bands at 126.4, 124.7, 121.1, 111.5 and 39.7 ppm.
Figure 3.13 shows the characteristic bands of a CAP film containing TEC. Figure 3.14
shows the spectrum of a dried mixture of CAP, TEC and methyl orange. After
comparing the four 1H NMR spectra (Figure 3.11 - 3.14) a new group of bands can be
found in the region of 7.65 - 7.68 ppm, as demonstrated by an arrow. The other bands
in Figure 3.14 originated from methyl orange (normal type letters) and from CAP+TEC
(italic letters).
In the literature concerning the NMR spectroscopy, the chemical shifting in the region of
7 - 9 ppm is mostly caused by the aromatic groups <72>. If the aromatic group does not
contain any substituents the 1H signal will be at 7.26 ppm. If the aromatic group
contains a substituent such as COOH or N(CH3) there may be a shifting. For example: if
the substituent is COOH the 1H signal, calculated by addition of the maximum value of
(+ 0.8) to the value of non-substituent one (7.26), will be at the higher region i.e.
8.06 ppm. However, if the substituent is N(CH3) the 1H signal, calculated by addition of
the maximum value of (- 0.67) to the value of non-substituent one (7.26), will be at the
lower region i.e. 6.59 ppm. This present study shows that the new bands of 1H NMR
appear at the region of 7.65 - 7.68 ppm, which lay in the region of the aromatic group
with a substituent. The new bands possibly resulted from the change of the substituents
at the aromatic groups of methyl orange and the phthalyl group of CAP.

Results and discussion 179
The possibility of determination of the phthalyl groups of CAP by NMR technique was
also studied by Roxin, Karlsson and Singh <155>. Both the 1H-NMR and 13C-NMR have
been employed to determine the degradation products (acetic acid and phthalic acid)
from the powder of CAP polymer. DMSO was used as a solvent. They showed that this
technique can be used to determine the amount of acetyl and phthalyl groups in relation
to the polymer by using specific shifts at 2.2 - 1.8 ppm and 7.9 - 7.2 ppm, respectively,
though there were several overlaps in the proton signals from cellulose. Roxin, Karlsson
and Singh have also stored the powder of CAP at various conditions; partial pressure of
22.1 to 65.6 mbar and/or temperatures of 20 to 60°C, a loss in the degree of substitution
was found. The acetyl content was reduced from 19.4 % w/w in a fresh sample to
9.2 % w/w after storage at a stress condition of 65.6 mbar and 40 °C and the phthalyl
contents was reduced in the same manner i.e. from 33.5 % w/w to 19.6 % w/w. They
mentioned that the storage humidity was a major parameter influencing the rate of
hydrolysis of the CAP polymer. It can be seen from the work of Roxin, Karlsson and
Singh that the signal of phthalyl groups (7.9 – 7.2 ppm) was almost in the same region
as in this present study with a shift in the region of about 7.6 ppm.
The determination of the substances by using the two techniques (FTIR and NMR) has
given the opinion that the new band in FTIR spectrum and the shifting of 1H NMR
signals may be due to the salt bonding between the nitrogen atom of methyl orange and
the oxygen atom of phthalyl group.

180 Results and discussion
Figure 3.11: 1H-NMR spectrum of methyl orange (MO) yellow coloured powder in
DMSO.
7.7 3
7 .82
7.79
6 .85
6.83
3 .35
3.18
3.17
3.07
2.51
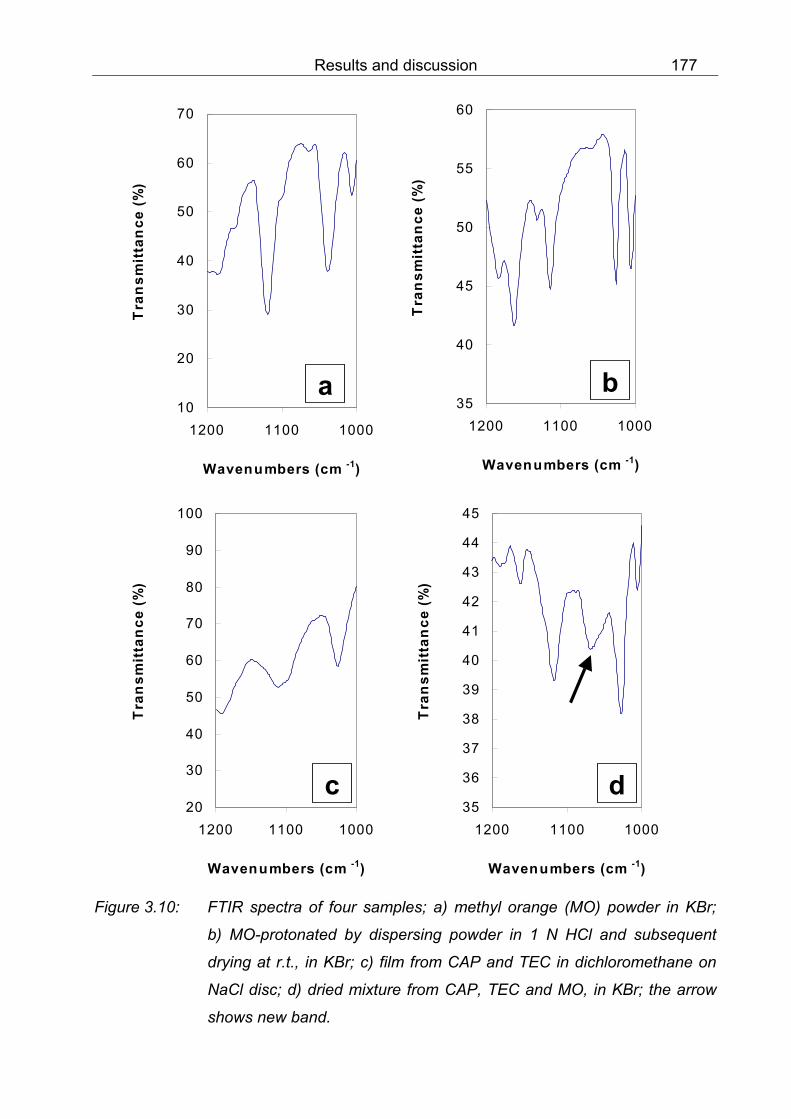
Results and discussion 181
Figure 3.12: 1H-NMR spectrum of MO - protonated by dispersing powder in 1 N HCl
and subsequent drying at r.t., red coloured powder in DMSO.
7.82
7.80
7.72
6.86
6.84
3.42
3.07
2.50
No
band

182 Results and discussion
Figure 3.13: 1H-NMR spectrum of film from CAP and TEC in DMSO.
7.58
7.57
7.56
7.55
5.58
4.14
4.12
4.10
4.08
4.05
4.03
4.01
4.003.513.31
2.87
2.83
2.72
2.68
2.50
1.21
1.19
1.18
1.16
1.14
1.05
1.03

Results and discussion 183
Figure 3.14: 1H-NMR spectrum of a dried mixture from CAP, TEC and MO in DMSO.
7.60
7.59
7.58
7.57
7.82
7.80
7.73
6.87
6.85
4.14
4.12
4.10
4.09
3.51 3.08 2.87
2.84
2.72
2.692.50
1.21
1.20
1.18
1.16
1.14
1.05
1.04
4.05
4.03
4.02
4.00
7.68
7.67
7.66
7.65

184 Results and discussion
3.2 Pellets with nicotinamide and HPMC as a subcoat
a) Placebo: HPMC-coated pellets (HPMC pellets)
The dissolution of sugar from the surface of the spheres may happen especially if the
coating process with an aqueous base solution required a long time and the spraying
rate was slow so that it took a long time to coat all the surface of the sugar spheres. The
seal coat with HPMC can hinder the high dissolution of the surface because less time
was necessary to coat all the surfaces with HPMC than to layer with nicotinamide and
HPMC as a binder. The HPMC coated pellets (Product PP) later-on had a white colour
because of the clear film layer. These pellets were achieved from the combination of a
formulation R1 and a process number X7, as demonstrated in the Table 2.26.
b) Nicotinamide loaded pellets: Nico pellets
The Nico pellets (Product AA) had also a white colour because HPMC was used as a
binder. These pellets were achieved from the combination of a formulation R3 and a
process number X8, as demonstrated in the Table 2.26.
Williams and Liu <200> used pellets, which were prepared by the extrusion-
spheronization method, as core materials. These pellets contained theophylline, Avicel
PH 101 and lactose in a ratio of 1:2:1. The size of core pellets was 16 - 20 mesh. The
preparation method of pellets is an extrusion-spheronization which contained a lot of
insoluble substances (microcrystalline cellulose and lactose), i.e. 3 parts of fillers and
one part of drug. The insoluble drug can hinder the diffusion of the drug from the core.
In the present study the drug was layered in a thin layer with only a little binding
substance, HPMC. This layer of drug can directly contact the adjacent film layer. This
model was used in order to observe the effect of outer film layer on the inner core which
contained water soluble drug and was a weak base. The physical and chemical effects
were observed. The 16 - 20 mesh size of pellets prepared from Williams and Liu <200>
is comparable to the size of 1000 µm of sugar spheres used in this present study.

Results and discussion 185
c) HPMC as a subcoat: HPMC-Nico pellets
The HPMC-Nico pellets (Product BB to DD) had an orange colour as a marker was
used. These pellets were achieved from the combination of a formulation R4 and a
process number X9, as demonstrated in the Table 2.26.
HPMC was applied in this work in order to achieve the non-ionic polymer layer. This
layer will be used as a subcoat or intermediate coat to separate the layer of drug and
the enteric polymer layer.
d) Enteric coated pellets: CAP-HPMC-Nico pellets
The CAP-HPMC-Nico pellets (Product EE to NN) still had an orange colour caused by
the marker. Therefore these finished CAP-coated pellets could be well selected from the
other pellets, which have the colour of pink (EC as a subcoat), blue (PVA+EC as a
subcoat), green (EC+PVA as a subcoat) and white (Placebo). The same coating
conditions were well performed by mixing different loading materials. The CAP-HPMC-
Nico pellets were achieved from different combinations of a formulation (R8 - R11) and
a process number (X17 - 19), as demonstrated in the Table 2.26.
A specialist, Mr. Carlin <25>, recommended that the plasticizer content should be 20 %
– 24 % and the dispersion should be stirred after adding for 30 min. On the other hand,
in the work of Williams and Liu <200>, a high plasticizer content of 35 % was used and
stirred for 24 h because droplets of the plasticizer were still observed after 1 h. Dibutyl
sebacate (DBS) is not a recommended plasticizer for Aquacoat CPD <25>. However,
Mr. Carlin does not give further details about unsuitable properties of DBS.

186 Results and discussion
3.2.1 Film quality, diameter and weight of pellets
The physical properties of raw materials used for this process and for the finished
products are shown in Table 3.4. The mean diameter of the raw material (sugar spheres
with a size fraction of 800 - 1000 µm, SS) determined by an image analyser was
970 ± 37 µm. The mean diameter of the HPMC-coated pellets (Product PP) was
970 ± 34 µm. According to 2.2.2 the standard deviation of 34 - 37 µm was equivalent to
about 2 pixel which was quite acceptable. The comparison between the mean diameter
of the raw material (SS) and the HPMC-coated pellets (Product PP) showed that the
diameter was not significantly different. Consequently, the coating process was well
carried out and homogeneously coated pellets resulted.
The thickness of the HPMC layer (Product PP) as measured by the SEM was about
9 ± 3 µm. The structure of the film was homogeneous and did not contain cracks. This
means that these pellets can be well used for the layering of nicotinamide.
The mean weight of one HPMC pellet (Product PP) was 0.66 ± 0.01 mg, which was
negligibly lower than that of sugar spheres. This may be due to the dissolving of the
sugar from the surfaces of the spherical cores. After layering the HPMC pellets with
nicotinamide and applying HPMC as a binder the Nico pellets resulted. One Nico pellet
(Product AA) had a mean weight of 0.75 ± 0.02 mg and a mean diameter of 1010 ± 35
µm. The thickness of the nicotinamide layer (Product AA) was 22 ± 3 µm and the weight
gain of these Nico pellets were 11.3 % w/w. Nicotinamide was recrystallized again as
rod-crystals on the surface of HPMC pellets after water was evaporated. The structure
of this nicotinamide layer was loose. Details were discussed in 2.4.3.
The subcoat from HPMC has been achieved in three different thicknesses; i.e.
12 ± 2, 26 ± 3 and 38 ± 5 µm with amounts of HPMC of 7.5, 15 and 22 % w/w
respectively. The SEM photograph in Figure 3.15a shows the thickess of HPMC layer of
Product BB and that the layer was homogeneous. The mean weight and the mean
diameter of one pellet compared between cores (Product AA) and HPMC-Nico pellets
(Product BB to DD) allowed to calculate amounts of HPMC-polymer coated per pellet,
namely from 7.5 to 21.2 mg cm –2 .
Table 3.4 shows the physical properties of CAP-coated pellets. As expected, as the
amount of CAP coated onto the HPMC-Nico pellets increased, the CAP film layer also
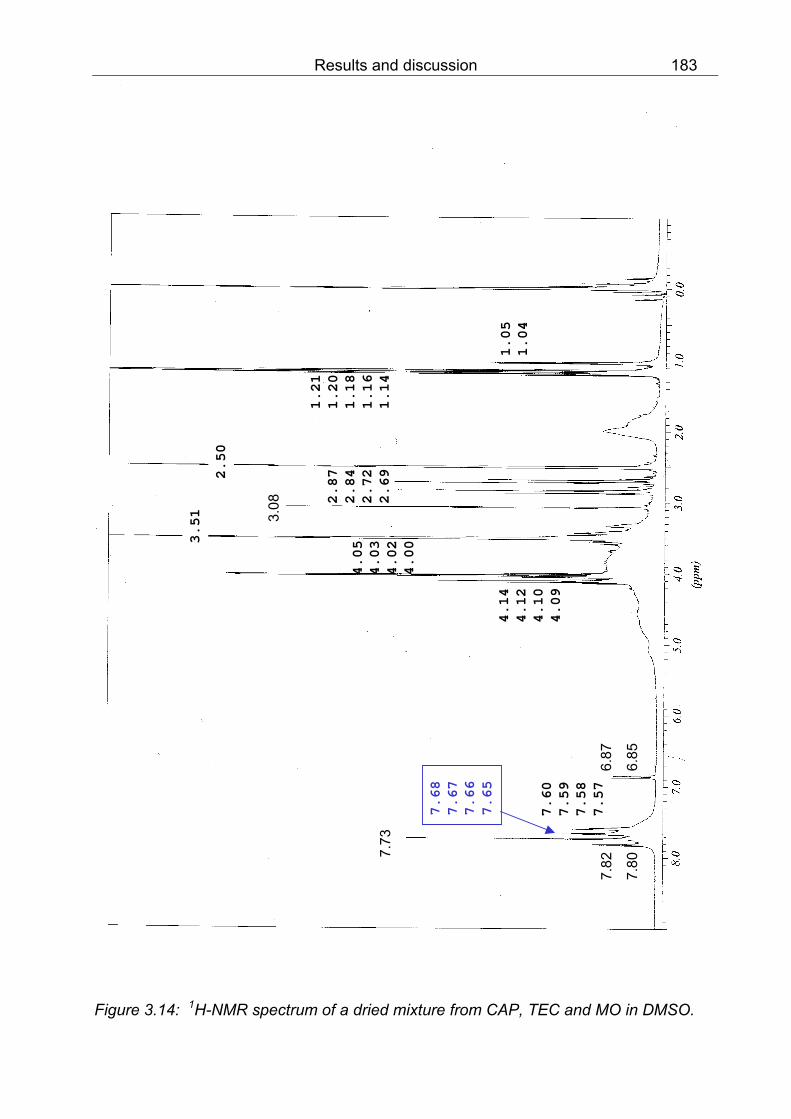
Results and discussion 187
increased in the thickness. The layer of CAP and DEP as a plasticizer showed big
cracks with a length of about 20 µm on the surface (Figure 3.15b). From the top view of
the whole pellet, the porous regions can also be well demonstrated (Figure 3.16a). This
may be due to the high drying rate so that the CAP particles did not have enough time
to fuse together. On the other hand if the drying capacity was not high enough local
wetting might have occured, which would cause sticking of the CAP coated pellets.
There was no difference between the CAP film layer from Aquateric or Aquacoat CPD
as judged from physical properties of the products. Therefore, further trials were made
by using only Aquacoat CPD as a source for CAP. Because the preparation method of
the dispersion of Aquacoat CPD required less steps than of Aquateric which in addition
needed Tween 80. The preferable use of Aquacoat CPD rather than Aquateric was also
recommended by a specialist of FMC, Mr. Carlin <25>.
In this present work before the coating process was performed the dispersion containing
CAP and DBS (R8, Table 2.22) was dried in a hot air oven at the temperature of 45 °C
up to a constant weight but the resulted films were only partially transparent. However,
the drying process in a hot air oven was not the same process as it appeared in the
coating process in a fluidized-bed apparatus. Therefore the coating process at the
product temperature of 45 °C was performed to observe the film formation.
The result shows that the surface of the layer of CAP and DBS as a plasticizer under
SEM is very rough. The whole pellet shows uneven regions (Figure 3.16b). This result
may be due to the inhomogeneous distribution of DBS. The SEM photograph of the
cross-section shows that many particles did not melt together (Figure 3.17a). The
structure of CAP layer is very porous. Already during the cutting of the pellets for the
SEM test, the pellets were crumbled without control. This present work shows that DBS
seems not to be well distributed between the polymer chain and therefore resulted in
the uneven film structure. However, DBS can hinder the formation of twins or
agglomerates during the coating process. This may be due to the greasy property
(water insoluble) of DBS.
The MFFT of CAP in combination with DBS was not reported. Therefore it may be
necessary to determine the MFFT especially by the spraying technique. The casting
method may not be suitable because of the sedimentation of the solid content or the
cohesion of the plasticizer during the drying process.

188 Results and discussion
It seems based on this present work that, if DBS should be used, the higher coating
temperature may be necessary to receive the MFFT in order to bring the CAP particles
to melt together. The best CAP film was achieved by using TEC as a plasticizer at the
definited process conditions, however this film was not resistant to 0.1 N HCl. A cross-
section of the CAP layer shows almost homogeneous film structure (Figure 3.17b) but
there are small cracks of about 3 µm on the surface (Figure 3.18a). The big particles on
the surface of CAP-HPMC-Nico pellets are Aerosil 200 particles, added to hinder the
sticking of pellets during storage. Figure 3.18b shows the uneven position on the
surface of a whole pellet. This means pellets coated with CAP and TEC, and HPMC as
a subcoat, showed very clear uneven regions. This result appeared especially when a
subcoat came from the hydrophillic polymer, e.g. HPMC or PVA. The following part
(Part 3.5) confirms this again.
The film layer prepared from CAP and TEC was increased from 27 to 90 µm in order to
observe whether the higher CAP thickness can resist the artificial gastric fluid or not.
The mean weight of one pellet was increased up to 1.51 ± 0.02 mg while the mean
diameter of one pellet was 1395 ± 43 µm at the highest coating amount of 62 mg cm –2.
In general, the standard deviations of all products in Table 3.4 have a range of only
32 to 44 µm, which demonstrates a well-controlled course of the coating processes,
even when different materials are used for coating.

Results and discussion 189

190 Results and discussion
Figure 3.15: SEM pictures of coated pellets; a) the cross-section of a HPMC-Nico
pellet (Product BB), magnification 680x; b) the surface of a pellet coated
with CAP and DEP (Product EE), magnification 1,570x.
b
a

Results and discussion 191
Figure 3.16: SEM pictures of enteric coated pellets; a) the top view of a pellet coated
with CAP and DEP (Product EE), magnification 65x; b) the top view of a
pellet coated with CAP and DBS (Product GG), magnification 49x.
a
b

192 Results and discussion
Figure 3.17: SEM pictures of coated pellets; a) the cross-section of a pellet coated
with CAP and DBS (Product GG), magnification 740x; b) the cross-
section of a pellet coated with CAP and TEC (Product NN),
magnification 1,400x.
a
b
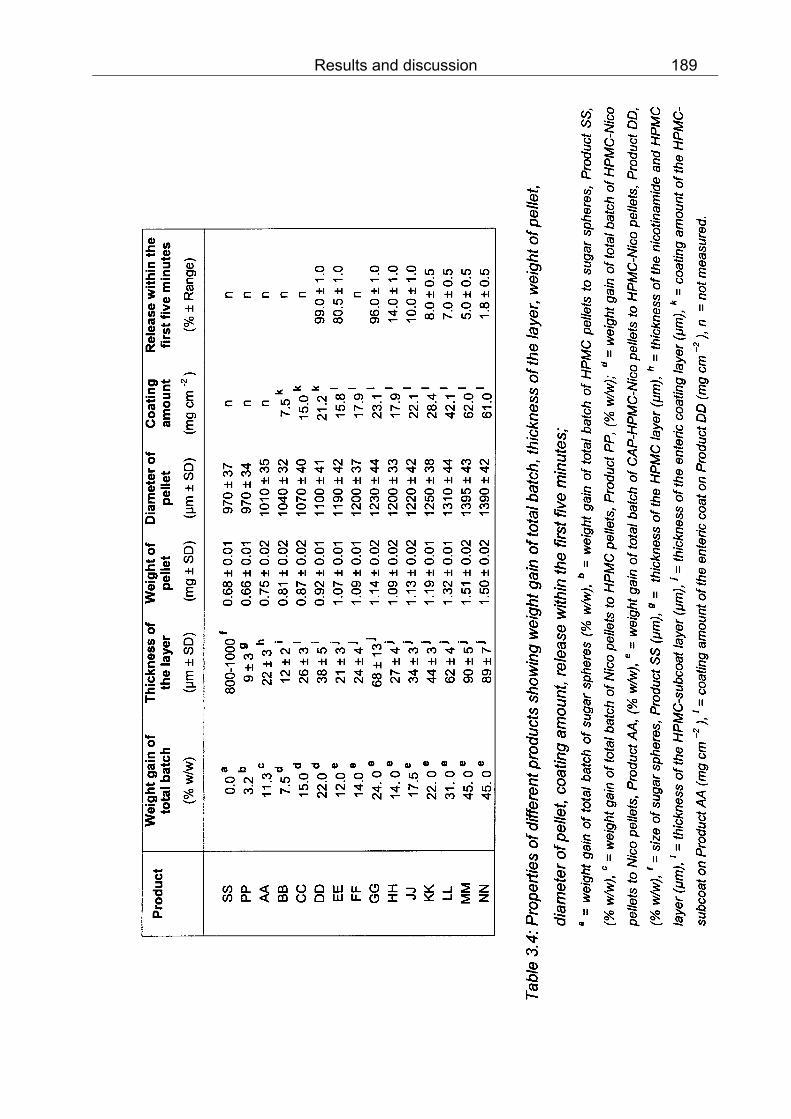
Results and discussion 193
Figure 3.18: SEM pictures of pellets coated with CAP and TEC (Product NN);
a) the surface of a pellet, magnification 10,050x; b) the top view of a
pellet, magnification 109x.
a
b
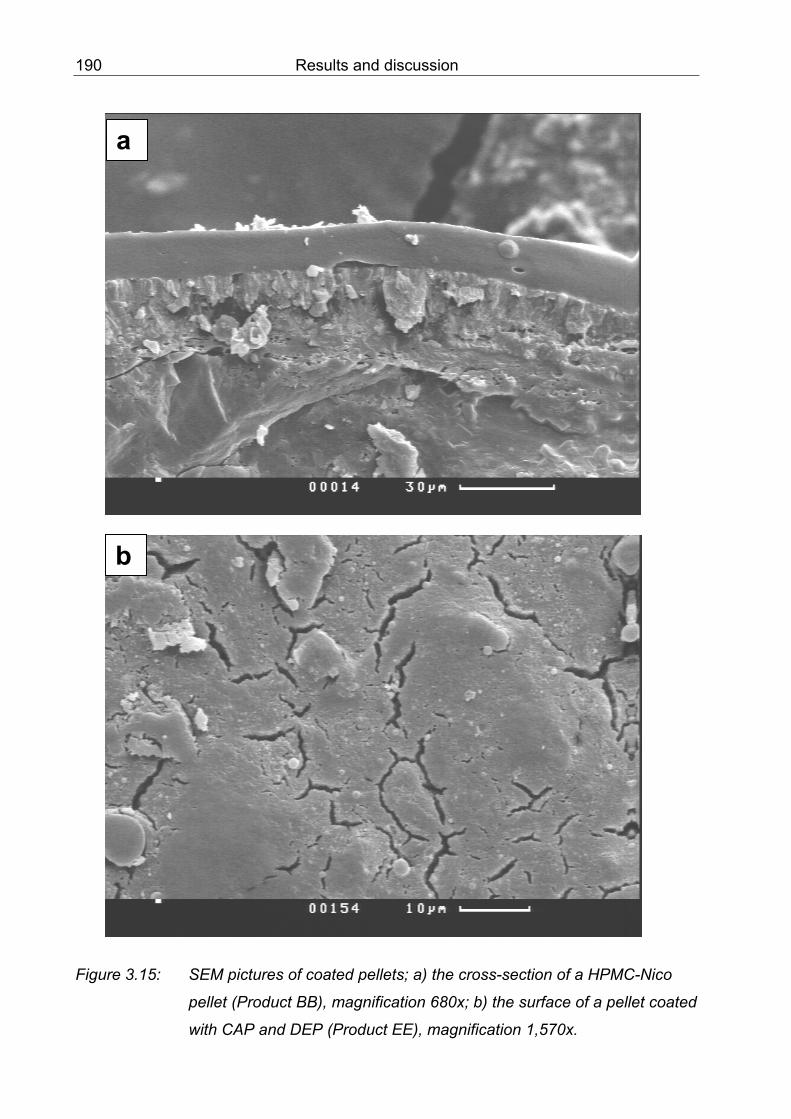
194 Results and discussion
3.2.2 Sieving
The content of each product (% w/w) was distributed in the size range which is
comparable to the mean diameter measured by the image analyser. For example:
Product NN has the higest amount (92.4 % w/w) in the size fraction of 1250 - 1400 µm,
the mean diameter from Table 3.4 was 1390 ± 42 µm. This means that the diameter of
pellets measured by the sieving technique was comparable with the measurement by
an image analysing method. The sieving method was faster compared to the image
analysing method but with the last method the pellets received a mechanical treatment
by the vibration of the sieving apparatus. Therefore the undestructive method as image
analysis was preferred for the determination of the diameters of pellets.
Type of product (%w/w) Size fraction (µm)
SS PP AA BB CC DD EE GG NN
< 800 0.5 0.3 0.0 0.0 0.0 0.0 0.0 0.0 0.0
800-1000 95.3 57.3 47.4 42.3 26.6 0.0 0.0 0.0 0.0
1000-1120 4.2 42.3 52.6 57.7 73.4 66.2 12.1 0.0 0.0
1120-1250 0.0 0.1 0.0 0.0 0.0 33.8 87.9 95.4 1.2
1250-1400 0.0 0.0 0.0 0.0 0.0 0.0 0.0 4.6 92.4
> 1400 0.0 0.0 0.0 0.0 0.0 0.0 0.0 0.0 6.4
Table 3.5: Sieve analylsis of different products;
SS: Sugar spheres, PP: HPMC pellets, AA: Nico pellets,
BB to DD: HPMC-Nico pellets, EE to NN: CAP-HPMC-Nico pellets
3.2.3 Swelling
The swelling in 0.1 N HCl of HPMC-Nico pellets was investigated with Product DD. A
high swelling of 25 % is shown in the Table 3.6. CAP-HPMC-Nico pellet (Product EE)
has a swelling of 12 %. This smaller value may be due to the small resistance of the
layer of CAP and DEP as a plasticizer, which is almost insoluble in water. The artificial
gastric juice may diffuse slower into the core so that the HPMC cannot swell well. On
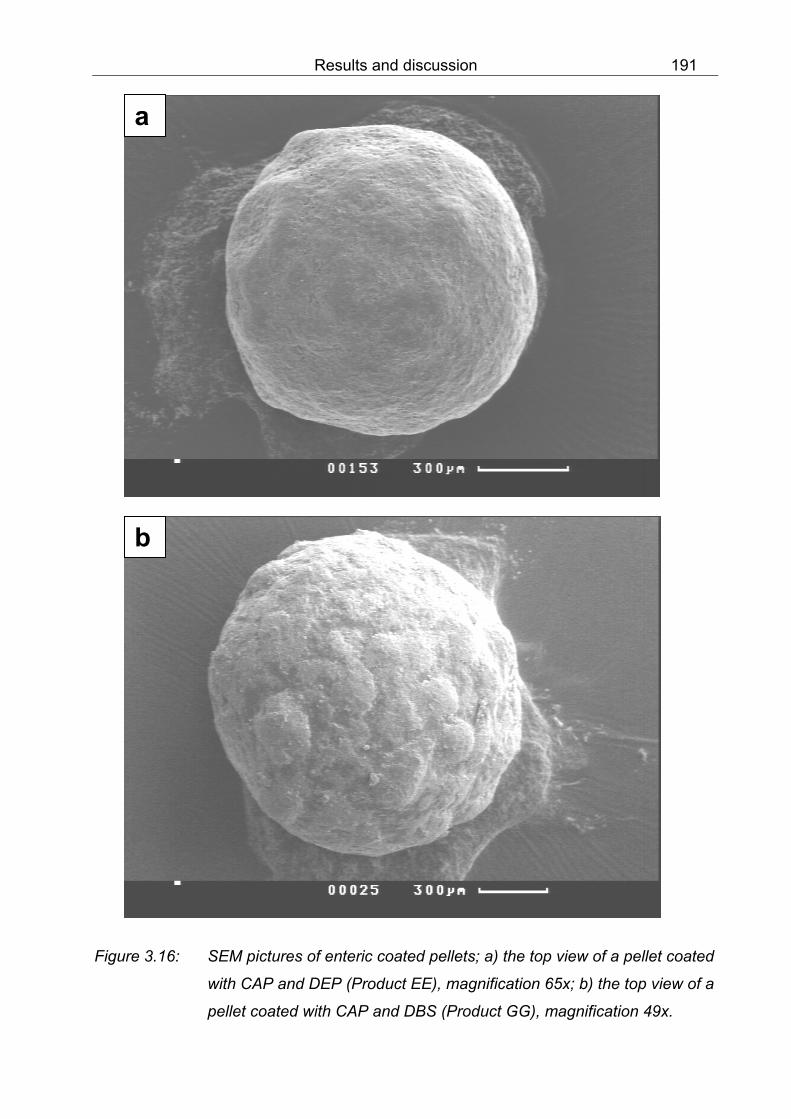
Results and discussion 195
the other hand, the swelling of Product NN cannot be measured because the pellet
dissolved in 0.1 N HCl. This may come from the effect of TEC which was a water
soluble plasticizer. If the plasticizer was dissolved in 0.1 N HCl, it will diffuse out of the
CAP film layer and cause a high diffusion of 0.1 N HCl into the core. If HPMC is swollen
it will also dissolve out of the core later-on. Nicotinamide, under the subcoat of HPMC,
can also well dissolve in 0.1 N HCl. This dissolving of the different layers and also the
inner core of sugar spheres may be the result of the reduction of the diameter.
Product D1 ± SD D2 ± SD ∆D ± SD Swelling
(pixel) (%)
DD 187 ± 2 234 ± 4 47 ± 2 25
EE 207 ± 1 232 ± 3 24 ± 3 12
NN 218 ± 1 212 ± 1 -6 ± 2 dissolving
Table 3.6: Swelling property of different products in 0.1 N HCl, 22 °C;
D1: diameter before swelling, D2: diameter after swelling,
DD: HPMC-Nico pellets,
EE: CAP-HPMC-Nico pellets (CAP+DEP),
NN: CAP-HPMC-Nico pellets (CAP+TEC)
The subcoat from HPMC gives a very high swelling so that this can cause a breakage of
the outer layer. It was then confirmed that the film from CAP and TEC was not elastic
enough to tolerate this high swelling property of HPMC subcoat.
Another method to quantitatively determine the swelling was mentioned. Li and Peck
<90> have studied the swelling property of free films. They observed and determined
the water uptake of free films for this purpose. If the percentage of water uptake is high
then it will indicate that the free films were swollen. The effect of the concentrations of
the coating liquid was demonstrated. When a concentrated coating liquid is used the
extent of its spreading is much less than that one attained by a diluted liquid because of
its relatively high viscosity and the resulting reduced fluidity. The low water content of
the concentrated liquid also effects a much faster drying rate which further limits the
degree of spreading. In some cases this concentrated liquid may produce the more

196 Results and discussion
discontinuous film structure. In some regions thinner film layers will result, which cause
a higher drug permeability. The comparison between the side-vented pan coating and
the air suspension coating (fluidized bed technique) was performed.
Potassium chloride tablets were used as the core material. A dispersion containing
silicone elastomer and 25 % w/w PEG 8000 was used as a coating liquid. Li and Peck
<90> found that the tablets coated in the fluidied bed apparatus exhibited a much faster
drug-release rate and the microstructure of the coating film was less compact than that
one coated in the coating pan. This result may be due to the difference in the dynamic
of the coating equipment. In a pan coating process the contact and friction between
tablets is more pronounced and thus promotes shearing and spreading of the coating
dispersion on the tablet surface. This action probably facilitates the formation of a more
compact and less permeable coat. By comparison, in a coating column tablets are
suspended to some extent in the air stream and therefore able to slide fast with minimal
contact to each other and to the wall of the column. Hence tablet-to-tablet contact and
the consequent spreading of the coating dispersion are minimized, leading to the
formation of a less compact films. The loading weight was reported to affect the coating
property. It was mentioned that higher, intense friction was produced at the higher
loading weight which would give the more compact and less permeable coating film
<90>.
Thoma and Kräutle <187> reported about applying of a barrier coat of HPMC prior to
the enteric coating produced from an aqueous dispersion of the coating agent CAP.
This model can reduce the swelling of the coated tablets. The percentage of swelling of
pancreatin tablets coated with an aqueous dispersion of Aquateric without any barrier
coat was very high, up to 35 %. The barrier coat prepared from HPMC at a coating
amount of 3 mg cm-2 reduced the swelling to 10 %. However, after storage at 35 °C for
12 months, the swelling of the coated tablets with a barrier coat increased again to
about 35 %.
Teuber <184> has studied the swelling of gelatine by the weighing technique. A dosage
form of gelatine prepared by a casting technique was exposed to different media at
23 °C for 96 h. The weight increase after this time period was determined after the rest
of the medium was removed from the dosage form by using the filter paper. The weight
before and after the swelling process facilitates the calculation of the degree of swelling.

Results and discussion 197
3.2.4 Content of nicotinamide in one pellet
The content of nicotinamide inside one pellet of different products was varied.
Product AA or Nico pellet without further coatings contained 9.0 ± 0.2 % w/w of
nicotinamide based on q total weight of one pellet. One pellet after coating with the
subcoat HPMC (Product DD) contained 8.3 ± 0.3 % w/w of nicotinamide. The reduction
of nicotinamide after coating with HPMC may be due to the dissolving at the surface of
Nico pellets during the first step of the coating process.
3.2.5 Release of nicotinamide from coated pellets
The cumulative percentage of nicotinamide release during the first five minutes from
HPMC-Nico pellets, which were not coated with CAP, was 99 % (Table 3.4). The
cumulative percentage of release reduced after the coating, especially with CAP and
TEC as a plasticizer. As shown in Table 3.4, the percentage of nicotinamide release
reduced from 14 to 1.8 % as the coating amount increased from 17.9 to 61 mg cm-2.
The dissolution profiles of different products containing nicotinamide can be seen in
Figure 3.19. The maximum range of deviations from the mean between two curves in
repeated determinations of release observed for any product was not more than 2 %.
Therefore, error bars were not included in the dissolution profiles to avoid visual
complexity of the several dissolution curves in individual graphs. It was found out that
the CAP-HPMC-Nico pellets were not resistent to 0.1 N HCl over 2 h, although different
thicknesses and combinations between CAP and plasticizers were used. After 2 h,
every kind of CAP-HPMC-Nico pellets (Products EE to NN) released almost 100 % of
nicotinamide. The release from Product MM and Product NN was not significantly
different over 2 h, only small differences appeared during the first 20 min. This shows
that the film property may not differ between coating by using filters or cyclone as a fine
dust collector. By inserting a cyclone, the total processing time was reduced as a filter-
change was not nescessary. The release of nicotinamide from Product GG in the first
five minutes was extremely high, 96.0 %, which was almost the same as without enteric
coat as with Product DD (99.0 %). This may be due to the highly porous structure of
CAP and DBS as a plasticizer which was also confirmed by SEM. Product EE had also
a high release of nicotinamide (80.5 %). The wide cracks on the surface of pellets
coated with CAP and DEP as a plasticizer may be responsible for this result.

198 Results and discussion
The release of nicotinamide from the CAP-coated pellets with HPMC as subcoat was
very fast. Especially in the case of CAP-coated pellets, by using DEP or DBS, the
percentage of nicotinamide release within the first five minutes was more than 80 %.
When the thickness of the CAP became higher, the protection against the gastric fluid
was also higher, which is demonstrated in the result of the nicotinamide release within
the first five minutes by using CAP and TEC as a plasticizer (Produtc HH to NN in
Figure 3.19).
Figure 3.19: Dissolution profiles of differently coated pellets containing nicotinamide
in 0.1 N HCl at 37 °C without (Product DD) and with enteric coats
containing different plasticizers (Products EE to NN);
EE: CAP with DEP at a coating amount of 15.8 mg cm-2 ; FF: CAP with
DEP at a coating amount of 17.9 mg cm-2 ; GG: CAP with DBS at a
coating amount of 23.1mg cm-2 ; HH to NN: CAP with TEC with
increasing thicknesses of the enteric coat in mg cm-2 ; HH:17.9, JJ:22.1,
KK:28.4, LL:42.1, MM:62; NN:61; MM: production with intermediate
drying phase, NN: similar to MM, but with cyclone instead of filters set.
0
20
40
60
80
100
0 15 30 45 60 75 90 105 120 135 150 165 180 195
Time (min)
Nic
otin
amid
e re
leas
ed (%
)
DD EE GG HH JJ KK LL MM NN

Results and discussion 199
As mentioned before in 3.1.1, the failure in gastric resistance may be due to the
formation of inhomogeneous films. The incomplete coalescence or the formation of
cracks can be well confirmed by SEM, 3.2.1. The physically best CAP film was achieved
by using TEC as a plasticizer at the defined process conditions, but this film was not
resistant to 0.1 N HCl.
Gumowski, Doelker and Gurny <65> have investigated the different formulations of CAP
as an organic system and as an aqueous redispersible system for coating of tablets.
The loading product were tablets containing 88 % w/w acetylsalicylic acid which were
prepared by direct compression. Tablets were coated in a lab-scale rotary drum coater.
The pan had four perforated zones, and drying air was pulled through the bed of tablets
under slight negative pressure. They used a higher pan revolution for the organic
system than for the aqueous system, but the drying air temperature (70 - 75 °C), the
spraying rate of the dispersion (2.5 ml/min), the exhaust air temperature (35 - 40 °C)
and the final drying time (10 min) of the aqueous system were higher than those of the
organic system. The weight of the coating materials was vaired from 1 to 11 % w/w.
They found that tablets coated with an aqueous system, after 1 h in 0.1 N HCl showed a
higher loss by diffusion of active drug (maximum 2.1 %) than tablets coated with an
organic system (maximum 0.5 %). Nevertheless, at all coating levels (5 - 11 %) the
percentage of drug release was less than 2.1 % on the average which met the
requirements of the USP. The possibility of replacing diethyl phthalate (DEP) with
glyceryl triacetate, triethyl citrate or glycerol polyethylene glycol oxystearate in aqueous
systems at various levels was investigated. The amount of about 25 % of DEP, glyceryl
triacetate and triethyl citrate, respectively to the solid content of CAP has been used
successfully. These formulations were gastric resistant. The combination of propylene
glycol and DEP or glyceryl triacetate was also suitable for use as a plasticizer. Scanning
electron micrographs of cross sections of the two systems revealed no obvious
differences, and no individual polymer particles were evident in the films. They
concluded that these films were completely coalesced and therefore functionally stable.
However, it should be considered that this early study <65> was performed with tablets
and a perforated pan coater was used as a coating apparatus. The movement of a
loading product inside the coating chamber was different from the fluidized bed
apparatus. The density of the tablets compared to pellets was also different and this will
also affect the movement inside the coating chamber. The aqueous enteric coating

200 Results and discussion
formulation, however, was prepared almost in the same way. Only the stirring over night
in our study was different from their study. The differences in the coating apparatus and
dosage form may be the reason that these coated tablets were resistant against 0.1 N
HCl and therefore meet the requirement of the USP. Moreover acetylsalicylic acid is a
drug which is less soluble in water. The release test of uncoated tablets in 0.1 N HCl
and phosphate buffer showed that this drug was completely dissolved (100 % release)
only after 50 min. The slow release of the drug itself may additionally hinder the release
after coating with enteric coating formulations. Nicotinamide, which was used in our
work, however is highly soluble in water. This property may induce the release of
nicotinamide from the coated pellets after 0.1 N HCl had diffused into the inner side.
3.2.6 Optical appearance after the release study
The optical appearance of CAP-HPMC-Nico pellets (Product EE and NN) after contact
with the acidic dissolution medium was observed under a light microscope. It was found
that all pellets were damaged within 30 min (Figure 3.20 and 3.21). Product NN showed
after this time the inner core of the pellets which was orange in colour. Only the outer
CAP layer was broken. This may be due to the high swelling property of HPMC-Nico
pellets as demonstrated before. Product EE, however, showed only the broken outer
layer of CAP and DEP. This means the inner core was completely dissolved within
30 min. This test showed that films from CAP and DEP or TEC as a plasticizer may not
be elastic enough to tolerate the high swelling of the subcoat.
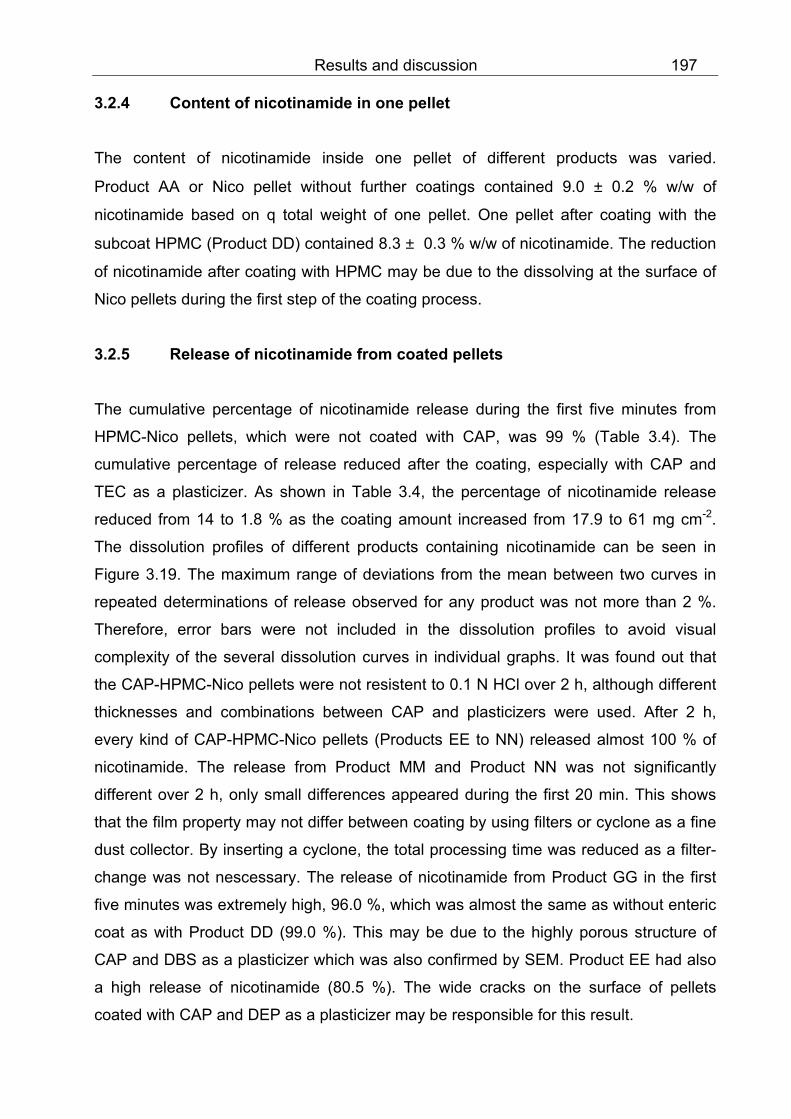
Results and discussion 201
Figure 3.20: Optical appearance of CAP-coated pellets containing nicotinamide and
HPMC as a subcoat (Product EE) after exposure to 0.1 N HCl, at 37 °C
for 30 min.

202 Results and discussion
Figure 3.21: Optical appearance of CAP-coated pellets containing nicotinamide and
HPMC as a subcoat (Product NN); a) before and; b) after exposure to
0.1 N HCl, at 37 °C for 30 min.
a
b
Results and discussion 203
3.2.7 Postdrying (curing) of enteric coated pellets
Postdrying or curing is the thermal treatment after coating to provide additional heat for
further coalescence, and has been suggested for use with polymers with a high Tg,
such as CAP <200>.
Only two types of CAP-HPMC-Nico pellets were used for this test, CAP with DEP
(Product EE) and CAP with DBS (Product GG). The film structure of Product EE
contained a high amount of big cracks before the postdrying. After the postdrying under
different conditions (40 - 80 °C and up to 75 % r.h., details in part 2.2.12) the film
structure was not improved. This was the similar case as with Product GG, which
contained porous structure instead of cracks. This means when cracks happened in the
structure of the film, it may indicate that the film was overdried. Therefore, further drying
during the postdrying phase may not improve the structure. On the other hand, if the
structure was highly porous, it may indicate that the plasticizer was not well distributed
at the intermolecular level of the CAP-polymer.
However, the successful postdrying for films prepared from CAP was demonstrated by
Williams and Liu <200>. They have studied the curing effect with pellets coated with
Aquacoat CPD and 35 % DEP at the outlet temperature of 32 °C and then cured at
60 °C for 12 h. They found that these pellets have less than 10 % release after 2 h in
acidic media. The percentage of release of pellets without curing was more than 10 %.
However, these coated pellets were found to be aggregated after the curing step.
Therefore 2 % talc was added before placing them into the oven. However, they found
that pellets coated at the outlet temperature of 36 - 48 °C and then cured at the same
condition, had no significant difference in the percentage of release after 2 h compared
to the pellets without curing. They showed that the curing was dependent on the coating
temperature. The residual moisture retained in the coating layer of pellets coated at
32 °C may play a role in the coalescence during the curing. They mentioned that heat
was not the only factor required for the coalescence of CAP films and that the curing
was not able to proceed without sufficient moisture present in the film coating.

204 Results and discussion
The effect of different humidities in the curing phase to the CAP-coated pellets were
also studied by Williams and Liu. They used pellets that were coated at the outlet
temperature of 48 °C and 90 m3/h and then the curing at 40 and 50 °C with humidities of
51, 65 and 75 % r.h. for 24 h was performed. In comparison pellets coated at the lower
outlet temperature of 32 °C and the air flow of 90 m3/h were cured at 40 and 50 °C at
75 % r.h.. The result showed that the humidity of 51 % r.h. at two temperatures had no
effect to the release of pellets coated at the higher outlet temperature (48 °C). Only the
combination of 40 °C and 75 % r.h. or 50 °C with the humidity up from 65 % r.h. can
reduce the release of theophylline. The release of theophylline from pellets coated at
the lower outlet temperature (32°C) in acidic media can be also reduced to less than
10 % by using the curing with temperatures up from 40 °C and 75 % r.h..
Williams and Liu mentioned that without sufficient moisture in the coating layers,
capillary forces were not able to deform the polymer particles, leaving dried particles on
the surfaces of the polymer coating. The semi-transparent appearance of the free film
may be the result of some uncoalesced polymer particles formed during spraying. When
these dried particles were exposed to heat with sufficient moisture, water molecules will
interact with polymer chains by competing for bonding sites such as hydroxyl groups.
Therefore the mobility of the polymer would be increased. After the heat-moisture
treatment a plasticizer such as DEP, which did not distributed between the CAP chains,
might be associated with CAP chains and with the sufficient heat provided the coating
layer became soft. The polymer particles were mobiled and can be coalesced to form a
continuous film. When absorbed moisture was removed from the cured pellets, DEP still
remained in the film and it will maintain the integrity of the film.
Williams and Liu concluded that the coating temperature was found to be a critical
parameter. Above the MFFT, the lower the coating temperatures, the better the enteric
film was formed. The heat-only curing did not have a significant effect on the reduction
of the drug release, except for the batch coated at the lowest temperature. The
exposure of pellets to the elevated humidity during curing seemed to enhance the
coalescence and the mechanical strength of the film. The degree of improvement was
dependent on the history of coating conditions. These results therefore supported the
importance of controlling the processing and curing conditions to enhance the
coalescence of the CAP polymer from aqueous formulations. However, in order to
maintain the stability of the drug and CAP, it is preferred to conduct the curing process
at a lower temperature and humidity for shorter periods of time.

Results and discussion 205
In conclusion Williams and Liu recommended to use the following coating conditions to
coat pellets; outlet temperature 32 °C, 35 % DEP, spray rate 3.2 g/min and air velocity
90 m3/h with curing.
In this present study, however, the coating process X17 (Table 2.23) was performed
with the low spray rate of 1.8 g/min to avoid agglomeration because the air velocity was
low at 55 – 60 m3/h. The relative humidity measured inside the coating chamber was
low at about 18 % r.h., which may have also resulted from the dehumidifying of the inlet
air. This almost dry coating condition may cause the fast drying so that polymer
particles did not have enough time to move near to each other and fuse together. The
possible solving method for this problem is to hinder the evaporation of water. The
addition of hydrophobic substances may solve this problem. However, the results of an
additioning of these substances as shown in 3.1 did not satisfy because the film
formation was not improved. This may be due to the fact that an addition of these
substances will cause an increase of the Tg and the MFFT. The higher temperature and
humidity in the curing process can sometimes increase the mobility of the plasticizer
<200>, but in this present study, it seems that DBS could not easily be mobilized,
although a combination of a high temperature and a high humidity was used.
In conclusion the postdrying by using different combinations of temperature and
humidity did not improve the film structure. If the drying condition was extremely high, it
caused a liquidation of the film and a change of the physical property of the enteric film
which could not anymore be used for the further investigation.

206 Results and discussion
3.2.8 Optical characterization of pellets after storage
The following storage conditions demonstrated the highest humidity at each
temperature that still allowed the placebo pellets or enteric coated pellets to flow freely
after 30 days of storage.
Samples
Conditions
Placebo pellets
(Product P)
Enteric coated pellets
(Product EE)
Temperature (°C) Relative humidity (% r.h.)
25 80.9 57.5
30 56.0 56.0
35 54.0 30.2
40 53.1 30.0
45 52.0 29.8
50 50.9 29.7
Table 3.7: The highest humidity at each temperature that still allowed the placebo
pellets (Product P) and the enteric coated pellets and a HPMC as a
subcoat (Product EE) to flow after 30 days of storage.
In summary it was found that the placebo pellets (Product P) were more stable to the
temperature and humidities than the CAP-coated pellets (Product EE), which had
HPMC as a subcoat. The HPMC-coated pellets (Product P) could freely flow when the
relative humidity did not exceed 60 % r.h.. Only at the low temperature of 25 °C the high
relative humidity of 80 % r.h. still allowed the Product P to flow and did not stick
together. However, the CAP-coated pellets (Product EE) can tolerate a high
temperature up to 50 °C but the relative humidity should not exceed 30 % r.h. It is
obvious that if pellets contained more layers e.g. nicotinamide, subcoat, and CAP then
they would be more sensible to the temperatures and humidities compared to the
placebo pellets only coated with a thin layer of HPMC.

Results and discussion 207
Moreover, it was also found that Product EE stuck together after 7 days of storage when
the temperature was above 45 °C and the relative humidities were higher than 70 % r.h.
At the highest stress condition of 50 °C and 80 % r.h., the CAP-coated pellets and
HPMC as a subcoat (Product EE) liquefied. This means, if an accelerated chemical
degradation test should be performed with CAP-coated pellets the temperature should
neither exceed 40 °C nor the relative humidity the limit of 60 %. In this range of
temperatures and humidities, the physical property of the CAP-film was still acceptable
and the chemical degration of the coated pellets may then be observed and not the
physical damage.
3.2.9 Discussion of results of related coating experiments in the literature
HPMC
It was reported that film coating from HPMC has become popular because of its
solubility in water, stability in presence of heat, light, air and mositure and ability to coat
using a fully aqueous system. A transparent, tough, flexible and nontacky film can be
formed from an organic or aqueous solution of HPMC. The HPMC film can be dissolved
readily in the gastrointestinal tract at 37 °C. When granules or beads coating is carried
out it was important to prevent adhesion of them during coating. Therefore it is
recommended that the low viscosity coating solution is more effective. Thus the 3 cps
type of HPMC is most suitable. Generally the coating quantity of 3 - 4 % w/w was
sufficient for the masking effect. It was reported that the water vapor permeability of
HPMC films tended to decrease as the viscosity of HPMC solution was decreased. For
example; it was reported that if HPMC of low viscosity (e.g. 3 cps) was used both the
tensile strength and elongation decreased. These properties would create a cracking of
the coating product. The possible optimization to receive the acceptable mechanical
properties and water-vapor permeability was to blend the low and high viscosity grades
of HPMC together <106,107>.
It was reported that the uniform wetting of cores with coating solution and good
adhesion between a coating film and the core surface are desirable properties in a film
coating process. The wettability of cores can be predicted by using contact angle
measurement. Lehtola, Heinämäki, Nikupaavo and Yliruusi <89> have studied the
208 Results and discussion
adhesion between aqueous based HPMC films and tablet surface. They showed that
the contact angle between aqueous – based HPMC solutions and the tablet surface
increased with increasing compression pressure because the roughness of the tablets
was decreased. The contact angle also increased with increasing concentration of
magnesium stearate in the tablet formulation. The tablet containing microcrystalline
cellulose had the highest contact angle (up to 80 °) to aqueous – based HPMC solution
compared to lactose and a combination of lactose and cellulose as an excipient. The
adhesion of HPMC-film to the cores surface was influenced by the composition, the
polarity and roughness of the cores. The addition of a hydrophobic lubricant such as
magnesium stearate was found to decrease the adhesion. It is mentioned that the
adhesion of a film to tablet-core is due to the formation of hydrogen bonds between the
polar groups of the film former and the tablet-core constituent. Both HPMC and
microcrystalline cellulose (MCC) contain hydroxyl groups and therefore can form strong
bonding which results in a high adhesion between HPMC film and tablets containing
MCC. The tablets coated with aqueous based HPMC solution had a higher mechanical
strength than those without coats of three excipients (MCC, lactose, Cellactose) used.
The increase of mechanical strength may be due to an action as a padding material and
also as a filler to irregularities on the surface. It is expected that the film adhesion to the
tablet-surface increases in accordance with a decrease in the contact angle because
the solution can spread more readily on the tablet-surface. In this recent study they
have found that the adhesion between tablet-cores and aqueous based HPMC film
increased with higher compression pressure which gave an increasing smoothness of
the tablet-surface. The increasing of contact area between the aqueous based HPMC
solution, with a relatively high viscosity of 218 mPas, and the tablet surface is the
reason for higher adhesion values.
Heinämäki, Lehtola, Nikupaavo and Yliruusi <71> have studied the mechanical and
moisture permeability properties of aqueous based HPMC coating systems plasticized
with polyethylene glycol. Different types of PEGs (400, 1500 and 4000) were studied
with HPMC films prepared by using a pneumatic spraying technique. They have found
that over the range of concentrations tested (0 – 30 %) the moisture permeability of the
films decreased slightly as compared to unplasticized control films with increasing
molecular weight of the PEG-plasticizer. The mechanical strength of the films was
shown to be more dependent on the concentration incorporated in the coating

Results and discussion 209
formulations than on the molecular weight of the PEGs, while the ductility of the films
was mainly dependent on the molecular weight of the PEGs. The aqueous-based
HPMC free films plasticized with PEG 400 had the higher weight increase after storage
for about 5 days which means that they have higher moisture permeability compared to
HPMC free films plasticized with PEG 1500 and PEG 4000. This appearance may be
explained by a less enhanced chain mobility and smaller diffusion pathways of the
higher molecular weight plasticizers resulting in a lower diffusion rate in the film matrix.
It was discussed that the unplasticized aqueous HPMC films were brittle and hard. The
addition of a plastcizier at the lowest concentration of 10 % resulted in relatively hard
and strong films with moderate elongation especially when lower molecular weight
plasticizers (PEG 400 or 1500) were used <71>.
HPMC was not only used as a moisture barrier coat but also as a subcoat to hinder the
interaction between a drug and an enteric polymer. For example; Bengtsson and
Loevgren <17> have developed the oral pharmaceutical formulation containing a
magnesium salt of omeprazole. They used a formulation containing HPMC as a subcoat
before enteric coating with methacrylic acid polymer.
CAP films from aqueous dispersions
Some publications reported about the enteric coating by using of CAP and different
plasticizer. The physico-chemical properties of CAP such as solubility, Tg and the
content of free acids were mentioned in some literatures <15,166,155,83>. Details were
discussed in 3.1.
Heinämäki, et al <70> studied the permeability and mechanical properties of free films
prepared from the ammoniated aqueous or organic-solvent based system containing
CAP. The ammoniated aqueous coating solutions contained CAP, ammonium
hydroxide, magnesium carbonate, triacetin and water. The organic solvent systems
contained CAP, triacetin, acetone and water. These two solutions were used to
prepared free films by pouring the solution into glass petridishes. They showed that
enteric films prepared from the organic-solvent based solutions had a lower permeability
to basic drug (caffeine) and hydronium ions compared to films prepared from
ammoniated aqueous based solutions. The ammoniated aqueous enteric films were

210 Results and discussion
reported to be weaker and more brittle than corresponding films prepared from organic-
based systems.
Raffin, Dura and Jacob <147> found that films prepared from the aqueous dispersion of
Aquateric were more permeable than those prepared from the organic solutions.
Obara and McGinity <116,117> have studied the porperties of free films prepared from
aqueous dispersions of CAP by a spray method and a cast method. They found that the
casting of a CAP dispersion resulted in transparent films. On the other hand poor film
formation was observed with the spraying method. A powdered aggregate was obtained
even though the surface temperature was maintained higher than the MFFT. The
experimental conditions may have provoked rapid drying and prevented the
coalescence of latex particles. Satisfactory CAP films were only formed when using a
high spraying rate with slow postdrying to provide sufficient moisture content. The
moisture content in the coating chamber can be increased by using higher spraying
rates or diluting the dispersion in order to have more water at the same spraying rate so
that a higher relative humidity can be formed. However, the spraying rate cannot be
increased unlimitedly because a too high spraying rate may cause overwetting in some
part of a product bed. A compromise should be found between sufficient moisture to
allow a better coalescence and a good evaporation of water to dry the coated product
by adjusting to a suitable spraying rate. In conclusion, Obara and Mc Ginity suggusted
that TEC would be an ideal plasticizer for Aquateric based on the data of MFFT which
can form clear films at lower temperatures than with DEP or DBS. Apart from this the
water soluble plasticizer can well distribute into the polymeric dispersion and therefore
can rapidly reach the equilibrium. The water insoluble such as DEP or DBS were often
emulsified into the dispersion and the equilibrium time can sometimes be quite longer.
Scheiffele, Kolter and Schepky <164> have studied different products (free films and
coated tablets) prepared from Aquateric pseudolatex. The aqueous dispersion of
unpigmented Aquateric composed of Aquateric powder, triacetin (43.3 % to CAP),
Tween 80, and water. The aqueous dispersion of pigmented Aquateric composed of
Aquateric powder, colour, titanium dioxide, triacetin, Tween 80, and water. The coating
apparatus Accela Cota 24 inch was used to coat the caffeine tablets. The coating of
tablets with Aquateric dispersion was performed by using air inlet temperature of 78 °C,

Results and discussion 211
product temperature of 32 - 33 °C, spraying rate was 60 g/min and postdrying at 60 °C
for 60 min. The resistance to gastric juice was reached at a coating amount of
11 mg/cm2 for Aquateric. Irregularities were recognized in the films obtained from
Aquateric. The MFFT of Aquateric dispersion without pigment but containing triacetin
(43 % w/w to CAP) was less than 52 °C, and the value of MFFT of this dispersion with
pigment (Sicovit and titanium dioxide each 3.4 % w/w to CAP) was 36 °C. The MFFT of
the liquid preparation was considerably reduced by the addition of pigments. The Tg of
unpigmented Aquateric was 48 °C and after adding pigments the Tg was reduced to
56 °C. In the test for coagulation under shear and heat it could be seen that the
dispersion of Aquateric did not cause any coagulation. The particle size distribution of
the unpigmented dispersion of Aquateric was 20 µm. It was reported that the water
vapor permeability and proton permeability of free films from Aquateric was high. This
may come from the high mean particle size of these polymers. It was found that the
weight of enteric-coated tablets especially tablets coated with Aquateric was increased
up to 25 % during the resistance tests in artificial gastric fluid after 2 h at the coating
level of 8 mg/cm2. This may be due to the swelling of the films. After increasing the
coating amount of Aquateric to 11 mg/cm2 the weight increase of the coated tablets was
reduced to about 22 % after 2 h. It was mentioned that tablets coated with Aquateric
were not resistent to 0.1 N HCl until the thickness reached 8 mg/cm2. The resistance to
artificial gastric fluid of tablets coated with the aqueous dispersion of Aqoat-MF was
higher than that of Aquateric.
Chang <31> has studied the rheological and enteric properties among organic
solutions, ammonium salt aqueous solutions, and latex systems of some enteric
polymers. The organic solution coating formulation composed of 88.2 g CAP, 13.2 g
DEP, 441 g isopropyl alcohol and 441 g acetone. The neutralized solution coating
formulation composed the same amount of CAP and DEP but instead of organic
solvents 16.8 g of ammonia hydroxide and 882 g of water were used as solvent. The
pseudolatex coating formulation composed of 88.2 Aquateric, 22.1 g DEP, 2.7 g Tween
80 and 640 g water. The lab-scale fluidized bed coating apparatus- Uniglatt was used to
produce the enteric coated pellets. Spherical theophylline pellets, which were
manufactured by slurry layering onto sucrose seeds in a fluidized bed, were chosen as
model core substrates for this purpose. After the coating process the pellets were dried
in the coating chamber for another 15 min at the same temperature and air flow. The

212 Results and discussion
coating conditions were set so that the inlet air temperatures for the organic, ammonium
salt and aqueous systems were 50 °C, 60 °C and 60 °C, the spraying rates were 14.7,
10.1 and 12.7 g/min, respectively. It was found that because of the larger surface area
of the pelletized dosage forms a relatively high coating weight is needed to impart
enteric properties. Consequently a prolonged batch cycle time may result. To built up
film thickness in a reasonable time a coating system having a high polymer content
must be used. The concentration of polymer is often limited by solution viscosity. As
viscosity increases, there is an increasing strain on the pumping unit, increasing
difficulty in atomization, decreasing spreadability of the coating solution, increasing
tackiness during coat formation and increasing possibility of substrate agglomeration.
The viscosity-concentration relationships among the enteric materials in organic solvent
solution, in ammonium salt solution and in pseudolatex form were presented. As
expected, the viscosity of the polymer solution or dispersion increased with the polymer
concentration. The solutions of ammonium salts of the enteric materials tested exhibited
markedly higher viscosity than the respective enteric polymer in organic solutions did.
For example the viscosity of the 15 % w/w CAP organic solution was about 250 cP
whereas the viscosity of the ammonium solution at the same concentration was about
1800 cP. As the carboxyl groups on the enteric polymers become ionized with the aid of
ammonia water, the polymer chains are extended due to mutual charge repulsion and
the viscosity increased. This charge interaction may be one of the reasons for the
marked difference between the viscosity of these two formulations. The viscosity of the
15 % w/w aqueous dispersion of Aquateric was very low i.e. about 60 cP. It is difficult to
use a spray solution having a viscosity higher than approximately 200 cP to coat pellets
in a fluidized bed apparatus. The use of ammonium salts is inferior to the use of organic
solution or pseudolatex systems when viscosity is considered. However, the viscosity of
11.3 % CAP ammonium salt solution was about 200 cP and therefore it can be used as
a coating formulation. To investigate the enteric quality of the coatings, dissolution
testing was performed in simulated gastric fluid without enzyme at pH 1.2 for 4 h. The
rotating-paddle method with a stationary basket was used. Pellets were placed into this
basket which was positioned closely to the paddle which rotated at 100 rpm. The result
showed that films prepared from CAP organic solution and ammonium solution had an
good protection from gastric juice. The release of theophylline was lower than 5 % over
4 h. Surprisingly the Aquateric film gave no gastric-fluid resistance. The release of
thephylline arrived 100 % within 1 h. The substantial quantities of Pluronic F-68

Results and discussion 213
presented in Aquateric may have an adverse effect on the entric properties. The surface
structure performed by using SEM showed the crater-like texture of pellets coated with
a neutralized CAP formulation. The aqueous based Aquateric showed a rough and
wrinkle surface which indicated the incomplete coalescence <31>. However, another
report concluded that Aquateric provided enteric performance was similar to the organic
systems <65>.
Stability of products coated with CAP
Thoma and Kräutle <187> have studied the influence of pancreatin on the stability of
gastroresistant coatings. They have found that after storage period of 12 months the
pancreatin tablets with a CAP-coat no longer disintegrate within 60 min as stipulated in
the Pharmacopoeia. The disintegration time of tablets coated with Aquateric kept
constant at about 10 min after storage at 25 °C for up to 12 months. The disintegration
time was increased up to 30 min after storage at 35 °C for 12 months and if the tablets
contained barrier coat the disintegration time was about 15 - 20 min after 12 months.
The increasing of the disintegration time was mentioned to depend on the decreasing of
the solubility of the polymer e.g. CAP which was hydrolysed after long-term storage. It
was mentioned that a stable coat cannot be produced by Aquateric in a fluidized bed
apparatus. Aquateric caused the problem of stability already after storage at the room
temperature.
Thoma and Bechtold <185> studied the influence of aqueous coatings on the stability of
enteric coated pellets and tablets. Pancreatin pellets and tablets containing riboflavine
were coated with various aqueous and organic enteric polymers such as CAP,
HPMCAS, HP, Eudragit L, etc. The stability after storage was comparatively
investigated. They reported that a higher amount of coating materials were needed to
achieve gastro-resistance when using aqueous coating compared to organic
formulations. The disintegration time of CAP-coated tablets at a storage of 40 °C after
6 months increased to more than 60 min which may be due to the hydrolysis of the
phthalic ester groups and formation of insoluble cellulose acetate.
Heckenmüller <69> has compared the differences in the test methods for enteric coated
dosage forms in many Pharmacopoiea such as USP, BP, DAB, Eur.Ph, etc. He found

214 Results and discussion
that there were differences for example; test media, the dimension of the test apparatus,
temperature of test media, mechanical stress to the dosage form and the analysis of the
outcome data. Tests of the disintegration and the resistance against gastric fluid were
compared. He tried to find out the suitable guideline based on the different
Pharmacopoeia for use in the technological development, quality control and stability
test of enteric dosage form. The comparison between data from in-vitro and in-vivo test
was carried out by applying the particular model dosage form containing an indicator for
the resistance and disintegration test. The stability of enteric dosage forms was
performed by observing the disintegration and resistance test. The temperatures used
were 20 and 40 °C for a period of up to 2 years. Many marketed enteric dosage forms
lost their acid resistance and disintegration properties after storage at 20°C after 1 year.
Many products prepared by using CAP showed problems of acid resistance and
disintegration properties. The indicator used for the in-vitro and in-vivo acid resistance
test is composed of a resin from chinin hydrochloride and Amberlite IRC 50. It is a weak
acid-cationic-change based on polyacrylate. It is very sensitive to acid media. This
indicator can be well determined in the urine after in-vivo test. The indicator used for the
in-vitro and in-vivo disintegration test was riboflavin-5-phosphate because the resorption
of this drug was depending on the location of the dissolution. This drug can be absorbed
only at the upper part of the intestinal <69>.
3.2.10 Present conclusions
In conclusion, many works have reported about the problematic of coated dosage form
prepared from dispersions containing CAP. In this present work, HPMC can be
successfully used as a subcoat and it can hinder the interacton between a basic drug
and the outer acid polymer. However, HPMC causes a high swelling which may have an
additional effect on a breakage of the CAP-coated pellets.
The film quality of the outer layer prepared from Aquacoat CPD and different
plasticizers was ranged as follows; TEC gave the best film quality compared to DEP
and DBS. DEP was a better plasticizer than DBS. However, the CAP-coated pellets
containing nicotinamide and HPMC as a subcoat were not resistant to 0.1 N HCl up to
2 h.

Results and discussion 215
3.3 Pellets with nicotinamide and EC as a subcoat a) Placebo: HPMC pellets
As mentioned before, the seal coat with HPMC can hinder the dissolution of core
material at the surface because it takes a shorter time to coat all the surfaces with
HPMC than to layer them with nicotinamide and HPMC as a binder. The HPMC coated
pellets (Product Pp) were achieved from the combination of a formulation R1 and a
process number X7, as demonstrated in the Table 2.27.
b) Nicotinamide loaded pellets: Nico pellets
The Nico pellets (Product Aa) were achieved from the combination of a formulation R3
and a process number X8, as demonstrated in the Table 2.27.
c) EC as subcoat: EC-Nico pellets
The EC-Nico pellets have a pink colour as a marker was used. These pellets (Product
Bb to Ee) were achieved from the combination of a formulation R5 and a process
number X10, as demonstrated in the Table 2.27.
d) Enteric coated pellets: CAP-EC-Nico pellets
The CAP-EC-Nico pellets still have a pink colour caused by the marker. These pellets
(Product Ff to Kk) were achieved from different combinations of a formulation and a
process number, as demonstrated in the Table 2.27.

216 Results and discussion
3.3.1 Film quality, diameter and weight of pellets
The physical properties of raw materials used for this process and of the finished
products are shown in Table 3.8. The mean diameter and standard deviation of the raw
material (sugar spheres as sieve fraction 800-1000 µm) by image analysis were 970 ±
37 µm. The thickness of the HPMC layer (HPMC pellets) as measured from SEM was
about 7 ± 2 µm. The mean diameter of these pellets measured by an image analyser
was 970 ± 40 µm. The comparison between the raw material and HPMC pellets shows
that there is no significant difference between these two products. Consequently, the
coating process with HPMC was carried out well and homogeneously coated pellets
resulted.
The mean weight of one HPMC pellet (Product Pp) was 0.65 ± 0.01 mg, which was
lower than that of sugar spheres. This may be due to dissolution of the sugar from the
surfaces of the spheres as mentioned before. One Nico pellet has a mean weight of
0.80 ± 0.01 mg and a mean diameter of 990 ± 36 µm. The thickness of the nicotinamide
layer of Product Aa was 20 ± 5 µm and the weight gain from nicotinamide and HPMC
was 9.5 % w/w.
The subcoat from EC has been achieved in four different thicknesses; i.e. 19 ± 5 µm,
48 ± 6, 80 ± 4, 160 ± 10 µm with amounts of EC of 11.5, 29, 48 and 97 % w/w
respectively. The SEM photograph in Figure 3.22a shows the thickness of the EC layer
of Product Jj and that the layer was homogeneous. The mean weight and the mean
diameter of one pellet compared between cores (Product Aa) and EC-Nico pellets
(Product Bb to Ee) allowed to calculate the amounts of EC-polymer coated per pellet,
namely from 10 to 88 mg cm –2 .
Physical properties of CAP coated pellets are also stated in Table 3.8. Product Ff shows
the layer of CAP and DEP with cracks distributed around the surfaces with a length of
about 5-10 µm (Figure 3.22b). This may be due to the high drying rate so that the CAP
particles have not enough time to fuse together as mentioned before. There is no
difference between the CAP film layer from Aquateric (Product Gg) or Aquacoat CPD
(Product Ff) as judged from physical porperties as mentioned before. The SEM
photograph of the cross-section of Product Hh shows the inhomogeneous layer of CAP
and DBS and that many particles did not melt together (Figure 3.23a). This may be due
to the distribution of DBS. The best enteric layer from CAP can be achieved from TEC
as a plasticizer. The whole surface of cores (Product Ee) was well covered by the CAP

Results and discussion 217
layer, as in the Figure 3.23b. A cross section of the CAP layer (Product Jj) shows an
almost homogeneous film structure with cracks dispersed in the CAP-layer, which may
be due to the sample preparation for SEM study but not due to the coating process
(Figure 3.24a). The surface of these pellets shows also small cracks of about 5 - 7 µm
(Figure 3.24b). The white particles of about 1 - 2 µm on the surface of CAP-EC-Nico
pellets are Aerosil particles, added to hinder the sticking of pellets during storage.
The mean weight of one CAP-EC-Nico pellet (Product Kk) from Product Cc as cores
was 1.37 ± 0.03 mg while the mean diameter of these pellets was 1245 ± 46 µm at the
coating amount of 39 mg cm –2. However, the mean weight of one CAP-EC-Nico pellet
(Product Jj) from Product Ee as cores was increased up to 2.15 ± 0.03 mg while the
mean diameter of one pellet was 1455 ± 50 µm at the coating amount of 50 mg cm –2.
In general, the standard deviations of the diameter of all products in Table 3.8 have a
range of 35 to 61 µm. The Product Hh has the highest standard deviation, which
resulted from CAP and DBS. This may be due to the highly porous structure of the CAP
film layer which will cause a high friability during a coating process which then results in
the thickness variation of the finished product.

218 Results and discussion

Results and discussion 219
Figure 3.22: SEM pictures of enteric coated pellets;
a) the cross-section of a pellet coated with CAP and TEC (Product Jj),
magnification 607x; b) the surface of a pellet coated with CAP and DEP
(Product Ff or Gg), magnification 1,540x.
a
b

220 Results and discussion
Figure 3.23: SEM pictures of enteric coated pellets;
a) the cross-section of a pellet coated with CAP and DBS (Product Hh),
magnification 400x; b) the cross-section of a pellet coated with CAP and
TEC (Product Jj), magnification 101x.
a
b

Results and discussion 221
Figure 3.24: SEM pictures of enteric coated pellets with CAP and TEC;
a) the cross-section of a CAP-EC-Nico pellet (Product Jj), magnification
1,700x; b) the surface of a CAP-EC-Nico pellet (Product Jj or Kk),
magnification 10,100x.
a
b

222 Results and discussion
3.3.2 Swelling
The swelling in 0.1 N HCl of EC-Nico pellets was investigated with Product Cc and
Product Ee. These pellets almost did not swell in the acid medium. The swelling of
0.4 % - 0.5 % as shown in the Table 3.9 was very small. The enteric coated pellets
(Product Ff, Jj and Kk) also had the same small swelling as their cores (EC-Nico
pellets). This small value may be due to the resistance to the acid medium of the EC
layer, which is not soluble in this medium.
Product D1 ± SD D2 ± SD ∆D ± SD Swelling
(pixel) (%)
Cc 200 ± 1 201 ± 2 1 ± 1 0.5
Ee 231 ± 1 232 ± 2 1 ± 1 0.4
Ff 240 ± 2 241 ± 2 1 ± 1 0.4
Jj 252 ± 2 253 ± 1 1 ± 1 0.4
Kk 220 ± 2 221 ± 2 1 ± 1 0.5
Table 3.9: Swelling property of different products in 0.1 N HCl, 22 °C;
D1: diameter before swelling, D2: diameter after 2 h,
Cc and Ee: EC-Nico pellets,
Ff: CAP-EC-Nico pellets (CAP+DEP),
Jj and Kk: CAP-EC-Nico pellets (CAP+TEC).
3.3.3 Content of nicotinamide in one pellet
The content of nicotinamide inside one pellet of different products was varied. Product
Aa or Nico pellet without furthur coatings contained 8.9 ± 0.2 % w/w of nicotinamide
based on total weight of one pellet. One pellet after coating with the subcoat EC
(Product Cc) contained 7.8 ± 0.4 % w/w of nicotinamide.

Results and discussion 223
3.3.4 Release of nicotinamide from coated pellets
The cumulative percentage of nicotinamide release during the first five minutes from two
types of EC-Nico pellets (Product Cc and Ee) was 1.6 and 1.5 % (Table 3.8). This
means the EC layer can control the release of nicotinamide. The dissolution profiles of
different products containing nicotinamide can be seen in Figure 3.25. The release of
nicotinamide from Product Cc in buffer was not significantly different from that in HCl
(data not shown). The release of nicotinamide from Product Cc was higher than that
from the Product Ee over a time period of 180 min. However, even after 180 min the
cumulative percentage of release of these two products was not more than 50 %.
The cumulative percentage of nicotinamide release surprisingly increased after coating
with CAP. More than 50 % of nicotinamide were released within the first five minutes at
which the enteric layers consisted of CAP and DEP or DBS. This may be due to the
affect of an enteric layer coated above EC layers. The coating conditions may cause the
change of the EC structure during or after the coating with CAP layers. Almost the same
result was achieved with CAP and TEC but the release was smaller than from the other
two formulations. Only 6 % of nicotinamide of Product Jj was released within five
minutes and the cumulative content remained lower than 20 % over 180 min. However,
the release of nicotinamide within the first five minutes from Product Jj (~ 6.1 %) was
also higher than from its cores (~ 1.5 %). Product Kk also released higher nicotinamide
in the first five minutes (~ 24.4 %) compared to its cores (~ 1.6 %). This result may also
depend on the change of the EC structure during or after an enteric coating process.

224 Results and discussion
Figure 3.25: Dissolution profiles of differently coated pellets containing nicotinamide
in 0.1 N HCl at 37 °C without (Products Cc and Ee) and with enteric
coats containing different plasticizers (Products Ff to Jj) and Product Ee
as cores;
Ff: CAP with DEP at a coating amount of 13 mg cm-2; Hh: CAP with
DBS at a coating amount of 25 mg cm-2; Jj: CAP with TEC at a coating
amount of 50 mg cm-2; Kk: CAP with TEC at a coating amount of 39 mg
cm-2 and Product Cc as cores.
3.3.5 Optical appearance after the release study
The optical appearance of EC-Nico pellets with (Product Ff, Kk) and without CAP layer
(Product Cc and Ee) after contact with the acidic dissolution medium or buffer pH 6.8
was observed under a light microscope (Figure 3.26 and 3.28). It was found that
Product Ee still had the intact round structure after 120 min in both media. This means
only the diffusion of the drug was the cause for the release and not the erosion of the
outer polymer structure. On the other hand, the outer CAP layer of Product Ff was
broken and changed from the original clear film into an opaque film after exposure to
0.1 N HCl for 30 min. As expected, the CAP layer in buffer of pH 6.8 seemed to be
completely dissolved and only the EC layer was still intact as seen in Figure 3.27b.
0
20
40
60
80
100
0 15 30 45 60 75 90 105 120 135 150 165 180
Time (min)
Nic
otin
amid
e re
leas
ed (%
)
Cc Ee Ff Hh Jj Kk

Results and discussion 225
Product Cc in the buffer also showed the intact EC film layer. The substances inside the
core were completely dissolved and diffused out of the core. Product Kk, with Product
Cc as cores, was broken after 120 min in HCl.
3.3.6 Content of free phthalic acid in coated pellets
The high performance liquid chromatogram of the standard mixture (Figure 2.19, part
2.2.15) showed that the two peaks of nicotinamide and free phthalic acid were well
separated. The retention time of nicotinamide (I) was 4.4 min and of free phthalic acid
(II) was 10.8 min. This means the selected method was suitable for detecting the
amount of free phthalic acid in the dosage form containing nicotinamide.
The CAP coated pellets (Product Ff) were used as a sample. The peak of free phthalic
acid can be clearly separated from the peak of a high amount of nicotinamide (data not
shown). Results show that the amount of free phthalic acid was 3.98 ± 0.06 % w/w,
calculated from the standard curve using the peak area. This value of free phthalic acid
was not higher than the limit of 6 % w/w in the U.S. Pharmacopeia XXIII <28> but higher
than the limit of USP XXIV <26>, BP 1993 <27> and EP 2000 <30>, which was
3 % w/w. The value of free phthalic acid of polymer coated on the pellets was higher
than that of the received polymer raw material „Aquacoat CPD“. The specification of the
amount of free phthalic in different charges of polymer used showed the value between
0.4 - 0.7 % w/w. The high value of phthalic acid in coated pellets may be due to the
hydrolysis of CAP during the storage or the coating process and also from the phthalyl
groups in the plasticizer „DEP“, which can give free phthalic acid as well. Therefore it
was not recommended to use DEP as a plasticizer when an indicator as free phthalic
acid was selected to follow up the stability of CAP. Other plasticizers may be used
instead of DEP, for examples DBS or TEC because they do not contain phthalyl groups.
Eshra <53> mentioned that the extraction in water alone was less efficient than in the
mixture of methanol and water and that the extraction required at least 30 min to reach
equilibrium. However, he found that the measurement did not only show high recoveries
(~ 100 %) but also large standard deviations (~ 30 % for phthalic and ~10 % for acetic
acid) at an extraction time of 30 min.

226 Results and discussion
Roxin, Karlsson and Singh <155> have used the new method to extract the free acid
from the CAP powder sample. They weighed an exact amount of CAP which was then
suspended in CO2-free water and shaken for various lengths of time, ranging from 10 to
120 min at room temperature. Samples were then centrifuged and filtered prior to
analysis by the chromatographic method. The results showed that equilibrium was not
reached at 120 min in all cases. Therefore they developed a new extraction method
based on a CAP precipitation. An exact weight of CAP was dissolved in THF by stirring
and water was added dropwise with vigorous stirring, allowing the polymer to precipitate
out. The samples were centrifuged and the supernatant filtered before the analysis by
chromatography. The results of the chromatographic analysis showed a high recovery
(~100 %) and lower standard deviations (1 % for phthalic acid and 10 % for acetic acid
at the quantification limit). The relative standard deviation of the process was 4.1 % for
phthalic acid and 4.4 % for acetic acid. The high performance liquid chromatographic
(HPLC) analysis of free acids was performed by using different HPLC-column and the
best results were obtained with a C18 column using 10 % methanol in 0.025 mM
phosphate buffer of pH 3 at 1 ml/min, injection volume 20 µl. The retention time for
acetic acid was 1.7 min, compared to 8.4 min for phthalic acid. Roxin, Karlsson and
Singh <155> also showed the amount of total acid content of about 1.5 % w/w in the
fresh CAP powder sample. 0.15 – 0.66 % was free acetic acid and 0.98 – 1.08 % was
free phthalic acid. When CAP powder samples were stored at various conditions the
free phthalic acid concentration rised while the acetic acid concentration fell below
detection levels. The absence of acetic acid in these samples may be explained by the
fact that acetic acid was volatile. The increase of water partial pressure, means
increasing in % r.h., at a constant temperature caused an increase in the phthalic acid
concentration. The higher temperatures at constant vapor pressure of water seemed to
result in lower phthalic acid content, although still much higher than in fresh material.
This can be explained on the basis of the adsorption isotherm for water. At higher
temperatures, the CAP powder absorbed less water (for the same water activity) and
therefore there was a lower level of hydrolysis, resulting in less free acid. Thus humidity
or moisture had a greater effect on the storage stability of CAP powder than
temperature did. These results recommend that both these factors must be
simultaneously taken into account when evaluating CAP film tablet coating or powder
stability data.

Results and discussion 227
Bodmeier and Chen <20> have determined the acidic degradation products such as
acetic, propionic, butyric, and phthalic acid in aqueous pseudolatexes of cellulosic
esters by a high performance liquid chromatography (HPLC). The pseudolatexes of
cellulose acetate, cellulose acetate butyrate, and cellulose acetate propinate were
prepared by a high pressure emulsification-solvent evaporation method. Cellulose
acetate phthalate (Aquateric) was redispersed in water prior to analysis to result in a
10 % w/v pseudolatex. The chromatographic method was developed by using the
isocratic, reversed-phase HPLC to quatify the organic acids: acetic, propionic, butyric
and phthalic acid, formed as a result of ester hydrolysis in pseudolatexs of cellulosic
esters. Peaks of the three aliphatic acids with a mobile phase of 0.025 M phosphate
buffer:methanol (80+20 % v/v, pH 3) were well separated. The retention times for acetic
acid is 2.6 min whereas the retention time for phthalic acid is about 8 - 9 min. The
retention time of phthalic acid in pure phosphate buffer was larger than 60 min. The
peak heights increased and the peaks became sharper by increasing methanol
concentration. A methanol concentration of 20 % v/v was selected because of only
minor reductions in retention times and increased column pressures at higher methanol
concentrations. The samples had to be acidified with phosphoric acid to a pH < 3 so
that only the unionized form will be retained on the stationary phase. In addition to the
sample pH, the mobile phase was buffered to pH 3, which suppressed the ionization of
the acids. The pKa values of acetic acid are 4.76 and those of o-phthalic acid are 2.95
and 5.41. More than 98 % of the aliphatic acids were in the unionized form at a pH of 3.
The method developed in this present study shows that the results were comparable to
the recent data in the literature <155,20>. This HPLC-method was not complicated to be
used in determination of free phthalic acid in the CAP-coated pellets although a high
amount of water-soluble drug as nicotinamide was present. Therefore if the stability of
the CAP-coated pellets should be monitored by using free phthalic acid as an indicator,
the HPLC-method seems to be suitable.

228 Results and discussion
Figure 3.26: Pellets coated with a subcoat from EC (Product Ee) after exposure to
different media at 37 °C, for 120 min;
a) 0.1 N HCl; b) phosphate buffer pH 6.8.
a
b

Results and discussion 229
Figure 3.27: Enteric coated pellets with CAP and DEP (Product Ff) after exposure to
different media at 37 °C;
a) 0.1 N HCl, for 30 min.; b) phosphate buffer pH 6.8, for 120 min.
a
b
230 Results and discussion
Figure 3.28: Coated pellets after exposure to different media at 37 °C for 120 min;
a) pellets coated with a subcoat from EC (Product Cc) after exposure to
phosphate buffer pH 6.8; b) enteric coated pellets with CAP and TEC
(Product Kk),still wet after exposure to 0.1 N HCl.
a
b

Results and discussion 231
3.3.7 Discussion
Ethyl cellulose was used in this work because of its nonionic and moisture barrier
properties. The subcoat prepared from EC was then compared to that one prepared
from HPMC.
Ethyl cellulose has been used as coating material for oral sustained release dosage
forms since a long time. However, if the thickness of EC layer was not too thick it can be
used as a moisture barrier. Aquacoat ECD-30, an aqueous ethyl cellulose dispersion, is
an alternative to respective organic solution. The film forming process of aqueous
polymer dispersions is different in comparison to organic solutions. Stable films are
formed after concentration of the aqueous dispersion, deformation of the latex particles
and interdiffusion of the polymer chains.
Obara and Mc Ginity <117> have investigated the influence of processing variables on
the properties of free films prepared from aqueous polymeric dispersions by a spray
technique. The mean tensile strength of free films from Aquacoat ECD, a high minimum
film formation temperature (MFFT) latex, was slightly higher at higher processing
temperature but this was not significant. The spraying rate did not alter the mechanical
properties of films prepared from this pseudolatex. Due to the high MFFT of about 30 °C
of the Aquacoat ECD and 23 % TEC dispersion, a significant influence of processing
temperature on film properties was anticipated. At a surface temperature of 30 °C, and
spray rate of 0.8 g/min many small cracks were evident in the films. At the surface
temperature of 40 °C and 50 °C, intact films were obtained. The spray rates i.e. 1 g/min
and 2.5 g/min did not influence the properties of films prepared at 50 °C. This was
expected since the size of dispersed particles is similar to that of the Eudragit L
dispersions (about 0.2 µm). Obara and Mc Ginity suggusted that TEC would be an ideal
plasticizer for Aquacoat ECD based on the data of MFFT which can form clear films at
lower temperatures than with DEP or DBS. Apart from this the water soluble plasticizer
can well distribute into the polymeric dispersion and therefore can rapidly reach the
equilibrium. The water insoluble such as DEP or DBS were often emulsified into the
dispersion and the equilibrium time can sometimes be quite longer.

232 Results and discussion
In another work of Obara and Mc Ginity <116>, they have studied the porperties of free
films prepared from aqueous dispersions of EC by a spray method and a cast method.
The EC dispersion contained 24 % DBS. The surface appearance of EC films prepared
by the cast method was influenced by the concentration of the solid. An „orange peel“
was seen at the solid concentrations of less than 15 % w/w. An increase in the solid
concentration to 25 % improved the surface appearance of the film to a smoother one
but cracks were observed in some part of films. However, the spray method provided
uniform films without any cracks even at a solid concentration of 10 %. The MFFT of
this dispersion was approximately 30 °C. Therefore the brittle films especially from the
cast method may be due to the incomplete coalescence. The elongation of these films
was about 2 - 5 %, the elastic modulus was about 180 – 206 MPa.
In summary, EC films were weak in both the dry and wet state with low puncture
strength and elongation values. In contrast, acrylic-based polymeric films were stronger
and more flexible <21,67>.
EC is a nonionic polymer. Therefore the release of drug from the EC-coated products is
expected to be pH-independent. However, several studies with Aquacoat ECD-coated
beads showed a faster drug release in simulated intestinal fluid when compared to
simulated gastric fluid. It was mentioned that the faster drug release may be due to the
ionization of sodium lauryl sulfate (SLS) <21,67>. The release study of Aquacoat ECD-
coated beads containing chlorpheniramine maleate (CPM) confirmed the effect of the
surfactant. At the concentration of 6 % SLS the release of the drug in the buffer pH 7.4
was faster than that in 0.1 N HCl. The faster initial drug release may be an indication of
better wetting of beads in pH 7.4 buffer. SLS has a pKa of 1.9 and will be surface-active
only in the ionized state. SLS is approximately 10 % ionized in 0.1 N HCl and
completely ionized in pH 7.4 buffer. The wetting hypothesis was confirmed by
measuring the contact angles between pseudolatex cast EC films and these two
dissolution media. The contact angle of the surfactant-free EC films was the same in
both media. However, the contact angle decreased with increasing concentrations of
SLS in the film and was significantly lower on films wetted with pH 7.4 buffer than on the
films wetted with 0.1 N HCl. Cetyl alcohol which was used as a stabilizer for the
pseudolatex also had a pronounced effect on the drug release. The drug release
decreased with increasing concentration of the cosurfactant. The presence of cetyl
alcohol rendered the film coat more hydrophobic as indicated by an increased contact

Results and discussion 233
angle. The results clearly demonstrated that the pH-dependent drug release from
Aquacoat ECD-coated beads was caused by the presence of the nonionic surfactant
and not the polymer. The water-insoluble plasticizer existed in the aqueous phase
predominantly in the emulsified and not dissolved form. The recent report also showed
that the water-insoluble plasticzers (DBS) were not completely taken up by the colloidal
polymer particles within a 24 h period. After a week of mixing visible DBS droplets in
Aquacoat ECD were observed. However, another report showed that the uptake of DBS
was complete within 30 min irrespective of the amount used and the uptake rate was
faster with increasing solid content of pseudolatex or when smaller quantities of
plasticizer were incorporated. This may have important implications for the coating with
polymer dispersions when compared to organic polymer solutions in which the
plasticizer is completely dissolved. During coating in addition to the plasticized polymer
particles the emulsified plasticizer droplets will be sprayed onto the solid dosage forms.
This could result in an uneven plasticizer distribution within the film <21,67>.
A curing step is often recommended to accelerate the coalescence of the polymer
particles. During the curing step the coated products are subject to a heat treament
above the Tg of the polymer or about 10 °C above the MFFT. This is achieved either by
storing the coated products in an oven or through further fluidization in the heated
fluidized bed coater immediately after the completetion of the coating process. Higher
curing temperatures could cause excessive tackiness and agglomeration of the coated
products. The effect of curing was reported for example with chlorpheniramine maleate
beads coated with pseudolatex of EC. The cores were coated at 40 °C and thereafter
were treated with heat at 40 °C, 50 °C and 60 °C for 1 - 24 h. It was found that the drug
release in pH 7.4 buffer was strongly affected by the curing conditions. The release of
drug from uncured cores was more than 80 % after 2 h. The curing at 40 °C for 24 h
was insufficient but the curing at either 50 °C or 60 °C resulted in a significant reduction
in drug release (up to less than 25 % after 2 h). The curing effect also depends on the
amount of a plasticizer e.g. TEC. If the concentrations of a plasticizer were high enough
the curing step may not be necessary <21,67>.
Depending on the physicochemical properties of the drug and polymeric coatings curing
could influence the performance of the pseudolatex-coated dosage forms differently.
Whilst curing of the Aquacoat ECD-coated CPM beads produced a retarding effect in
the drug release the curing of ibuprofen beads coated with a comparable coating
system resulted in more complex drug release pattern. The release of ibuprofen in

234 Results and discussion
pH 7.4 buffer was initially rapid with ibuprofen beads cured at 50 °C for 15 min then the
release was decreased with increasing curing time up to 4 h. However, at the curing
time excess of 4 h the drug release increased again. It was mentioned that the initial
decrease in drug release (up to a curing period of 4 h) was due to the further
coalescence of the polymer particles in the EC film. The increase in drug release (curing
periods in excess of 4 h) could be explained with the migration of ibuprofen from bead
interior to the bead surface through the EC coating during the curing step. It was
mentioned that the different results of release may be due to the melting point of CPM
and ibuprofen. Ibuprofen has a much lower melting point (75 - 77 °C) than CPM (130 °C
- 135 °C). The drug-polymer affinity coupled with the drug’s low melting point could thus
serve as an explanation for the phenomenon of the drug migration. The diffusion of
quaifenesin, another low-melting point drug through the vapor phase across the
Aquacoat ECD coating during storage of the coated beads has also been reported.
Although the bed temperature was above the MFFT of the pseudolatex evaporation of
water during the coating process could have resulted in a cooling effect and might have
kept the temperature on the bead surface below the MFFT. The release of the water-
insoluble drug such as ibuprofen was reported to be primarily by solution/diffusion
through the hydrophobic polymer. On the other hand, CPM, the water-soluble drug, was
not released by a solution/diffusion mechanism from the beads because of its negligible
diffusible property. Moreover, CPM which was layered onto beads will exert the osmotic
pressures within coated dosage forms upon dissolution and these osmotic pressures
could cause the microrupturing of the wet state polymeric films especially the weak
polymeric membrane as Aquacoat ECD.
This present study shows that the subcoat from EC can well cover the surface of
pellets. Films resulting from EC and DBS as a plasticizer were homogeneuos and
therefore can well control the release of nicotinamide from the core. The maximum of
release of nicotinamide over 120 min was less than 30 % from EC coated pellets at
every thickness (20 - 160 µm). At the highest EC-thickness of 160 µm, the release could
be kept lower than 20 % over 180 min because of the properties of EC, as it was not
dissolved in 0.1 N HCl or phosphate buffer. Therefore EC cannot be used as a subcoat
without limitations. The controlled release property of EC depended on the thickness of
the film. If a fast release was required then only a thin film from EC should be used as a
subcoat. The EC coated pellets still had their round form after contact with acidic or

Results and discussion 235
buffer medium. This means only the diffusion of nicotinamide was responsible for the
release of the drug and not the erosion. Trials by using EC coated pellets at two
different EC-thicknesses were made. The results show that CAP-EC-Nico pellets with
two different thicknesses of EC subcoat were not gastric resistant over 2 h. The release
of nicotinamide was more than 10 %, which was the limit of the Pharmacopeia.
Surprisingly the release of nicotinamide from the pellets after coating with CAP was
higher than that from EC-Nico pellets without CAP layer. Enteric coated pellets with
CAP and DEP were broken after exposure to 0.1 N HCl for only 30 min inspite of a low
swelling of the EC coating. On the other hand the film from CAP and TEC was more
stable and the coated pellets did not break fast in the acidic medium.
The unsatisfying enteric property of CAP-coated product was due to the incomplete
coalescence of the CAP polymer as details mentioned in 3.1 - 3.2.

236 Results and discussion
3.4 Pellets with nicotinamide and a combination of EC and PVA (100 parts + 30 parts) as a subcoat
a) Placebo: HPMC pellets
The HPMC coated pellets (Product pP) were achieved from the combination of a
formulation R1 and a process number X7, as demonstrated in the Table 2.28.
b) Nicotinamide loaded pellets: Nico pellets
The Nico pellets (Product aA) were achieved from the combination of a formulation R3
and a process number X8, as demonstrated in the Table 2.28.
c) A combination of EC and PVA as a subcoat: E&P-Nico pellets
The E&P-Nico pellets have a green colour as a marker was used. These pellets
(Product bB to cC) were achieved from the combination of a R6 and a process number
X11, as demonstrated in the Table 2.28.
d) Enteric coated pellets: CAP-E&P-Nico pellets
The CAP-E&P-Nico pellets still have a green colour caused by the marker. These
pellets (Product dD to oO) were achieved from different combinations of a formulation
and a process number, as demonstrated in the Table 2.28.
3.4.1 Film quality, diameter and weight of pellets
The physical properties of raw materials used for this process and of the finished
products are shown in Table 3.10. The thickness of the HPMC layer (HPMC pellets) as
measured from SEM was about 10 ± 3 µm. The mean diameter of these pellets
measured by an image analyser was 980 ± 36 µm. The mean weight of one HPMC
pellet `Product pP´ was 0.67 ± 0.01 mg, which was lower than that of sugar spheres.
The reason for this was mentioned before. One Nico pellet had a mean weight of 0.78 ±
0.02 mg and a mean diameter of 1010 ± 35 µm. The thickness of the nicotinamide layer

Results and discussion 237
of `Product aA´ was about 23 ± 3 µm and the weight gain from nicotinamide and HPMC
was 11.0 % w/w. The subcoat from a combination of EC and PVA (E&P) has been
achieved in two different thicknesses; i.e. 66 ± 4 and 130 ± 8 µm with amounts of E&P
of 36 and 67 % w/w respectively. The SEM photograph in Figure 3.29a shows the
thickness of the E&P layer of `Product cC´ and that the layer was not homogeneous.
The polymer layers were separated from each other like multiple fiber layers. The mean
weight and the mean diameter of one pellet compared between cores (Product aA) and
E&P-Nico pellets (Product bB and cC) allowed to calculate the amounts of E&P-
polymer coated per pellet, namely from 37 to 76 mg cm –2 . The physical properties of
CAP-coated pellets are also stated in Table 3.10 Product dD showed the layer of CAP
and DEP with cracks distributed around the surfaces (the same as in the other parts 3.2
- 3.3). There was no difference between the CAP film layer from Aquateric (Product eE)
or Aquacoat CPD (Product dD) as mentioned before in the part 3.2. The CAP and DBS
film layer from Product fF showed the same result as mentioned before in the part 3.2.
The best enteric layer from CAP can be achieved from TEC as a plasticizer. A cross
section of the CAP and TEC layer (Product nN) showed an almost homogeneous film
structure (Figure 3.29b). However, the surface of these pellets showed also small
cracks (Figure 3.30a). In order to try to improve the elasticity of the film from CAP and
TEC, the polymer HPMC-AS was added to the combination of CAP and TEC, R14
(Table 2.22). The SEM photograph (Figure 3.30b) shows small cracks around the
surface of these coated pellets (Product oO). The whole surface of cores (Product cC)
was well covered by the film from CAP, TEC and HPMC-AS, to be seen in the Figure
3.31. Therefore there is no significant difference between these two formulations.
The mean weight of one CAP-E&P-Nico pellet (Product nN) from Product bB as cores
was 1.47 ± 0.02 mg while the mean diameter of these pellets was 1310 ± 40 µm at the
coating amount of 36 mg cm –2. The mean weight of one CAP-E&P-Nico pellet (Product
mM) and Product cC as cores was increased up to 2.25 ± 0.05 mg while the mean
diameter of one pellet was 1495 ± 45 µm at the coating amount of 63 mg cm –2.
Although the weight gain of the total batch for Product mM and Product nN was the
same, i.e. 45 % w/w, the coating amount calculated from the amount of polymer over
one square centimetre was different. This may be due to the fact that the Product nN
has smaller cores and consequently more surface area which needs more polymers to
achieve the same coating amount.

238 Results and discussion

Results and discussion 239
Figure 3.29: SEM pictures of coated pellets; a) the cross-section of E&P-Nico pellet
(Product cC), magnification 809x; b) the cross-section of a coated pellet
with CAP and TEC (Product nN), magnification 640x.
a
b

240 Results and discussion
Figure 3.30: SEM pictures of enteric coated pellets; a) the surface of a coated pellet
with CAP and TEC (Product gG to nN), magnification 1600x; b) the
surface of a coated pellet with CAP, HPMC-AS and TEC (Product oO),
magnification 1640x.
a
b
Results and discussion 241
Figure 3.31: SEM picture of the cross-section of an enteric coated pellet with CAP,
HPMC-AS and TEC (Product oO), magnification 168x.
3.4.2 Swelling
The swelling in 0.1 N HCl of E&P-Nico pellets was investigated with Product bB and
Product cC. These pellets have two different thicknesses. The swelling of pellets with a
higher thickness (Product cC) was 8 % as shown in Table 3.11. The enteric coated
pellets (Product dD, mM and nN) in the acid medium were broken after 30 min and
therefore the swelling cannot be measured.

242 Results and discussion
Product D1 ± SD D2 ± SD ∆D ± SD Swelling
(pixel) (%)
bB 211 ± 1 220 ± 3 9 ± 2 4
cC 230 ± 3 248 ± 5 19 ± 3 8
dD 237 ± 2 - - crack
mM 246 ± 2 - - crack
nN 228 ± 3 - - crack
Table 3.11: Swelling property of different products in 0.1 N HCl, 22 °C;
D1: diameter before swelling, D2: diameter after swelling,
bB and cC: E&P-Nico pellets,
dD: CAP-E&P-Nico pellets (CAP+DEP),
mM and nN: CAP-E&P-Nico pellets (CAP+TEC).
The high swelling property of some enteric polymer was reported by Thomas and
Bechtold <185>. The swelling of coated tablets was determined by exactly weighing
each tablet before and immediately after the 2 h testing for gastric resistance in 0.1 N
HCl. The weight gain equal to the water uptake was expressed as a percentage of the
initial weight. HPMCAS seems to be a very stable gastro-resistant aqueous coating that
underwent little swelling during the test for gastro-resistance and showed virtually no
changes in disintegration time during the storage. The coatings made from the CAP-
pseudolatex Aquateric or the ammonia-based CAP formulation showed marked swelling
in the resistance test and an increase in the disintegration time when stored at 40 °C.
Probably this can be attributed to the late film formation since film-coated tablets tended
to stick together during storage. However, the swelling of tablets coated with HPMCAS
was not significantly different after storage at 25 °C and 35 °C.
3.4.3 Content of nicotinamide in one pellet
The content of nicotinamide inside one pellet of different products was varied.
Product aA or Nico pellet without furthur coatings contained 8.9 ± 0.1 % w/w of
nicotinamide based on total weight of one pellet. One pellet after coating with a subcoat

Results and discussion 243
from the combination of EC and PVA (Product bB and cC) contained 8.5 ± 0.4 % w/w of
nicotinamide.
3.4.4 Release of nicotinamide from coated pellets
The cumulative percentage of nicotinamide released during the first five minutes from
two types of pellets coated with a subcoat from the combination of EC and PVA
(Product bB and cC) was 3.7 and 3.0 % (Table 3.10). After 60 min the release of
nicotinamide was more than 50 %. This means that the subcoat layer from a
combination of EC, PVA and DBS as a plasticizer can control the extent of release of
nicotinamide. The dissolution profiles of different products containing nicotinamide can
be seen in Figure 3.32.
The cumulative percentage of nicotinamide release unexpectedly increased after
coating with CAP. Within the first five minutes nicotinamide was released to more than
60 %, at which the enteric layer was prepared from CAP and DBS (Product fF) or CAP
and TEC at the lower coating amount (Products gG and hH). This may be due to an
affect of the enteric layer coated above the E&P layer. The coating conditions may
cause a change of the E&P structure during or after CAP coating, as mentioned before
in the part 3.3.4. At the higher amount of CAP and TEC the release of nicotinamide
became smaller (Products iI to nN). However, the release of nicotinamide was more
than 20 % after 120 min in 0.1 N HCl at the highest film thickness of 90 ± 5 µm
(Products kK and mM). CAP coated pellets with a thinner subcoat (Product nN) had
also high release of nicotinamide, more than 70 % after 120 min, therefore the smaller
% swelling from this subcoat was not really improving the gastric resistance property.
The combination of CAP, HPMC-AS and TEC (Product oO) gives no significant
difference in controlling the release of nicotinamide compared to the mixture of CAP and
TEC alone (Product iI), as shown in Table 3.10 or Figure 3.32. These results were in
accordance with the results from SEM.

244 Results and discussion
Figure 3.32: Dissolution profiles of differently coated pellets containing nicotinamide
in 0.1 N HCl at 37 °C without (bB and cC) and with enteric coats
containing different plasticizers (dD to mM) and Product cC as cores;
dD: CAP with DEP at a coating amount of 15 mg cm-2; fF: CAP with
DBS at a coating amount of 43 mg cm-2; gG to mM: CAP with TEC with
increasing thicknesses of enteric coat in mg cm-2; gG:7, hH:23, iI:27,
kK:64, mM:63; kK: production with intermediate drying phase; mM:
similar to kK but with cyclone instead of filters set; nN: similar to mM at
a coating amount of 36 mg cm-2 and Product bB as cores; oO: CAP and
HPMCAS (10o + 30 parts) with TEC at a coating amount of 18 mg cm-2
and Product cC as cores.
0
20
40
60
80
100
0 15 30 45 60 75 90 105 120 135 150 165 180 195
Time (min)
Nic
otin
amid
e re
leas
ed (%
)
bB cC dD fF gG hH iIkK mM nN oO

Results and discussion 245
3.4.5 Optical appearance after the release study
The optical appearance of E&P-Nico pellets without CAP layer (Product cC) after
contact with the acidic dissolution medium or buffer pH 6.8 after 120 min was observed
under a light microscope (Figure 3.33). It was found that Product cC still had an intact
outer layer with only small cracks in acidic medium, whereas the pellets were broken in
a buffer. This means that the release of nicotinamide from the coated pellets was
accelerated by the cracks or broken parts.
Pellets coated by using CAP and DEP (Product dD) or CAP and TEC (Product nN) were
broken after contact with 0.1 N HCl for 30 min (Figure 3.34). Only the outer CAP layer
was broken and changed from the original clear film into an opaque film.

246 Results and discussion
Figure 3.33: Pellets coated with a subcoat from EC and PVA (100 + 30 parts)
(Product cC) after exposure to different media at 37 °C for 120 min;
a) 0.1 N HCl; b) phosphate buffer pH 6.8.
a
b

Results and discussion 247
Figure 3.34: Enteric coated pellets after exposure to 0.1 N HCl, 37 °C for 30 min;
a) Pellets coated with CAP and DEP (Product dD); b) Pellets coated
with CAP and TEC (Product nN).
a
b

248 Results and discussion
3.4.6 Discussion of results with similar systems and comparison with present findings
Some publications reported about the coating by using a combination of EC and other
polymers.
Gilligan and Po <63> studied many factors that affected the drug release from EC
coated pellets. Dextromethorphan hydrobromide (DH) loaded beads were coated with
EC aqeuous dispersion containing 0 - 12 % w/w HPMC and 24 % w/w of total polymer
solids of triethyl citrate. The theoretical level of coating is 6.48 % w/w. These DH
impregnated seeds were coated using the Uniglatt Laboratory Unit. Coating conditions
were: an inlet temperature of 27 - 31 °C, coating mixtures were pumped to the atomiser
at a rate of 3 ml/min operating at a spray pressure of 20 psi. No post-drying was carried
out. The dissolution study of coated seeds was performed in buffer pH 6.9 with 1.0 M
constant ionic strength. The variation in the percentage increase is attributed to the
different nature of the plasticizers employed and the viscosity grade of EC. The increase
in the drug release rate was obtained by the amount of increased HPMC. The release
data in the present study were fitted to first-order kinetics. A comparison of electron
micrographs of pellets coated with an EC pseudolatex film with or without HPMC before
and after dissolution showed that after dissolution numerous pores and cracks were
present in the polymer film. By this observation they comment that the cracks were not
related to the presence of HPMC in the films or caused by the leaching of HPMC from
the film but rather to an incompletely formed polymer film coating. Approximately 80 %
of DH was released within 2 h from EC without HPMC. It seemed that incomplete film
formation could be responsible for the rapid drug release from the pellets. Therefore the
effect of storage and certain conditioning procedures on the in vitro release of DH from
EC-coated pellets were investigated. After the EC-coated pellets were stored for
4 months at room temperature, it was found that the rate of drug release from the
coated pellets before and after 4 months storage was a significant difference. The
decrease in release rate can be related to further gradual coalescence. The effect of
conditioning of coated pellets can be determined by conditioning pellets at 60 °C for
1 - 16 h after initial film formation. The release rate constants of pellets coated with EC
(with or without HPMC) were markedly different to the rate constant before conditioning.
That means the conditioning of coated pellets at 60 °C produced a decrease in the

Results and discussion 249
release rate of DH from pellets. This decrease is not due to drug loss but rather to the
effect of temperature on the film coating. The effect of pH on the rate of drug release
from EC coated pellets was also investigated. The pKa of DH was 9.12. Therefore at pH
of 6.9, 0.6 % of DH is in the unionised form and at pH 2.1 a negligible amount of DH is
in the unionised form. This difference in the percentage of the unionised form of DH
could explain the higer release rate constant at the higher pH value if the main transport
process is partitioning of the drug into the polymer structure as in case of the pellets
containing 0 % w/w HPMC. Another possible explanation for higher release rate
constant at higer pH value is due to the presence of sodium lauryl sulphate in the
aqueous dispersion formulation. Sodium lauryl sulphate has a pKa of 1.9 and it could
effect the partitioning of drug into the simulated gastrointestinal fluids by virtue of its
state of ionization under acidic or basic conditions, whereas pellets coated with EC
containing high HPMC (12 %) show no significant difference in the rate constant at two
pH. This may be due to HPMC that leached from the polymer film after contact with
medium and caused the formation of pores. The presence of pores and cracks in the
film ensures that diffusion of drug from the core to the surrounding sink medium occurs.
Frohoff-Hülsmann, et al. <59> have investigated the release mechanisms of
thoephylline pellets coated with an aqueous ethyl cellulose dispersion containing
plasticisers and HPMC as a water soluble pore former. The dispersion was prepared by
combining appropriate quantities of aqueous ethyl cellulose dispersion, plasticizer and
HPMC solution and then mixing with glass blade stirrer for 30 min before and after the
standing time of 23 h. The pore former HPMC was added as a solution of a miximum
concentration of 10 % to the aqueous dispersion. The percentage of plasticizers refers
to the film without HPMC. The maximum concentration was not higher than 20 % in
order to prevent sticking. The percentage of pore former refers to the entire film. The
coating of pellets was performed in a fluidized bed apparatus, equipped with a bottom-
spray nozzel. The bed temperature was adjusted to 10 °C above the MFFT, but to a
minimum of at least 40 °C. The coating dispersions were pumped with a flow rate of
1 - 2 g/min. The coated pellets were then dried in the same apparatus for 5 min at the
above mentioned temperature. The film coating consisting of ethyl cellulose and
plasticizer amounts to about 12 % of the weight of the diffusion pellets.
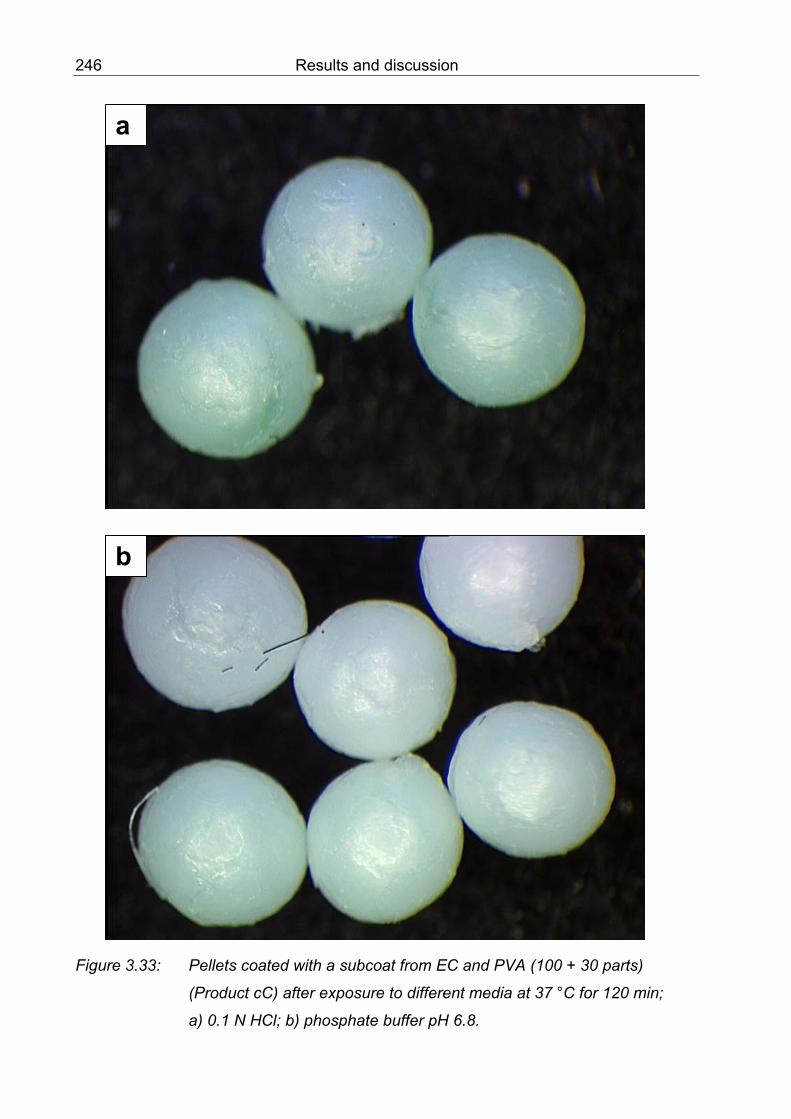
250 Results and discussion
The MFFT values decrease with increasing level of added plasticizers, with increasing
standing time of the aqueous plasticized polymer dispersion and in some cases with
increasing amount of pore former. The standing time is defined as the minimum time
period which is necessary for the plasticized aqueous polymer dispersion to reach a
constant MFFT value. The distribution of plasticizers between the aqueous and the
polymer phase is time dependent. Influence of the water solubility of plasticizers on the
standing time of plasticized EC dispersion was demonstrated. The water insoluble
plasticizers DBS and DBP need 7 and 3 h, respectively, to reach the maximum
concentration in the ethyl cellulose. DEP and TEC, the more water soluble plasticizers,
distribute between polymer aqueous phase during the stirring time of 30 min. The water
solubility of the plasticizers effects the concentration gradient between the aqueous and
the polymer phase and thus the standing time of the polymer dispersion. The MFFT
values of the ethyl cellulose dispersion containing DBS and DBP decrease with
increasing amounts of HPMC. In contrast, the effect of HPMC on the aqueous polymer
dispersion containing DEP and TEC seems to disappear. The MFFT varies between 46
°C and 43 °C. They found that the bed temperature of 40 °C or 10 °C above the MFFT,
respectively, during the coating of the pellets in the fluidized bed apparatus is not
sufficient to reach a release rate of coated pellets which is independent of curing
conditions. Curing of coated pellets in an oven can cause a decrease of the drug
release rates to an endpoint. That means the interdiffusion of the pseudolatex particles
is not complete without the curing process. The curing temperature which is necessary
to reach a constant release rate is for example 1 h and 70 °C for coated pellets
containing 20 % DBS. The amount of plasticizer as well as the type of plasticizer
influence the film formation and therefore the adequate curing temperature and time
period. Pellets coated with 11 % DEP and TEC need curing conditions from 1 h at 100
°C and 90 °C, respectively, to reach stable coatings. Another possibility to lower the
relatively high curing temperatures to reach a constant and low release rate is the
curing at higher relative humidities <59>.
Pellets coated with an aqueous ethyl cellulose dispersion, containing DBS and HPMC,
show a two-phase release profile. The comparison of release rates from pellets coated
with plasticizers of different water solubility should clarify the reason for the two-phase
release profile. The release rates of diffusion pellets plasticized with TEC and DEP
increase with increasing amount of pore former from 10 to 30 % in the coatings. After a
short lag-time an approximate zero-order release rate can be observed. The pore

Results and discussion 251
former migrates after exposure to the aqueous medium and the drug diffused through
water-filled pores. The reason for the different release profiles of TEC and DEP
containing pellets may be the different content of plasticizer after coating and curing
process of the pellets due to the evaporation of the plasticizer. Pellets coated with EC
and 12.5 % DBP or DBS and HPMC also show increasing release rates with increasing
amount of HPMC from 10 to 30 %. However, the release curves do not take a linear
course, but show a two-phase profile. During the first phase the release is fast and
characterized by drug diffusion through water-filled pores after the migration of the
water soluble pore former comparable to the release mechanism of pellets coated with
TEC and DEP. During the second phase the free volume between the polymer chains is
dramatically reduced and therefore the permeability of the coating obviously decreased.
The remaining film containing ethyl cellulose and plasticizer is able to shrink. The drug
is supposed to diffuse mainly through the plasticized ethyl cellulose coatings. The
requirement for the reduction of the free volume between the polymer chains is the
exceeding of the glass transition temperature (Tg) of the swollen ethyl cellulose in the
medium. The extent of shrinking differed between coated pellets plasticized with DBP
and DBS. DBS probably retained almost completely in the coating whereas DBP
distributed partially out of the coating into the aqueous medium according to their
different water solubility and partition coefficient <59>.
Volatility and migration of plasticizers is the reason for the loss of plasticizer content.
Loss of plasticizer can occur after coating, curing and/or after storage at stress
conditions of coated pellets. DBP does not tend to volatize. The residual amount of DBP
varies between 82 % and 93 % after curing at 80°C for 1 h. In contrast to DBP, DEP has
a high tendency to volatize during the coating and curing process of the pellets. The
content of DEP decreases after coating at 53 % and curing 1 h at 100 °C to 28 – 21 %.
The direct volatility measurements show low values for DBP and DBS, an intermediate
value for TEC and a high value for DEP. Plasticizers leach out of the polymer according
to their physical and chemical properties. The relatively water soluble plasticizer DEP
migrated almost completely from the pellets coatings within 0.5 - 5 h in 0.1 N HCl
solution at 37 °C. In the same period of time DBP is recovered between 30.5 % and
38 % in the release medium. The fast loss of plasticizer during the drug release from
coated pellets plasticized with the fairly water soluble DEP caused a zero-order release
rate.

252 Results and discussion
The release of theophylline from pellets coated with aqueous EC dispersion, HPMC and
TEC or DEP, is independent of the storage at ambient conditions over 31 months. Only
the 4 months´storage at stress conditions caused a partial decrease of the theophylline
release rate. It can be assumed that the coalescence of the latex particles is completely
achieved according to the constant release rate of these coated pellets during the
storage at ambient conditions. The influence of the higher temperature and relative
humidity was possibly based on structural modifications of the film which only arise
under these conditions. In contrast, the release rates of coated pellets containing
12.5 % DBP and 20 % or 30 % HPMC increased with increasing storage time at
ambient conditions as well as at stress conditions. Coated pellets with 20 % DBP or
DBS did not show any influence of storage on the relase rate. In conclusion, the drug
release is dependent on the physical state of the swollen ethyl cellulose and on the
migration of the water soluble pore former. The first mechanism is, if the pore former
mostly migrated from the coating, the type and amount of plasticizer in the swollen
coating and the temperature of release medium influence the release rate to a large
extent. If the film forming polymer is present in the glassy state as it is after the
migration of the water soluble plasticizer and pore former at temperatures above Tg, the
drug diffuses through water filled pores. The second mechanism is, if the pore former
mostly migrated from the coating and the ethyl cellulose, in the rubbery state as it is the
case with the water insoluble plasticizer at temperature below Tg. The drug release rate
is characterized by a two-phase release profile as a result of pore shrinking. The third
mechanism occured if the migration of the pore former is incomplete. A high ionic
strength of the release medium caused a reduced hydration of the pore former. The
drug diffused through a swollen heterogeneous membrane containing EC, HPMC and
insoluble plasticizer <59>.
Rekhi, Mendes, Porter and Jambhekar <149> have studied aqueous ethycellulose
formulations by using Aquacoat ECD for coating of propranolol HCl. The effects of
varying the concentration of the fixing agent HPMC was investigated. The fluid-bed
process conditions and formulation characteristics of the drug adhesion layer were
examined to assess the tendency of beads to agglomerate while the fixing solution was
applied. The results showed that the layering process at the low inlet air temperatures
up to 55 °C at atomizing pressure of 2 bar caused aggregation. The inlet air
temperature of 55 °C and the atomizing air pressure of 1 bar neither caused a problem
Results and discussion 253
with aggregation nor spray drying but if the temperature was too high (65 °C) the spray
drying occured. The higher levels of HPMC in the formulation tended to increase the
risk of agglomeration. The higher atomizing air pressure (2 bar) also increased the
tendency for the beads to accumulate in the filter bags. They stated that the percentage
of drug released from Aquacoat-coated beads increased if the amount of HPMC used
was increased. This result demonstrated that the drug release rate may be affected by
the core substrate; perhaps because of imperfections in the cores caused by higher
amounts of HPMC. However, they did not mentioned any details about the swelling
property of HPMC. They used a high amount of HPMC (up to 50 % w/w to drug content)
in their study. This high amount of HPMC may cause a higher swelling than the amount
of 25 % fixing agent. The release of propranolol HCl from beads coated with Aquacoat
was higher at pH 7.5 compared to the release at pH 1.2. The release achieved 100 %
after 8 h in simulated intestinal fluid pH 7.5. Normally the release of drug from beads
coated with EC should not depend on the pH. The pH dependence in their study may be
attributed to the pH-dependent solubility of the drug or to the compostition of the coating
dispersion which included a surfactant-sodium lauryl sulfate.
Steuernagel <205> studied the prevention of the formation of an alkali-CAP salt by
using a seal-caot employing HPMC or a combination of HPMC and Aquacoat ECD.
HPMCAS was used as an enteric polymer for some products.
This present work shows that the HPMCAS dispersion still contained big particles which
may come from HPMCAS particles because the dispersion of Aquacoat CPD did not
contain such big particles. For this reason if HPMCAS should be used furthereon the
grinding of HPMCAS particles before adding into the aqueous dispersion is suggested.
The reduction of polymer particles after preparing the dispersion may be also
recommended e.g by homoginizing technique. The effect of grinding enteric polymer for
improving the property of film resulted from an aqueous formulation was demonstrated
by Thoma and Bechtold <185>. They found that the film formation from aqueous
dispersion of micronized HP-55 was affected by the degree of micronization and was
improved by reducing the particle size of this polymer.
HPMCAS was of interest to be used as enteric coating polymer because it was reported
that HPMCAS was more stable than CAP. The stability of HPMCAS was determined in

254 Results and discussion
the way that the coating material Aqoat-AS-MF was stored under the condition of at
60 °C and 100 % r.h. for many days. After 14 days, the free acid content in form of
succinic acid was about 1.8 % w/w. CAP, on the other hand, produced free phthalic acid
more than 5 % w/w only after 6 days at the same condition. This means HPMCAS is
more chemically stable than CAP <80>. However, the cellulosic derivatives such as
HPMCAS and CAP were more permeable than acrylic polymers due to their
hydrophilicity and less dense molecular arrangements <65>.
Thoma and Bechtold <185> studied the influence of aqueous coatings on the stability of
enteric coated pellets and tablets. The tablets cores were manufactured by wet
granulation technique. The coating was performed in a lab scale fluidized bed coater
and the aqueous coating dispersion of HPMCAS was kept cool during manufacture at a
temperature not exceeding 12 °C. For comparison pancreatin pellets and tablets
containing riboflavine were coated with various aqueous and organic enteric polymers
such as HPMCAS, HP, Eudragit L, CAP, etc. The gastric resistance of enteric coated
pancreatin pellets was observed by determination of the lipase activity after the pellets
were exposed to 0.1 M HCl for 2 h. They found that a higher amount of coating
materials was required to achieve gastro-resistance when using aqueous coating
compared to organic formulations. The moisture-sensitive pancreatin enzymes were
damaged both by humidity and heat during aqueous coating. The extent of damage
depended on the coating equipment used. During the storage coatings obtained from
aqueous dispersions showed changes in enteric performance or release characteristics
as a consequence of three chemical/physical mechanism i.e. hydrolysis of ester
linkages in the polymer or plasticizer, evaporation of the plasticizer, delayed film
formation. The active ingredient pancreatin induced hydrolysis of the ester based film-
former HPMCAS. The plasticizer glyceryl triacetate in HPMCAS-coated pancreatin
pellets was almost completely hydrolyzed by the enzymes, whilst TEC was lost by
evaporation through permeable packging material at elevated temperatures. The open
storage at elevated temperatures and humidities caused changes in the surface
structure of HPMCAS coatings, consisting of a smoothing of the originally porous film
and sticking. The riboflavin tablets coated with Aqoat were stable when stored under
stress conditions. On the other hand tablets coated with ammonia-neutralized aqueous
solution or water-based dispersion of CAP were unstable.

Results and discussion 255
Thoma and Bechtold <185> also found that the undercoating was suitable to decrease
the amount of coating material required. They used both HPMC and povidone (PVP) as
a film former for the undercoating. They found that the undercoat of 4 % PVP of
HPMCP-coated pancreatin pellets can increase the gastro-resistance property which
can be seen by the increasing of the lipase activity after exposure to 0.1 N HCl for 2 h.
The results showed that the minimum film thickness required for the film-coated
riboflavin tablets to achieve gastro-resistance was different. The CAP polymer as an
organic solution or an ammonia-neutralized solution needed the thickness of about 40
µm, whereas an aqueous dispersion of CAP needed a higher thickness of about 80 µm
to achieve this resistance. The formulation from HPMCAS, however, needed smaller
thicknesses than that from CAP. The thicknesses of about 30 µm and 50 µm were
enough to achieve the resistance for the organic solution and the aqueous dispersion,
respectively. If the swelling of the tablets was considered then the required minimum
thicknesses differed. The thicknesses of 40 µm, 110 µm, 55 µm, and 80 µm were
necessary for the coating formulations of CAP organic solution, CAP aqueous
dispersion, HPMCAS organic solution and HPMCAS aqueous dispersion, respectively
to achieve the swelling less than 10 %.
The effect of the curing conditions to the HPMCAS-coated pancreatin pellets was also
studied. The content of TEC used as a plasticizer in the coating formulation was
determined. The content of TEC in HPMCAS-coated pellets without curing was about
80 %. The curing temperatures of 40 °C to 60 °C can reduce the TEC content from
60 % to 35 %, respectively. The coating conditions such as inlet air temperature can
also affect the TEC content. The results showed that the TEC content in coated pellets
without curing was reduced from 80 % to 65 % if the inlet air temperature was increased
from 35 to 65 °C.
After storage of HPMCAS coated pancreatin pellets for 3 months at the elevated
temperature of 40 °C the originally porous film had already fused together to a
considerable degree. The moist storage at 40 °C and 75 % r.h. for 3 months led to a
closure of all pores, associated with a sticking of pellets.
If TEC was used as a plasticizer in films applied to pancreatin pellets no degradation
products such as citric acid were found. Therefore the loss of TEC may be due to the
evaporation. Glyceryl triacetate as a plasticizer, however, produced practically
quantitative degradation products such as acetic acid, mono- and diacetate.

256 Results and discussion
During the production of coatings from dispersions of micronized film-formers, e.g.
HPMCAS, there was a risk of coagulation at elevated temperatures, for example in the
drying zone of the coating apparatus, especially if the formulation contained sufficient
plasticizer. If the polymer particles did not fuse together during the coating process then
coagulate inclusions can become apparent as unevenness in the coating appearing as
spikes on the surface of coated products.
Thoma and Kräutle <187> studied the stability of pancreatin tablets coated with
aqueous dispersion of HPMCAS-LF. The disintegration time of pancreatin tablets
coated with aqueous dispersion of HPMCAS-LF was slightly reduced after storage at
25 °C but kept constant from 3 – 12 months. The disintegration time of these coated
tablets after storage at 35 °C slightly increased and then kept constant from 3 – 12
months. However, the product which was stored at the higher relative humidity (25 °C &
70 % r.h.) for only 6 months could not be tested because they fused together. The
disintegration time of tablets coated with an aqueous dispersion of HPMCAS with
triacetin as a plasticizer kept constant (less than 30 min) after storage at temperatures
of 25 °C, 30 °C and 40 °C for 6 months. This means that the storage temperatures in
the range of 25 – 40 °C did not cause a different affect to the disintegration time of the
HPMCAS-coated tablets.
Obara and Mc Ginity <117> have investigated the influence of processing variables on
the properties of free films prepared from aqueous polymeric dispersions by a spray
technique. They found that the mechanical values of free films from Aqoat were
significantly decreased at a slower spray rate e.g. from 16.2 to 4.8 MPa at the surface
temperature of 40 °C. The processing temperature, however, did not affect film
properties due to the lower MFFT of plasticized polymer. The temperature between
30 °C and 40 °C was not a significant factor provided the sprayed film had a sufficient
moisture. At 30 °C, the surface was kept under a sufficient moisture at a spray rate of
0.8 g/min. At 40 °C, the lower spray rate resulted in brittle films of significantly lower
tensile strength and elongation. It was possible that spray-dried particles were trappped
in the films prepared from low spray rates, resulting in an incomplete coalescence of the
polymer. The result suggested that specific moisture content was required for complete
film formation from the Aqoat aqueous dispersion. The differences in moisture
requirements between the Aqoat and Eudragit L polymers could be due to the size of
Results and discussion 257
the polymeric particles. The mean particles size of Aqoat dispersion was reported to be
approximately 5 µm which was larger than that of Eudragit L latex (0.2 µm). Therefore
the free film from Aqoat dispersion had a higher MFFT and a higher moisture content
would be required for the complete coalescence of the harder and larger particles.
The free films for the mechanical tests were prepared by the spraying technique. The
final film thickness was approximately 150 µm. Aqoat and 28 % TEC can form clear
films at room temperature. Therefore the MFFT, which was determined as the minimum
temperature where the film was clear and free of cracks, was less than 23 °C <117>.
In this present work the drying process was also performed during the spraying step
because the spraying rate was kept low at 0.8 g/min. Therefore the rapid drying will be
the reason for small cracks in the surface. The increase of the spray rate was not
possible because the formation of agglomerations would occur. To avoid
agglomerations the high air flow was used but this will also cause a rapid drying rate.
Moreover, in the preparation of free films it was possible to increase spray rates almost
without a limit because it was not necessary to consider the movement of the product.
The free films were prepared on the stationary place and polymer particles in the
dispersion had enough time to fuse together by help of capillary force and then coalesce
by having certain heat. In the coating apparatus the high spray rates cannot be
increased without a limit because if the product was overwetting (high spray rate and
slow drying) the formation of agglomerations would occur. The agglomerations can
sometimes be hindered by increasing the processing air flow which means an increase
of the drying rate. The high drying, however, will cause a spray drying and loss of
coating polymer particles. The reduction of overwetting can be done by using slower
spray rates. However, in such a case the overdrying should be considered. The
overdrying will again cause a formation of dried polymer particles before they can fuse
together and coalesce as a continuous film layer .
An important factor for film formation is the driving force that causes the coalescence of
polymeric particles which results from water evaporation or capillary force. Since
coalescence occurs only above the MFFT, temperature and water evaporation are
considered to be major factors which affect the film properties of coating materials. The
cast methods have been widely used for the preparation of polymeric films from organic
or aqueous dispersions. However, polymeric particles will tend to settle during the

258 Results and discussion
drying process in the cast method which will lead to uneven film formation. Therefore
the transfer of conditions from the casting method to the spraying method must be
carefully done.
Obara and McGinity <116> have studied the porperties of free films prepared from
aqueous dispersions of HPMCAS by a spray method and a cast method. It was found
that the 10 % HPMCAS dispersion cannot be atomized through the spray nozzle.
Therefore a 5 % dispersion was used. The formulation of HPMCAS (Aqoat-MF)
aqueous dispersion contained 28 % TEC as a plasticizer. The free films prepared from
a cast method of aqueous HPMCAS dispersion had uneven film formation because of
the high standard deviation of the mechanical properties such as tensile strength,
elongation and elastic modulus. This may be due to the settling of the polymer particles
during drying stage. Moreover, during the drying process film formation began at one
position in the spread dispersion and gradualy progressed throughout the plate,
simultaneously water was expelled from the drying areas to the remaining wet regions
of the spread dispersion. This movement of water can cause an uneven distribution of a
plasticizer in the film and cause heterogeneous film. The elongation of HPMCAS films
measured from the spray method (3 %) was lower than that from the cast method (6 %
– 8 %). This may be due to the fact that the spray-dried particles can be entrapped in
the film in the spraying technique which can lead to hard and brittle films. The elastic
modulus of HPMCAS films was high for films both prepared from a spray (750 MPa -
780 MPa) and cast method (270 - 300 MPa). The transparent films occured at 40 °C but
did not occur at 30 °C. Therefore the MFFT of this dispersion was between 30 °C and
40 °C.
Scheiffele, Kolter and Schepky <164> studied different products (free films and coated
tablets) prepared from Aqoat-MF suspension. The aqueous dispersion of unpigmented
Aqoat-MF composed of Aqoat powder, SLS, TEC (28 % to Aqoat-MF) and water. The
aqueous dispersion of pigmented Aqoat-MF composed of 7 % Aqoat powder, 0.21 %
SLS, 0.24 % colour, 2.1 % talc, 0.24 % titanium dioxide, 1.96 % TEC and 88.25 %
water. The coating apparatus Accela Cota 24 inch was used to coat the caffeine tablets.
The coating of tablets with Aqoat-MF dispersion was performed by using air inlet
temperature of 70 °C, product temperature of 33 - 35 °C, spraying rate was 40 g/min
and postdrying at 30 °C for 60 min. The resistance to gastric juice was reached at a

Results and discussion 259
coating amount of 11 mg/cm2 for Aqoat-MF. It was found that films prepared from Aqoat
were uniformly smooth. The MFFT of Aqoat-MF dispersion without pigment but
containing TEC (28 %w/w to Aqoat-MF) was 35 °C and the value of MFFT of this
diespersion with pigment (Sicovit 3.4 %w/w, talc 30 % and titanium dioxide 3.4 %w/w)
was 7 °C. It can be concluded that the MFFT of the liquid preparation was decidedly
reduced by the addition of pigments. The Tg of unpigmented Aqoat-MF was 117 °C and
after adding pigments the Tg was reduced to 55 °C. On the other hand, the Tg of
unpigmented Aquateric was 48 °C and after adding pigments the Tg was reduced to
56 °C. In the test for coagulation under shear and heat it can be seen that the
pigmented dispersion of Aqoat-MF displayed coagulation of about 15 %. The particle
size distribution of the unpigmented dispersion of Aqoat-MF and was 7 µm. The water
vapor permeability and proton permeability of free films from Aqoat-MF was reported to
be high. Perhaps due to the high mean particle size of the polymer. The weight of
enteric-coated tablets especially tablets which are coated with Aqoat-MF was increased
up to 34 % during the resistance tests in artificial gastric fluid after 2 h at the coating
level of 8 mg/cm2. Probably due to the swelling of the film. The resistance against
artificial gastric fluid of tablets coated with the aqueous dispersion of Aqoat-MF was
higher than that of Aquateric.
The problematic of enteric coating of pellets with HPMCAS was reported. Schmidt and
Niemann <169> studied the coating of pellets by using both organic and aqueous-based
systems of Aqoat AS-MF. The neutral pellets were loaded with bisacodyl and were used
as cores. The coating process was performed in a miniature laboratory-scale fluid-bed
pan coater which was developed by Schmidt and Niemann <168>. This apparatus was
originally a pan coater but it was developed so that the core bed was slightly fluidized by
the inlet air flow due to the small dimensions of the coating pan. It was commented that
this technique will allow a rapid drying and a loss of coating materials will be negligible.
Small batches of 50 to 100 g of pellets can be coated in this apparatus. The bed
temperature was 35 °C for both systems with the mean spraying rate of about
0.5 ml/min. They found that there was a high loss of coating material at about 17 % and
9 % for the coating process by an aqueous and organic system, respectively. However,
the organic-solvent based film of HPMCAS at a coating level of 25 % provided
gastroresistance for more than 6 h. An aqueous suspension of HPMCAS produced films

260 Results and discussion
with a short gastro-resistance of below 0.6 h. After doubling the coating level of water-
based HPMCAS films (58 %) the protection was prolonged to 3.4 h <168,169>.
Nagai, Sekigawa and Hoshi <106> studied the coating of pellets with HPMCAS. The
suitable plasticizer for HPMCAS was reported to be TEC because of the high
percentage of recovery of TEC and the good acid resistance property. Fukui, et al <61>
has reported that the water-soluble plasticizers such as TEC and triacetin showed
greater compatibility to HPMCAS. The results were consistent with the suppression of
the drug release in 0.1 N HCl. The particle sizes of HPMCAS should be less than 5 µm
for aqueous coating for determining smooth films. If the particle sizes were higher than
15 µm it was reported that the surface of the film obtained was rough. In granules
coating talc is sometimes added as a filler and it often enhances the acid resistance of
the film. Therefore they used the aqueous coating formulation contained 10 parts
HPMCAS, 3 parts TEC, 5 parts talc and 82 parts water. The aqueous coating of
granules containing riboflavin with HPMCAS yielded homogeneous films and they were
resistant to artificial acid fluid. However, the surface views of the HPMCAS-coated cores
contained discontinuous coalescence region. The acid resistance property of these
granules may be due to the high amount of talc (50 % w/w with respect to HPMCAS) in
the coating formulation. The stability of HPMCAS-coated products was examined.
Almost no difference was observed after storage for 90 days at 40 °C and 75 % r.h. The
pancreatin granules coated with HPMCAS retained their acid resistance (more than 90
% amylase activity) after high-temperature storage. The tensile strength of HPMCAS
film was reported to be the same as that of other polymers such as HPMCP or CAP.
However, the elongation of HPMCAS was higher which means that HPMCAS has a
better plasticity <106>.
This part of study shows that a combination of EC and PVA can be used as a subcoat.
The release of nicotinamide from the E&P-Nico pellets was fast enough so that there
was no effect of delay release. The unsatisfying result of gastric resistant was due to the
incomplete coalescence of the CAP particles, details of which were mentioned in 3.1 -
3.2.

Results and discussion 261 3.5 Pellets with nicotinamide and a combination of PVA and EC (100 parts + 30 parts) as a subcoat a) Placebo: HPMC pellets
The HPMC coated pellets (Product pp) were achieved from the combination of a
formulation R1 and a process number X7, as demonstrated in the Table 2.29.
b) Nicotinamide loaded pellets: Nico pellets
The Nico pellets (Product aa) were achieved from the combination of a formulation R3
and a process number X8, as demonstrated in the Table 2.29.
c) A combination of PVA and EC as a subcoat: P&E-Nico pellets
The P&E-Nico pellets have a blue colour as a marker was used. These pellets
(Product bb) were achieved from the combination of a R7 and a process number X12,
as demonstrated in the Table 2.29.
d) Enteric coated pellets: CAP-P&E-Nico pellets
The CAP-P&E-Nico pellets still have a blue colour caused by the marker. These pellets
(Product cc to jj) were achieved from different combinations of a formulation and a
process number, as demonstrated in the Table 2.29.
3.5.1 Film quality, diameter and weight of pellets
The physical properties of the raw material used for this process and of the finished
products are shown in Table 3.12. The thickness of the HPMC layer (HPMC pellets) as
measured from SEM was about 10 ± 4 µm. The mean diameter of these pellets
measured by an image analyser was 970 ± 34 µm. The mean weight of one HPMC
pellet (Product pp) was 0.66 ± 0.01 mg. One Nico pellet (Product aa) had a mean
weight of 0.75 ± 0.02 mg and a mean diameter of 980 ± 33 µm. The thickness of the

262 Results and discussion nicotinamide layer was about 20 ± 5 µm and the weight gain from nicotinamide and
HPMC was 11.4 % w/w.
The subcoat from a combination of PVA and EC has been achieved in a thickness of
38 ± 4 µm by a weight gain from Nico pellets of 97 % w/w. The SEM photograph in
Figure 3.30a shows the thickness of the P&E layer of Product bb and that the layer was
almost homogeneous. The mean weight and the mean diameter of one pellet compared
between cores (Product aa) and P&E-Nico pellets (Product bb) allowed to calculate the
amounts of the PVA and EC polymer mixture coated per pellet, namely 20 mg cm –2 .
Physical properties of CAP coated pellets are also stated in Table 3.12. The SEM
photograph of the cross-section of the Product ee shows the inhomogeneous layer of
CAP and DBS and that many particles did not form a continuous film, i.e. will not have
reached the MFFT (Figure 3.35b). Product cc shows inhomogeneous regions within the
layer of CAP and DEP (Figure 3.36a). All the coated pellets of this product showed also
pores dispersed at the surface (Figure 3.36b). There was also no difference between
the CAP film layer from Aquateric (Product Gg) or Aquacoat CPD (Product Ff) as
judged from physical properties as mentioned before. The best enteric layer from CAP
can be achieved from TEC as a plasticizer. A cross section of the CAP layer (Product jj)
showed an almost homogeneous film structure (Figure 3.37a). The whole surface of the
cores (Product bb) was well covered by the CAP layer but uneven regions can be well
demonstrated (Figure 3.37b).
The mean weight of one CAP-P&E-Nico pellet (Product jj) from Product bb as cores
was 1.42 ± 0.01 mg while the mean diameter of these pellets was 1295 ± 40 µm at the
coating amount of 66 mg cm –2.
In general, the standard deviations of the diameter of all products in Table 3.12 are not
more than 40 µm. This shows the well-controlled course of the coating processes.

Results and discussion 263
264 Results and discussion
Figure 3.35: SEM pictures of coated pellets; a) the cross-section of a pellet coated
with a subcoat from PVA and EC (100 + 30 parts) (Product bb),
magnification 600x; b) the cross-section of an enteric coated pellet with
CAP and DBS (Product ee), magnification 430x.
a
b

Results and discussion 265
Figure 3.36: SEM pictures of enteric coated pellets with CAP and DEP (Product cc);
a) the cross-section of a coated pellet, magnification 2010x; b) top view
of a coated pellet, magnification 67x.
a
b

266 Results and discussion
Figure 3.37: SEM pictures of enteric coated pellets with CAP and TEC (Product jj);
a) the cross-section of a coated pellet, magnification 725x; b) top view
of a coated pellet, magnification 117x.
a
b
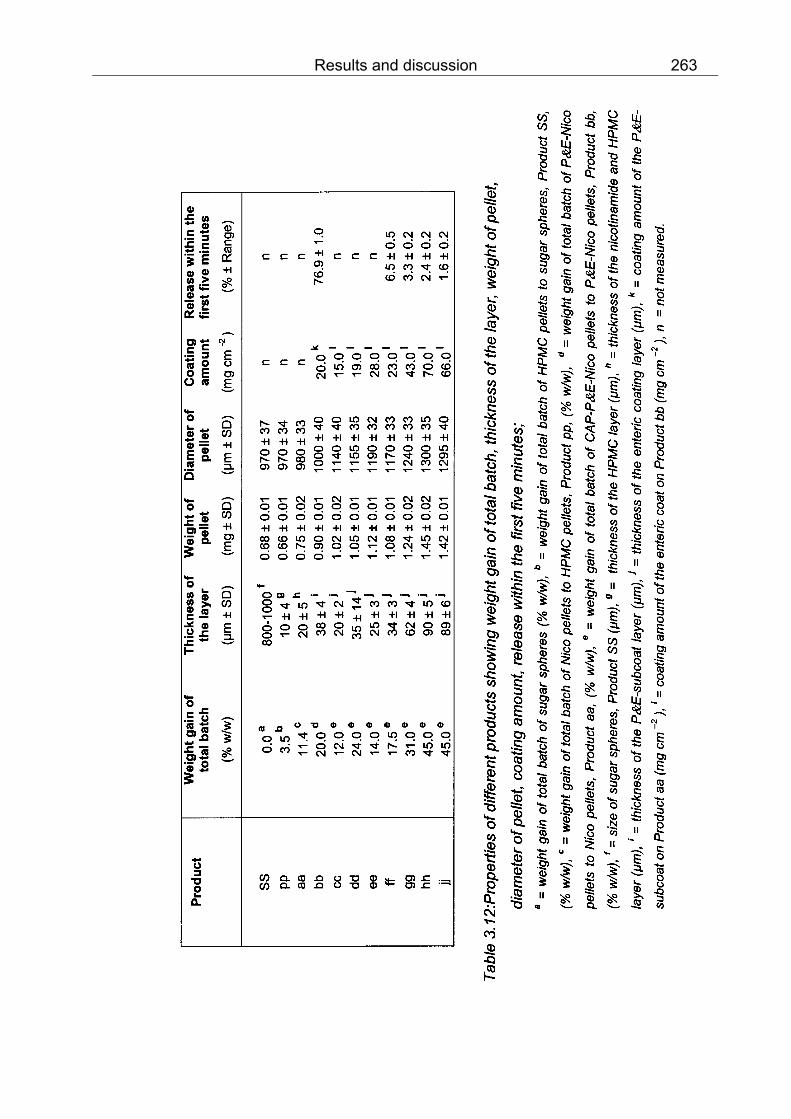
Results and discussion 267 3.5.2 Swelling
The swelling in 0.1 N HCl of P&E-Nico pellets (Product bb) was very high, i.e. 43 %, as
shown in the Table 3.13. The enteric coated pellets with two different plasticizers
(Product cc and jj) were tested in the acidic medium. They cracked after 30 min,
therefore the swelling cannot be measured.
Product D1 ± SD D2 ± SD ∆D ± SD Swelling
(pixel) (%)
bb 185 ± 1 264 ± 2 79 ± 1 43
cc 193 ± 3 - - crack
jj 212 ± 2 - - crack
Table 3.13: Swelling property of different products in 0.1 N HCl, 22 °C;
D1: diameter before swelling, D2: diameter after swelling,
bb: P&E-Nico pellets,
cc: CAP-P&E-Nico pellets (CAP+DEP),
jj: CAP-P&E-Nico pellets (CAP+TEC).
3.5.3 Content of nicotinamide in one pellet
The content of nicotinamide inside one pellet of different products was varied. Product
aa or Nico pellet without further coatings contained 9.1 ± 0.2 % w/w of nicotinamide
based on total weight of one pellet. One pellet after coating with a subcoat from the
combination of PVA and EC (Product bb) contained 8.6 ± 0.3 % w/w of nicotinamide.

268 Results and discussion 3.5.4 Release of nicotinamide from coated pellets
The cumulative percentage of nicotinamide released during the first five minutes from
differently coated pellets is demonstrated in Table 3.12. The dissolution profiles of
different products containing nicotinamide can be seen in Figure 3.38. The release from
coated pellets with the subcoat from a combination of PVA and EC, but without enteric
coating, reached 100 % after 10 min. The cumulative percentage of nicotinamide
release decreased after coating with CAP. At higher amounts of CAP and TEC the
release of nicotinamide became smaller (Product ff to hh). However, the release of
nicotinamide was more than 80 % after 120 min in 0.1 N HCl at every thickness.
Figure 3.38: Dissolution profiles of differently coated pellets containing nicotinamide
in 0.1 N HCl at 37 °C without (Product bb) and with increasing
thicknesses of enteric coats in mg cm-2 (Product ff to jj) on Product bb
as cores;
ff:23, gg:43, hh:70, jj:66; hh: production with intermediate drying phase;
jj: similar to Product hh but with cyclone instead of filters set.
0
20
40
60
80
100
0 10 20 30 40 50 60 70 80 90 100 110 120 130 140
Time (min)
Nic
otin
amid
e re
leas
ed (%
)
bb ff gg hh jj

Results and discussion 269 3.5.5 Optical appearance after the release study
The optical appearance of the enteric coated pellets with different plasticizers after the
release study is demonstrated in Figure 3.39 and Figure 3.40. Enteric coated pellets
both with DEP and TEC as a plasticizer were broken after 30 min in 0.1 N HCl. These
pellets after exposure to the phosphate buffer for 30 min still had their shell. This means
the outer layer was not completely dissolved, the diffusion of the drug is responsible for
the release.
3.5.6 Optical characterization of pellets after storage
The following storage conditions demonstrated the highest humidity at each
temperature that allowed the enteric coated pellets to flow freely and did not stick
together.
Temperature (°C) Relative humidity (% r.h.)
25 57.5
30 56.0
35 54.0
Table 3.14: The highest humidity at each temperature that still allowed the enteric
coated pellets and a combination of PVA and EC (100 + 30 parts) as
subcoat (Product cc) to flow after 30 days of storage.
In summary it was found that Product cc will have an acceptable physical property after
30 days of storage when the relative humidity was not higher than 60 % r.h. However, if
the temperature was above 35 °C the pellets began to stick together even at the relative
humidity of only about 30 % r.h. If the result is compared to Product EE, part 3.2.8, it is
obvious that CAP-coated pellets with a subcoat from a combination of PVA and EC
(Product cc, part 3.5.6) were more sensible to temperature than CAP-coated pellets
with a subcoat from HPMC (Product EE). The Product cc can freely flow only when the
temperature did not exceed 35 °C, whereas Product EE can tolerate a temperature up
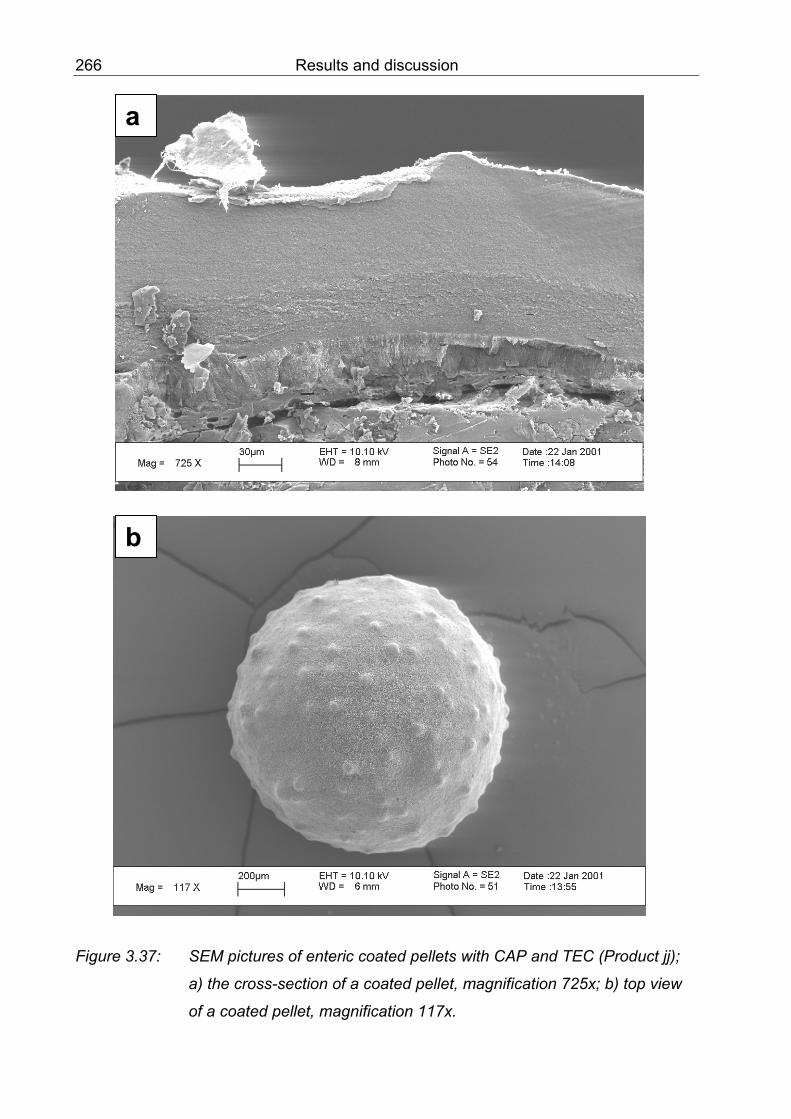
270 Results and discussion to 50 °C. At the highest stress condition of 50 °C and 80 % r.h., the CAP-coated pellets
liquefied. This means, if an accelerated chemical degradation test should be performed
with CAP-coated pellets the temperature and the relative humidities should not exceed
40 °C and 60 % r.h., respectively. In this range of temperatures and humidities, the
physical property of the CAP-film is still acceptable and the chemical degradation of the
coated pellets may then be observed and not the physical damage.
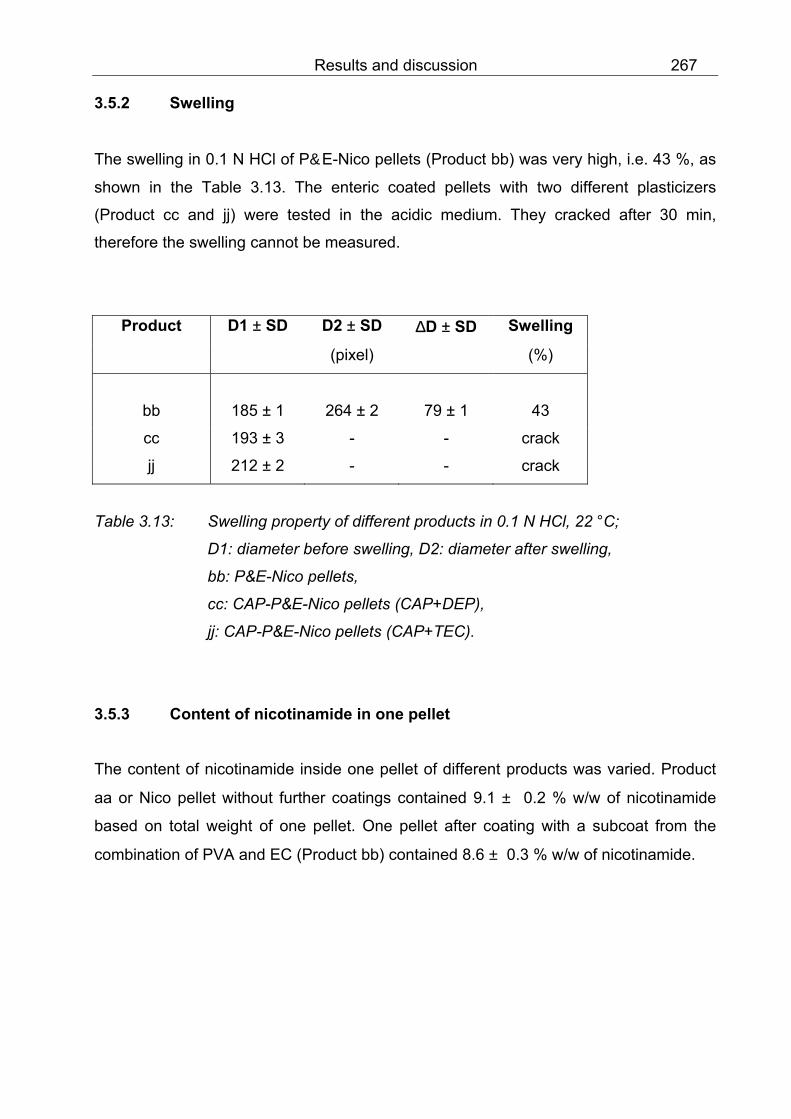
Results and discussion 271
Figure 3.39: Enteric coated pellets with CAP and DEP (Product cc) after exposure to
different media at 37 °C, for 30 min;
a) 0.1 N HCl; b) phosphate buffer pH 6.8.
a
b

272 Results and discussion
Figure 3.40: Enteric coated pellets with CAP and TEC (Product jj );
a) before and; b) after exposure to 0.1 N HCl, 37 °C, for 30 min.
a
b

Results and discussion 273 3.5.7 Discussion
PVA is available in different viscosity grades. It was used as an excipient in many field
e.g. production of paper, polymerisation, textile, foils and ceramics <142>. In the
pharmaceutical field, it can be used as a stabilizer in emulsion, filer in tabletting,
pelletisation, microencapsulation or sponges etc., but the use of PVA as a film forming
agent is not published. Therefore it is of interest to study the possibility to use PVA for
coating of pellets because it was mentioned <142> that PVA can be used as a moisture
barrier. In order to compare the properties of the PVA film other neutral polymers were
used i.e. hydroxypropyl methylcellulose, ethylcellulose.
However, from the preliminary studies PVA cannot be used alone because of a problem
in processing. Therefore the combinations with EC were studied. Only few reports were
related to PVA. Moldenhauer, et al <105> have demonstrated the possibility to use PVA
in coating formulations. However, only the sugar coating was successfully performed by
using PVA as a suspension stabilizer. One of the coating formulations contained PVA,
talc, calcium carbonate, titanium dioxide, Aerosil 200, hydroxy ethylcellulose,
saccharose and water. Tablets that were coated with this suspension in a pan coater
had a smooth and glossy surface. However, PVA cannot be added to more than
3 % w/w into the suspension because it will cause the uneven surface of the tablets.
The other formulation without sugar that was used successfully contained PVA, hydroxy
ethylcellulose, Aerosil 200, titanium dioxide, calcium carbonate, talc, glycerol, Tween 20
and water. This shows that these aqueous suspensions contained high amount of
unsoluble substances which can be stabilized by adding PVA. The authors have also
studied an organic–based formulation containing PVA to coat tablets but the result of
this film coating was not satisfying. This may be due to the low solubility of PVA in this
organic solvent which was mentioned that it will cause the polymer not to form the
continuous film.
The swelling of PVA was reported by some researchers. Quintanar-Guerrero, et al.
<146> have studied the swelling of PVA which was used as an excipient in the
production of tablets. Matrix tablets were produced by mixing a drug and PVA at the
ratio of 20:80 then compressed into a tablet with a diameter of 11 mm. The swelling
studies were performed in pH 7.0 buffer. The diameters during a time interval were
determined by an image analyser. The swelling index was calculated as a percentage
from the surface area of the tablets. The highest swelling index was about 10 %. The

274 Results and discussion change of tablet area, which showed the process of swelling, occured in three different
stages which were intimately related to the polymer dissolution. The first stage was a
rapid initial swelling resulting in an increased area. The second stage was a period with
an approximately constant area. The third stage was a decrease of the tablet area.
They have found that the thickness of the gel layer gradually increased during the
dissolution test. Thus the delivery of drug was governed by the drug concentration
gradient along the diffusion path length.
Sakellariou, Hassan and Rowe <160> have reported that HPMC and PVA are
thermodynamically incompatible. The PVA used in this recent study was a random
copolymer of poly(vinyl alcohol-co-vinyl acetate) with 88 % vinyl alcohol content. The
incompatibility was demonstrated as the mixture of these two polymers segregated into
two phases. Moreover, they have studied the effect of PEG 6000 on a 50:50 w/w
mixture of HPMC and PVA. They found that PEG 6000 is a poor plasticizer for the two
pure polymers and it had no effect on the behaviour of either HPMC-rich or PVA-rich
phases of the mixtures. PEG 6000 segregated into a separate phase due to its
thermodynamic incompatibility with both phases of the mixture in agreement with
theoretical predictions based on the solubility parameters of the individual components
and the interaction energy density of the mixture. The phase separation may be due to
the inability of these molecules to contribute to hydrogen bonding and dipole-dipole
interactions with each other.
Shlieout <175> has studied the mechanical properties (elastic behaviour and internal
stress) and the swelling behaviour of two types of polyvinyl alcohol which were
separately compressed as tablets.
The coating process by using PVA or a combination of PVA and EC was not reported.
This present study shows that a combination of PVA and EC can be used as a subcoat
because of the fast dissolution of a drug (nicotinamide) from the coated pellets.
However, the stability of CAP-coated pellets with a subcoat from a combination of PVA
and EC was not yet tested because of the non-resistance against gastric fluid of the
film. It is, however, of interest to test this aspect in a further study e.g. another doctoral
work. The unsatisfying result of gastric resistance was due to the incomplete
coalescence of the CAP particles, details of which were mentioned in 3.1 - 3.2.

Results and discussion 275
3.6 Pellets with nicotinamide but without any subcoat
a) Placebo: HPMC pellets
The HPMC coated pellets (Product pP) were achieved from the combination of a
formulation R1 and a process number X7, as demonstrated in the Table 2.30.
b) Nicotinamide loaded pellets: Nico pellets
The Nico pellets (Product aA) were achieved from the combination of a formulation R3
and a process number X8, as demonstrated in the Table 2.30.
c) Enteric coated pellets: CAP-Nico pellets
The CAP-Nico pellets have a white colour. These pellets (Product kk to oo) were
achieved from different combinations of a formulation and a process number, as
demonstrated in the Table 2.30.
3.6.1 Film quality, diameter and weight of pellets
The thickness, diameter and the weight of the HPMC coated pellets (Product pP) or
Nico pellets (Product aA) were the same as mentioned in the part of 3.4.1.
These pellets containing nicotinamide were afterwards directly coated with enteric
coating. The physical properties of the enteric coated pellets are demonstrated in the
Table 3.15. The SEM photograph of the cross-section of Product kk in Figure 3.41a
shows the layer of CAP and DEP, whereas the layer of pellets coated with CAP and
DBS of Product mm is demonstrated in Figure 3.41b. The SEM-results of the enteric
layers of these pellets were the same as of pellets with different subcoats. CAP and
DBS resulted in pellets with many uneven regions (Figure 3.42a). The best enteric layer
also resulted from CAP and TEC (Figure 3.42b). However, small cracks dispersed on
the surfaces of pellets coated with CAP and TEC were observed (Figure 3.43).
The mean weight of one CAP-Nico pellet (Product oo) from Product aA as cores was
1.15 ± 0.01 mg, while the mean diameter of these pellets was 1155 ± 37 µm at the
coating amount of 46 mg cm –2. These pellets weighed less than the others in part 3.2
to 3.5 because they did not have any subcoats.

276 Results and discussion

Results and discussion 277
Figure 3.41: SEM pictures of enteric coated pellets; a) the cross-section of a pellet
coated with CAP and DEP (Product kk), magnification 560x; b) the
cross-section of a pellet coated with CAP and DBS (Product mm),
magnification 350x.
b
a

278 Results and discussion
Figure 3.42: SEM pictures of enteric coated pellets; a) the top view of a pellet coated
with CAP and DBS (Product mm), magnification 64x; b) the cross-
section of a pellet coated with CAP and TEC (Product oo),
magnification 1060x.
b
a

Results and discussion 279
Figure 3.43: A SEM picture of the surface of a pellet coated with CAP and TEC
(Product oo), magnification 5000x.
3.6.2 Swelling
The swelling in 0.1 N HCl of pellets coated with CAP and TEC (Product oo) was an
example to demonstrate again that these pellets dissolved in the acid medium. Table
3.16 shows the comparison between enteric coated pellets with the same formulation
containing CAP and TEC with (Product mM and nN) and without subcoats (Product oo).
If the pellets carried a subcoat of a combination from EC and PVA, the pellets were
broken but if the pellets did not have any subcoat they were dissolved and their
diameter decreased after exposure to an acid medium for 30 min.

280 Results and discussion
Product D1 ± SD D2 ± SD ∆D ± SD Swelling
(pixel) (%)
bB 211 ± 1 220 ± 3 9 ± 2 4
cC 230 ± 3 248 ± 5 19 ± 3 8
mM 246 ± 2 - - crack
nN 228 ± 3 - - crack
oo 203 ± 2 - - dissolving
Table 3.16: Swelling property of different products in 0.1 N HCl, 22 °C;
D1: diameter before swelling, D2: diameter after swelling,
bB and cC: E&P-Nico pellets,
mM and nN: CAP-E&P-Nico pellets (CAP+TEC),
oo: CAP-Nico pellets (CAP+TEC).
3.6.3 Content of nicotinamide in one pellet
The content of nicotinamide inside one pellet of different products was varied. Product
aA or Nico pellet without further coatings contained 8.9 ± 0.1 % w/w of nicotinamide
based on total weight of one pellet. One pellet without any subcoat after coating with
different enteric coats (Product kk to oo) contained 8.3 ± 0.3 % w/w of nicotinamide.
3.6.4 Release of nicotinamide from coated pellets
The cumulative percentage of nicotinamide released during the first five minutes from
enteric coated pellets with different formulations is demonstrated in Table 3.15. The
dissolution profiles of different enteric coats are shown in Figure 3.44. The release from
all products reached 100 % after 60 min. Only a small resistance against 0.1 N HCl can
be achieved from CAP and TEC at the thickness of about 80 µm.

Results and discussion 281
Figure 3.44: Dissolution profiles of differently coated pellets containing nicotinamide
in 0.1 N HCl at 37 °C without subcoat but with enteric coats containing
different plasticizers (Product kk to oo) and Product aA as cores;
kk: CAP with DEP at a coating amount of 13 mg cm-2; mm: CAP with
DBS at a coating amount of 26 mg cm-2; nn: CAP with TEC at a coating
amount of 25 mg cm-2; and oo: CAP with TEC at a coating amount of
46 mg cm-2 .
3.6.5 Optical appearance after the release study
The optical appearance of enteric coated pellets with CAP and TEC (Product oo) after
the release study is demonstrated in Figure 3.45. These pellets were broken after
exposure to 0.1 N HCl for 30 min. Other pellets with another plasticizer (DEP) show the
same result of breakage after 30 min.
0
20
40
60
80
100
0 10 20 30 40 50 60 70 80 90 100 110 120 130 140 150
Time (min)
Nic
otin
amid
e re
leas
ed (%
)
kk mm nn oo

282 Results and discussion
Figure 3.45: Optical appearance of pellets coated with CAP and TEC (Product oo)
after exposure to 0.1 N HCl, 37 °C for 30 min.
3.6.6 Discussion
The nicotinamide loaded pellets without any subcoat subsequently coated with CAP
shows no gastric resistance property. The release of nicotinamide from the pellets was
higher than that one with a subcoat. Therefore the non-resistance property of CAP layer
was not only caused by the swelling of the subcoat but also from the incomplete
coalescence of the film. Details of which were mentioned in 3.1 - 3.2.

Comparative discussion 283 4. Comparative discussion
The investigations were carried out by spraying first the sugar spheres in the size range
of 800 - 1000 µm with a HPMC solution in order to obtain a mechanically protecting
layer. The thickness of this HPMC layer was about 7 - 10 µm. The diameter and the
weight of the resulting spheres was about 970 - 980 µm and 0.65 - 0.67 mg,
respectively. Hereafter these HPMC-coated pellets were covered with a layer of
nicotinamide on the basis of HPMC as a binder. Nicotinamide was recrystallized as rod-
like crystals during drying at the surface of the HPMC-coated spheres. The structure of
this layer was porous but bound together because of HPMC. The thickness of this
nicotinamide layer was about 20 - 23 µm with a weight gain of about 9 - 11 % w/w. The
diameters and weights of these pellets were between 980 - 1010 µm and 0.75 mg -
0.80 mg, respectively. The content of nicotinamide in one pellet was about 8 % w/w -
8.5 % w/w.
Different neutral polymers, i.e. HPMC, EC and PVA, have been tested for their
suitability for use as a subcoat. With PVA, various types were used to choose the
suitable one for further investigations. The effectiveness of the PVA-films to provide a
moisture barrier has been studied in comparison with films prepared from HPMC or
Sepifilm on the basis of Karl-Fisher titration. The pellets coated with PVA were stored
under different temperatures and humidities and taken out after a certain time period to
determine the content of water in the pellets. The results showed that stored PVA-
coated pellets had not taken much water after 3 weeks. The water content in the pellets
after 3 weeks of storage was not higher than 3 % w/w at the highest stress condition of
50 °C and 80 % r.h.. Pellets stored under room condition showed a water content of
about 1 - 2 % w/w. When PVA-coated pellets were compared to HPMC-coated pellets
after storage no difference of the water content was obvious. However, the preliminary
test with different PVA solutions showed that PVA alone could hardly be used as a
subcoat. The PVA solution alone leads to higher sticking of the pellets when sprayed in
the fluidized bed apparatus. For this reason PVA was only used in mixtures with EC in
the main part of studies. EC can hinder the stickiness caused by PVA, and the
dispersion of PVA and EC can better be sprayed at higher spraying rates. Mowiol 4-98
was used as source for PVA because it has a low molecular mass and a low viscosity.
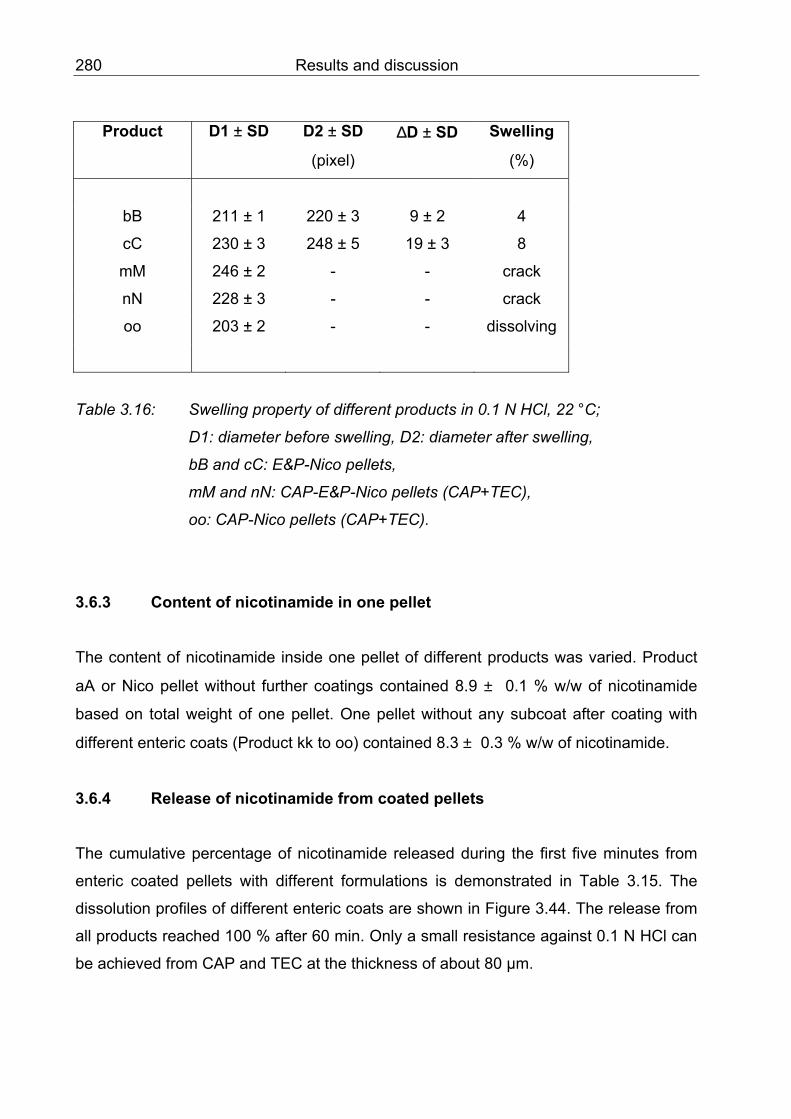
284 Comparative discussion In the main part of studies the nicotinamide loaded pellets were covered with one of four
subcoats of HPMC, EC, two combinations of EC and PVA in different relations
(100 + 30 parts, and 30 + 100 parts). Each one was marked with a different colour. The
thickness of the subcoat prepared from HPMC was varied from 12 to 38 µm; from EC it
was varied from 19 to 160 µm; for the combination of EC and PVA (100 + 30 parts) it
was varied from 66 to 130 µm; and for the combination of PVA and EC (100 + 30 parts)
it was about 38 µm. The ranges of resulting diameters and weights of nicotinamide
loaded pellets after coating with these subcoats varied for HPMC from 1040 to 1100 µm
and 0.81 - 0.92 mg, for EC between 1030 and 1305 µm and 0.88 - 1.48 mg for the
combination of EC and PVA (100 + 30 parts) from 1175 to 1320 µm and 1.08 mg to
1.39 mg, for the combination of PVA and EC (100 + 30 parts) the diameter increased to
about 1000 µm and the weight to about 0.90 mg. The values of diameter and weight
and their standard deviations showed that the coating process was well carried out and
homogeneously coated pellets resulted.
The results of sieve analyses showed that the diameter of pellets measured by the
sieving technique was comparable to that measured by an image analyser. Whilst the
sieving method was faster, it created a mechanical stress by the vibration. Therefore the
non-destructive method by image analysis was preferred for the determination of the
diameter of the pellets.
The swelling of nicotinamide loaded pellets in 0.1 N HCl after coating with a subcoat
from HPMC was 25 %, with a subcoat from EC it was only 0.5 %, with a subcoat from a
combination of EC and PVA (100 + 30 parts) it was 4 - 8 %, while with a subcoat from a
combination of PVA and EC (100 + 30 parts) it was 43 %. A combination of PVA and
EC gave the highest value of swelling followed by the value from HPMC. Both these
polymers or polymer mixtures are hydrophilic. All four subcoats prepared from polymers
or polymer mixtures showed an acceptable coating with fast release of the drug. Only
the combination of EC and PVA (100 + 30 parts) resulted in films with separated
polymer layers. The films of the three other formulations, i.e. HPMC, EC and the
combination of PVA and EC (100 + 30 parts), were homogeneous.

Comparative discussion 285 The different thicknesses of the subcoat prepared from EC (48 and 160 µm) and a
combination of EC and PVA (66 and 130 µm) was tested to observe the effect of the
thickness on the release or the swelling of pellets after coating with CAP.
Films prepared from CAP with DEP as a plasticizer showed cracks, whereas films
prepared from CAP and DBS showed great unevenness. The pellets coated with the
above mentioned CAP formulations were not resistant to 0.1 N HCl for 2 h. For this
reason another plasticizer was selected. TEC is more hydrophilic than DEP and DBS
and TEC does not contain phthalyl groups therefore TEC was used. Films prepared
from CAP with TEC showed a better internal structure but also contained cracks. High
dust occured when the pellets were coated with CAP and TEC under the high process
air flow because of the spray drying, and the filters were quickly blocked. The process
had to be interrupted, the filters had to be cleaned, new filters had to be inserted into the
coating apparatus before further coating steps could be performed.
The test with a cyclone as a dust collector showed that it was preferable to make use of
a cyclone instead of filters. Besides it allowed a continuously running process and the
time of coating was shortened as well. Consequently, all processes to coat pellets with
CAP and TEC were performed with a cyclone.
A great batch of pellets containing methyl orange was prepared for preliminary tests.
Methyl orange has a yellow colour in a basic medium and a red colour in a moderately
acidic medium. Therefore the diffusion of the artificial gastric fluid (0.1 N HCl) through
the polymer layers towards the core can be monitored by observing the colour change
of methyl orange in 0.1 N HCl over a certain period of time. A release test by monitoring
the release of methyl orange from the CAP-coated pellets was also possible.
As already mentioned films prepared from a combination of CAP and TEC had a rather
good film structure. However, after the diffusion test it was found that the gold-orange
coloured pellets had changed their colour into pink after 10 min in 0.1 N HCl at the
latest. Contrary to this there was a delay of release in 0.1 N HCl of the CAP-coated
pellets containing methyl orange, especially at the high thickness of about 90 µm.
Further investigations by using FTIR and NMR showed that it was possible that a salt

286 Comparative discussion formation between the nitrogen atom of methyl orange and a hydrogen atom of phthalyl
groups of CAP was responsible for this delay.
Pellets with a subcoat from HPMC or a combination of PVA and EC (100+30) and then
coated with CAP and TEC showed the uneven surface, while pellets coated under the
same conditions with a subcoat from EC or a combination of EC and PVA (100+30)
showed even surfaces. The uneveness may be due to the hydrophilicity of the
subcoats. According to the result of the release tests none of the pellets coated with
CAP and TEC and other additives was resistant against 0.1 N HCl up to 2 h.
The swelling of the CAP-coated pellets and HPMC used as a subcoat could not be
measured because of the dissolving of the pellets in 0.1 N HCl. When the pellets had a
subcoat prepared from EC and a coat of CAP, then the swelling remained low at 0.5 %.
Surprisingly, when pellets had a subcoat prepared from a combination of EC and PVA
(100 + 30 parts) or PVA and EC (100 + 30 parts), these CAP-coated pellets were
broken after a short time (less than 30 min) exposure to 0.1 N HCl. This may be due to
the fact that the CAP film layer cannot tolerate the high swelling of these subcoats (up
to 43 %).
Further enteric coating tests were made with a combination of CAP and HPMCAS,
which should increase the elasticity of the film. However, the resistance to the acidic
medium was not improved by this combination.
In summary, none of the pellets coated with CAP (with different plasticizers such as
TEC, DEP or DBS) was gastric resistant up to 2 h. The pellets with nicotinamide but
without any subcoats had not at all a gastric resistance property. All these results may
most probably be due to the incomplete coalescence of the colloidal CAP polymer
particles.
The effect of curing, i.e. treatment of CAP-coated pellets after having finished the
coating process, for different times under different temperatures (40 – 80 °C) and
humidities (up to 75 % r.h.), was also investigated. This additional procedure is
recommended generally in the literature as well as by polymer manufacturers, to
improve the formation of a homogenous film coat. However, the results showed that the

Comparative discussion 287 film structures were not improved as compared to those obtained without curing. The
coats still contained cracks or unevenness as before curing.
The optical appearance of the pellets stored under different conditions (25 - 50 °C and
30 - 80 % r.h.) showed that pellets coated with CAP cannot be stored above 40 °C and
60 % r.h. as a sticking occured. The physical properties of the films would hereby be
lost.
The content of free phthalic acid was determined by HPLC. Pellets coated with a
formulation containing CAP and DEP showed about 4 % of free phthalic acid. This value
was not higher than the limit of 6 % w/w in the USP XXIII but higher than the limit of the
USP XXIV which reduced this value to 3 % w/w. The high value of phthalic acid in the
coated pellets may have resulted from hydrolysis of CAP (and/or DEP, in case this was
used as plasticizer) during the coating process and during the storage period. This was,
however, not further investigated.

288 Conclusion
5. Conclusion
The quality of enteric coats from aqueous dispersions of cellulose acetate phthalate,
prepared from either Aquateric or Aquacoat CPD and applied in a fluidized-bed
apparatus equipped with a Wurster column onto pellets of about 1 mm diameter,
seemed to be sensitive to the formulation, coating process and loading substrates.
Apparently, only a small region of a combination of a suitable formulation and suitable
coating conditions can result in CAP-coated pellets which are resistant to the artificial
gastric fluid (0.1 N HCl) in the pharmacopoeial test.
When a subcoat was used to hinder the possible chemical interaction between a basic
drug and the enteric, acidic polymer CAP one should also consider the property of the
subcoat-forming polymer itself. A subcoat from the hydrophilic polymer HPMC or a
PVA-rich polymer mixture of PVA and EC exhibited high swelling. In case of an enteric
coat of high permeability to water, this high swelling ability can accelerate the breakage
of the outer layer prepared from CAP. Moreover the nature of the subcoat can also have
an additional, negative effect on the outer layer. In the present study subcoats prepared
from the hydrophilic polymers HPMC or the hydrophilic mixture of PVA and EC (100 +
30 parts) resulted in an irregular and uneven outer CAP layer.
The different plasticizers used affected the film formation from aqueous dispersions of
CAP. The best film structure was received from a combination of CAP and the
hydrophilic triethyl citrate (TEC), and the worst film structure was obtained from a
combination of CAP and the hydrophobic dibutyl sebacate (DBS). These were
compared between the concentration of the substances and the coating conditions used
in this study.
When during the coating process a high air stream was used in order to avoid sticking
of the relatively light pellets, then dust was formed because of a spray drying of the
coating dispersion. In this present study the exhaust air filters were blocked after a short
time of operation. The application of a cyclone with a difference pressure as filter
system solved this technical problem.
None of the CAP-coated pellets prepared was sufficiently resistant to an artificial gastric
fluid (0.1 N HCl). CAP-coated pellets containing a subcoat or without any subcoat
began to release nicotinamide already during the first five minutes of the release test.
Conclusion 289 The fast release of nicotinamide from the CAP-coated pellets may also have been
supported by the high solubility of nicotinamide in water.
In summary several parameters including process air temperature, process air stream,,
pressure and volume stream of atomizing air, and spray rates must be monitored during
the Wurster-coating of pellets with aqueous dispersions of CAP. These parameters will
influence the product performance and need to be optimized for each polymeric system.
One simple yet expensive solution to obtain sufficient gastric resistance might be a
drastic increase in the film thickness.
Prospective idea for other further studies
PVA is a hydrophilic polymer and is available in different grades of acetate ester
content. The different grades of PVA will have different swelling properties. Since films
prepared from HPMC are reported to have a high swelling it would be of interest to
compare the resulting films to films prepared from HPMC.
In order to improve the film formation of CAP from aqueous dispersions, the
combination of plasticizers such as TEC and DEP or TEC and DBS together with CAP
should be investigated in the future.
Once the optimum combination of a suitable subcoat-forming polymer and a reliable
gastric-resistant coat from CAP has been established, the effect of the coating
conditions e.g. coating temperatures and humidities on the stability of the CAP-coated
pellets containing a basic drug should be studied.
It would also be of interest to investigate the chemical stability of the pellets with
different subcoats and coated with CAP. Possibly a suitable subcoat can be found
which will sufficiently retard the chemical interaction between a basic drug and an
acidic, enteric polymer in order to fulfil acceptable stability criteria.

290 References
6. References <1> ALDERMAN, D.A., 1984
A review of cellulose ethers in hydrophilic matrices for oral controlled-release dosage forms, Int.
J. Pharm. Tech & Prod. Mfr., 5, 3, 1-9
<2> ALKHALILI, N., MEAKIN, B.J., 1977
The chemical stability of polyvinyl alcohols, J. Pharm. Pharmacol., 29 (Suppl), 35P
<3> ALVAREZ-FEUENTES, J., CARABALLO, I., BOZA, A., LLERA, J.M., HOLGADO, M.A.,
FERNANDEZ-AREVALO, M., 1997
Study of a complexation process between naltrexone and Eudragit L as an oral controlled
release system, Int. J. Pharm. 148, 219-230
<4> ALVAREZ-FEUENTES, J., FERNANDEZ-AREVALO, M., HOLGADO, M.A., CARABALLO, I.,
LLERA, J.M., RABASCO, A.M., 1994
Morphine polymeric coprecipitates for controlled release: elaboration and characterization. Drug
Dev. Ind. Pharm. 20 (15), 2409-2424
<5> ANTAL, I., ZELKO, R., RÖCZEY, N., PLACHY, J., RACZ, I., 1997
Dissolution and diffuse reflectance characteristics of coated theophylline particles, Int. J.
Pharm., 155, 83-89
<6> AQOAT TECHNICAL INFORMATION. NO. A-1, 1992
Physical properties and film characteristics of hydroxypropyl methylcellulose acetate succinate,
Shin-Etsu Chemical Co., Ltd., Tokyo, Japan
<7> AQUACOAT CPD TECHNICAL INFORMATION, 1996
AQC/CPD1 10/96, FMC Corporation, Pharmaceutical Division, Philadelphia, USA
<8> AQUACOAT ECD HANDBOOK, SP1K792, 1985
FMC Corporation, Pharmaceutical and Bioscience Division, Philadelphia, USA
<9> AQUATERIC PRODUCT INFORMATION, AQT 04874 P SP, 1985
FMC Corporation, Pharmaceutical Division, Philadelphia, USA
<10> AULTON, M.E., HOGAN, J.E., TWITCHELL, A.M., 1997
Physical properties of HPMC solutions and their role in the film coating process and the quality
of the coated product, In Mc Ginity, J.W., (ed.), Aqueous polymeric coatings for pharmaceutical
dosage forms, Second Edition, Marcel-Dekker, Inc., New York, 227-266
<11> BARRA, J., SOMMA, R., 1996
Influence of the physicochemical variability of magnesium stearate on its Lubricant properties:
Possible solutions, Drug Dev. Ind. Pharm., 22, 11, 1105-1120
<12> BAUER, LEHMANN, OSTERWALD., 1988
Überzogene Arzneiformen, Wissenschaftliche Verlags-gesellschaft mbH, Stuttgart, Germany
<13> BAUMGARTNER, S., KRISTL, J., VRECER, F., VODOPIVES, P., ZORKO, B., 2000
Optimisation of floating matrix tablets and evaluation of their gastric residence time, Int. J.
Pharm., 195, 125-135
References 291 <14> BECHARD, S.R., LEVY, L., CLAS, S., 1995
Thermal, mechanical and functional properties of cellulose acetate phthalate (CAP) coating
obtained from neutralized aqueous solutions, Int. J. Pharm., 114, 205-213
<15> BECHTOLD, K., 1994
Stabilisierung der Enzymaktivität und Verfügbarkeit von Pankreatinpellets bei wäßriger
Befilmung mit magensaftresistenten Cellulosederivaten, Dissertation der Fakultät für Chemie
und Pharmazie der Ludwig-Maximilians-Universität München
<16> BECKERT, T., 1995
Verpressen von magensaftresistent überzogenen Pellets zu zerfallenden Tabletten, Dissertation
der Eberhard-Karls-Universität Tübingen
<17> BENGTSSON, I.S., LOEVGREN, K.I., 1997
Oral pharmaceutical formulations containing magnesium salt of omeprazole, Patent of Astra
Aktiebolag, Sweden, United States Patent No. 5690960
<18> BIANCHINI, R., RESCINITI, M., VECCHIO, C., 1991
Technological evaluation of aqueous enteric coating systems with and without insoluble
additives, Drug Dev. Ind. Pharm., 17, 13, 1779-1794
<19> BODEA, A. AND LEUCUTA, S.E., 1997
Optimization of propranolol hydrochloride sustained release pellets using a factorial design, Int.
J. Pharm., (154),1, 49-57
<20> BODMEIER, R., CHEN, H., 1991
Determination of the acidic degradation products, acetic, propionic, butyric and phthalic acid in
aqueous pseudolatexes of cellulosic esters by high performance liquid chromatography, Drug
Dev. Ind. Pharm., 17, 134, 1811-1822
<21> BODMEIER, R., GUO, X., PAERATAKUL, O., 1997
Process and formulation factors affecting the drug release from pellets coated with the
ethylcellulose-pseudolatex Aquacoat, In Mc Ginity, J.W., (ed.), Aqueous polymeric coatings for
pharmaceutical dosage forms, Second Edition, Marcel-Dekker, Inc., New York, 55-80
<22> BODMEIER,R., PAERATAKUL, O., 1997
Plasticizer uptake by aqueous colloidal polymer dispersions used for the coating of solid dosage
forms, Int. J. Pharm., 152, 17-26
<23> BODMEIER, R., PAERATAKUL, O., 1994
The effect of curing on drug release and morphological properties of ethylcellulose pseudolatex-
coated beads, Drug Dev. Ind. Pharm., 20, 9, 1517-1533
<24> BOURLAIS, C.A.L., TREUPEL-ACAR, L., RHODES, C.T., SADO, P.A., LEVERGE, R., 1995
New ophthalmic drug delivery systems, Drug Dev. Ind. Pharm., 21, 1, 19-59
<25> CARLIN, B., 2000
Personal contact with a specialist Mr. Brian Carlin, Global Manager, Pharma Applications, FMC
Bioloymer, 83 Avenue E Mounier, 1200 Brussels

292 References <26> CELLACEFATE, 2000
The United States Pharmacopeia (USP XXIV) / The National Formular (NF 19), Inc., USA, 2431
<27> CELLACEPHATE, 1993
British Pharmacopoeia (volume I), The British Pharmacopoeia Commission, London, United
Kingdom, 118-119
<28> CELLULOSE ACETATE PHTHALATE, 1995
The United States Pharmacopeia (USP XXIII) / The National Formular (NF 18), Inc., USA, 2233
<29> CELLULOSE ACETATE PHTHALATE, 1994
Handbook of Pharmaceutical Excipients, Second Edition, Wade, A., Weller, P.J., (Ed), The
Pharmaceutical Press, London, United Kingdom, 91-93
<30> CELLULOSEACETATEPHTHALAT, 1997
European Pharmacopoeia, Germany, 641-642
<31> CHANG, R.K., 1990
A comparison of rheological and enteric properties among organic solutions, ammonium salt
aqueous solutions, and latex systems of some enteric polymers, Pharm. Technol., 10, 62-70
<32> CHANG, R.K., ROBINSON, J.R., 1990
Sustained drug release from tablets and particles through coating, In Liebermann, H.A.,
Lachman, l., Schwartz, J.B., (ed.), Pharmaceutical dosage forms - Tablets, Second Edition, Vol.
3, Marcel-Dekker, Inc., New York, 199-302
<33> CHAWLA, V., TIWARY, A.K., GUPTA, S., 2000
Characterization of polyvinylalcohol microspheres of diclofenac sodium: Application of statistical
design, Drug Dev. Ind. Pharm., 26, 6, 675-680
<34> CHERRETTE, I., PLAIZIER-VERCAMMEN, J.A.., 1992
Evaluation of a water dispersion of aquateric for its enteric coating properties of hard gelatine
capsules manufactured with fluidzed bed technique, Pharm. Acta Helv. 67, 8, 227-230
<35> CHOPRA, S.K., 1983
Aqueous alcoholic dispersions of pH sensitive polymers and plasticizing agents and a solid
medicinal oral dosage form containing an enteric coating prepared by using them, Patent of
Merck Sharp and Dohme (I.A.) Corp., USA, United States Patent No. 4377568
<36> CHRISTENSEN, F.N., BERTELSEN, P., 1997
Qualitative Description of the Wurster-based fluid-bed coating process
Drug Dev. Ind. Pharm., 23, 5, 451-463
<37> COLLOIDAL ANHYDROUS SILICA, 1993
British Pharmacopoeia (volume I), The British Pharmacopoeia Commission, London, United
Kingdom, 594
<38> COLLOIDAL SILICON DIOXIDE, 2000
The United States Pharmacopeia (USP XXIV) / The National Formular (NF 19), Inc., USA, 2514
<39> COLOURS, 1999
Encyclopaedia of food science food technology and nutrition, volume II, 1164-1180

References 293 <40> CUMBERLAND, D.J., CRAWFORD, R.J. 1987
The packing of particles, Handbook of powder technology, Vol 6, Elsevier, Amsterdam,
Netherland, 16-20
<41> DAVIS, M.B., PECK, G.E., BANKER, G.S., 1986
Preparation and stability of aqueous-based enteric polymer dispersions
Drug Dev. Ind. Pharm., 12, 10, 1419-1448
<42> DAVIS, M., ICHIKAWA, I., WILLIAMS, E.J., BANKER, G.S., 1986
Comparison and evaluation of enteric polymer properties in aqueous solutions, Int. J. Pharm.,
28, 157-166
<43> DELPORTE, J.P., 1979
Effects of ageing on physico-chemical properties of free cellulose acetate phthalate films,
Pharm. Ind., 41, 10, 984-990
<44> DIBUTYL SEBACATE, 1994
Handbook of Pharmaceutical Excipients, Second Edition, Wade, A., Weller, P.J., (Ed), The
Pharmaceutical Press, London, United Kingdom, 158-159
<45> DIBUTYL SEBACATE, 1995
The United States Pharmacopeia (USP XXIII) / The National Formular (NF 18), Inc., USA, 2241
<46> DIETHYL PHTHALATE, 1994
Handbook of Pharmaceutical Excipients, Second Edition, Wade, A., Weller, P.J., (Ed), The
Pharmaceutical Press, London, United Kingdom, 167-168
<47> DIETHYL PHTHALATE, 1995
The United States Pharmacopeia (USP XXIII) / The National Formular (NF 18), Inc., USA, 2242
<48> DIETRICH, R., NEY, H., 1997
Pharmaceutical preparation in tablet or pellet form for pantoprazole and omeprazole, Patent of
Byk Gulden Lomberg Chemische Fabrik GmbH, Germany, Ger. Offen., DE 19752843A1
<49> DIETRICH, R., NEY, H., 1999
Tablet or pellet for acid-labile active medicaments, Patent of Byk Gulden Lomberg Chemische
Fabrik GmbH, Germany, WO 9927917
<50> Dissolution, 1995
The United States Pharmacopeia (USP XXIII) / The National Formular (NF 18), Inc., USA, 1791-
1793
<51> DOWN, G.R.B., BOOTH, S., 1993
The effect of pinholes on the dissolution behaviour of enteric-coated acetylsalicylic acid tablets,
Drug Dev. Ind. Pharm., 19, 20, 2743-2749
<52> Drug release, 2000
The United States Pharmacopeia (USP XXIV) / The National Formular (NF 19), Inc., USA,
2451-2452

294 References <53> ESHRA, A.G., 1982
Einfluß von sauer oder basisch reagierenden Modellsubstanzen auf die Stabilität von
Filmumhüllungen beim Wechsel von organischen auf wäßrige Herstellungsmethoden,
Dissertation, Universität Freiburg
<54> ETHYLCELLULOSE, 1994
Handbook of Pharmaceutical Excipients, Second Edition, Wade, A., Weller, P.J., (Ed), The
Pharmaceutical Press, London, United Kingdom, 186-190
<55> ETHYLCELLULOSE AND ETHYLCELLULOSE AQUEOUS DISPERSION, 2000
The United States Pharmacopeia (USP XXIV) / The National Formular (NF 19), Inc., USA
<56> ETHYLCELLULOSE, 1997
European Pharmacopoeia, Germany, 796-797
<57> FIEDLER, H.P., 1989
Lexikon der Hilfsstoffe für Pharmazie, Kosmetik und angrenzende Gebiete, Band 1 (A_K),
Gruppe II. Färbende Stoffe für die Färbung in der Masse und auf der Oberfläche von
Lebensmitteln, Dritte, überarbeitete und ergänzte Auflage, Editio Cantor Aulendorf, Aulendorf
<58> FROHOFF-HÜLSMANN, M., 1997
Wäßrige Ethylcellulosedispersionen mit Hydroxypropylmethylcellulose als Überzugsmaterial für
Arzneistoffpellets, Dissertation, Heinrich-Heine-Universität Düsseldorf
<59> FROHOFF-HÜLSMANN, M.A., SCHMITZ, A., LIPPOLD, B.C., 1999
Aqueous ethyl cellulose dispersions containing plasticizers of different water solubility and
hydroxypropyl methylcellulose as coating material for diffusion pellets I. Drug release rates from
coated pellets, Int. J. Pharm., 177, 69-82
<60> FUKUI, E., MIYAMURA, N., KOBAYASHI, M., 2001
Effect of magnesium stearate or calcium ctearate as additives on dissolution profiles of
diltiazem hydrochloride from press-coated tablets with hydroxy-propylmethylcellulose acetate
succinate in the outer shell, Int. J. Pharm., 216, 137-146
<61> FUKUI, E., MIYAMURA, N., YONEYAMA, T., KOBAYASHI, M., 2001
Drug release from and mechanical properties of press-coated tablets with
hydroxypropylmethylcellulose acetate succinate and plasticizers in the outer shell, Int. J.
Pharm., 217, 33-43
<62> GEOGHEGAN, E.J., MULLIGAN, S., PANOZ, D.E., 1990
Controlled-release diltiazem formulation, Patent of Elan Corp. PLC, Ireland, United States
Patent No. 4917899
<63> GILLIGAN, C.A., PO, A.L.W., 1991
Factors affecting drug release from a pellet system coated with an aqueous colloidal dispersion,
Int. J. Pharm., 73, 51-68
<64> GORDON, M.S., FRATIS, A., GOLDBLUM, R., JUNG, D., SCHWARTZ, K.E. AND CHOWHAN,
Z.T., 1995
In vivo and in vitro evaluation of four different aqueous polymeric dispersions for producing an
enteric coated tablet, Int. J. Pharm., 115, 29-34

References 295 <65> GUMOWSKI, F., DOELKER, E., GURNY, R., 1987
The use of a new redispersible aqueous enteric coating material, Pharm. Technol., 2, 26-32
<66> GÜNZLER, H., BÖCK, H., 1983
IR-Spektroskopie, Eine Einführung, 2nd Edition, Verlag Chemie, Weinheim, Germany
<67> HARRIS, M.R., GHEBRE-SELLASSIE, I., 1989
Aqueous polymeric coating for modified-release pellets, In Mc Ginity, J.W., (ed.), Aqueous
polymeric coatings for pharmaceutical dosage forms
Marcel-Dekker, Inc., New York, pp 63-79
<68> HASSAN, C.M., STEWART, J.E., PEPPAS, N.A., 2000
Diffusional characteristics of freeze/thawes poly(vinyl alcohol) hydrogel: Applications to protein
controlled release from multilaminate devices
Eur. J. Pharm. Biopharm., 49, 161-165
<69> HECKENMÜLLER, H., 1981
Untersuchungen zur Problematik magensaftresistenter Arzneiformen, Dissertation der Johann
Wolfgang Goethe Universität, Frankfurt am Main
<70> HEINÄMÄKI, J.T., IRAIZOZ COLARTE, A., NORDSTÖM, A.J., YLIRUUSI, J.K., 1994
Comparative evaluation of ammoniated aqueous and organic-solvent.based cellulose ester
enteric coating systems: a study on free films, Int. J. Pharm., 109, 9-16
<71> HEINÄMÄKI, J.T., LEHTOLA, V.M., NIKUPAAVO, P., YLIRUUSI, J.K., 1994
The mechanical and moisture permeability properties of aqueous – based hydroxypropyl
methylcellulose coating systems plasticized with polyethylene glycol, Int. J. Pharm., 112, 191-
196
<72> HESSE, M., MEIER, H., ZEEH, B., 1995
Spektroskopische Methoden in der organischen Chemie, 5th Eidition, Georg Thieme Verlag,
Stuttgart, Germany, pp 36-125
<73> HJÄRTSTAM, J., HJERTBERG, T., 1998
Swelling of pellets coated with a composite film containing ethyl cellulose and hydroxypropyl
methylcellulose, Int. J. Pharm., 161, 23-28
<74> HOCHDISPERSES SILICIUMDIOXID, 1997
European Pharmacopoeia, Germany, 1380
<75> HOLGADO, M.A., FERNANDEZ-AREVALO, M., ALVAREZ-FEUENTES, J., CARABALLO, I.,
LLERA, J.M., RABASCO, A.M., 1995
Physical characterization of carteolol: Eudragit binding interaction. Int.J.Pharm. 114, 13-21
<76> HYDRANAL – PRAKTIKUM, 1996
Wasserreagenzien nach Eugen Scholz für die Karl-Fischer-Titration, Riedel-de Haen, Seelze
<77> HYDROXYPROPYL METHYLCELLULOSE, PRODUCT INFORMATION, 95.9/1000
Pharmacoat – Film coating material and binder, Shin-Etsu Chemical Co., Ltd., Pharmaceutical
Materials Department, Tokyo, Japan

296 References <78> HYDROXYPROPYL METHYLCELLULOSE, 2000
The United States Pharmacopeia (USP XXIV) / The National Formular (NF 19), Inc., USA, 843-
844
<79> HYDROXYPROPYL METHYLCELLULOSE, 1994
Handbook of Pharmaceutical Excipients, Second Edition, Wade, A., Weller, P.J., (Ed), The
Pharmaceutical Press, London, United Kingdom, 229-232
<80> HYDROXYPROPYL METHYLCELLULOSE ACETATE SUCCINATE, PRODUCT
INFORMATION, 95.9/1000
Aqoat for aqueous enteric coating and aqueous sustained-release coating, Shin-Etsu Chemical
Co., Ltd., Tokyo, Japan
<81> KALA, H., TRAUE, J., MOLDENHAUER, H., ZESSIN, G., 1981
Zur Herstellung und Charakterisierung von Sprüheinbettungen, Pharmazie 36, 106-111
<82> KANE, Y., RAMBAUD, J., MAILLOLS, H., LAGET, J.P., GAUDY, D. AND DELONCA, H., 1993
Technological evaluation of three enteric coating polymers I. with an insoluble drug, Drug Dev.
Ind. Pharm., 19, 16, 2011-2020
<83> KARLSSON, A., SINGH, S.K., 1998
Thermal and Mechanical characterization of cellulose acetate phthalate films for pharmaceutical
tablet coating:Effect of humidity during measurement, Drug Dev. Ind. Pharm., 24, 9, 827-834
<84> KOKUBO, H.,
Recent advances in aqueous suspension coating with HPMCAS- New formulation of coating
suspension, Shin-Etsu Chemical Co., Ltd.
<85> KONDO, T., HAFEZ, E., ABDEL-MONEM, H., MURAMATSU, N., EL-HARRAS, S., EL-GIBALY,
I., 1996
Microencapsulation of sulphadiazine by water/oil/water complex emulsion technique, Pharm.
Ind., 58, 6, 552-556
<86> KRÄUTLE, T., 1991
Einfluß von Pankreatin auf die Stabilität magensaftresistenter Überzüge, Dissertation der
Ludwig-Maximilians-Universität, München
<87> KROGARS, K., HEINÄMÄKI, J., VESALAHTI, J., MARVOLA, M., ANTIKAINEN, O., YLIRUUSI,
J., 2000
Extrusion-spheronization of pH-sensitive polymeric matrix pellets for possible colonic drug
delevery, Int. J. Pharm., 199, 187-194
<88> LEHTOLA V.M., HEINÄMÄKI, J.T., NIKUPAAVO, P., TANNINEN, V.P., YLIRUUSI, J.K., 1995
Physical structure characterisation of aqueous - based hydroxypropyl methylcellulose films
plasticized with polyethylene glycol, Proceeding of the 14 th Pharmacy‘s Congress in Barcelona,
3-6 April, 520-527
<89> LEHTOLA V.M., HEINÄMÄKI, J.T., NIKUPAAVO, P., YLIRUUSI, J.K., 1995
Effect of some excipients and compression pressure on the adhesion of aqueous-based
hydroxypropyl methycellulose film coating to tablet surface, Drug Dev. Ind. Pharm., 21, 12,
1365-1375

References 297 <90> LI L.C., PECK G.E., 1997
Silicone elastomer latex dispersions, , In Mc Ginity, J.W., (ed.), Aqueous polymeric coatings for
pharmaceutical dosage forms, Second Edition, Marcel-Dekker, Inc., New York, 473-515
<91> LOVGREN, K.I., PILBRANT, A.G., YASUMURA, M., MORIGAKI, S., ODA, M., OHISHI, N.,
1988
Enteric-coated pellets containing omeprazole and an alkaline core and a water-soluble
subcoating, Patent of Aktiebolag Haessle, Sweden; Fujisawa Pharmaceutical Co., Ltd.;
Yoshitomi Pharmaceutical Industries, Ltd., United States Patent No. 4786505
<92> LUTROL E, TECHNISCHES MERKBLATT, MEF 124D.8117, 1988
BASF Aktiengesellschaft, Ludwigshafen, Germany
<93> LUTROL F127, 1998
Technical Information, ME 254 d, März 1998, BASF Aktiengesellschaft, Ludwigshafen,
Germany
<94> MAGNESIUM STEARATE, 1994
Handbook of Pharmaceutical Excipients, Second Edition, Wade, A., Weller, P.J., (Ed), The
Pharmaceutical Press, London, United Kingdom, 280-282
<95> MC PHILLIPS, H., CRAIG, D.Q.M., ROYALL, P.G., HILL, V.L., 1999
Characterisation of the glass transition of HPMC using modulated temperature differential
scanning calorimetry, Int. J. Pharm., 180, 83-90
<96> MEAKIN, B.J., 1975
The chemical stability of polyvinyl alcohol, J. Pharm. Pharmacol., 27 (Suppl), 11P
<97> MEHTA, A.M., 1989
Processing and equipment considerations for aqueous coatings, In Mc Ginity, J.W., (ed.),
Aqueous polymeric coatings for pharmaceutical dosage forms, Marcel-Dekker, Inc., New York,
267-302
<98> MEHTA, A.M., VALAZZA, M.J., ABELE, S.E., 1986
Evaluation of fluid-bed processes for enteric coating systems
Pharm. Technol., 4, 46-56
<99> METHYL ORANGE, 1981
Aldrich, IR-Spectra, Spectrum B
<100> METHYL ORANGE, 1989
The Merck Index 11 th edition, Merck & Co., Inc, USA, 959
<101> METHYL ORANGE, 1993
British Pharmacopoeia (volume II), The British Pharmacopoeia Commission, London, United
Kingdom, A41
<102> METHYL ORANGE, 1995
The United States Pharmacopeia (USP XXIII) / The National Formular (NF 18), Inc., 2048
<103> METHYLORANGE, 1999
Hagers Handbuch der pharmazeutischen Praxis, Springer-Verlag, Berlin, Germany, 166

298 References <104> METHYLORANGE, 1985
Römpps Chemie-Lexikon, 8. Auflage, Franckh‘ sche Verlagshandlung, Stuttgart, Germany,
2592
<105> MOLDENHAUER, H., KALA, H., ZESSIN, G., NAUENBURG, G., 1974
Untersuchungen über den Einsatz von Polyvinylalkohol (PVA) zur Erzielung zuckerhaltiger und
zuckerfreier Drageeüberzüge, Pharmazie 29, 26-31
<106> NAGAI, T., SEKIGAWA, F., HOSHI, N., 1989
Application of HPMC and HPMCAS aqueous film coating of pharmaceutical dosage forms, In
Mc Ginity, J.W., (ed.), Aqueous polymeric coatings for pharmaceutical dosage forms, Marcel-
Dekker, Inc., New York, 81-152
<107> NAGARSENKER, M.S., HEGDE, D.D., 1999
Optimization of the mechanical properties and water-vapor transmission properties of free films
of hydroxypropylmethylcellulose, Drug Dev. Ind. Pharm., 25, 1, 95-98
<108> NAKAMICHI, K., YASUURA, H., FUKUI H., OKA, M., IZUMI, S., 2001
Evaluation of floating dosage form of nicardipine hydrochloride and
hydroxypropylmethylcellulose acetate succinate prepared using a twin-screw extruder, Int. J.
Pharm., 218, 103-112
<109> NGUYEN, M., 1999
Stabilität magensaftresistenter Filmtabletten mit Pantoprazol-Natrium-Sesquihydrat als
Modellsubstanz unter klimatischer Belastung, Dissertation der Universität Hamburg
<110> NIACINAMIDE, 1995
The United States Pharmacopeia (USP XXIII) / The National Formular (NF 18), Inc., USA, 1082
<111> NIACINAMIDE, 1983
The Merck Index 10 th edition, Merck & Co., Inc, USA, 6329
<112> NICOTINAMIDE, 1989
Martindale, The Extra Pharmacopoeia, The 29 th edition, Reynold, J.E.F. (ed.), The
Pharmaceutical Press, London, United Kingdom, 1268
<113> NICOTINAMIDE, 1988
British Pharmacopoeia (volume I), The British Pharmacopoeia Commission, London, United
Kingdom, 388
<114> NYQVIST, H., 1983
Saturated salt solutions for maintaining specified relative humidities
Int. J. Pharm. Tech & Prod. Mfr., 4, 2, 47-48
<115> OBARA, S., MARUYAMA, N., NISHIYAMA, Y., KOKUBO, H., 1999
Dry coating: an innovative enteric coating method using a cellulose derivative
Eur. J. Pharm. Biopharm., 47, 51-59
<116> OBARA, S., MC GINITY, J.W., 1994
Properties of free films prepared from aqueous polymers by a spraying technique, Pharm. Res.,
11, 11, 1562-1567

References 299 <117> OBARA, S., MC GINITY, J.W., 1995
Influence of processing variables on the properties of free films prepared from aqueous
polymeric dispersions by a spray technique, Int. J. Pharm., 126, 1-10
<118> O´DONNELL, P.B., MC GINITY, J.W., 1997
Mechanical properties of polymeric films prepared from aqueous polymeric dispersions, In Mc
Ginity, J.W., (ed.), Aqueous polymeric coatings for pharmaceutical dosage forms, Second
Edition, Marcel-Dekker, Inc., New York, 517-548
<119> OKHAMAFE, A.O., YORK, P., 1985
Studies on the moisture permeation process in some pigmented aqueous-based tablet film
coats, Pharm. Acta Helv., 60, 3, 92-96
<120> OPERATING INSTRUCTIONS, 1987
Aeromatic MP-1, Kom-No. 889013, Aeromatic fielder AG, Bubendorf, Switzerland
<121> OSCHMANN, R., 1985
Untersuchungen zur Lagerstabilität, Säureresistenz und Freisetzungskinetik
magensaftresistenter Überzüge, Dissertation der Ludwig-Maximilians-Universität, München
<122> PARIKH, D.M., 1991
Airflow in batch fluid-bed processing, Pharm. Technol., 3, 100-110
<123> PARIKH, D.M., 1998
Current issues and troubleshooting fluid bed granulation, Pharm. Technol. Eur., 5, 42-48
<124> PETER, K., 1994
Untersuchungen zur Beeinflussung der Eigenschaften von Ethylcellulosefilmen durch
Carboxylgruppenhaltige Polymere, Diplomarbeit, Martin-Luther-Universität Halle-Wittenberg
<125> PHOSPHATE BUFFER, 0.025 M STANDARD, 1993
British Pharmacopoeia (volume I), The British Pharmacopoeia Commission, London, United
Kingdom, A 79
<126> PHOSPHATE BUFFER, PH 6.8, 1995
The United States Pharmacopeia (USP XXIII) / The National Formular (NF 18), Inc., USA, 2050
<127> PHTHALIC ACID, 1993
British Pharmacopoeia (volume II), The British Pharmacopoeia Commission, London, United
Kingdom, A50
<128> PHTHALIC ACID, 1995
The United States Pharmacopeia (USP XXIII) / The National Formular (NF 18), Inc., USA, 2028
<129> PHTHALIC ACID, 1979
The Sadtler Handbook of Ultraviolet Spectra, in William, W. S., (ed.), Research Laboratories,
Inc., Pennsylvania, USA, 753
<130> PLAIZIER-VERCAMMEN, J.A. AND STEPPE, K., 1992
Evaluation of enteric coated capsules coated with ammoniated water solution of cellulose
acetate phthalate and cellulose acetate trimellitate, Pharm. Ind., 54, 12, 1050-1052

300 References <131> PLAIZIER-VERCAMMEN, J., VAN MOLLE, M., STEPPE, K., CHERRETTE, I., 1992
Enteric coating properties of Eudragit, Aquateric and cellulose acetate trimellitate applied to
capsules, Eur. J. Pharm. Biopharm., 38, 4, 145-149
<132> POLOXAMER, 1994
Handbook of Pharmaceutical Excipients, Second Edition, Wade, A., Weller, P.J., (Ed), The
Pharmaceutical Press, London, United Kingdom, 352-354
<133> POLOXAMER, 1995
The United States Pharmacopeia (USP XXIII) / The National Formular (NF 18), Inc., USA, 2279-
2281
<134> POLOXAMER, TECHNICAL INFORMATION, ME 254 D, 1994
Lutrol F 127, Verdickungsmittel und Gelbildner für die pharmazeutische Industrie, BASF
<135> POLYETHYLENE GLYCOL, 1994
Handbook of Pharmaceutical Excipients, Second Edition, Wade, A., Weller, P.J., (Ed), The
Pharmaceutical Press, London, United Kingdom, 355-361
<136> POLYETHYLENE GLYCOL, 1995
The United States Pharmacopeia (USP XXIII) / The National Formular (NF 18), Inc., USA, 2281-
2283
<137> POLYSORBATE 80, 2000
The United States Pharmacopeia (USP XXIV) / The National Formular (NF 19), Inc., USA, 2502
<138> POLYSORBATE 80, 1997
European Pharmacopoeia, Germany, 1285-1286
<139> POLYSORBATE 80, 1993
British Pharmacopoeia (volume II), The British Pharmacopoeia Commission, London, United
Kingdom, A51
<140> POLYVINYL ALCOHOL 2000
The United States Pharmacopeia (USP XXIV) / The National Formular (NF 19), Inc., USA,
1352-1354
<141> POLYVINYL ALCOHOL, 1994
Handbook of Pharmaceutical Excipients, Second Edition, Wade, A., Weller, P.J., (Ed), The
Pharmaceutical Press, London, United Kingdom, 383-384
<142> POLYVINYL ALCOHOL, 1999
Product information Mowiol, Clariant GmbH, Division CP, Sulzbach, December
<143> PORTER, S.C., BRUNO, C.H., 1990
Coating of pharmaceutical solid-dosage forms, In Liebermann, H.A., Lachman, l., Schwartz,
J.B., (ed.), Pharmaceutical dosage forms - Tablets, Second Edition, Vol. 3, Marcel-Dekker, Inc.,
New York, 77-160
<144> PORTER, S.C., RIDGWAY, K., 1982
The permeability of enteric coatings and the dissolution rates of coated tablets, J. Pharm.
Pharmacol., 34, 5-8

References 301 <145> PORTER, S.C., RIDGWAY, K., 1983
An evaluation of the properties of enteric coating polymers: measurement of glass transition
temperature, J. Pharm. Pharmacol., 35, 341-344
<146> QUINTANAR-GUERRERO, D., GANEM-QUINTANAR, A., RAYGOZA-TREJO, D., DOELKER,
E., 1999
Relationship between the swelling process and the release of a water-soluble drug from a
compressed swellable-soluble matrix of poly(vinyl alcohol), Drug Dev. Ind. Pharm., 25, 2, 169-
174
<147> RAFFIN, F., DURU, C., JACOB, M., 1996
Permeability to hydrogen ions of an enteric coating polymer and interaction of film formation
factors, Int. J. Pharm., 145, 247-252
<148> RAFFIN, F., DURU, C., JACOB, M., SISTAT, P., SANDEAUX, J., SANDEAUX, R.,
POURCELLY, G., GAVACH, C., 1995
Physico-chemical characterization of the ionic permeability of an enteric coating polymer, Int. J.
Pharm., 120, 205-214
<149> REKHI, G.S., MENDES, R.W., PORTER, S.C., JAMBHEKAR, S.S., 1989
Aqueous polymeric dispersions for controlled drug delivery – Wurster process, Pharm. Technol.,
3, 112-125
<150> RHODES, C.T., PORTER, S.C., 1998
Coating of controlled-release drug delivery systems, Drug Dev. Ind. Pharm., 24, 12, 1139-1154
<151> RITTHIDEJ, G.C., PHAECHAMUD, T., KOIZUMI, T., 2000
Additives in moist-heat-treated chitosan acetate films: a method to extend the release of
propanolol hydrochloride-coated tablets, S.T.P. Pharm. Sci., 10, 1, 112-119
<152> RODRIGUEZ, L., GRECCHI, R., CINI, M., CAPUTO, O., VECCHIO, C., 1995
Variation of operational parameters and process optimization in aqueous film coating, Pharm.
Technol. Eur., 12, 20-26
<153> ROTH, H.J., BLASCHKE, G., 1989
Pharmazeutische Analytik, 3., überarbeitete Auflage, Georg Thieme Verlag, Stuttgart
<154> ROWE, R.C., 1997
Defects in aqueous film-coated tablets, In Mc Ginity, J.W., (ed.), Aqueous polymeric coatings for
pharmaceutical dosage forms, second edition, Marcel-Dekker, Inc., New York, pp 419-440
<155> ROXIN, P., KARLSSON, A., SINGH, S.K., 1998
Characterization of cellulose acetate phthalate (CAP), Drug. Dev. Ind. Pharm. 24, 11, 1025-
1041
<156> RUBENSDÖRFER, C., 1993
Einsatz und Charakterisierung von Ludipress als Direkttablettierhilfsmittel, Dissertation der
Fakultät für Chemie und Pharmazie der Eberhard-Karls-Universität Tübingen
<157> RÜCKER, G., NEUGEBAUER, M., WILLEMS, G.G., 1992
Instrumentelle pharmazeutische Analytik, 2., überarbeitete und erweiterte Auflage,
Wissenschaftliche Verlagsgesellschaft mbH, Stuttgart

302 References <158> RUTZ, J., 1991
Entwicklung eines Verfahrens zur Herstellung von Arzneimittelüberzügen aus wäßrigen
Polymersuspensionen, Dissertation der Westfälische Wilhelms-Universität Münster
<159> SADEGHI, F., FORD, J.L., RUBINSTEIN, M.H., RAJABI-SIAHBOOMI, A.R., 2000
Comparative study of drug release from pellets coated with HPMC or Surelease, Drug Dev. Ind.
Pharm., 26, 6, 651-660
<160> SAKELLARIOU, P., HASSAN, H., ROWE, R.C., 1994
Plasticization and interactions of polyethylene glycol 6000 with hydroxypropyl
methylcellulose/polyvinyl alcohol blends, Int. J. Pharm., 102, 207-211
<161> SAKELLARIOU, P., ROWE, R.C., WHITE, E.F.T., 1985
The thermomechanical properties and glass transition temperatures of some cellulose
derivvatives used in film coating, Int. J. Pharm., 27, 267-277
<162> SALSA, T., VEIGA, F., PINA, M.E., 1997
Oral controlled-release dosage forms. I. Cellulose ether polymers in hydrophilic matrices, Drug
Dev. Ind. Pharm., 23, 9, 929-938
<163> SARISUTA, N., KUMPUGDEE, M., MÜLLER, B.W., PUTTIPIPATKHACHORN, S., 1999
Physico-chemical characterization of interactions between erythromycin and various film
polymers, Int. J. Pharm., 186, 109-118
<164> SCHEIFFELE, S., KOLTER, K., SCHEPKY, G., 1998
Studies comparing Kollicoat MAE 30 D with commercial cellulose derivatives for enteric coating
on caffeine cores, Drug Dev. Ind. Pharm., 24, 9, 807-818
<165> SCHIERZ, I., 1987
Herstellung und Eigenschaften von mit wäßrigen Lösungen magensaftresistenter Polymere in
der Wirbelschicht Überzogenen Filmtabletten, Dissertation der Freien Universität Berlin
<166> SCHLAGETER, A., 1992
Einfluß von Dispersions- und Lösungsmitteln sowie anderer Überzugskomponenten auf das
Resistenz- und Stabilitätsverhalten magensaftresistenter Filmüberzüge, Dissertation der
Fakultät für Chemie und Pharmazie der Ludwig-Maximilians-Universität München
<167> SCHMID, S., MÜLLER-GOYMANN, C.C., SCHMIDT, P.C., 2000
Interactions during aqueous film coating of ibuprofen with Aquacoat ECD
Int. J. Pharm., 197, 35-39
<168> SCHMIDT, P.C., NIEMANN, F., 1992
The MiniWid-coater: I. Design and evaluation of a temperature-controlled miniature fluid-bed
pan coater, Drug Dev. Ind. Pharm., 18, 17, 1907-1919
<169> SCHMIDT, P.C., NIEMANN, F., 1992
The MiniWid-coater: II. Comparison of acid resistance of enteric-coated bisacodyl pellets coated
with diffeent polymers, Drug Dev. Ind. Pharm., 18, 18, 1969-1979
<170> SCHMIDT, P.C., TEUBER, K., 1991
Magensaftresistenz-gibt es die überhaupt?, Pharmazie in unserer Zeit, 4, 164-178

References 303 <171> SEPIFILM, 1993
Pharmaceutical film coating-Sepifilm concept, P/0319/GB-F/01/August, Seppic, Paris, France
<172> SEPIFILM LP, 1994
Product information-Concept Sepifilm, P/0397/GB-F/02/December, Seppic, Paris, France
<173> SHAH, D., SHAH, Y., PRADHAN, R., 1997
Development and evaluation of controlled-release diltiazem HCl microparticles using cross-
linked poly(vinyl alcohol), Drug Dev. Ind. Pharm., 23, 6, 567-574
<174> SHLIEOUT, G., 1998
Investigation of the elastic behaviour of polyvinyl alcohol by using the thermal mechanical
analysis and the multiple compression, Arch. Pharm. Pharm. Med. Chem., 331, Suppl. 2, 52
<175> SHLIEOUT, G., 2000
Investigation of the mechanical properties of two polyvinyl alcohols and their influence on drug
release, Drug Dev. Ind. Pharm., 26, 5, 499-505
<176> SPITAEL, J., KINGET, R., 1979
Solubility and dissolution rate of enteric polymers, Acta. Pharm. Techno., Suppl 7, 163-168
<177> SPITAEL, J., KINGET, R., 1977
Factors affecting the dissolution rate of enteric coatings, Pharm. Ind., 39, 5, 502-505
<178> SPITAEL, J., KINGET, R., NAESSENS, K., 1980
Dissolution rate of cellulose acetate phthalate and the Brönsted catalysis law
Pharm. Ind., 42, 8, 846-849
<179> STEUERNAGEL, C.R., 1989
Latex emulsions for controlled drug delivery, In Mc Ginity, J.W., (ed.), Aqueous polymeric
coatings for pharmaceutical dosage forms, Marcel-Dekker, Inc., New York, USA, 1-61
<180> STRICKER, H., 1987
Physikalische Pharmazie, Pharmazeutische angewandte physikalisch-chemische Grundlagen,
3., Auflage, Wissenschaftliche Verlagsgesellschaft mbH, Stuttgart, Germany
<181> SUGAR SPHERES, 2000
The United States Pharmacopeia (USP XXIV) / The National Formular (NF 19), Inc., USA, 2529
<182> TALC, 1986
Handbook of Pharmaceutical Excipients, Lund, W., Wade, A., Weir, R.F., Yates, B.J., (Ed), The
Pharmaceutical Society of Great Britain, United Kingdom, 321-324
<183> TALC, 1994
Handbook of Pharmaceutical Excipients, Second Edition, Wade, A., Weller, P.J., (Ed), The
Pharmaceutical Press, London, United Kingdom, 519-521
<184> TEUBER, K., 1990
Herstellung und Charakterisierung stark quellender Gelatinederivate, Dissertation der Fakultät
für Chemie und Pharmazie der Eberhard-Karls-Universität Tübingen
<185> THOMA, K., BECHTOLD, K., 1999
Influence of aqueous coating on the stability of enteric coated pellets and tablets, Eur. J. Pharm.
Biopharm., 47, 39-50

304 References <186> THOMA, K., KRÄUTLE, T., 1999
Einfluss von Pankreatin auf die Stabilität magenschaftresistenter Überzüge 1. Mitteilung:
Einfluss magensaftresistenter Filmüberzüge auf das Resistenz- und Zerfallsverhalten von
Pankreatin- Filmtabletten, Pharm. Ind., 61, 1, 79-87
<187> THOMA, K., KRÄUTLE T., 1999
Einfluss von Pankreatin auf die Stabilität magenschaftresistenter Überzüge 2. Mitteilung:
Lagerstabilität magensaftresisten-überzogener Filmtabletten, Pharm. Ind., 61, 2, 184-193
<188> THOMA, K., KRÄUTLE T., 1999
Einfluss von Pankreatin auf die Stabilität magenschaftresistenter Überzüge 3. Mitteilung:
Lagerstabilität magensaftresisten-überzogener Pankreatin-Fertigarzneimittel, Pharm. Ind., 61, 3,
270-275
<189> THOMA, K., KRÄUTLE T., 1999
Einfluss von Pankreatin auf die Stabilität magenschaftresistenter Überzüge 4. Mitteilung:
Nachweis lagerungsbedingter Alterungsvorgänge bei magensaftresistenten Filmen, Pharm.
Ind., 61, 4, 377-383
<190> THOMA, K., OSCHMANN, R., 1992
Einflußfaktoren auf die Lagerstabilität magensaftresistenter Fertigarzneimittel unter
Temperaturbelastung 8. Mitteilung: Über pharmazeutisch technologische und analytische
Untersuchungen an magensaftresistenten Darreichungsformen, Pharmazie 47, 595-601
<191> THOMA, K., OSCHMANN, R., PIRINGER, O., 1992
Nachweis lagerungsbedingter Alterungsvorgänge bei magensaftresistenten Filmen durch
gesteuerte Pyrolyse und IR-spektroskopische Untersuchungen 7. Mitteilung: Über
pharmazeutisch-technologische und analytische Untersuchungen an magensaftresistenten
Darreichungsformen, Pharmazie 47, 355-362
<192> TITANIUM DIOXIDE, 1994
Handbook of Pharmaceutical Excipients, Second Edition, Wade, A., Weller, P.J., (Ed), The
Pharmaceutical Press, London, United Kingdom, 529-531
<193> TRIETHYL CITRATE, 1995
The United States Pharmacopeia (USP XXIII) / The National Formular (NF 18), Inc., USA, 2316
<194> TRIETHYL CITRATE, 1994
Handbook of Pharmaceutical Excipients, Second Edition, Wade, A., Weller, P.J., (Ed), The
Pharmaceutical Press, London, United Kingdom, 540-541
<195> VECCHIO, C., FABIANI, F., GAZZANIGA, A., 1995
Use of colloidal silica as a separating agent film forming processes performed with aqueous
dispersion of acrylic resins, Drug Dev. Ind. Pharm., 21, 15, 1781-1787
<196> WAN, L.S.C., HENG, P.W.S., WONG, L.F., 1991
The effect of hydroxypropylmethylcellulose on water penetration into a matrix system, Int. J.
Pharm., 73, 111-116

References 305 <197> WEIß, G., 1991
Mikroverkapselung von Ibuprofen mit magensaftresistenten Polymeren durch einfache
Koazervation, Dissertation der Universität Regensburg
<198> WERNER, D.W.,
Pellets-eine moderne Arzneiform mit vielfältigen Anwendungsmöglichkeiten
Informationsblatt H.G. Werner GmbH & Co. Drageefabrik, Tornesch
Sonderdruck aus Pharma International
<199> WERNER, D., 1996
An evaluation of the sorption characteristics of pellets - A valuable instrument for stability
considerations, Pharm.Tech Eur., 8, 9, 30-36
<200> WILLIAMS III, R.O., LIU, J., 2000
Influence of processing and curing conditions on beads coated with an aqueous dispersion of
cellulose acetate phthalate, Eur. J. Pharm. Biopharm. 49, 243-252
<201> WILLIAMS, D.H., FLEMING, I., 1991
Strukturaufklärung in der organischen Chemie, 6th Edition, Georg Thieme Verlag, Stuttgart
<202> WU, C., MC GINITY, J.W., 1999
Non-traditional plasticization of polymeric films, Int. J. Pharm., 177, 15-27
<203> WU, C., MC GINITY, J.W., 2000
Influence of relative humidity on the mechanical and drug release properties of theophylline
pellets coated with an acrylic polymer containing methylparaben as a non-traditional plasticizer,
Eur. J. Pharm. Biopharm., 50, 277-284
<204> WU, S.H., 1996
Chemistry and applications of enteric coating polymers for solid dosage forms, Product
information from the Technical Service and Development Division, Eastman Chemical
Company, Kingsport, Tennessee 37662, USA
<205> WU, S.H.W., WYATT, D.M., ADAMS, M.W., 1997
Chemistry and applications of cellulosic polymers for enteric coatings of solid dosage forms, In
Mc Ginity, J.W., (ed.), Aqueous polymeric coatings for pharmaceutical dosage forms, Second
Edition, Marcel-Dekker, Inc., New York, 385-418
<206> WURSTER, D.E., 1990
Particle-coating methods, In Liebermann, H.A., Lachman, l., Schwartz, J.B., (ed.),
Pharmaceutical dosage forms - Tablets, Second Edition, Vol. 3, Marcel-Dekker, Inc., New York,
161-198
<207> YANG, S.T., GHEBRE-SELLASSIE, I., 1990
The effect of product bed temperature on the microstructure of Aquacoat-based controlled-
release coatings, Int. J. Pharm., 60, 109-124

306 List of instruments and software
7. List of instruments and software
{1} Analytical balance, Delta Range, Type AE 166/9,Mettler AE 166, Range 162 g
with E 0.1 mg, Mettler Waagen GmbH, Gießen
{2} Analytical balance, Sartorius Elektronische Analysenwaagen, Model 1712 MP8,
Range 30 g / 160 g with E 0.01 mg / 0.1 mg, Sartorius GmbH, Göttingen
{3} Analytical balance, Sartorius Elektronische Analysenwaagen, Model 1615 MP,
Range 80 g / 300 g with E 0.1 mg / 1 mg, Sartorius GmbH, Göttingen
{4} Analytical sieve from stainless steel, size 200 mm x 50 mm, mesh width of 800,
1000, 1120, 1250, 1400, 1600 µm, F. Kurt Retsch GmbH & Co.KG, Haan
{5} Barometer, Parath Funk Wetterstation
{6} Barometer, Baratron, Unit PS/DVM, Type PAR-2
(PDR-C1A, Inv Nr. 550) Serial 29214, MKS Instrument Inc.,
Burlington MA, USA, with a pressure gauge, Unit DIF Gauge, Range 1000 Torr,
Input +15 VDC, Typ 223AH-A-1K, Serial 41416, Output 0-1 VDC, MKS
Instrument Inc, Burlington MA, USA
{7} Barometer, Magnehelic, Dwyer Instruments Inc., Mich City, Ind, USA
{8} Calliper rule, E 0.05 mm, Type Horex, Preisser, Blet, Paris, France
{9} Camera with a 55 mm f 3.5, AF Macro Lens by Nikon, Japan with an adapter,
C-Mount, No. 31602, Hama
{10} Cabinet for controlling temperature at 25 °C, Type 2105 Köttermann,
Hänningsen, Hannover
{11} Cuvettes, normal opening, Quartz QS, 1.0 cm, Hellma GmbH & Co., Müllheim
{12} Cuvettes, flow through, Quartz QS, 1.0 cm, Hellma GmbH & Co., Müllheim
{13} Cyclone from the spray dryer, Mobile Minor Spray Dryer, Centrifugal Atomizer
Type M-02/a, A/S Niro Atomizer, Kopenhagen, Denmark
{14} Data recording device, Linseis LSB36-III, Linsesis GmbH, Selb
{15} Dehumidifying unit, Luftbehandlungseinheit No. 94131175, Aeromatic Fielder
AG, Bubendorf, Switzerland
{16} Digital balance, Type Portable PT2100, Range 2500 g with E 0.01 g, Sartorius,
Otto Steiner GmbH, Hamburg
{17} Digital balance, MP8 Type 1907004, Range 500 g / 5550 g with E 0.01 g / 0.1 g,
Sartorius, Göttingen coupled with a digital/analog converter, Type YDA 01Z,
Sartorius, Göttingen
List of instruments and software 307
{18} Dissolution test apparatus, Prolabo, No. 63761, Paris, France
{19} Fluidized bed apparatus Uniglatt Modell, Glatt GmbH Process Technology,
Binzen
{20} Fluidized bed apparatus, Niro-Aeromatic Multiprozessor, Type MP-1, Powder
coater, Aeromatic Fielder AG, Bubendorf, Switzerland
{21} Flow-meter for atomizing air, HI-TEC / EL-Flow Mass Flowmeter, Model F-
112AC-HD-44-V, measurement range 2-100 ln/min at 20 °C, output 4-20 mA,
Mättig Mess- und Regeltechnik Vertriebs-GmbH, Unna
{22} Flow-meter for process air, Flowtec DMV 6336, Swingwire II, measurement
range 54.2-630 m3/h at 20 °C, output 4-20 mA, with a transformer Omnigrad
VU 2650, Endress+Hauser Meßtechnik GmbH & Co., Weil am Rhein
{23} Flow-meter for process air, integrated at Aeromatic MP-1, Dwyer Instruments
Inc., Mich City, Ind, USA
{24} FTIR-spectroscopy, Genesis Series FTIR, Resolution 4.0, ATI Mattson
Analytical Technology, Inc., Cambridge, Great Britain
{25} Hot air oven, Type B 5050 E, at the temperature of 30, 35, 40, 45, 50, or 60 °C,
Heraeus, Hanau
{26} Hot air oven, built-in type, at the temperature of 70 and 80 °C, Heraeus, Hanau
{27} HPLC-Autosampler, Type HPMC 360, Kontron Instrument, Neufahrn
{28} HPLC-Colume, Type Nucleosil, 250x4.6, C18, BA 268, particle size 5 µm,
Dr.Herbert Knauer KG, Bad Homburg v.d.H.
{29} HPLC-Degassing Unit Form, Type X-ACT, 4 Channel, Jour Reseach, Onsala,
Sweden
{30} HPLC-Detector, Type BT 8200, Range 0.005, Wavelength: 210 nm, HPLC
UV/VIS Detector, Biotronik, Maintal
{31} HPLC-Pump, Type Thermo Separation Products, Spectra Series P100,
Darmstadt
{32} Hydraulic tablet press for IR-technique, Beckman, München
{33} Hygrometer, Hygrolog WMT 170 and Betasensor DT13, Inline-Meßlinie, dew
point and temperature measurement apparatus for gas, Endress+Hauser
Meßtechnik GmbH & Co., Weil am Rhein
{34} Hygrometer, Humidat IC II, couples with a sensor enBS-4/IC, Novasina, Zürich,
Switzerland

308 List of instruments and software {35} Image analyser: hardware, Matrox Image Processing Products, Carl Zeiss
Vision GmbH 1997, Eching bei München
{36} Image analyser: monitor, Sony Trinitron Color Graphic Display, Multiscan 17 SE
II, GDM-17 SE2T5, Serial No. 6316606, Sony Deutschland, Köln-Ossendorf
{37} Image analyser: digital camera, Hitachi 3-CCD Color Camera, Model HV-
C20E/K-S4, No. 7072620, Hitachi Denshi GmbH, Rodgau
{38} Jet-mill, Luftstrahlmühle Type Forschung 1047, Bauermann & Co., Sohlingen-
Ohlip
{39} Karl-Fischer Titration machine composed of a pH Meter (PHM 62 Standard),
Autoburette (ABU 80), and a Titrator (TTT 60), Radiometer, Copenhagen,
Denmark
{40} Light microscope, Type Orthoplan, Serial No. 759225, Ernst Leitz GmbH,
Bensheim with an adapter, C-Mount 0.63x, Leica Mikroskopic und Systeme
GmbH, Wetzlar
{41} Light microscope, Wild M3, Type 352873, Heerbrugg, Switzerland with an
adapter, C-Mount 0.63x, Leica Mikroskopic und Systeme GmbH, Wetzlar and
coupled with a ring light source, Schott, Mainz
{42} Light source, two tubes, Type KL 150 B, Schott, Mainz
{43} Magnetic stirrer IKA-KMO, Janke & Kunkel GmbH & Co. KG, Staufen
{44} Magnetic stirrer with heater, Cenco Instrument MU.N.V. Breda, The Netherland
{45} Mixer for powder, Type KU1, No. 3142161, Erweka-Apparatebau GmbH,
Offenbach
{46} Mixer for fluid, Ultra turrax, IKA-Ultra-Turrax, Type 45, No. 6893, Dargatz
{47} NMR-scpectroscopy, AMX400, Bruker Analytik GmbH, Rheinstetten
{48} Nozzle for fluid, diameter 1.2 mm, 1.0 mm, and 0.8 mm, Schlick GmbH,
Untersiemau
{49} Objectmicrometer for calibration, No. 10310345, 50 mm, one section = 0.1 mm,
Leica Mikroskopic und Systeme GmbH, Wetzlar
{50} Objectmicrometer for calibration, 1 mm, one section = 0.01 mm, Leica
Mikroskopic und Systeme GmbH, Wetzlar
{51} Peristaltic pump, No. 71844, Desaga, Heidelberg
{52} Perforated bottoms with free holes of 6.0, 8.0, 11.0, 13.0, 20.0 % compared to
all possible flow region, Universität Hamburg
{53} pH-Meter Type E 512, Metrohm AG, Herisau, Switzerland

List of instruments and software 309
{54} Printer, Type Pinwriter P60, NEC Deutschland, München
{55} Scanning electron microscope, Cam Scan DV4, Cambridge Scanning Comp.
Ltd., Cambridge, England
{56} Scanning electron microscope, Leo 1525 Gemini, Zeiss, Oberkochen, Germany
{57} Scalpel, disposable and sterile, Cutfix, Charge No. 96L2498, B.Braun
Melsungen AG, Melsungen
{58} Sieve machine, Type 2D, Laboratory sieving machine plan with rotary plan
movement, F. Kurt Retsch GmbH & Co.KG, Haan
{59} Spherical balls, diameter of 1 mm, Type RB-1/G20w; diameter of 1.5 mm, Type
RB-1.5/III; diameter of 2 mm, Type RB-2/G20w; diameter of 2.5 mm, Type RB-
2.5/G20w; diameter of 3 mm, Type RB-3/G20w; SKF Ing.- und Verkaufsbüro,
Hamburg
{60} Tabletting machine, Korsch PH106, Pharmapress 100, No. 9205-71/86,
Maschinen Fabrik, Berlin
{61} Tablet hardness tester TBH 28, Erweka Apparatebau GmbH, Heusenstamm
{62} Tablet thickness tester, Digimatic Indicator Type 543, Mitutoyo Corp, Japan
{63} Thermocouples, Thermocoax, Miniature-Thermocouples, Type 98001591,
Serial No. 3819, TKA 10/50/NN, Philips IE Deutschland GmbH, Bereich
Thermocoax, Hamburg
{64} Thermometer as reference, 0-50 °C, Goldbrand 1, division 0.1, Brand,
Wertheim
{65} Thermometer as reference, 50-100 °C, Precision 2, division 0.1, Brand,
Wertheim
{66} Thermosensor, Type GTF 101, PT100, 4-Leiter, FL=100 mm, 1/10 DIN,
Greisinger electronic GmbH, Regenstauf
{67} Ultrasound bath Sonorex, Type RK 106, No. 20083, Bandelin electronic, Berlin
{68} UV-Spectroscopy Uvikon 930, Bio-TEK Kontron Instruments GmbH,
Neufahhrn
{69} Water bath with temperature control 30-100 °C, Type NB-D8/17, No. 32567,
Lauda-Thermostat, MGW Messgerät Werk Lauda, Lauda

310 List of instruments and software Software programm:
{S1} Excel 97, Microsoft Corp., USA
{S2} Konvert 4.0 Linseis Software, Linseis GmbH, Selb
{S3} KS 400 Imaging System 3.0, Carl Zeiss Vision GmbH, Eching bei München
{S4} Toccata Version 910226, Frontini, R., 1993, Dissertation Universität Hamburg
{S5} HPLC Software ChromStar 4.06, SCPA, Suhr
{S5} Win-First, Fourier Infrared Software Tools, Version 2.10, ATI Mattson, 1994
{S6} Win-NMR, USA

Summary 311
8. Summary
The stability of cellulose acetate phthalate (CAP) coated dosage forms, especially when
the dosage forms contained a basic drug, was of interest. The interaction between a
basic drug and the acid polymer was reported. The possibility to increase the stability of
this dosage form and to avoid the hydrolysis of the cellulose acetate phthalate polymer
was studied. A suitable model for this intention was therefore a model which provided a
direct contact between a basic drug and the enteric acid polymer (CAP). Sugar spheres
in the size range of 800 - 1000 µm or 1000 - 1180 µm were used as cores in order to
produce such a model. These cores were first coated with a thin layer of HPMC in order
to achieve a barrier layer against a mechanical stress during a coating process using
aqueous formulations. This HPMC layer could avoid the dissolving of the sugar from the
surface of the sugar sphere cores. Hereafter a thin layer of a solid basic drug was
produced by a fluidized bed process applying HPMC as a binder and finally this product
was coated with CAP. The chemical or physical interaction between a model basic drug
and the outer enteric acid layer (CAP) was well observed with this arrangement.
In this present work the spherical model had a thin layer of a water soluble, weak basic
drug (nicotinamide). This thin layer represented the effect of an interaction which
occured because of a direct contact with the enteric acid polymer (CAP). When the drug
diffuses to the outer layer it will change the properties of CAP. This diffusion can be
avoided by using a seal coat (subcoat). Moreover, the subcoat may hinder the
interaction between the basic drug and the enteric polymer (CAP). Different non-ionic
polymers such as hydroxypropyl methylcellulose (HPMC), ethyl cellulose (EC) and
polyvinyl alcohol (PVA) were therefore tested to find out the possibility to use one of
them as a subcoat. HPMC was used to compare the result with EC and PVA.
A development to find out a suitable aqueous formulation containing CAP and a suitable
coating condition was carried out. The coating processes were performed by using a
Wurster-based fluidized bed apparatus (Aeromatic-MP1). The two commercial CAP
products in the form of the spray dried powder (Aquateric) and a ready-to-use aqueous
dispersion (Aquacoat CPD) are investigated. Different types of plasticizers were added
to the aqueous dispersions of CAP. One plasticizer is water soluble i.e. triethyl citrate
312 Summary
(TEC). The other two plasticizers are water insoluble i.e. diethyl phthalate (DEP) and
dibutyl sebacate (DBS).
The ready coated pellets were tested under the SEM to determine the thickness, the
morphology and the roughness of the film layer. The image analyser was used to
determine the diameter, the swelling of the pellets, and the colour change of the
indicator (methyl orange).
The weight and the diameter of the pellets were measured after building up the layers
so that the amount of the CAP per square centimeters could be calculated. The swelling
of the coated pellets was investigated in 0.1 N HCl to observe the property of the films
which is the condition for the gastric resistance. The resistance against artificial gastric
fluid was performed in a dissolution apparatus with inserted paddles. The release test
was made in an artificial gastric fluid (0.1 N HCl) in order to find out whether the CAP-
coated pellets were gastric resistant or not. The physical changes at different
formulations and process conditions could therefore be observed. Pellets after the
release test at different time periods were tested regarding defect structure under a light
microscope.
For the coating processes using Aquacoat CPD and TEC as a plasticizer the coating
formulations and parameters were developed based on the combination of the
publications by Williams and Liu <200>, Carlin <25> and the product information of
Aquacoat CPD <7>. Moreover, the effect of some additives such as magnesium
stearate, talc, and EC on the film formation of CAP was studied.
For this purpose a greater batch of pellets with methyl orange (MO) as marker and
HPMC as a film former was produced in order not to make use of the ready coated
pellets with different subcoats. These gold colour pellets with a thin layer of HPMC and
dissolved methyl orange served as a loading material for the preliminary test. Methyl
orange has a yellow colour in a basic medium and a red colour in a moderately acidic
medium. Therefore the diffusion of the artificial gastric fluid (0.1 N HCl) can be
monitored by observing the colour change of methyl orange in 0.1 N HCl over a certain
time period. The result showed that pellets containing methyl orange after coating with
an aqueous dispersion of CAP changed their colour from yellow to gold-orange. This
means that the coating process had already affected the methyl orange. This may be

Summary 313 due to the reduction of the pH around methyl orange because of free phthalic acid from
CAP, as it is well known that the coating conditions can cause some hydrolysis of CAP
which resulted in free phthalic acid.
A rather good film structure formed from the aqueous dispersion containing CAP and
TEC. The diffusion test showed that the gold-orange coloured pellets had changed their
colour into pink at the latest after 10 min in 0.1 N HCl. Contrary to this there was a delay
of release in 0.1 N HCl of the CAP-coated pellets containing methyl orange, especially
at the high thickness of about 90 µm. The further investigations by using FTIR and NMR
showed that the salt formation between the nitrogen atom of the methyl orange and the
hydrogen atom of the phthalyl groups of CAP was possibly responsible for this delay.
The use of a high process air velocity in order to hinder the agglomeration of pellets
caused a high amount of fine dust because of the spray drying of the coating dispersion.
This was confirmed by the real coating level which was much lower than the theoretical
coating level. The coating process therefore had to be interrupted to change the filters.
In order to avoid this interruption the insertion of a cyclone instead of filters was tested.
The coating apparatus connected with a cyclone could continuously work without any
stop. However, the resistance of the cyclone was high and comparable to the maximum
resistance of the filters at which the coating process could be run. The resistance of the
cyclone was constanly monitored over the whole process.
The pellets containing nicotinamide were coated with the formulation containing
Aquacoat CPD and TEC as well. The coating formulations and parameters using
Aquateric or Aquacoat CPD and DEP or DBS as a plasticizer were developed on the
basis of the reports from Chang <31> and the product informations of Aquateric <9>
and Aquacoat CPD <7>. Pellets coated with different subcoats (orange, pink, green and
blue) and placebo-pellets without nicotinamide (white), but coated with HPMC, were
mixed together and then furthereon coated with CAP in different formulations and
process conditions so that the pellets with different subcoats could be coated under the
same conditions. The number of investigations was reduced by this way, when the
parameters were altered. Pellets without any subcoats but with nicotinamide, were also
mixed with placebo-pellets (without nicotinamide) and then covered with the same CAP
formulations under the same process conditions as the pellets with subcoats. Hereby

314 Summary
the effect of the subcoat and different compositions could be compared. The different
colours (orange, pink, green and blue) were used as a marker for each product for the
identifcation and selection after finishing the process. The results showed that films
prepared from CAP and DEP contained cracks, whereas films prepared from CAP and
DBS had a porous and uneven structure. The swelling of the pellets coated with CAP
and DEP was about 12 % whereas the swelling of pellets coated with CAP and TEC
could not be measured because some parts of the pellets were dissolved after a certain
time in 0.1 N HCl. Pellets containing nicotinamide and carrying a subcoat from HPMC
had a high swelling of about 25 % which may have an effect on the breakage of the
outer CAP layer. EC-coated pellets, however, had a very low swelling. The value was
around 0.5 %. The combination of EC and PVA at two ratios gave higher values (8 % –
43 %) depending on the amount of PVA. When films were prepared from a PVA-rich
mixture then the swelling was higher.
The release of nicotinamide from the CAP-coated pellets with a subcoat from HPMC or
a combination of EC and PVA was very fast. Especially pellets coated with a formulation
containing CAP and DEP or DBS had a high percentage of release. For example: more
than 80 % of nicotinamide was released within the first 5 min when pellets had HPMC
as a subcoat. The protection against the gastric fluid increased when the thickness of
the CAP layer was increased. The release of nicotinamide from the pellets coated with
CAP and without any subcoat was very fast so that 90 % of nicotinamide was released
within the first 5 min, especially when the formulation contained DEP or DBS as a
plasticizer.
A combination of CAP and HPMCAS was also tested to observe whether the elasticity
of the film was improved or not. The result showed that the film prepared from this
combination also contained a porous structure, and it was not resistant to 0.1 N HCl.
The effect of post-drying (curing) at different temperatures and humidities outside the
coating apparatus was studied with some CAP-coated pellets. However, it was found
that there was no improvement of the film formation under the studied conditions (40 °C
- 80 °C and up to 75 % r.h.) and that films prepared from CAP and DEP or CAP and
DBS still contained cracks or uneveness as before curing.
Summary 315 As the water content in the dosage form is the important factor that can affect the
hydrolytic process of the polymer especially CAP, the determination of the water content
was investigated by Karl-Fischer titration. Pellets coated with one of the non-ionic
polymers such as HPMC, PVA and Sepifilm LP 010 were tested in order to study the
moisture barrier property of these film formers. The results showed that stored PVA-
coated pellets had not taken up much water after 3 weeks. The water content in the
pellets after 3 weeks of storage was not higher than 3 % w/w at the highest stress
condition of 50 °C and 80 % r.h.. Pellets stored under room condition showed a water
content of about 1 - 2 % w/w. There was no significant difference of the water content in
PVA-coated pellets compared to HPMC-coated pellets or Sepifilm-coated pellets after
storage. However, the water content of CAP-coated pellets was not determined
because these pellets were not resistant to 0.1 N HCl.
The chromatographic method as HPLC was used to determine the content of free
phthalic acid, which is the indicator for the chemical stability of CAP. Pellets coated with
a formulation containing CAP and DEP showed a value of free phthalic acid which was
not higher than the limit mentioned in the USP XXIII but higher than the limits mentioned
in the USP XXIV or BP 1993. The high value of phthalic acid in the coated pellets may
have resulted from hydrolysis of CAP (and/or DEP, in case this was used as plasticizer)
during the coating process and during the storage period.
The effect of the storage conditions was studied in order to know the critical point of
storage if the chemical study of CAP-coated pellets should be performed. The optical
appearance of the pellets stored under different conditions (25 °C - 50 °C and 30 % r.h.
- 80 % r.h.) showed that pellets coated with CAP cannot be stored over 40 °C and
60 % r.h. as a sticking occured. The physical properties of the films would hereby be
lost. The chemical stability of the enteric coated pellets can be investigated when the
physical properties of the coated pellets were acceptable. The important physical
property is the resistance against artificial gastric fluid (0.1 N HCl). The present study
shows that the CAP-coated pellets prepared from different formulations and coating
conditions were not resistant to 0.1 N HCl up to 2 h. Therefore the focus in this present
work was particularly on the process or the variation of the formulations of the aqueous
dispersions containing CAP instead of the study of the chemical interaction between a
basic drug and acidic coats.

316 Zusammenfassung
9. Zusammenfassung
Die Untersuchung der Stabilität einer mit Celluloseacetatphthalat (CAP) überzogenen
Arzneiform ist von Interesse, inbesondere wenn die Arzneiform einen basischen
Wirkstoff enthält. Die Wechselwirkung zwischen basichem Wirkstoff und saurem
Polymer ist bekannt. Die Möglichkeit zur Verbesserung der Stabilität der Arzneiform,
d.h. um die Hydrolyse der Celluloseacetatphthalat zu verhindern, wurde in dieser Arbeit
untersucht. Das geeignete Modell sollte eine Schicht eines inerten Polymers zwischen
basischem Kern und saurem CAP Polymer haben.
Um dieses Modell zu erzeugen, wurden Neutralpellets 800 - 1000 µm oder 1000 µm -
1180 µm als Träger benutzt. Diese Trägerpartikel wurden zunächst in einer
Wirbelschichtanlage mit Wurster-Rohr mit einer HPMC-Lösung überzogen, um eine
dünne Isolierschicht herzustellen. Dieser dünne Überzug dient als Schutzschicht gegen
mechanische Belastung während des Aufsprühens weiterer, wässriger Dispersionen.
Hierdurch kann die Auflösung der Zuckeroberfläche des Trägers verhindert werden. Auf
diesem dünnen HPMC Überzug wurde eine weitere Schicht eines schwach basischen
Wirkstoffes mit Hilfe von HPMC als Bindemittel erzeugt, die anschließend mit
Celluloseacetatphthalat (CAP) überzogen wurde. Mittels dieses Modells konnte die
chemische oder physikalische Wechselwirkung zwischen basichem Wirkstoff und der
außeren CAP Schicht beobachtet werden.
Das kugelförmige Modellpartikel (Neutralpellets) in dieser Arbeit trägt somit eine dünne
Schicht von schwach basichem Wirkstoff, Nicotinamid. Durch diese dünne Schicht wird
ein Effekt der Wechselwirkung dargestellt, welche durch den direkten Kontakt zwischen
basischem Wirkstoff und dem sauren CAP Polymer entsteht. Die CAP Eigenschaft
verändert sich, wenn dieser Wirkstoff in die Außenschicht diffundiert. Diese Diffusion
kann durch eine Zwichenschicht verhindert werden. Außerdem kann die
Zwischenschicht die Wechselwirkung zwischen basichem Wirkstoff und saurem
Polymer wie CAP im Sinne einer Festphasenreaktion verhindern. Die Verwendung
verschiedener nichtionischer Polymere für diese Zwischenschicht, wie
Hydroxypropylmethylcellulose (HPMC), Ethylcellulose (EC) oder Polyvinylalkohol
(PVA), erfolgte zur Feststellung, ob eines dieser Polymere zur Benutzung für eine
Zwischenschicht geeignet ist. Als Vergleich wurde HPMC benutzt.

Zusammenfassung 317 Zahlreiche Untersuchungen wurden durchgeführt, um eine passende Rezeptur für eine
wässrige Dispersion von CAP und geeignete Überzugsbedingungen zu finden. Die
Überzüge wurden in der Wirbelschichtanlage Aeromatic-MP 1 unter Einsatz eines
Wurster-Rohres erzeugt. Eingesetzt wurden zwei kommerzielle CAP Produkte in Form
von Sprühtrocknungspulver (Aquateric) und fertigen wässrigen Dispersionen (Aquacoat
CPD). Verschiedene Weichmacher wurden den wässrigen CAP Dispersionen
zugemischt. Ein Weichmacher war wasserlöslich (Triethylcitrat (TEC)), weitere zwei
Weichmacher waren nicht wasserlöslich (Diethylphthalat (DEP) und Dibutylsebacat
(DBS)).
Die Untersuchung der fertig überzogenen Pellets erfolgte mittels Raster-Elektronen-
mikroskopie (REM), um die Schichtdicke, die Strukturen und die Rauheit der Verfilmung
festzustellen. Nach dem Aufbau der Schichten wurden die Gewichte und die
Durchmesser der Pellets zur Errechnung der aufgetragenen Masse an CAP pro
Quadratzentimeter gemessen. Die Quellung der überzogenen Pellets wurde in 0.1 N
HCl mittels Bildanalyse untersucht, um die Filmeigenschaften festzustellen, die für die
Magensaftresistenz Voraussetzung sind. In künstlichem Magensaft (0.1 N HCl) wurde
nach Pharm.Eur. geprüft, ob die mit CAP überzogenen Pellets magensaftresistent sind.
Die Freisetzung von Nicotinamid aus den verschiedenen überzogenen Pellets in 0.1 N
HCl wurde durchgeführt, um die physikalische Veränderung durch Variieren der
Rezepturen und Prozessbedingungen beobachten zu können. Die Pellets wurden nach
der Freisetzung in verschiedenen Zeitabständen unter dem Lichtmikroskop darauf
untersucht, wieweit die Umhüllungsfilme noch intakt waren.
Die Rezepturen für die Dispersionen zum Überziehen und die Parameter für die
Überzugsprozesse mit Aquacoat CPD und TEC als Weichmacher wurden gemäss der
Literatur modifiziert und hergestellt. Überdies wurde der Einfluß von Zusatzstoffen z.B.
Magnesiumstearat, Talkum und EC auf die Filmbildung von CAP untersucht.
Um ökonomisch vorzugehen, wurde zunächst eine große Charge von Pellets mit
Methylorange (MO) als Markiersubstanz und HPMC als Filmbildner hergestellt. Diese
gelb gefärbten Pellets mit dünner HPMC-Schicht und darin gelöstem Methylorange
wurden für Vorversuche als Ausgangsmaterial benutzt, um eine Prozessoptimierung
durchführen zu können. Methylorange hat in basischem Medium eine gelbe Farbe und
eine rote Farbe im schwach sauren Medium. Deshalb konnte die Diffusion des
künstlichen Magensaftes (0.1 N HCl) in diese Schicht –und gegebenenfalls durch eine
318 Zusammenfassung
darübergelegte Schicht aus CAP- durch Farbänderung von Methylorange in 0.1 N HCl
über die Zeit beobachtet werden. Die Ergebnisse zeigten, daß die Farbe der - mit
Methylorange und anschließend überzogen mit wässrigen CAP Dispersionen - sich von
gelb zu gold-orange änderte. Dieses bedeutet, daß die Überzugsbedingung schon
Einfluß auf die Eigenschaft des Methylorange hatte. Die Reduzierung der pH-Werte in
der Umgebung von Methylorange durch freie Phthalsäure könnte für diesen Vorgang
verantwortlich sein. Es ist zudem bekannt, daß die Überzugsbedingungen Einfluß auf
die Hydrolyse des CAP haben und dieses zur Freigabe der Phthalsäure führt.
Eine gute Verfilmung konnte mit der wässrigen Dispersion aus CAP und dem
Weichmacher Triethylcitrat (TEC) erreicht werden. Die Ergebnisse zeigten, daß die
Farbe der gold-orange gefärbten Pellets sich spätestens nach 10 Minuten in 0.1 N HCl
in rosa verändert hatte. Dagegen zeigte sich eine Verzögerung in der Methylorange-
Freigabe in 0.1 N HCl bei der Freisetzungsuntersuchung der CAP-überzogenen Pellets
insbesondere bei einer der hohen CAP-Schichtdicke von ca. 90 µm. Weitere
Untersuchungen mittles FTIR und NMR zeigten, daß eine Salzbildung zwischen dem
N-Atom in Methylorange und dem H-Atom der Phthalgruppe im CAP für diese
Verzögerung veranwortlich sein könnte.
Die Benutzung hoher Luftströmung, um die Agglomeration der Pellets zu verhindern,
führt zu hoher Staubbildung durch Sprühtrocknung der Dispersion. Dieses konnte
beobachtet werden anhand der Differenz zwischen dem Gewicht des aufgetragenen
Überzugsmaterials und des theoretischen Gewichts, abgeleitet aus der versprühten
Menge Dispersion. Der Überzugsprozess mußte unterbrochen werden, um die Filter
auszutauschen. Zur Vermeidung dieser Unterbrechung wurde ein Zyklon statt der Filter
als Staubfänger getestet. Die Ergebnisse zeigten, daß die Überzugsprozesse nun
kontinuierlich durchgeführt werden konnten. Der Strömungswiderstand des Zyklons ist
indessen sehr hoch. Die Werte sind vergleichbar mit dem höchsten Widerstandswert
der Filter, bei welchem der Überzugsprozess noch durchführbar ist. Der
Widerstandswert des Zyklons wurde während des gesamten Überzugsprozesses
überwacht.
Die Nicotinamid enthaltenden Pellets wurden auch mit der Rezeptur aus Aquacoat CPD
und TEC überzogen. Die Überzugsrezepturen aus Aquateric und Aquacoat CDP mit
DEP oder DBS als Weichmacher und die Überzugsparameter wurden auf Basis der
Literatur und Produktinformationen der Herstellerfirma der Polymere modifiziert. Pellets,
Zusammenfassung 319 mit verschiedenen Zwischenschichten (mit verschiedenen Farbindikatoren eingefärbt
auf orange, rosa, grün und blau) und Placebopellets ohne Nicotinamid (weiß), aber mit
HPMC beschichtet, wurden zusammengemischt und anschließend mit verschiedenen
CAP Rezepturen überzogen. Somit konnten Pellets mit verschiedenen
Zwischenschichten unter gleichen Bedingungen überzogen werden. Hierdurch konnte
die Anzahl der Versuche bei verschiedenen Parametereinstellungen deutlich reduziert
werden. Pellets ohne Zwischenschicht, aber mit Nicotinamid, wurden gleichfalls mit
Placebopellets (ohne Nicotinamid) gemischt und dann mit CAP mit den gleichen
Rezepturen und unter denselben Parameterwerten wie bei Pellets mit Zwischenschicht
überzogen. Dieses Verfahren erlaubte die Untersuchung des Einflusses von
Zwischenschichten und verschiedenen Komponenten. Die unterschiedlichen Farben
(orange, rosa, grün und blau) wurden somit als Markierer für verschiedene Produkte
benutzt. Dieses ermöglichte die spätere Auswahl der Pellets nach der Fertigung der
Überzüge. Die Ergebnisse zeigten, daß Filme aus CAP und DEP viele Risse hatten,
während Filme aus CAP und DBS Unebenheiten zeigten und porös waren. Die
Quellung der Pellets überzogen mit CAP und DEP lag bei ca. 12 %, während die der
Pellets überzogen mit CAP und TEC nicht gemessen werden konnte, weil sich von den
in 0.1 N HCl liegenden Pellets nach einiger Zeit Teile gelöst hatten. Pellets, die
Nicotinamid enthielten und eine HPMC Zwischenschicht hatten, zeigten eine hohe
Quellung von ca. 25 %. Dieses könnte die Ursache für das Brechen der CAP
Außenschicht sein. Pellets mit einer hydrophoberen EC- Zwischenschicht zeigten eine
niedrige Quellung von ca. 0.5 %. Pellets mit der Kombination von EC und PVA in zwei
Relationen in der Zwischenschicht hatten die sehr hohe Quellung von 8 – 43 %. Je
höher der PVA-Anteil im Film war, desto höher war die Quellung. Es erfolgte eine sehr
schnelle Nicotinamid Freigabe bei CAP überzogenen Pellets, welche HPMC oder eine
Kombination von EC und PVA als Zwischenschicht hatten, insbesondere wenn diese
Pellets mit Rezepturen aus CAP und DEP oder DBS überzogen waren. Ein Beispiel ist
die Freigabe des Nicotinamids bis zu 80 % innerhalb der ersten 5 Min bei Pellets, die
HPMC als Zwischenschicht hatten. Die Resistenz gegen Magensaft wurde höher, wenn
die Dicke der aufgetragenen CAP Schicht erhöht war. Die Freigabe des Nicotinamid
war bei den Pellets sehr hoch, die keine Zwischenschicht hatten. Innerhalb der ersten
5 Min wurden 90 % des Nicotinamid freigesetzt, ganz besondes wenn die Pellets mit
den Rezepturen aus CAP und DEP oder DBS überzogen waren.

320 Zusammenfassung
Die Untersuchung mit der Kombination aus CAP und HPMCAS diente zur Feststellung,
ob die Elastizität des Films erhöht werden könnte. Die daraus resultierten Ergebnisse
zeigten, daß die hergestellten Filme eine poröse Struktur hatten und die überzogenen
Pellets nicht gegen 0.1 N HCl resistent waren.
Die Curing-Versuche unter verschiedenen Temperaturen und Feuchten ausserhalb der
Wirbelschichtanlage wurden mit einer kleinen Rezepturauswahl an überzogenen Pellets
durchgeführt. Es zeigte sich, daß unter den eingesetzten Bedingungen (40 – 80 °C und
bis zu 75 % r.F.) keine Verbesserung der Filmbildung stattgefunden hatte. Filme aus
CAP und DEP hatten, wie ohne Curing, überdies Risse, und Filme aus CAP und DBS
zeigten noch Unebenheiten.
Der Wassergehalt in einer Arzneiform hat eine große Bedeutung, weil Wasser die
Hydrolyse insbesondere von CAP beschleunigen kann. Deshalb wurde der
Wassergehalt mittels Karl-Fischer Titration bestimmt. Pellets, die mit einem der
nichtionischen Polymere, d.h. HPMC, PVA und Sepifilm LP 010 hergestellt waren,
wurden auf den Wassergehalt nach der Lagerung untersucht, um die Eigenschaft der
Feuchtigkeitbarriere dieser Filmbildner zu beurteilen. Das Ergebnis war, daß gelagerte,
PVA- überzogenen Pellets nach 3 Wochen nicht viel Wasser aufgenommen hatten. Der
Wassergehalt in den Pellets nach 3 Wochen Lagerung lagt nicht über 3 % m/m bei der
höchsten belastenden Bedingung von 50 °C und 80 % r.F. Pellets, die unter
Raumbedingung gelagert wurden, hatten einen Wassergehalt von ca. 1 - 2 % m/m. Ein
signifikanter Unterschied des Wassergehaltes zwischen den gelagerten PVA
überzogenen Pellets, den HPMC-überzogenen Pellets und den mit Sepifilm
überzogenen Pellets konnte nicht festgestellt werden. Der Wassergehalt der CAP
überzogenen Pellets wurde, weil sie noch nicht resistent gegen 0.1 N HCl waren, nicht
untersucht.
Mittels HPLC wurde der Phthalsäuregehalt bestimmt, welcher ein Indikator für die
chemische Stabilität des CAP war. Die Pellets, die mit der Rezeptur aus CAP und DEP
überzogen waren, zeigten keinen höheren als in der USP XXIII erlaubten Gehalt der
freien Phthalsäure an, aber höher als die Grenze in den USP XXIV und BP 1993.
Dieser hohe Phthalsäuregehalt könnte aus der Hydrolyse des CAP während des
Überzugsprozesses oder der Lagerung (und/oder von DEP, wenn es als Weichmacher
benutzt wird) resultieren.

Zusammenfassung 321 Der Einfluß der Lagerungsbedingungen hinsichtlich relativer Luftfeuchte in Kombination
mit der Temperatur wurde untersucht, um den kritischen Punkt bei der Lagerung zu
bestimmen. Die optische Beurteilung der unter verschiedenen Bedingungen (25 – 50 °C
und 30 – 80 % r.F.) gelagerten Pellets hatte gezeigt, daß CAP-überzogene Pellets nicht
über 40 °C und 60 % r.F. gelagert werden können, weil eine Verklebung erfolgte.
Dadurch gehen die physikalischen Eigenschaften der Filme verloren. Die chemische
Stabilität der magensaftresistent überzogenen Pellets könnte untersucht werden, sofern
die physikalische Eigenschaft „Magensaftresistenz“ akzeptabel wäre. Diese wichtige
physikalische Eigenschaft wäre die Resistenz gegen künstlichen Magensaft (0.1 N HC)
über mindestens 1 Stunden, besser zwei Stunden, mit einer Freisetzung von
Wirkstoffmodell von unter 10 % m/m.
Die in dieser Arbeit erhaltenen Ergebnisse zeigen, daß der nach verschiedenen
Rezepturen und Prozessbedingungen mit CAP überzogenen Pellets nicht resistent
gegen 0.1 N HCl bis zu 2 Stunden waren. Deshalb wurden die Prozessbedingungen
und die Rezepturen fokussiert und nicht die chemische Wechselwirkung zwischen
basischem Wirkstoff und sauren Polymeren.
322 Curriculum vitae
Name Miss Mont Kumpugdee
Date of birth 28 April 1969
Place of birth Bangkok/Thailand
Marital status Single
Nationality Thai
High-School Education
1987 Satri Withaya School, Bangkok/Thailand, with legitimation for University Studies
University Education 1987 Kasetsart University, Faculty of Natural Science, Bangkok/Thailand
1988-1993 Mahidol University, Faculty of Pharmacy, Bangkok/Thailand with degree “Bachelor of
Science in Pharmacy” with a licence for pharmaceutical practise in Thailand
Research works for the Bachelor-Degree:
a) Professional Elective: Titel “Manufacture of Pharmaceutical Dosage Forms”
b) Special Project: Titel “Production of video tape as an audio-visual aid for manufacturing
pharmacy course” Department of Manufacturing Pharmacy
Practical works for the Bachelor-Degree:
1992 Lumpoon General Hospital, Lumpoon/Thailand
Srirutbhasach Drugstore Bangkok/Thailand
1993 Tungsong General Hospital, Nakornsrithammarat/Thailand
Unichem Pharmaceutical Industries, Pathumthanee/Thailand
Scientific Education
6/1994 until Mahidol University, Faculty of Graduate Studies, Bangkok/Thailand.
8/1996 Supervisor: Prof. Dr. Narong Sarisuta, Ph.D., Associate Dean, Professor of
Manufacturing Pharmacy, Mahidol University/Thailand in Cooperation with Prof.
Dr.rer.nat. Dr.h.c. Bernd W. Müller, Chair of Pharmaceutical Technology and
Biopharmacy, Institute of Pharmacy, Christian-Albrechts-University Kiel/Germany, with
degree “Master of Science in Pharmacy”, grade “excellent”
Title of the Master-Degree´s work: Physico-Chemical characterization of interaction between basic drugs and various film polymers
The practical work for the “Degree of Master of Science in Pharmacy” was made at the
Christian-Albrechts-University Kiel/Germany, Institute of Pharmacy

Curriculum vitae 323
from 12/1996 Doctoral candidate/PhD-student, DAAD-Scholarship holder (German Academic
Exchange Service), at The University of Hamburg, Institute of Pharmacy,
Department Pharmaceutical Technology, Bundesstr. 45, 20146 Hamburg/Germany
Supervisor: Prof. Dr. Jobst B. Mielck
from 03/2002 Post-Doc at GKSS Research Center, Max-Planck-Straße, 21502 Geesthacht, Germany
Main Research Focus: Determination of the phospholipid-membrane structure
Scientific Publications
• Narong Sarisuta, Mont Kumpugdee, Bernd W. Mueller, Satit Puttipipatkhachorn;
Physico-chemical characterization of interactions between erythromycin and various film
polymers, International Journal of Pharmaceutics, 186, 109-118 (1999)
• Narong Sarisuta, Mont Kumpugdee and Pojawon Lawanprasert;
Physical structure characterization of theophylline in some acidic film-forming polymers,
Drug Development and Industrial Pharmacy, 26(6), 687-691 (2000)
• Narong Sarisuta and Mont Kumpugdee; Crystallinity of omeprazole in various film
polymers, Pharm. Pharmacol. Commun. 6: 7-11 (2000)
Presentations
1998 DAAD-Conference Potsdam/Germany, with acknowledgement by the General Secretary
of the German Academic Exchange Service (DAAD), Dr. Christian Bode
Title: Stability of acid sensitive drugs within the carrier during the coating process with
aqueous enteric polymer dispersions using a fluidized bed apparatus
1999 University of Hamburg „Day of the Open University“, Presentation of actual research
works Title: Production of drugs: Coating of cores in the fluidized bed apparatus using
functional polymers
Memberships in Scientific Organisations Since 1993 The Pharmaceutical Association of Thailand under Royal Patronage, Thailand
Since 1993 Community Pharmacy Association, Thailand
Since 1995 International Association for Pharmaceutical Technology “APV”, Germany
Since 1997 German Pharmaceutical Association “DPhG”, Germany
E-mail address [email protected]

