coastal erosion & sea level rise - parliament of nsw€¦ · assessing the influence of sea...
TRANSCRIPT

Coastal Erosion & Sea Level Rise
Briefing Paper No 6/2010
by Stewart Smith

RELATED PUBLICATIONS
The Science of Climate Change, NSW Parliamentary Library Background Paper 1/06 by Stewart Smith
Coastal Management in NSW: An Update, NSW Parliamentary Library Briefing Paper 7/1998 by Stewart Smith
ISSN 1325-5142 ISBN 978-0-7313-1867-4 June 2010 © 2010 Except to the extent of the uses permitted under the Copyright Act 1968, no part of this document may be reproduced or transmitted in any form or by any means including information storage and retrieval systems, without the prior written consent from the Librarian, New South Wales Parliamentary Library, other than by Members of the New South Wales Parliament in the
course of their official duties.

Coastal Erosion & Sea Level Rise
by
Stewart Smith

NSW PARLIAMENTARY LIBRARY RESEARCH SERVICE Gareth Griffith (BSc (Econ) (Hons), LLB (Hons), PhD), Manager, Politics & Government/Law .......................................... (02) 9230 2356 Stewart Smith (BSc (Hons), MELGL), A/ Senior Research Officer, Environment ...................................... 02) 9230 2798 Talina Drabsch (BA, LLB (Hons)), Research Officer, Social Issues/Law ........................................... (02) 9230 2484 Daniel Montoya (BEnvSc (Hons), PhD), Research Officer, Environment/Planning ..................................... (02) 9230 2003 Holly Park (BSc, LLB) (Hons), Research Officer, Environment / Planning ................................... (02) 9230 3085 Lenny Roth (BCom, LLB), Research Officer, Law ......................... 02) 9230 2768 John Wilkinson (MA, PhD), Research Officer, Economics ........... (02) 9230 2006 Should Members or their staff require further information about this publication please contact the author. Information about Research Publications can be found on the Internet at: http://www.parliament.nsw.gov.au/prod/parlment/publications.nsf/V3LIstRPSubject
Advice on legislation or legal policy issues contained in this paper is provided for use in parliamentary debate and for related parliamentary purposes. This paper is not professional legal opinion.

CONTENTS
SUMMARY ..................................................................................................................................... i 1.0 Introduction ................................................................................................................... 1 2.0 The NSW Sea Level Rise Policy ............................................................................ 1 3.0 Sea level Rise and Coastal Erosion ..................................................................... 3
3.1 Projected Rates of Coastal Erosion....................................................... 5 4.0 The Coastal Protection and Other Legislation Amendment Bill 2010 ........ 6
5.0 The Science of Sea Level Rise .............................................................................. 9 5.1 The Geological History of Sea Level Rise ............................................. 9
5.2 The Observation and Measurement of Global Sea Level .................... 10 5.3 The Global Sea Level Budget ............................................................. 13 5.4 Future Sea Level Rise ......................................................................... 14
6.0 Projections of Sea Level Rise .............................................................................. 17 6.1 Sea Level Rise and the Frequency of Extreme Sea Level Events ...... 19
7.0 Climate Change Risks to the Coastal Built Environment ............................ 20
7.1 Adaptation Strategies to cope with Sea Level Rise ............................. 21 8.0 Conclusion ................................................................................................................. 22


i
SUMMARY This paper commences with a discussion of the sea level rise policy of the NSW Government. The link between sea level rise and coastal erosion is discussed, and the first half of the paper concludes with a review of amendments to coastal protection legislation introduced in May 2010 by the NSW Government. The second half of the paper reviews the science behind measuring and projecting global sea levels. It is readily apparent that scientists are grappling with an extraordinarily difficult science, with many unknowns and sparse and often conflicting data. Global mean sea level is not fixed. It changes in response to such things as ocean temperature and the amount of water trapped as ice on land. The Intergovernmental Panel on Climate Change (IPCC) provides reports on the current state of knowledge of climate change. The most recent report – Assessment Report 4 (IPCC AR4) in 2007 projected sea level rise to be between 18 cm and 59 cm higher in the decade 2090-2099 than compared to 1980–1990. Some scientists are now arguing that this is a conservative estimate, and that a rise of up to 110 cm is not out of the question. Consequences of sea level rise include inundation of land and the erosion of coastlines. [1] The NSW Sea Level Policy In October 2009 the NSW Government released a Sea Level Rise Policy. Whilst there are several elements to this policy, the central tenet is that of promoting adaptive risk-based management. The Policy states that planning and investment decisions should consider the sea level rise projections over timeframes that are consistent with the intended timeframes of the decision. The NSW Government has adopted sea level rise planning benchmarks to support this adaptive risk-based approach. The primary purpose of the benchmarks is to provide guidance supporting consistent considerations of sea level rise impacts, within applicable decision-making frameworks The NSW sea level rise planning benchmarks are an increase above 1990 mean sea levels of 40 cm by 2050 and 90 cm by 2100. The policy states that the benchmarks were established by considering the most credible national and international projections of sea level rise and by taking into consideration the uncertainty associated with sea level rise projections. The sea level rise planning benchmarks can be used for purposes such as:
Incorporating the projected impacts of sea level rise on predicted flood risks and coastal hazards;
Designing and upgrading of public and private assets in low-lying coastal areas where appropriate, taking into account the design life of the asset and the projected sea level rise over this period;
Assessing the influence of sea level rise on new development;
Considering the impact of sea level rise on coastal and estuarine habitats (such as salt marshes) and identifying valuable habitats at most risk from sea level rise; and
Assessing the impact of changed salinity levels in estuaries, including

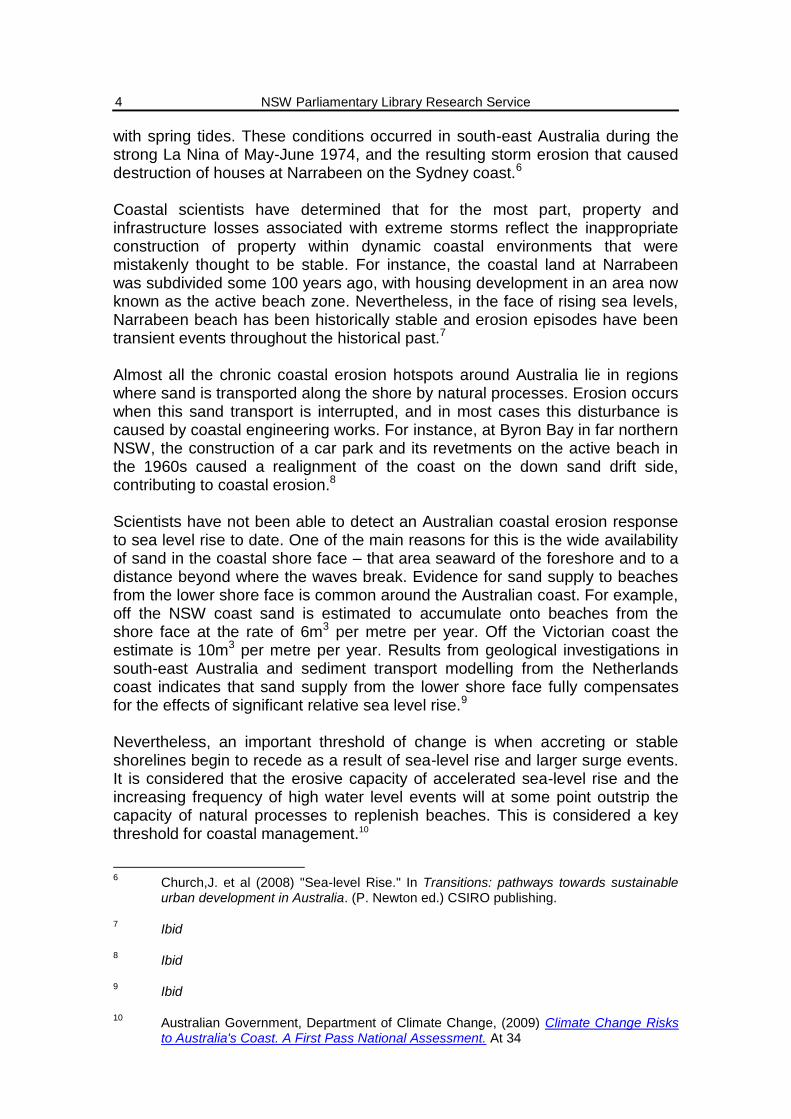
implications for access to fresh water. [2] Sea Level Rise and Coastal Erosion It is considered well established that sea level rise generally leads to erosion and causes the shoreline to retreat landwards. Australia‟s coastline has been remarkably stable over the past 200 years or so, given that sea levels have risen by 17 centimetres over that time. Generally in Australia, beaches appear not to be receding on a large scale, except in some localised places where natural recession is occurring. Generally, the most common experience of acute coastal erosion in Australia has been associated with transient erosion due to storm events involving large waves and abnormally high water levels, especially when storm surges coincide with spring tides. Coastal scientists have determined that for the most part, property and infrastructure losses associated with extreme storms reflect the inappropriate construction of property within dynamic coastal environments that were mistakenly thought to be stable. Almost all the chronic coastal erosion hotspots around Australia lie in regions where sand is transported along the shore by natural processes. Erosion occurs when this sand transport is interrupted, and in most cases this disturbance is caused by coastal engineering works. Scientists have not been able to detect an Australian coastal erosion response to sea level rise to date. One of the main reasons for this is the wide availability of sand in the coastal shore face – that area seaward of the foreshore and to a distance beyond where the waves break. Evidence for sand supply to beaches from the lower shore face is common around the Australian coast. For example, off the NSW coast sand is estimated to accumulate onto beaches from the shore face at the rate of 6m3 per metre per year. Off the Victorian coast the estimate is 10m3 per metre per year. Results from geological investigations in south-east Australia and sediment transport modelling from the Netherlands coast indicates that sand supply from the lower shore face fully compensates for the effects of significant relative sea level rise. Coastal erosion, especially that of private property, is the cause of significant community concern. Understandably, owners of waterfront properties are generally reluctant to stand back and watch their land, and any development on it, be eroded away. For their part, local and state government have difficult decisions to make concerning the extent, if any, to which they should permit or prevent land owners from protecting their property. [3] The Coastal Protection and Other Legislation Amendment Bill 2010 With the introduction of the Coastal Protection and Other Legislation Amendment Bill 2010, the NSW Government stated that its approach is to provide the tools needed to achieve an appropriate balance between the two competing goals of protecting private property and preventing the transference of erosion onto other sites. To address coastal erosion and projected sea level rise, the Bill makes amendments to the Coastal Protection Act 1979 and other legislation. The Bill

iii
has two main components:
It allows landowners to place emergency coastal protection works such as sandbags on beaches and sand dunes to mitigate erosion in specified circumstances without obtaining development consent or other specified permission;
It allows local councils to make and levy an annual charge for the provision of coastal protection services (such as the building of a rock wall) on rateable land that benefits from such services. [4]
The Science of Sea Level Rise Over decadal and longer time scales, global mean sea level change results from two major processes that alter the volume of water in the global ocean: thermal expansion; and the exchange of water between oceans and other reservoirs of water such as the ice caps, glaciers and ice sheets. The measurement of global sea level is reliant on two techniques: tide gauges and satellite altimetry. On the available evidence, the IPCC AR4 concluded that global sea level had risen during the 20th century at 1.7 ±0.5mm per year, and from 1961 to 2003 at 1.8 ±0.5mm per year. Since 1992, global mean sea level can be computed by satellites. Using this method, the IPCC AR4 reported that sea level over the period 1993 to 2003 showed a rise of 3.1 ±0.7mm per year. Global sea level rise is subject to considerable decadal variability. The rate of sea level change was found to be larger in the early part of last century (2.03 ±0.35mm per year 1904-1953) in comparison to the latter part (1.45 ±0.34mm per year 1954-2003). The highest decadal rate of rise occurred in the decade centred on 1980 (5.31 mm per year), whilst the lowest rate of rise occurred in the decade centred on 1964 (-1.49 mm per year). Whilst satellite measurements showed global mean sea level rising at a rate of 3.1 ±0.7mm in the decade to 2003, for the period 2003 to 2008 it has since slowed to about 2.5mm per year. Much of the uncertainty about the rate of sea level rise in the future centres on the behaviour of the large polar ice sheets. In recent years, the velocities of outlet glaciers in coastal regions of Greenland and Antarctica have accelerated, showing that a large fraction of ice-mass loss occurs through dynamic processes rather than surface melting. The dynamic response of the ice sheets to present-day climate may thus play a much larger role than previously assumed. [5.2] – [5.4] Projections of Future Sea Level Climate models are used to project sea levels into the future. The IPCC has projected sea level to rise 18 cm by 2090-2099 at the lower end of the scale, and at the upper end 59 cm. On a per year basis, the rate of sea level rise by 2090-2099 is calculated to be 1.5mm at the lower end, and 9.7mm per year at the other extreme. In all scenarios, the IPCC stated that average rate of rise during the 21st century is very likely to exceed the 1961 to 2003 average rate of 1.8 ±0.5mm per year. The IPCC noted that thermal expansion of the ocean is the largest component of the projected sea level rise, contributing 70 to 75% of the central estimate in

these projections for all scenarios. The dynamical response of ice sheets was not factored into the IPCC projections due to the fact that they cannot be modelled quantitatively with confidence. Since the publication of the IPCC AR4 report in 2007, scientists have projected sea level rise from 75 to 190cm, approximately three times as much as the IPCC AR4 projections. There is still considerable uncertainty surrounding estimates of future sea level rise. Steffen observes that nearly all of these uncertainties operate in one direction – towards higher rather than lower estimates. Sea level rise will impact on extreme sea level events. With a mid-range sea-level rise of 0.5 metres in the 21st century, sea level events that now happen every 10 years would happen about every 10 days in 2100. [6] Susceptibility of the Australian Coast to Sea Level Rise Australia wide, a study found that a sea level rise of 1.1 metres combined with a 1 in 100 year storm surge would result in the flooding of between 157,000 and 247,600 properties. Nearly 39,000 buildings are located within 110 metres of „soft‟ shorelines and at risk from accelerated erosion due to sea-level rise and changing climate conditions. For NSW the analysis suggested that between 40,800 and 62,400 residential buildings may be at risk of inundation. Local government areas in NSW that have the greatest level of risk are Lake Macquarie, Wyong, Gosford, Wollongong, Shoalhaven and Rockdale, which collectively represent over 50 per cent of residential buildings at risk in New South Wales. The inundation analysis also indicated that the local government areas of Great Lakes, Rockdale and Shellharbour have a high proportion of existing residences at risk within their boundaries, with a substantial 18–20 per cent of existing buildings potentially affected by 2100. Erosion due to higher sea levels is also a key risk for coastal areas. In New South Wales there are approximately 3,600 residential buildings located within 110 metres of „soft‟ erodible shorelines, of which approximately 700 are located within 55 metres of „soft‟ coast. Of the coastal local government areas, Sutherland and Port Stephens have the highest number of potentially affected properties. [7]
Coastal Erosion & Sea Level Rise
1
1.0 INTRODUCTION Global mean sea level is not fixed. It changes in response to such things as ocean temperature and the amount of water trapped as ice on land. For instance, since the last ice age global sea levels have risen by about 120 metres. More recently, the threat of accelerated sea level rise due to the enhanced greenhouse effect has attracted significant attention. The Intergovernmental Panel on Climate Change (IPCC) provides reports on the current state of knowledge of climate change. The most recent report – Assessment Report 4 (IPCC AR4) in 2007 projected sea level rise to be between 18 cm and 59 cm higher in the decade 2090-2099 than compared to 1980–1990. Some scientists are now arguing that this is a conservative estimate, and that a rise of up to 110 cm is not out of the question. Consequences of sea level rise include inundation of land and the erosion of coastlines. This paper commences with a discussion of the sea level rise policy of the NSW Government. The link between sea level rise and coastal erosion is discussed, and the first half of the paper concludes with a review of amendments to coastal protection legislation introduced in May 2010 by the NSW Government. The second half of the paper reviews the science behind measuring and projecting global sea levels. It is readily apparent that scientists are grappling with an extraordinarily difficult science, with many unknowns and sparse and often conflicting data. 2.0 THE NSW SEA LEVEL RISE POLICY The NSW Government has a variety of policies, programs and legislation that regulate development in coastal areas, which are also relevant to managing the projected increased risks from sea level rise. For instance the NSW Coastal Policy 1997 sets the overall strategic direction for coastal management in NSW and is based on the principles of ecologically sustainable development. One of the policy‟s goals is to recognise and accommodate coastal processes and hazards, including to recognise and consider the potential effects of climate change in the planning and management of coastal development. The NSW Coastal Policy is given statutory effect through State Environmental Planning Policy 71 – Coastal Protection and through a Ministerial Direction to local councils under section 117 of the Environmental Planning and Assessment Act 1979 (EP&A Act). In October 2009 the NSW Government released a Sea Level Rise Policy.1 Whilst there are several elements to this policy, the central tenet is that of promoting adaptive risk-based management. The Policy states that planning and investment decisions should consider the sea level rise projections over timeframes that are consistent with the intended timeframes of the decision. For example, these decisions should consider likely sea levels over the expected life of an asset in order to decide on how the asset
1 NSW Government, NSW Sea Level Rise Policy Statement. October 2009.

NSW Parliamentary Library Research Service
2
can be located or designed, thereby avoiding or minimising any associated impacts. The NSW Government has adopted sea level rise planning benchmarks to support this adaptive risk-based approach. The primary purpose of the benchmarks is to provide guidance supporting consistent considerations of sea level rise impacts, within applicable decision-making frameworks. This will include strategic planning and development assessment under the EP&A Act and infrastructure planning and renewal. The NSW sea level rise planning benchmarks are an increase above 1990 mean sea levels of 40 cm by 2050 and 90 cm by 2100. The policy states that the benchmarks were established by considering the most credible national and international projections of sea level rise and by taking into consideration the uncertainty associated with sea level rise projections. Note that it is some 30cm higher than the IPCC projections, but 20cm lower than the rise used by the Commonwealth Department of Climate Change to model flooding of residential properties. The NSW Government will continue to monitor sea level rise observations and projections and will periodically review these planning benchmarks, with the next review likely to coincide with the release of the fifth IPCC report, due in 2014. The sea level rise planning benchmarks can be used for purposes such as:
Incorporating the projected impacts of sea level rise on predicted flood risks and coastal hazards;
Designing and upgrading of public and private assets in low-lying coastal areas where appropriate, taking into account the design life of the asset and the projected sea level rise over this period;
Assessing the influence of sea level rise on new development;
Considering the impact of sea level rise on coastal and estuarine habitats (such as salt marshes) and identifying valuable habitats at most risk from sea level rise; and
Assessing the impact of changed salinity levels in estuaries, including implications for access to fresh water.
The 2009 Sea Level Rise Policy states that the benchmarks are not intended to be used to preclude development of land that is projected to be affected by sea level rise. The goal is to ensure that such development recognises and can appropriately accommodate the projected impacts of sea level rise on coastal hazards and flooding over time, through appropriate site planning, design and development control. NSW Department of Planning guidelines will describe how sea level rise should be considered in land use planning and development assessment. These guidelines will provide assistance to local councils, landowners, infrastructure providers and developers. Coastal hazards and flooding are natural processes and the NSW Government considers that the risks to properties from these processes appropriately rest with the property owners, whether they be public or private. This will continue where these risks are increased by sea level rise.

Coastal Erosion & Sea Level Rise
3
The Sea Level Policy made reference to landowners who may be affected by current and future coastal hazards, such as beach erosion, to seek approval from their local council to construct works on their land to protect their property. The Government announced a coastal erosion reform package in October 2009, and the Coastal Protection and Other Legislation Amendment Bill 2010 was introduced into the Legislative Assembly on 11 June 2010. 3.0 SEA LEVEL RISE AND COASTAL EROSION It is considered well established that sea level rise generally leads to erosion and causes the shoreline to retreat landwards. Australia‟s coastline has been remarkably stable over the past 200 years or so, given that sea levels have risen by 17 centimetres over that time. Generally in Australia, beaches appear not to be receding on a large scale, except in some localised places where natural recession is occurring. In many places where vegetation removal has made dunes unstable, revegetation and better coastal management have reversed erosive processes. 2 Coasts will tend to erode (or accrete) depending on the combined effect of four factors:
Change in mean sea level;
Changes in the frequency and magnitude of transient storm erosion events
Extent of supply and loss of sediments from nearby sources and sinks;
Realignment of shorelines due to changes in wave direction. 3 Under equilibrium conditions, the shape of the shore face is governed by a balance between onshore and offshore transport of sediment by surface waves. The shore profile is generally related to a given level of wave activity, inherited topography and sediment grain size. 4 If sea-level rises (assuming no change in the wave climate and sediment supplies), the balance between onshore and offshore sediment transport will change until the shoreline moves upward and encroaches landward. The wave climate may also change, affecting the movement of coastal sediment. This will modify the shore profile, forcing changes from the upper limit of sediment movement at high water level all the way to the limit of sediment movement offshore. 5 Generally, the most common experience of acute coastal erosion in Australia has been associated with transient erosion due to storm events involving large waves and abnormally high water levels, especially when storm surges coincide
2 Australian Government, Department of Climate Change, (2009) Climate Change Risks
to Australia's Coast. A First Pass National Assessment. At 34
3 Australian Government, Department of Climate Change, (2009) Climate Change Risks
to Australia's Coast. A First Pass National Assessment.
4 Ibid
5 Ibid
NSW Parliamentary Library Research Service
4
with spring tides. These conditions occurred in south-east Australia during the strong La Nina of May-June 1974, and the resulting storm erosion that caused destruction of houses at Narrabeen on the Sydney coast.6 Coastal scientists have determined that for the most part, property and infrastructure losses associated with extreme storms reflect the inappropriate construction of property within dynamic coastal environments that were mistakenly thought to be stable. For instance, the coastal land at Narrabeen was subdivided some 100 years ago, with housing development in an area now known as the active beach zone. Nevertheless, in the face of rising sea levels, Narrabeen beach has been historically stable and erosion episodes have been transient events throughout the historical past.7 Almost all the chronic coastal erosion hotspots around Australia lie in regions where sand is transported along the shore by natural processes. Erosion occurs when this sand transport is interrupted, and in most cases this disturbance is caused by coastal engineering works. For instance, at Byron Bay in far northern NSW, the construction of a car park and its revetments on the active beach in the 1960s caused a realignment of the coast on the down sand drift side, contributing to coastal erosion.8 Scientists have not been able to detect an Australian coastal erosion response to sea level rise to date. One of the main reasons for this is the wide availability of sand in the coastal shore face – that area seaward of the foreshore and to a distance beyond where the waves break. Evidence for sand supply to beaches from the lower shore face is common around the Australian coast. For example, off the NSW coast sand is estimated to accumulate onto beaches from the shore face at the rate of 6m3 per metre per year. Off the Victorian coast the estimate is 10m3 per metre per year. Results from geological investigations in south-east Australia and sediment transport modelling from the Netherlands coast indicates that sand supply from the lower shore face fully compensates for the effects of significant relative sea level rise.9 Nevertheless, an important threshold of change is when accreting or stable shorelines begin to recede as a result of sea-level rise and larger surge events. It is considered that the erosive capacity of accelerated sea-level rise and the increasing frequency of high water level events will at some point outstrip the capacity of natural processes to replenish beaches. This is considered a key threshold for coastal management.10
6 Church,J. et al (2008) "Sea-level Rise." In Transitions: pathways towards sustainable
urban development in Australia. (P. Newton ed.) CSIRO publishing.
7 Ibid
8 Ibid
9 Ibid
10 Australian Government, Department of Climate Change, (2009) Climate Change Risks
to Australia's Coast. A First Pass National Assessment. At 34

Coastal Erosion & Sea Level Rise
5
3.1 Projected Rates of Coastal Erosion Coastal scientists have developed a numerical model of the expected rate of coastal recession with a given amount of sea level rise. This has been simplified to what is called the Bruun Rule, which is widely referred to in the sea level rise literature. The Bruun Rule is a ratio between a rise in sea level and the extent of recession of a sandy coast with no cliff or rock platform. It states that a one metre rise in sea level will result in a 50 to 100 metre recession of the sandy coastline. Many local councils that fringe the coast have engaged consultants to identify coastal hazard areas. Walsh et al report that over recent years consultants preparing these studies have simply used the Bruun Rule in conjunction with IPCC mid range sea level rise scenario projections. Generally, this has resulted in a recommended allowance of an additional setback of 10m to 20m over a 50 year planning horizon to take into account shoreline recession due to sea level rise.11 Unfortunately the Bruun Rule is such a simplification of coastal processes that its projections are generally invalid. For instance, the Bruun rule calculation ignores: sources and sinks of sediment / sand supply; littoral transport of sand; and shore face supply of sediments.12 As discussed above, the shore face supply of sediments is commonly available off the Australian coastline. There is considerable uncertainty in the future response of coastal processes due to the enhanced greenhouse effect. The CSIRO investigated how the variables responsible (principally wind strength and wave height) for coastal erosion may change due to the enhanced greenhouse effect for the years 2030 and 2070. The study selected two locations off the NSW coast – Batemans Bay on the south coast and Wooli on the north coast. The CSIRO selected two climate models that provided the broadest range of responses to a given climate forcing as possible. The two climate models gave very contrasting results. For example, the study noted that 85% of all NSW storms occur from the south – south east direction. One climate model projected that by 2070 the significant swell wave height from this direction would decrease by 8%, whilst the other projected it would increase by 8%. The frequency of storms from this direction was projected to decrease by 23% in one model, and increase by 41% in the other. The significant wave height of storm waves decreased by 6% in one model and increased by 32% in the alternative. Changes in the 100 year storm surge height were projected to decrease by 3% in one model and increase by 1% in the other. Changes in the local sea level rise above projected sea level rise was forecast to rise by zero cm in one model and by 12 cm in the alternative.13
11
Walsh,K.J.E. et al (2004) "Using Sea Level Rise Projections for Urban Planning in Australia." Journal of Coastal Research, Vol 20, No 2 pp 586-598.
12 Church,J. et al (2008) "Sea-level Rise." In Transitions: pathways towards sustainable
urban development in Australia. (P. Newton ed.) CSIRO publishing.
13 CSIRO (2007) Projected Changes in Climatological Forcing for Coastal Erosion in
NSW. A Project Undertaken for the NSW Department of Environment and Climate
NSW Parliamentary Library Research Service
6
The authors of the report noted that the range of values predicted by the two different models reflects the inherent uncertainty in modelling complex physical processes at large spatial and temporal scales. 4.0 THE COASTAL PROTECTION AND OTHER LEGISLATION
AMENDMENT BILL 2010 Coastal erosion, especially that of private property, is the cause of significant community concern. Understandably, owners of waterfront properties are generally reluctant to stand back and watch their land, and any development on it, be eroded away. For their part, local and state government have difficult decisions to make concerning the extent, if any, to which they should permit or prevent land owners from protecting their property. The NSW Environmental Defender's Office suggests that in the face of rising sea levels and coastal erosion, the following planning principles should be applied, in order of priority:
Planned retreat;
Development controls and other planning measures such as setbacks and buffer zones, no go zones, and restrictive zoning;
Resilience building measures; Early warning and emergency response systems; and finally, Hard or soft engineering solutions.14
Planned retreat involves the removal of assets such as homes away from the erosion escarpment. One alternative is to allow land owners to protect their land from coastal erosion. However, a problem with allowing owners to install coastal erosion protection works is that this may merely transfer erosion to other locations or reduce areas of the beach. With the introduction of the Coastal Protection and Other Legislation Amendment Bill 2010, the NSW Government stated that its approach is to provide the tools needed to achieve an appropriate balance between the two competing goals of protecting private property and preventing the transference of erosion onto other sites. To address coastal erosion and projected sea level rise, the Bill makes amendments to the Coastal Protection Act 1979 and other legislation. The Bill has two main components:
It allows landowners to place emergency coastal protection works such as sandbags on beaches and sand dunes to mitigate erosion in specified circumstances without obtaining development consent or other specified permission;
It allows local councils to make and levy an annual charge for the provision of coastal protection services (such as the building of a rock
Change.
14 NSW Environmental Defender's Office, Submission to the NSW Department of
Environment and Climate Change on the Draft Sea Level Policy Statement. 9th April
2009.

Coastal Erosion & Sea Level Rise
7
wall) on rateable land that benefits from such services. Important features of the Bill include: Coastal protection works Consent must not be granted under the Environmental Planning and Assessment Act 1979 to development for the purpose of coastal protection works (that is, long term works such as seawalls) unless the consent authority is satisfied (by conditions imposed on the consent or otherwise) that satisfactory arrangements have been made for the following for the life of the works:
(a) the restoration of a beach, or land adjacent to the beach not protected by the works, if any increased erosion of the beach or adjacent land is caused by the presence of the works, (b) the maintenance of the works. Where the coastal protection works are constructed by or on behalf of landowners or jointly with a council or public authority, the arrangements are to secure adequate funding for the carrying out of any such restoration and maintenance, including by either or both of the following: (a) by legally binding obligations of all or any of the owners from time to time of the land protected by the works, (b) by payment to the relevant council of an annual charge for coastal protection services (within the meaning of the Local Government Act 1993).15
Emergency coastal protection works The Bill provides for the issue of certificates by local councils and DECC authorising the placement of emergency coastal protection works. Proposed section 55O provides that a person does not require regulatory approval for emergency coastal protection works if the works are authorised by a certificate. Emergency coastal protection works are defined to mean works comprising the placement of the following material on a beach, or a sand dune adjacent to a beach, to mitigate the effects of wave erosion on land:
(a) sand, or fabric bags filled with sand, (other than sand taken from a beach or a sand dune adjacent to a beach); (b) other objects or material prescribed by the regulations under the Coastal Protection Act (other than rocks, concrete, construction waste or other debris).
Proposed section 55Z also facilitates the use of public land for emergency coastal protection works in emergency situations. The maximum period allowed for emergency protection works is six months or as such period as may be prescribed by the regulations. In addition, a landowner or occupier may take advantage of the special provisions relating to emergency coastal protection works only once.16 Failure to remove the works before the expiry of the maximum period attracts a
15
Proposed new section 55M into Part 4B of the Coastal Protection Act.
16 Proposed section 55S into the of the Coastal Protection Act

NSW Parliamentary Library Research Service
8
penalty of 4,500 penalty units ($495,000) for a corporation and 2,250 penalty units ($247,500) for an individual. The reforms provide a local council or other Coastal Authority with the power to make certain orders to remove, alter or repair emergency coastal protection works on the land and to restore the land if the Coastal Authority is of the opinion that:
(a) the works are causing increased erosion of a beach or land adjacent to a beach; or (b) the works unreasonably limit public access to a beach or headland; or (c) the works pose a threat to public safety; or (d) the works have ceased to be emergency coastal protection works (for example, the works have been in place for longer than the maximum period allowed for emergency coastal protection works or the works are not being maintained as required by the proposed Part).17
Amendments to the Local Government Act 1993 The Bill proposes amendments of the Local Government Act 1993 to enable a council to make and levy an annual charge for the provision of coastal protection services (for example a rock wall) for rateable land that benefits from the services. The charge may be levied if the services relate to coastal protection works that were jointly constructed (or are being constructed) by or on behalf of owners or occupiers, or previous owners or occupiers, of the land, and a public authority or a council, and must be levied if the works were constructed (or are being constructed) solely by or on behalf of such private owners or occupiers of land. A charge may not be levied without the consent of the owner of the land in relation to any coastal protection works that existed before the commencement of the proposed section. Exemption from liability Schedule 2 [5] and [6] of the Bill make amendments to section 733 of the Local Government Act 1993 to extend the exemption from liability that a council possesses in relation to flood liable land and land in the coastal zone. This extension relates to the following things done in good faith by the council:
(a) the preparation or making of a coastal zone management plan, or the giving of an order, under the Coastal Protection Act; (b) any thing done or omitted to be done regarding beach erosion or shoreline recession on Crown land or land owned or controlled by a council or a public authority; (c) the failure to upgrade flood mitigation works or coastal management works in response to projected or actual impacts of climate change; (d) the failure to undertake action to enforce the removal of illegal or unauthorised structures on Crown land or land owned or controlled by a council or a public authority that results in beach erosion; and (e) the provision of information relating to climate change or sea level
17
Proposed section 55ZC

Coastal Erosion & Sea Level Rise
9
rise. Comments on the Bill The Coastal Lands Protection Bill has generated some comment, chiefly from its detractors. For instance, the NSW Nature Conservation Council stated that the State Government must not risk severely damaging or destroying some of NSW‟s best-loved beaches in an attempt to defend properties that may not survive the worst coastal impacts of climate change. The Council's Executive Director stated:
Interventions for property and infrastructure protection must always be weighed against their impacts on our fragile coastal ecosystems and beaches. We must not allow the destruction of invaluable environments in a futile attempt to safeguard properties and infrastructure that have little hope of surviving coastal erosion and storm surges over coming decades. The continued enjoyment and wellbeing of our coast means making the tough planning decisions now to ensure a sustainable future. We must avoid new developments in flood-prone coastal areas and implement adaptive strategies for protecting communities from coastal impacts. For some vulnerable locations this will require a strategic planned retreat from areas with little or no chance of surviving the unprecedented onslaught from storm events and erosion.”18
Similarly, local government representatives are chiefly concerned with the ongoing impacts that sea protection works may have on other beaches and the environmental and financial management of those impacts.19 5.0 THE SCIENCE OF SEA LEVEL RISE 5.1 The Geological History of Sea Level Rise Geological history has shown that the climate on earth has fluctuated considerably between cold (referred to as glacial periods) and warm (interglacial) periods. The earth has had 26 known glacial events over the last four thousand million years – 17 of them major. Nevertheless, for the most part the climate on the planet has been mainly warm and moist. Plimer notes that we are currently in one of those cold periods, and that the bulk of time of the history of the planet has been in warm temperature conditions – not in the conditions we experience today.20 Accompanying this climate change over geological history have been large changes in global sea level. During ice ages a significant amount of water is trapped as ice and snow - and sea level drops. As the earth warms, this trapped ice melts and contributes to sea level rise. 18
Nature Conservation Council of NSW, "State Government must plan for the long term future of NSW's beaches." Media Release, 19 October 2009.
19 Local Government and Shires Association of NSW, "Councils call for real consultation
on coastal erosion." Media Release 19 October 2009.
20 Plimer, I. “The Geology of Greenhouse.” 1995 Annual Oration, Australian Academy of
Technological Sciences and Engineering. See http://www.atse.org.au. Accessed August 2005.

NSW Parliamentary Library Research Service
10
For instance, at the time of the last warm period (interglacial) about 125,000 years ago, sea level was likely four to six metres higher than what it is at present. Since the last glacial maximum some 21,000 years ago, global sea level has increased by about 120 metres as a result of deglaciation.21 Some 10,000 years ago sea level off the east coast of Australia was approximately 22 metres lower than it is now. Present sea level was attained between 7900 and 7700 years ago, and continued to rise to between 1 and 1.5 metres above present between 7700 and 7400 years ago. This sea level lasted for about 5000 years, until about 2000 years ago when sea level gradually fell to present day levels.22 This is shown in figure 1. The recent history of sea level rise and falls for the east coast of Australia helps put into perspective projections for future sea level rise. Figure 1: East coast Australia sea level rise and fall over the last 10,000
years
Source: Sloss,C.R. et al, Holocence sea-level change on the southeast coast of Australia: a review. In The Holocence, 2007, Vol 17, No 7, pp 999-1014.
5.2 The Observation and Measurement of Global Sea Level Over decadal and longer time scales, global mean sea level change results from two major processes that alter the volume of water in the global ocean: thermal expansion; and the exchange of water between oceans and other reservoirs of water such as the ice caps, glaciers and ice sheets. In addition, land can move vertically, due to: tectonics; subsidence; or rise after heavy ice
21
Antarctic Climate and Ecosystems, Briefing: a post-IPCC AR4 update on sea level rise. 2008.
22 Sloss, C.R. et al, “Holocene sea-level change on the south east coast of Australia: a
review.” In The Holocene, 2007, Vol 17 No 7, pp 999-1014.

Coastal Erosion & Sea Level Rise
11
sheets from the last glacial maximum have melted (glacial isostatic adjustment – GIA). Whilst these movements of land influence local sea level measurements, they do not alter the volume of water. Nevertheless they can affect global mean sea level through their alteration of the shape and hence volume of the ocean basins containing the water.23 The measurement of global sea level is reliant on two techniques: tide gauges and satellite altimetry. Tide gauges provide sea level variations with respect to the land on which they lie. Hence to determine sea level based on the volume of water, the movement of land itself needs to be removed from the tide gauge measurement. Whilst land movement related to GIA can be simulated in global geodynamic models, the estimation of other land motions is not generally possible unless there are adequate nearby geological data, which is usually not the case. The IPCC notes that by rejecting tide gauge sites that reflect major tectonic activity, and averaging over all selected gauges, results in a small uncertainty for global sea level estimates. Another problem relying on tide gauges for determining global sea level change is that most long term sea level records arise from the Northern Hemisphere, and from continental coastlines rather than ocean interiors. 24 Wunsch et al, outlined the problems of calculating a global sea level rise figure. They noted that whilst intense interest exists in the global average value of sea level change, actually obtaining a useful result proves extremely difficult. They concluded:
At best, the determination and attribution of global mean sea level change lies at the very edge of knowledge and technology. The most urgent job would appear to be the accurate determination of the smallest temperature and salinity changes that can be determined with statistical significance, given the realities of both the observation base and modelling approximations. Both systematic and random errors are of concern, the former particularly, because of the changes technology and sampling methods over the many decades, the latter from the very great spatial and temporal variability… It remains possible that the database is insufficient to compute mean sea level trends with the accuracy necessary to discuss the impact of global warming – as disappointing as this conclusion may be.25
To an extent the IPCC reflects these views, and notes:
23
Bindoff,N.L. et al, Observations: Oceanic Climate Change and Sea Level, in Climate Change 2007: The Physical Science Basis. Contribution of Working Group 1 to the Fourth Assessment Report of the Intergovernmental Panel on Climate Change. 2007 at 408.
24 Bindoff,N.L. et al, Observations: Oceanic Climate Change and Sea Level, in Climate
Change 2007: The Physical Science Basis. Contribution of Working Group 1 to the Fourth Assessment Report of the Intergovernmental Panel on Climate Change. 2007 at 408.
25 Wunsch,C. et al (2007) "Decadal Trends in Sea Level Patterns: 1993 – 2004." Journal
of Climate, Vol 20, p 5905.

NSW Parliamentary Library Research Service
12
Limitations in ocean sampling (particularly in the Southern Hemisphere) mean that decadal variations in global heat content, regional salinity patterns, and rates of global sea level rise can only be evaluated with moderate confidence. … the global average sea level rise for the last 50 years is likely to be larger than can be explained by thermal expansion and loss of land ice due to increased melting, and thus for this period it is not possible to satisfactorily quantify the known processes causing sea level rise.26
On the available evidence, the IPCC AR4 concluded that global sea level had risen during the 20th century at 1.7 ±0.5mm per year, and from 1961 to 2003 at 1.8 ±0.5mm per year.27 Since 1992, global mean sea level can be computed at ten day intervals by satellites. Using this method, the IPCC AR4 reported that sea level over the period 1993 to 2003 showed a rise of 3.1 ±0.7mm per year. The IPCC concluded that it was unsure whether this higher rate for the decade to 2003 indicated an acceleration of sea level rise, or was merely decadal variability. Information since the publication of AR4 has helped answer this question. For instance, in a study of global sea level rise using tide gauge records from 1904 to 2003, Holgate found high decadal variability. The rate of sea level change was found to be larger in the early part of last century (2.03 ±0.35mm per year 1904-1953) in comparison to the latter part (1.45 ±0.34mm per year 1954-2003). The highest decadal rate of rise occurred in the decade centred on 1980 (5.31 mm per year), whilst the lowest rate of rise occurred in the decade centred on 1964 (-1.49 mm per year).28 Whilst satellite measurements showed global mean sea level rising at a rate of 3.1 ±0.7mm in the decade to 2003, for the period 2003 to 2008 it has since slowed to about 2.5mm per year.29 The decadal rate of sea level rise from the work of Holgate is shown in Figure 2, with the rate of sea level rise from satellite altimetry also super-imposed. While it is agreed that global sea level is rising, this figure places a question mark over the commonly held view that sea levels are rising at an accelerated rate.
26
Bindoff,N.L. et al, Observations: Oceanic Climate Change and Sea Level, in Climate Change 2007: The Physical Science Basis. Contribution of Working Group 1 to the Fourth Assessment Report of the Intergovernmental Panel on Climate Change. 2007 at 421.
27 Ibid
28 Holgate,S.J. (2007) "On the decadal rates of sea level change during the twentieth
century." Geophysical Research Letters, Vol 34, L01602.
29 Cazenave,A. (2009) "Sea Level Budget over 2003-2008: A Reevaluation from GRACE
space gravimetry, satellite altrimetry and Argo." Global and Planetary Change, Vol 65, Issue 1-2 pp 83-88.

Coastal Erosion & Sea Level Rise
13
Figure 2: The Decadal Rate of Sea Level Rise
Source: Decadal rate of sea level rise from satellites (red curve) appended to the decadal rate of global sea level rise as determined from a 9-station tide gauge network for the period 1904-2003 (blue curve) and from a 177-station tide gauge network for the period 1948-2002 (adapted from Holgate, 2007, by Michaels,P. "Sea Level Rise: An Update Shows a Slowdown." World Climate Report, July 22 2009.).
5.3 The Global Sea Level Budget As noted, there are two major influences on sea level change – thermal expansion and change in ocean mass (from melting glaciers and ice caps). Scientists have attempted to calculate the proportion of each to explain sea level changes – this is known as the sea level budget. In principle, the contribution of thermal expansion to sea level rise can be calculated from changes in ocean temperature and salinity. However, measurements are difficult and complicated by the relative paucity of observations in the oceans.30 Similarly, whilst it is clear that the vast majority of the world‟s glaciers and small ice caps have been retreating in the last century, it is difficult to calculate precisely their contribution to global sea level rise. The Greenland and Antarctic ice sheets are governed by slower processes than those of smaller glaciers and ice caps. The complex dynamics of ice flow and interactions with the surrounding rock and sea make the process of estimating the contribution of
30
Walsh,K et al, “Using sea level rise projections for urban planning in Australia.” In Journal of Coastal Research, 2004, Vol 20, No 2 pp 586-598.

NSW Parliamentary Library Research Service
14
these areas to global sea level difficult.31 In 2007 the IPCC AR4 noted that from 1961 to 2003 the sum of thermal expansion and contributions from land ice is smaller by 0.7 ±0.7mm per year than the observed global average sea level rise. For the period 1993 to 2003 the sum is still less than observed but discrepancy of 0.3 ±1.0 mm per year is consistent with zero. The IPCC concluded that it is not possible to satisfactorily quantify the known processes causing sea level rise over the last 50 years.32 Since the publication of the IPCC AR4 report, climate scientists have been trying to close this knowledge gap – often with conflicting results. For example, in 2008 Domingues et al published revised estimates of upper-ocean warming, suggesting that the rate of ocean warming was 50% larger than previously thought. Therefore, the implication is that ocean warming was responsible for global sea level rise to a greater extent than reported by the IPCC. The scientists concluded that the sea level budget over the 50 year period was 'closed'.33 In contrast, in 2009 Hock et al concluded that much of the IPCC AR4 'gap' can be attributed to a larger contribution than previously assumed from the melting of mountain glaciers and ice caps – especially those around the Antarctic Peninsula.34 5.4 Future Sea Level Rise Much of the uncertainty about the rate of sea level rise in the future centres on the behaviour of the large polar ice sheets. During the last warm period about 125,000 years ago, global mean sea level was about 4-6 metres higher than it is today. Loss of parts of the Greenland and West Antarctic ice sheets were likely responsible. If global average temperature rises to within 1.9 to 4.6°C relative to pre-industrial temperatures, and is maintained for millennia within that range or higher, the Greenland ice sheet would largely be eliminated by surface melting alone. This would result in a 7m sea level rise.35 The ice resting on bedrock (grounded ice) in Greenland and Antarctica contain enough water to
31
Walsh,K et al, “Using sea level rise projections for urban planning in Australia.” In Journal of Coastal Research, 2004, Vol 20, No 2 pp 586-598.
32 Bindoff,N.L. et al, Observations: Oceanic Climate Change and Sea Level, in Climate
Change 2007: The Physical Science Basis. Contribution of Working Group 1 to the Fourth Assessment Report of the Intergovernmental Panel on Climate Change. 2007 at 421.
33 Domingues,C.M. et al (2008) "Improved estimates of upper-ocean warming and multi
decadal sea level rise." Nature, 453, 1090-1093 (19 June 2008)
doi:10.1038/nature07080.
34 Hock,R. et al (2009) "Mountain glaciers and ice caps around Antarctica make a large
se-level rise contribution." Geophysical Research Letters, Vol 36, L070501.
35 Steffen,W. Climate Change 2009. Faster Change and More Serious Risks. Australian
Government, Department of Climate Change.

Coastal Erosion & Sea Level Rise
15
raise the sea level by about 70 metres if they were to melt entirely.36 5.4.1 The Dynamic Response of Ice Sheets Cazenave observes that the greatest uncertainty in sea-level projections is the future behaviour of the ice sheets. In recent years, the velocities of outlet glaciers in coastal regions of Greenland and Antarctica have accelerated, showing that a large fraction of ice-mass loss occurs through dynamic processes rather than surface melting. The dynamic response of the ice sheets to present-day climate may thus play a much larger role than previously assumed. The future instability of the ice sheets is of major concern, given their potential impact on sea level, yet comprehensive modelling of their behaviour in is in its infancy.37 Two dynamical processes are particularly important. The first of these is related to streams of melt water on the surface of the ice sheet. When these streams meet a crevasse, they can sometimes flow down to the base of the glacier, lubricating it and accelerating its movement towards the sea. However, there are conflicting studies over this 'lubricating' dynamic effect. van de Wal et al studied the Greenland Ice Sheet, and found that ice sheet velocity reacts to increased meltwater production and increases by a factor of four. Over the study period of 17 years, the researchers found a small but significant decrease of 10% in the annual average velocity of the ice sheet. The authors suggested that the glacial hydraulic system adjusts constantly to the variable
meltwater input, which results in a more or less constant ice flux over the years. van de Wal et al concluded that:
The positive-feedback mechanism between melt rate and ice velocity appears to be a seasonal process that may have only a limited effect on the response of the ice sheet to climate warming over the next decades.38
Another study by Nick et al noted that uncertainties in the predictions of mass loss from the Greenland ice sheet have been highlighted as one of the main limitations in forecasting future sea levels. However, these scientists found that changes in the Greenland ice sheet are unlikely to be caused by basal lubrication through surface melt propagating to the glacier bed. The authors noted that their results imply that the recent rates of mass loss in Greenland's outlet glaciers are transient and should not be extrapolated into the future.39 The second dynamical process referred to in the climate literature is related to
36
Walsh,K et al, “Using sea level rise projections for urban planning in Australia.” In Journal of Coastal Research, 2004, Vol 20, No 2 pp 586-598.
37 Cazenave, A. (2006), "How Fast Are the Ice Sheets Melting?" Science, Vol 314, 24
November 2006.
38 van de Wal, R.S.W et al, "Large and rapid melt-induced velocity changes in the ablation
zone of the Greenland ice sheet." In Science, 321, pp 111-113.
39 Nick,F.M. et al, "Large-scale changes in Greenland outlet glacier dynamics triggered at
the terminus." In Nature Geoscience, 2: 110-114.

NSW Parliamentary Library Research Service
16
the loss of ice shelves that form on the sea along the coastlines of polar land masses. Ice shelves form when the ice at an ice sheet's oceanic boundary does not split up into icebergs at the point where it becomes afloat, but remains connected to the grounded ice sheet. The ultimate fate of the ice in an ice shelf is either to be calved off as icebergs from its seaward edge, or to melt from the ice shelf base.40 The ice shelf acts as a buttress to the land based outlet glaciers and slow their flow to the sea. When the ice shelf is lost, so too is the buttressing effect and the outlet glaciers often show a sharp increase in the rate of flow – hence contributing to a rapid rate in sea level rise.41 In the southern polar region the main concern is the West Antarctic ice sheet (with its approximately 6 m of equivalent sea level), which is grounded below sea level. In this environment rising sea temperature can cause melting at the base of the ice sheet as well as undermine the stability of the buttressing ice shelves. The Antarctic Peninsula splits the continent between east and west Antarctica. Surface temperature trends show significant warming across the Antarctic Peninsula and to a lesser extent West Antarctica. A recent study demonstrated that temperatures on the Rutford Ice Stream, West Antarctica, have warmed since 1930.42 The Scientific Committee on Antarctic Research notes that this warming may reflect natural variability.43 Temperatures on the eastern side of the Antarctic Peninsula have risen most during summer and autumn. This has been linked to stronger westerly winds that bring warm, maritime air across the Peninsula to the low lying ice shelves on the eastern side. These strengthening westerly winds have taken place as the air circulation system known as the Southern Annular Mode moved into its positive phase. The positive phase of the Southern Annular Mode has been attributed mostly to the ozone hole over Antarctica, due to the release of ozone depleting substances such as used in refrigerants and fire extinguishers.44 The prevalence of warmer westerly winds during the summer months has resulted in the retreat of ice shelves on both sides of the Antarctic Peninsula.
40
Nicholls,K.W. et al, (2009), "Ice-ocean processes over the continental shelf of the southern Weddell Sea, Antarctica: A Review." In Reviews of Geophysics, 47, RG3003.
41 Steffen,W. (2009), Climate Change 2009. Faster Change and More Serious Risks.
Australian Government, Department of Climate Change.
42 Barrett,B.E. (2009) "Rapid recent warming on Rutford Ice Stream, West Antarctica, from
borehole thermometry." Geophysical Research Letters, Vol 36, L02728.
43 Scientific Committee on Antarctic Research, (2009), Antarctic Climate Change and the
Environment, Scott Polar Research Institute, Cambridge UK, at xviii.
44 Fogt,R.L. et al, (2009), "Historial SAM Variability. Part II: Twentieth-Century Variability
and Trends from Reconstructions, Observations and the IPCC AR4 Models." In Journal of Climate, 22, pp 5346-5365.
Coastal Erosion & Sea Level Rise
17
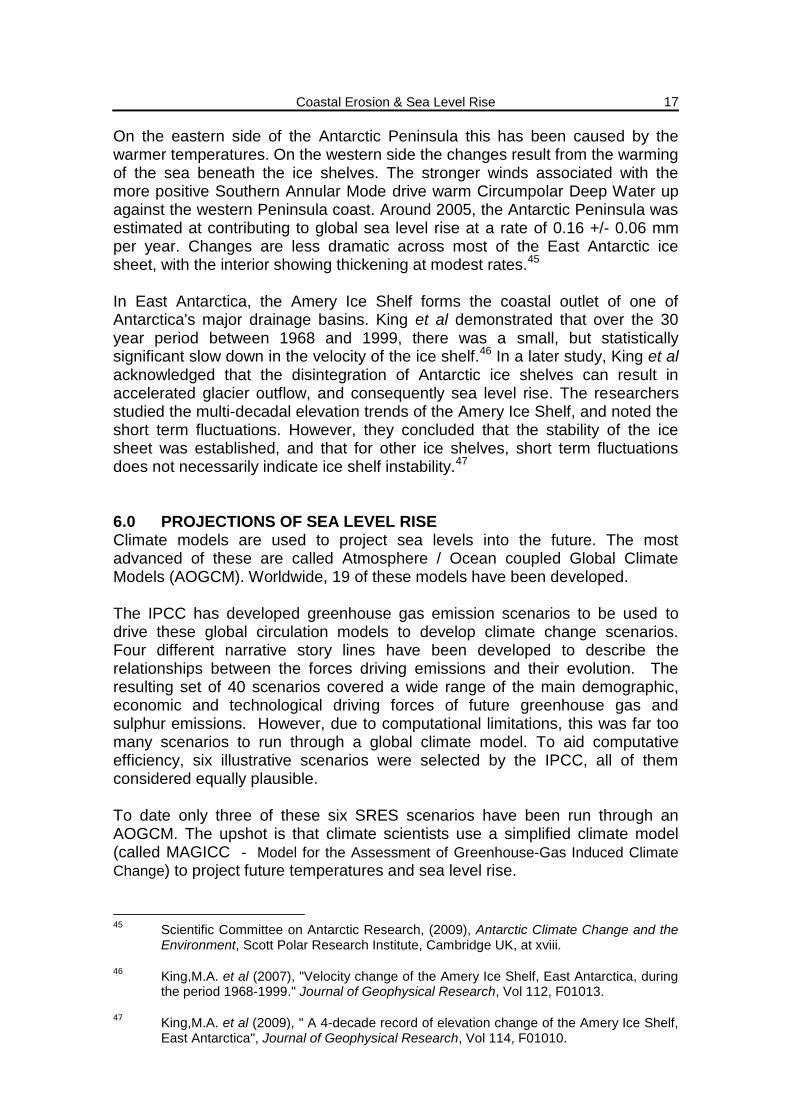
On the eastern side of the Antarctic Peninsula this has been caused by the warmer temperatures. On the western side the changes result from the warming of the sea beneath the ice shelves. The stronger winds associated with the more positive Southern Annular Mode drive warm Circumpolar Deep Water up against the western Peninsula coast. Around 2005, the Antarctic Peninsula was estimated at contributing to global sea level rise at a rate of 0.16 +/- 0.06 mm per year. Changes are less dramatic across most of the East Antarctic ice sheet, with the interior showing thickening at modest rates.45 In East Antarctica, the Amery Ice Shelf forms the coastal outlet of one of Antarctica's major drainage basins. King et al demonstrated that over the 30 year period between 1968 and 1999, there was a small, but statistically significant slow down in the velocity of the ice shelf.46 In a later study, King et al acknowledged that the disintegration of Antarctic ice shelves can result in accelerated glacier outflow, and consequently sea level rise. The researchers studied the multi-decadal elevation trends of the Amery Ice Shelf, and noted the short term fluctuations. However, they concluded that the stability of the ice sheet was established, and that for other ice shelves, short term fluctuations does not necessarily indicate ice shelf instability.47 6.0 PROJECTIONS OF SEA LEVEL RISE Climate models are used to project sea levels into the future. The most advanced of these are called Atmosphere / Ocean coupled Global Climate Models (AOGCM). Worldwide, 19 of these models have been developed. The IPCC has developed greenhouse gas emission scenarios to be used to drive these global circulation models to develop climate change scenarios. Four different narrative story lines have been developed to describe the relationships between the forces driving emissions and their evolution. The resulting set of 40 scenarios covered a wide range of the main demographic, economic and technological driving forces of future greenhouse gas and sulphur emissions. However, due to computational limitations, this was far too many scenarios to run through a global climate model. To aid computative efficiency, six illustrative scenarios were selected by the IPCC, all of them considered equally plausible. To date only three of these six SRES scenarios have been run through an AOGCM. The upshot is that climate scientists use a simplified climate model (called MAGICC - Model for the Assessment of Greenhouse-Gas Induced Climate
Change) to project future temperatures and sea level rise.
45
Scientific Committee on Antarctic Research, (2009), Antarctic Climate Change and the Environment, Scott Polar Research Institute, Cambridge UK, at xviii.
46 King,M.A. et al (2007), "Velocity change of the Amery Ice Shelf, East Antarctica, during
the period 1968-1999." Journal of Geophysical Research, Vol 112, F01013.
47 King,M.A. et al (2009), " A 4-decade record of elevation change of the Amery Ice Shelf,
East Antarctica", Journal of Geophysical Research, Vol 114, F01010.

NSW Parliamentary Library Research Service
18
The MAGICC model was tuned with information from the 19 AOGCMs with forcings as presented in the six different SRES scenarios. The IPCC then reported the 5 to 95% intervals characterizing the spread of the model results, as shown in Table 1. Table 1: IPCC AR4 Sea Level Rise Projections
Scenario
B1 B2 A1B A1T A2 A1F1
Sea Level rise
Metres
0.18 0.38 0.2 0.43 0.21 0.48 0.20 0.45 0.23 0.51 0.29 0.59
Sea Level
rise mm per year
1.5 3.9 2.1 5.6 2.1 6.0 1.7 4.7 3.0 8.5 3.0 9.7
Projected global average sea level rise during the 21st century and its components under SRES marker scenarios. The upper row in each pair gives the 5 to 95% range (m) of the rise in sea level between 1980 to 1999 and 2090 to 2099. The lower row in each pair gives the range of the rate of sea level rise (mm yr–1) during 2090 to 2099. From this table it can be seen that the IPCC has projected sea level to rise 18 cm by 2090-2099 at the lower end of the scale, and at the upper end 59 cm. On a per year basis, the rate of sea level rise by 2090-2099 is calculated to be 1.5mm at the lower end, and 9.7mm per year at the other extreme. In all scenarios, the IPCC stated that average rate of rise during the 21st century is very likely to exceed the 1961 to 2003 average rate of 1.8 ±0.5mm per year.48 One observation to make is that, at the upper end of the scale, the rate of rise of 9.7mm per year the IPCC is projecting significant human influence on climate. The IPCC noted that thermal expansion of the ocean is the largest component of the projected sea level rise, contributing 70 to 75% of the central estimate in these projections for all scenarios. By the end of the century, a large fraction of the present glaciers and ice caps mass is projected to have been lost. The Greenland ice sheet is also projected to contribute positively to sea level, whilst an increase in the snow mass balance of the Antarctic ice sheet will reduce it. The dynamical response of ice sheets was not factored into the IPCC projections due to the fact that they cannot be modelled quantitatively with confidence.49 Since the publication of the IPCC AR4 report in 2007, there has been a considerable body of scientific literature published on sea level rise. One of the
48
Meehl, G.A. et al, (2007), Global Climate Projections. In Climate Change 2007: The Physical Science Basis. Contribution of Working Group 1 to the Fourth Assessment Report of the Intergovernmental Panel on Climate Change.
49 Meehl, G.A. et al, (2007), Global Climate Projections. In Climate Change 2007: The
Physical Science Basis. Contribution of Working Group 1 to the Fourth Assessment Report of the Intergovernmental Panel on Climate Change.

Coastal Erosion & Sea Level Rise
19
more recent is that by Vermeer and Rahmstorf. These scientists proposed a simple relationship linking global sea level variations to global mean temperature on time scales of decades to centuries. After demonstrating the close correlation of this relationship with data from 1880 – 2000, projections for sea level for the period 1999 – 2100 were made. Again using the six SRES emission scenarios, Vermeer and Rahmstorf projected sea level rise from 75 to 190cm, approximately three times as much as the IPCC AR4 suggested.50 As noted, in the IPCC AR4 projections thermal expansion is considered the major contributor to sea level rise. In contrast, the model proposed by Vermeer and Rahmstorf suggests that ice melt will be the major contributor. The authors observe that a key question is: will the ice melt response observed so far, as captured in their model, overestimate or underestimate future sea level rise?51 From this discussion it can be seen that there is still considerable uncertainty surrounding estimates of future sea level rise. Steffen observes that nearly all of these uncertainties operate in one direction – towards higher rather than lower estimates.52 6.1 Sea Level Rise and the Frequency of Extreme Sea Level Events Extreme sea level events are those driven by severe weather such as tropical cyclones, or for NSW severe lows off the coast (known as mid-latitude storms). The accompanying strong winds and falling air pressure can generate storm surges and severe wave conditions that can result in coastal erosion and coastal flooding. These events can be described by how often they occur – referred to their return period or average recurrence interval (ARI – the average time between events of a particular height). With no other changes to climate, rising regional sea levels will worsen the impact of these events by increasing the base sea level on which they occur. The impact can be thought of as higher sea levels during storms of a given magnitude, or alternatively, more frequent occurrences (shorter ARIs) of sea levels of a given height.53 Church et al analysed tide gauges around Australia and determined the average recurrence interval for a given extreme level at Fort Denison, in Sydney Harbour. As shown in table 2, extreme events increased their frequency of occurrence by a factor of about three during the 20th century.54
50
Vermeer,M. and Rahmstorf,S. (2009), "Global sea level linked to global temperature." PNAS, December 22, 2009, Vol 106, No 51.
51 Vermeer,M. and Rahmstorf,S. (2009), "Global sea level linked to global temperature."
PNAS, December 22, 2009, Vol 106, No 51.
52 Steffen,W. (2009), Climate Change 2009. Faster Change and More Serious Risks.
Australian Government, Department of Climate Change.
53 Church,J.A. et al (2006), "Sea level rise around the Australian coastline and the
changing frequency of extreme sea level events." In Australian Meteorology Magazine, Vol 55, pp 253-260.
54 Church,J.A. et al (2006), "Sea level rise around the Australian coastline and the

NSW Parliamentary Library Research Service
20
Table 2: Average Recurrence Intervals for given sea levels for the pre-1950 and post 1950 periods at Fort Denison, Sydney Harbour.
Level ARI Pre-1950 (yrs) ARI Post-1950 (yrs)
2.1 metres 1.7 0.6
2.2 metres 11.4 3.4 Source: Church,J.A. et al (2006) "Sea level rise around the Australian coastline and the changing frequency of extreme sea level events." In Australian Meteorology Magazine, Vol 55, at 258.
Church et al demonstrate that with a mid-range sea-level rise of 0.5 metres in the 21st century, sea level events that now happen every 10 years would happen about every 10 days in 2100.55 The IPCC notes that that with a warmer climate, tropical cyclones may become more intense, bringing with them higher storm surges. Storm tracks may move towards the poles, bringing changes in wind and surge events around southern Australia. Significant ocean warming may also result in stronger winds and storm surges. Increases in these meteorological events due to the enhanced greenhouse effect are likely to exacerbate the effect of rising sea level on the frequency of extreme events – although the exact size of such additional effects remains uncertain.56 7.0 CLIMATE CHANGE RISKS TO THE COASTAL BUILT ENVIRONMENT The Commonwealth Department of Climate Change coordinated the 'First Pass National Assessment' of the risks of climate change to the Australian coast. Part of this project was to assess the coastal flooding hazard of residential buildings (infrastructure and other assets were left for later analysis). The study combined sea-level rise of 1.1 metres57 and storm surge from a 1 in 100 year storm with a digital elevation model to identify locations likely to be flooded. Soft, erodible shorelines around the Australian coast were also identified. The number of existing residential buildings exposed to inundation risk was quantified using a national database. Nationwide, it was found that of the 711,000 existing residential buildings close to the water, between 157,000 and 247,600 properties were identified as
changing frequency of extreme sea level events." In Australian Meteorology Magazine, Vol 55, at 258.
55 Church,J. et al (2008) "Sea-level Rise." In Transitions: pathways towards sustainable
urban development in Australia. (P. Newton ed.) CSIRO publishing.
56 Antarctic Climate and Ecosystems Cooperative Research Centre, (2008) Position
Analysis: Climate change, sea level rise and extreme events: Impacts and Adaptation Issues.
57 This is considerably higher than the range of 0.18 to 0.59m (by 2090-2099) increase
projected by the IPCC. The report stated that a sea-level rise value of 1.1 metres for 2100 was informed by research since the IPCC AR4 and expert advice.
Coastal Erosion & Sea Level Rise
21
potentially exposed to inundation. Nearly 39,000 buildings are located within 110 metres of „soft‟ shorelines and at risk from accelerated erosion due to sea-level rise and changing climate conditions. For NSW the analysis suggested that between 40,800 and 62,400 residential buildings may be at risk of inundation. The current replacement value of the residential buildings at risk was estimated at between $12.4 billion and $18.7 billion. Based on this analysis, New South Wales has the highest number of residential buildings at risk of inundation around the Australian coastline. Local government areas that have the greatest level of risk are Lake Macquarie, Wyong, Gosford, Wollongong, Shoalhaven and Rockdale, which collectively represent over 50 per cent of residential buildings at risk in New South Wales. The inundation analysis also indicated that the local government areas of Great Lakes, Rockdale and Shellharbour have a high proportion of existing residences at risk within their boundaries, with a substantial 18–20 per cent of existing buildings potentially affected by 2100 (upper range estimate). Erosion due to higher sea levels is also a key risk for coastal areas. In New South Wales there are approximately 3,600 residential buildings located within 110 metres of „soft‟ erodible shorelines, of which approximately 700 are located within 55 metres of „soft‟ coast. Of the coastal local government areas, Sutherland and Port Stephens have the highest number, with approximately 650 residential buildings within 110 metres of „soft‟ shorelines in both local government areas, and about 170 and 220 within 55 metres, respectively. Similarly, Shoalhaven (~380), Eurobodalla (~300), Rockdale (~280) and Byron (~160) have a relatively high number of residential buildings within 110 metres of „soft‟ coast, with Eurobodalla also having almost 70 buildings within 55 metres.58 This study provided the first national assessment of the extent of inundation that could be expected with a 1.1m sea level rise with a storm surge. Of course, this projected inundation assumes that no adaptation strategies are put into place. 7.1 Adaptation Strategies to cope with Sea Level Rise The reality is that global sea level is rising. Rather than simply ignoring this potential threat, an adaptation strategy outlines a plan to cope with climate change and rising sea levels. Adaptation to climate change is a major branch of the climate change literature. For present purposes, it can be summarised by reference to Church et al as follows: Adaptation strategies to rising sea levels include:
Accommodation (of sea level rise) through forward planning and appropriate use of low lying coastal regions. For example, to ensure escape and emergency routes are available for future flooding events, and to increase the resilience of coastal development and communities;
Protection of land and property via 'hard' measures such as sea walls
58
Australian Government, Department of Climate Change, (2009) Climate Change Risks to Australia's Coast. A First Pass National Assessment. at 77.

NSW Parliamentary Library Research Service
22
and 'soft' measures such as increased beach nourishment.
Planned retreat through planning instruments, such as implementation of no build areas or building setbacks for areas susceptible to flooding and erosion.59
8.0 CONCLUSION One of the biggest concerns of a warming climate is the associated rise in sea level. The IPCC projects that global mean temperature will increase by up to 6.4°C; commensurate with this rise is a rise in global mean sea level of 59cm by 2090-2099. Many scientists suggest that the IPCC projections underestimate the rate of sea level rise, and that a rise of over one metre by the end of the century is more likely. This paper has shown that the science behind measuring global sea level, and projecting its levels into the future, is complex and contains many uncertainties. Nevertheless, it is incumbent on governments to consider the implications of sea level rise. The NSW Government released its sea level rise policy in October 2009. The policy does not preclude development that is projected to be affected by a sea level rise, but seeks to ensure that any such development can appropriately meet projected impacts. Recent legislative proposals also seek to empower land holders to protect their properties from coastal erosion. Whilst these provisions may assist landholders in the short term, what the future holds for sea side land owners may be less certain.
59
Church,J. et al (2008) "Sea-level Rise." In Transitions: pathways towards sustainable urban development in Australia. (P. Newton ed.) CSIRO publishing.