coal price outlook - economics & country risk … price outlook: a carbon premium or discount?...
TRANSCRIPT

Coal Price Outlook:A Carbon Premium or Discount?
David Goldsack Senior Consultant for Coal

Copyright © 2007 Global Insight, Inc. 2
…Probably Neither: Coal Will Continue to Set Its Own Levels
• Will continue to be driven by Australian cost• As always freight will play an
important role• The supply/demand balance
will improve to soften prices • The future direction
of the dollar is crucial

Copyright © 2007 Global Insight, Inc. 3
History Tells Us –We’ve Been There Before.
0.0
20.0
40.0
60.0
80.0
100.0
120.0
140.0
160.0
1978 1980 1982 1984 1986 1988 1990 1992 1994 1996 1998 2000 2002 2004 2006
$/tc
e
0
100
200
300
400
500
600
700
Mt
Delivered Prices to EU Power Stations in Nominal $/tceDelivered Prices to EU Power Stations in 2006 $/tceJapanese Benchmark FOB Australia Nominal $/tceJapanese Benchmark FOB Australia 2006 $/tceSeaborne Trade Historical (Right Scale)

Copyright © 2007 Global Insight, Inc. 4
Steam Coal Price Outlook
• Market operation market and price drivers
• Review of costs and prices
• Forecasts
• Coal vs. other fuels
Copyright © 2007 Global Insight, Inc. 4

Copyright © 2007 Global Insight, Inc. 5
Market Operation – The “Atlantic Deficit” in Action 2006
In price setting, international ocean sea freight rates play a significant role.
In price setting, international ocean sea freight rates play a significant role.
Australia’s role as the price driver to the world now leaves all
other countries as price takers
Australia’s role as the price driver to the world now leaves all
other countries as price takers

Copyright © 2007 Global Insight, Inc. 6
Australia’s Price Setting Role –C&F ARA
0
10
20
30
40
50
60
70
80
90
Colombia S. Africa Indonesia Russia Australia Australia
2006 2007
U.S
.$/T
onne
(600
0 K
cal/k
g ne
t as
rece
ived
)
Jan/October 2007 FreightOcean Freight Average 2006ROC + ProfitInland Transport & HandlingAverage Mine Cash Cost 2007 Average Mine Cash Cost 2006
Average ARA Price 2006 2007 YTD$66.90 $88.20
Average Australian Cost 2006 2007 YTD
$64.25 $88.80

Copyright © 2007 Global Insight, Inc. 7
Steam Coal Price Outlook
• Market operation market and price drivers
• Review of costs and prices
• Forecasts
• Coal vs. other fuels
Copyright © 2007 Global Insight, Inc. 7
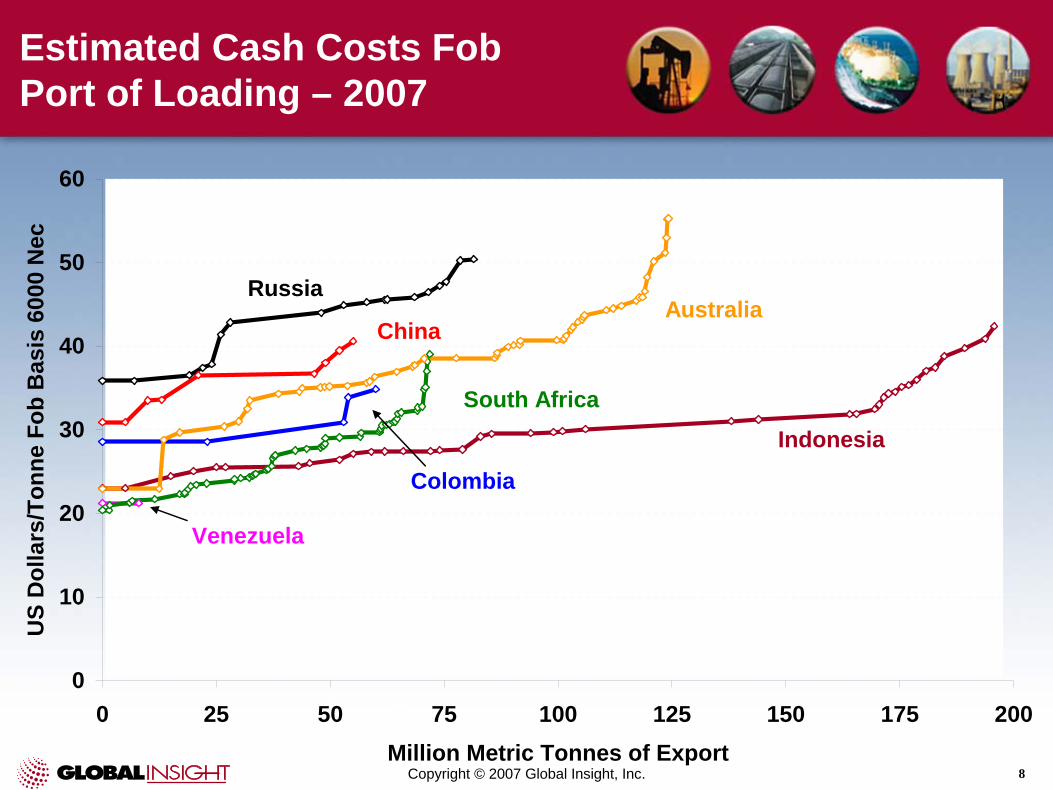
Copyright © 2007 Global Insight, Inc. 8
Estimated Cash Costs Fob Port of Loading – 2007
0
10
20
30
40
50
60
0 25 50 75 100 125 150 175 200Million Metric Tonnes of Export
US
Dol
lars
/Ton
ne F
ob B
asis
600
0 N
ec
Indonesia
South Africa
AustraliaChina
Russia
Colombia
Venezuela

Copyright © 2007 Global Insight, Inc. 9
Exchange Rate Fluctuations Impact Cash Costs
0
5
10
15
20
25
30
35
40
45
50
Australia SouthAfrica
Russia China Australia SouthAfrica
Russia China
2002 2007 (2002 Exchange rates)
U.S
.$/T
onne
Bas
is 1
1,30
0Btu
/lb g
ar Mine Wages Other Mine Costs
Transport & Port Royalties
$ Effect Wages $ Effect Mine$ Effect Rail/Port $ Effect Royalty

Copyright © 2007 Global Insight, Inc. 10
Exchange Rates Play a Major Role — As History Shows
0
100
200
300
400
500
600
700
800
1995 1996 1997 1998 1999 2000 2001 2002 2003 2004 2005 2006 2007
Austalian dollarColombian pesoChinese yuanIndonesia rupiahRussian rubleSouth African rand

Copyright © 2007 Global Insight, Inc. 11
Exchange Rates Play a Major Role — As Does Forecast
80
100
120
140
160
180
200
2007 2009 2011 2013 2015 2017 2019 2021 2023 2025
Australian dollarColombian pesoChinese renmimbiIndonesia rupiahRussian roubleSouth African rand

Copyright © 2007 Global Insight, Inc. 12
Forecast of Fob Cash Costs –Basis 6000 nec
0.0
10.0
20.0
30.0
40.0
50.0
60.0
70.0
80.0
2005 2007 2009 2011 2013 2015 2017 2019 2021 2023 2025
$/t
Australia NominalAustralia RealSouth Africa NominalSouth Africa RealRussia NominalRussia Real

Copyright © 2007 Global Insight, Inc. 13
Steam Coal Price Outlook
• Market operation market and price drivers
• Review of costs and prices
• Forecasts
• Coal vs. other fuels
Copyright © 2007 Global Insight, Inc. 13

Copyright © 2007 Global Insight, Inc. 14
Short-term Forecast
0
20
40
60
80
100
120
02Q1 03Q1 04Q1 05Q1 06Q1 07Q1 08Q1 09Q1 10Q1
2006
U.S
.$/T
onne
Bas
is 6
,000
nec
Weighted Average freight ARA 2006/t
Weighted Average Coal fob 2006/t

Copyright © 2007 Global Insight, Inc. 15
Short-term Forecast (Early November) vs. Forward Curve
0
20
40
60
80
100
120
140
03Q1 03Q4 04Q3 05Q2 06Q1 06Q4 07Q3 08Q2 09Q1 09Q4 10Q3
US
Dol
lars
/tonn
e
"TFS API#2 ®" 16/11/2007
C&F ARA
Global Insight Forecast
Copyright © 2007 Global Insight, Inc. 16
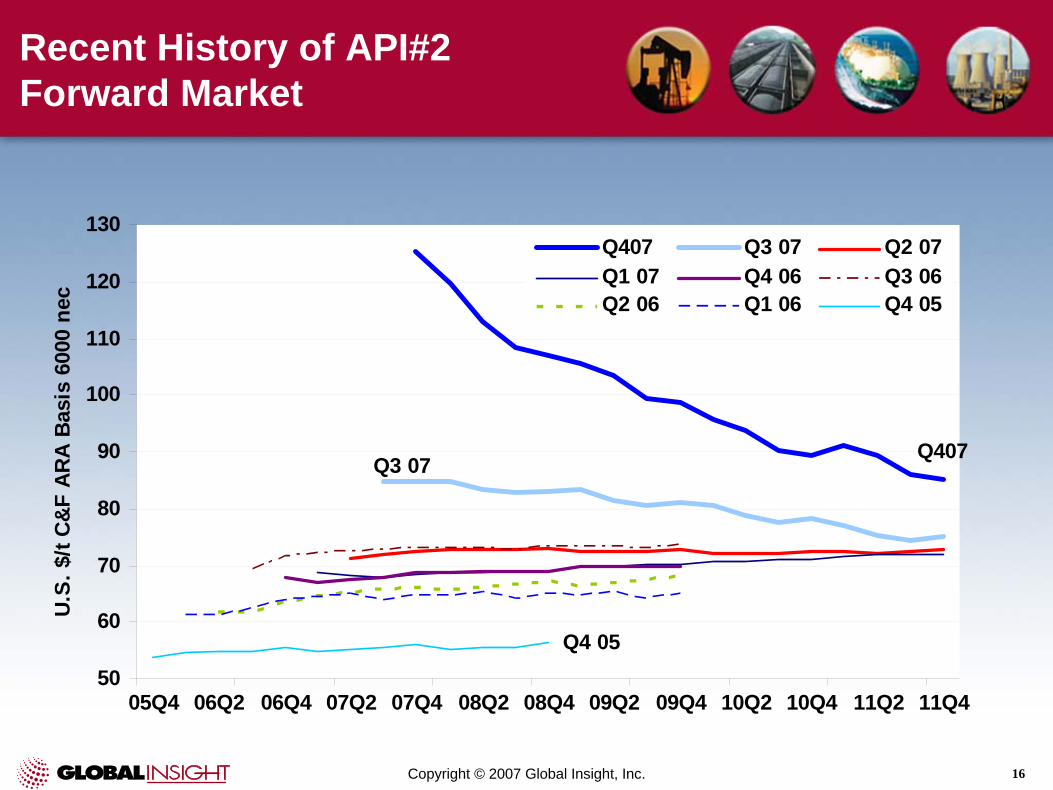
Recent History of API#2 Forward Market
Q407Q3 07
Q4 0550
60
70
80
90
100
110
120
130
05Q4 06Q2 06Q4 07Q2 07Q4 08Q2 08Q4 09Q2 09Q4 10Q2 10Q4 11Q2 11Q4
U.S
. $/t
C&F
ARA
Basi
s 60
00 n
ec
Q407 Q3 07 Q2 07Q1 07 Q4 06 Q3 06Q2 06 Q1 06 Q4 05
Copyright © 2007 Global Insight, Inc. 17
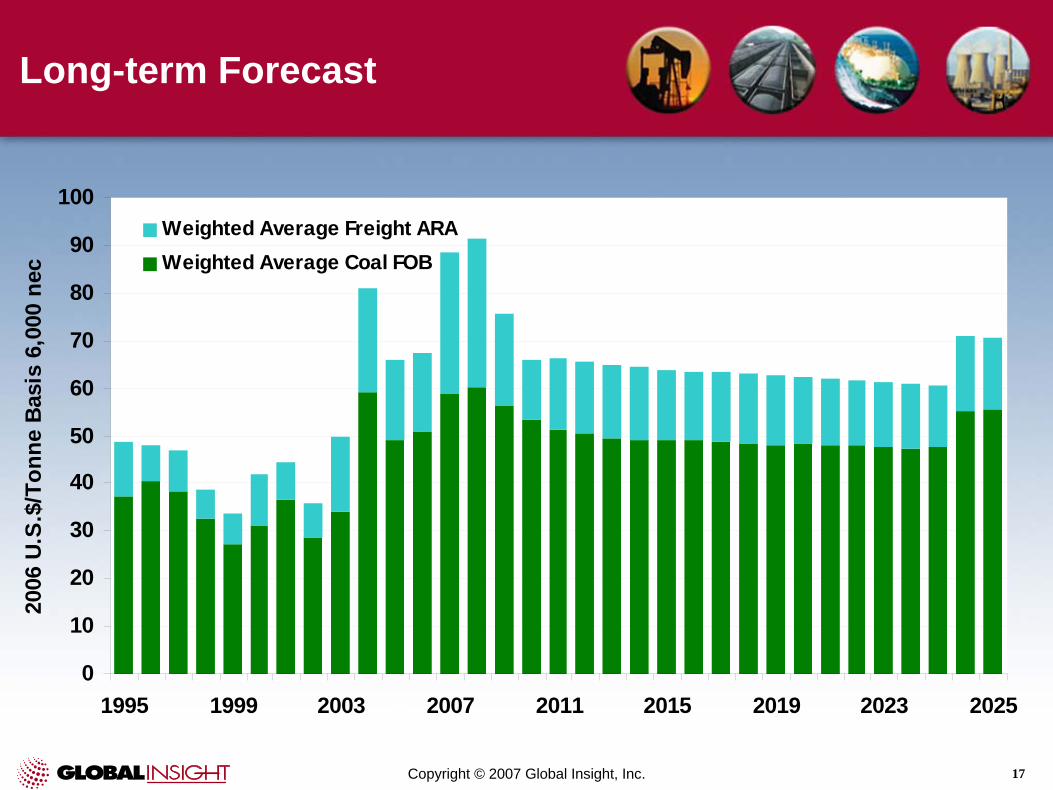
Long-term Forecast
0
10
20
30
40
50
60
70
80
90
100
1995 1999 2003 2007 2011 2015 2019 2023 2025
2006
U.S
.$/T
onne
Bas
is 6
,000
nec
Weighted Average Freight ARAWeighted Average Coal FOB

Copyright © 2007 Global Insight, Inc. 18
Long-term Forecast in Context of History
0
20
40
60
80
100
120
1985 1988 1991 1994 1997 2000 2003 2006 2009 2012 2015 2018 2021 2024
U.S.
$/T
ce
C&F ARA EU Historical Average ARA Price 1985 - 2006Global Insight Forecast C&F ARA

Copyright © 2007 Global Insight, Inc. 19
Steam Coal Price Outlook
• Market operation market and price drivers
• Review of costs and prices
• Forecasts
• Coal vs. other fuels
Copyright © 2007 Global Insight, Inc. 19

Copyright © 2007 Global Insight, Inc. 20
0
100
200
300
400
500
600
700
800
1996 1997 1998 1999 2000 2001 2002 2003 2004 2005 2006 2007
U.S.
$/T
oe
Dated BrentHSFO (ARA)NBP GasCoal (ARA)Russian Gas - Waidhaus
Comparison of All Fuels to End October 2007 – (Nominal)

Copyright © 2007 Global Insight, Inc. 21
0
100
200
300
400
500
600
700
800
900
2008 2010 2012 2014 2016 2018 2020 2022 2024
2006
$/T
oe
Waidhaus Gas Forecast + Carbon at 55% Efficiency
ARA Coal Forecast + Carbon at 40% Efficiency
Forecast vs. Gas Forecast
Assumes CO2 at €22.50/t real
