coal market a makro trend - uni flensburg · pdf filecoal market – a makro trend...
TRANSCRIPT
© HMS Bergbau Group
not to be copied or distributed without written consent Slide 0
Project Name
Coal market – a makro trend
Wendelin Knauss
Flensburg, März 2016

© HMS Bergbau Group
not to be copied or distributed without written consent Slide 1
Project Name HMS Bergbau AG – Dry Bulk Trading from Berlin with Subsidiaries
in South Africa, Singapore, Indonesia, Poland
Headquarters
Subsidiary
Rep Office
© HMS Bergbau Group
not to be copied or distributed without written consent Slide 2
Project Name
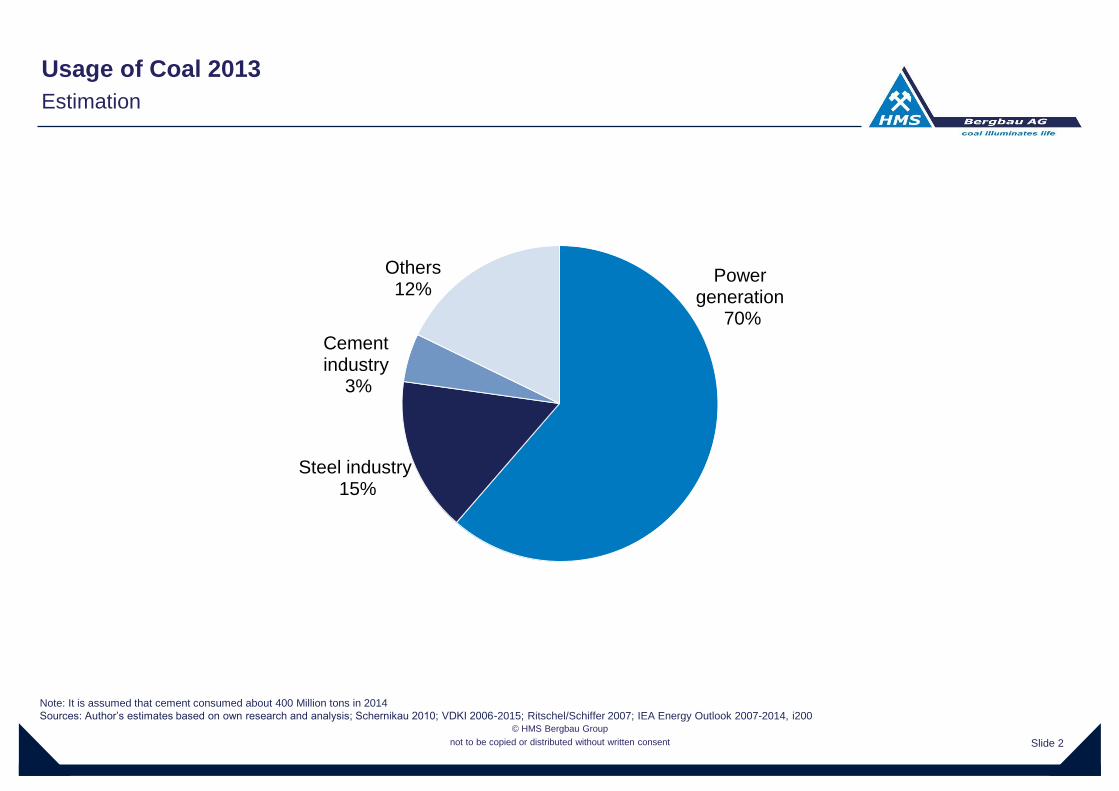
Power generation
70%
Steel industry 15%
Cement industry
3%
Others 12%
Note: It is assumed that cement consumed about 400 Million tons in 2014
Sources: Author’s estimates based on own research and analysis; Schernikau 2010; VDKI 2006-2015; Ritschel/Schiffer 2007; IEA Energy Outlook 2007-2014, i200
Usage of Coal 2013
Estimation

© HMS Bergbau Group
not to be copied or distributed without written consent Slide 3
Project Name
0
20
40
60
80
100
China USA Other
5.033 TWh
22%(1) 1.1
28
TW
h, 5
%
4.291 TWh
19%(1) 1.0
71
TW
h, 5
%(1
)
1.0
34
TW
h, 5
%(1
)
63
4 T
Wh, 3
%(1
)
63
0 T
Wh, 3
%(1
)
56
4 T
Wh, 2
%(1
)
53
5 T
Wh, 2
%(1
)
55
2 T
Wh, 2
%(1
)
7.910 TWh
35% Share of
energy source
worldwide in %
Nuclear (11%)
Other (22%)
Coal (40%)
Gas (22%)
Petroleum (5%)
Ind
ia
Russia
Ja
pa
n
Can
ad
a
Ge
rma
ny
Fra
nce
B
razil
Ko
rea
∑ = ~22.750 TWh
Electricity generation
+3,2% p.a. (2)
World
p.a.
+9,7%(2)
p.a.
+7,6%(2) Coal p.a.
+3,2%(2)
2013 Top 10 Electricity Producers…
… Account for 68% of Global Electricity Production
(1) Electricity production share of respective country; (2) CAGR 2005-2012 in %
Sources: IEA-Statistics 2014; author’s analysis; i234

© HMS Bergbau Group
not to be copied or distributed without written consent Slide 4
Project Name
Sources: IEA-Statistics 2004 to 2014; author’s analysis, i236
0
20
40
60
80
100
China USA Other
Ind
ia
Russia
Ja
pa
n
Can
ad
a
Ge
rma
ny
Fra
nce
B
razil
Ko
rea
2013 ∑ = ~22.750 TWh
0
20
40
60
80
100
China USA Other
Ja
pa
n
Russia
Ind
ia
Can
ad
a
Ge
rma
ny
Fra
nce
B
razil
UK
2005 ∑ = ~18.300 TWh
World average
coal share
Nuclear (15%) Other (18%) Coal (40%)
Gas (20%) Petroleum (7%)
Nuclear (11%) Other (22%) Coal (40%)
Gas (22%) Petroleum (5%)
Coal and Electricity Generation 2005 vs. 2013
% %
World average
coal share
Electricity generation in % share of energy source worldwide

© HMS Bergbau Group
not to be copied or distributed without written consent Slide 5
Project Name
World 1990 Growth 1990-2013(23 years)
World 2013 Growth 2013-2035(22 years)
World 2035
57%
8.118
Note: Percentages may not add to 100 due to rounding
Sources: BP Energy Outlook 2015; s695 and S154; IEA (what, year?); author’s analysis; i202
Energy Demand Will Grow Until 2035: OECD vs. Non-OECD
World Energy Demand Will Continue to Increase, Driven by Non-OECD Demand
33%
8%
4.612
9%
47%
24%
20% 2,2%
12.730
5%
22%
43%
30%
4.724
16%
36%
44%
4%
8%
26%
33%
33%
17.455
2,0% 1.4%
0,1%
2,0%
2,2%
3,8%
India
OECD
Non-OECD excl. China & India
China
Avg. growth p.a. (CAGR) x%
Primary energy consumption growth by region (in Billion toe)
81%
43% (Non-OECD)
57% (Non-OECD)
96%
67%

© HMS Bergbau Group
not to be copied or distributed without written consent Slide 6
Project Name
Note: 2013 data; reserves + resources = remaining potential; oil and gas include non-conventional reserves and resources
Sources: BGR 2014; author’s analysis; i254b
265
100 58 52 20
4.436
2.658
244 132
245
0
200
400
600
800
1000
1200
1400
1600
Oil Uranium Gas Hard coal Lignite
4.000
2.000
2.500
3.500
3.000
Static range of energy fuels worldwide (production ratios) in 2013
4.500 Years
2013 Coal’s Remaining Potential is Huge
Left column: reserve/production ratio
Right column: remaining potential/production ratio

© HMS Bergbau Group
not to be copied or distributed without written consent Slide 7
Project Name So, what’s the macro-trend for coal?
+40%
coal
+45%
coal?
Coal: 30% primary energy share Coal: +40% electricity share
(China ~75%, India ~70%, ∑ Asia +60%)
World electricity (today)
World electricity (in 20 years)
Absolute and relative growth of coal for power is inevitable – until an energy revolution!
… population will grow from 7,3 Bln people today to about ~8,5 Bln by 2035
1,5 Bln people have
no electricity
2 Bln people have only
access to erratic power
∑ 3,5 Bln people lack
electricity today!
Source: Author’s research and analysis based on Schernikau 2010; IEA-Statistics 2012 and 2014; Forbes 2014; VDKI 2006 to 2015; ixxx
© HMS Bergbau Group
not to be copied or distributed without written consent Slide 8
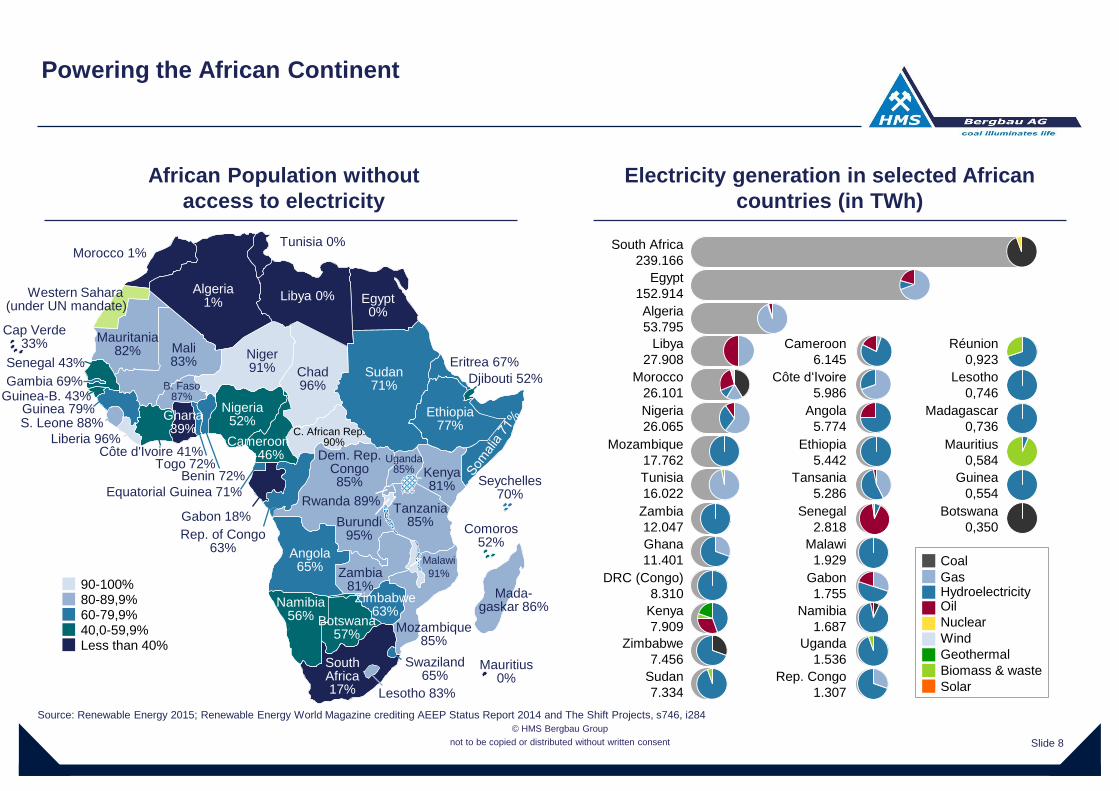
Project Name Powering the African Continent
Ghana
11.401
Malawi
1.929
South Africa
239.166
Egypt
152.914
Algeria
53.795
Libya
27.908
Cameroon
6.145
Réunion
0,923
Morocco
26.101
Côte d‘Ivoire
5.986
Lesotho
0,746
Nigeria
26.065
Angola
5.774
Madagascar
0,736
Mozambique
17.762
Ethiopia
5.442
Mauritius
0,584
Zambia
12.047
Senegal
2.818
Botswana
0,350
DRC (Congo)
8.310
Gabon
1.755
Kenya
7.909
Namibia
1.687
Sudan
7.334
Rep. Congo
1.307
Tunisia
16.022
Tansania
5.286
Guinea
0,554
Zimbabwe
7.456
Uganda
1.536
Hydroelectricity
Wind
Coal
Nuclear
Gas
Oil
Biomass & waste
Geothermal
Solar
African Population without
access to electricity
Electricity generation in selected African
countries (in TWh)
Ethiopia 77%
Djibouti 52%
Eritrea 67%
Mada- gaskar 86%
Western Sahara (under UN mandate)
Comoros 52%
Seychelles 70%
Sudan 71%
Kenya 81%
Tanzania 85%
Uganda 85%
Burundi 95%
Rwanda 89%
Dem. Rep. Congo 85%
Zambia 81%
Malawi
91%
Zimbabwe63%
Mozambique 85%
Swaziland 65%
Mauritius 0%
Lesotho 83%
South Africa 17%
Botswana 57%
Namibia 56%
Angola 65%
Rep. of Congo 63%
Gabon 18%
Equatorial Guinea 71%
C. African Rep. 90%
Chad 96%
Niger 91%
Nigeria 52%
Cameroon 46%
Benin 72%
Ghana 39%
Togo 72% Côte d'Ivoire 41%
Liberia 96%
S. Leone 88% Guinea 79%
Guinea-B. 43% Gambia 69%
Senegal 43%
Mauritania 82% Mali
83%
B. Faso 87%
Algeria 1%
Morocco 1% Tunisia 0%
Libya 0% Egypt 0%
Cap Verde 33%
Less than 40%
60-79,9% 40,0-59,9%
80-89,9% 90-100%
Source: Renewable Energy 2015; Renewable Energy World Magazine crediting AEEP Status Report 2014 and The Shift Projects, s746, i284

© HMS Bergbau Group
not to be copied or distributed without written consent Slide 9
Project Name Coal Receives Only Minimal Resource Investment Share …
World Energy Investments Cumulative Between 2014 and 2035 (New Policies Scenario)
17%
9% 13%
14%
8%
17%
Energy resource investments:
~23,8 Trillion US$(1)
Coal resource investments:
~1,0 Trillion US$(1)
China
India Australia &
Indonesia 13%
US, Canada
& Colombia
Russia &
South Africa
Other & Shipping
71% Mining
(sustaining and new)
Shipping & ports
Coal
29% 37,4%
Gas
58,2%
Oil
4,4%
(1) Global cumulative investment in Energy 40 Trillion US$, of which 40% or 16,4 Trillion US$ are investments in electricity generation (of which 9,6 Trillion power generation); 23,8 Trillion US$ investments in energy resources
Note: IEA New Policy Scenario assumed, US$ of year 2012
Sources: IEA World Energy Investment Outlook 2014; Dissertation Lars Schernikau 2009, s683, p101, p103; i221b
Coal receives only 1.034 Billion US$ or 4% of
resource investments

© HMS Bergbau Group
not to be copied or distributed without written consent Slide 10
Project Name
(1) The author added 61 Mt of subbituminous coal supplied to India in 2014 to the seaborne trade numbers; Perret estimates 985 Mln tonnes
Sources: VDKI 2014-2015; author’s analysis; i206b
939 Mt International Traded Steam Coal
Σ = 7,2 Bt
1,3 Bt internationally
traded
5,9 Bt local
consumption
Σ = 1,3 Mt
1.241 Mt seaborne
trade
85 Mt green border
trade
Σ = 1,2 Mt
939 Mt steam coal(1)
309 Mt coking coal
Production International trade Seaborne trade
Global coal volumes in 2014

© HMS Bergbau Group
not to be copied or distributed without written consent Slide 11
Project Name 2014 Global Seaborne Coking Coal Trade Flows
Canada
30 Mt
Colombia
6 MT
Russia
13 Mt
Indonesia
1 MT
Mozambique
2 Mt Australia
186 Mt
Brazil
19 Mt
Europe
59 Mt
India
49 Mt
China
61 Mt
Japan
55 Mt
Korea
33 Mt 32 Mt
USA
53 MT
1 Mt
3 Mt
7 Mt
2 Mt
2 Mt 22 Mt
Taiwan
11 Mt
40 Mt
19 Mt
Major exporter
Major importer
Note: 2014 full-year data, making assumptions for land-borne trade
Source: MacQuarie 2015 (s754) based on Customs data, Macquarie Research, September 2015, i227

© HMS Bergbau Group
not to be copied or distributed without written consent Slide 12
Project Name
1) Includes China (222 incl 60 lignite), Japan (114), Korea (107), Taiwan (68), Thailand (25), Malaysia (22) Hong Kong (13), other (South East) Asia (35)
2) Including low CV/lignite steam coal exports
3) Including Mediterranean and North Africa
Source: Author’s research and analysis, based on Perret
40 %
Coal 79
South
Africa
214
Australia
405(2)
Indonesia
97
8
Vietnam
76
Colombia/
Venezuela
Russia
56
USA
Canada 166(3)
Europe
604(1)
(South-) East
Asia
India
21
Import Export
32
Latin
America
152
50
Other
Coal movements in 2014 in Mio t
985 Mio. Tons Steam Coal Traded in 2014 (Perret)
ME &
Africa
9

© HMS Bergbau Group
not to be copied or distributed without written consent Slide 13
Project Name
2014 Asian Steam Coal Trading Distribution (Perret)
Pacific Market: coal movements in 2014 in Mio t
South Africa
Australia
79
Indonesia
97
China
Russia
4
Pakistan Japan
SEA
South Korea
Hong Kong, imported
13 Mio t
145
107
405(2)
xx
222(1)
214
US, Canada,
Colombia
~ 46 Mio t
(to China: 5 Mio)
(to India: 29 Mio)
(to Africa/ME: 8 Mio)
~ 46 Mio t ~ 51 Mio t
~ 14 Mio t
Indo’s Exports (approx)
India 116
China 106
South Korea 36
Taiwan 27
Japan 15
~ 106
~ 116
Australia’s Exports (approx)
Japan 80
China 62
South Korea 35
Taiwan 20
Export
Import
1) Inc lignite coal from Indonesia
2) Inc lignite coal
Source: Author’s research and analysis, based on Perret; Chinese Customs Data; RBCT Export Data; and various market research
~ 33 Mio t
(to DE+NL: 12 Mio)
(to Turkey: 4 Mio)
(to Med/N.Afr.: 3 Mio)
(to UK: 1 Mio)
153
India
~ 3
~ 1 Taiwan
67

© HMS Bergbau Group
not to be copied or distributed without written consent Slide 14
Project Name
Note: API2 = coal price CIF Europe; API4 = coal price FOB South Africa
Source: Author’s Analysis; McCloskey Coal Price Index, author’s analysis
API-2 (US$/t)
API-4 (US$/t)
0
25
50
75
100
125
150
175
200
225
Jan
04
Jan
05
Jan
06
Jan
07
Jan
08
Jan
09
Jan
10
Jan
11
Jan
12
Jan
13
Jan
14
Jan
15
Jan
16
Jan
17
Jul 08: 210 US$/t US$/t
Mar 09: 62 US$/t
Coal Indices 2002-2015 (as per November 2015)
Prices today at 8-year low
Coal will be around for decades to come…
… and coal prices will definitely recover (only when?)
40455055606570758085
Ju
l 1
4
Se
p 1
4
No
v 1
4
Ja
n 1
5
Mrz
15
Mai 1
5
Ju
l 1
5
Se
p 1
5
No
v 1
5
Ja
n 1
6
Mrz
16
Mai 1
6
(2014 historic and forward)
Per Nov 2015
?