co2 capture from igcc gas streams using the ac-abc … library/events/2016/c02 cap review/1... ·...
TRANSCRIPT

CO2 Capture from IGCC Gas Streams Using the AC-ABC Process
2016 NETL CO2 Capture Technology Meeting August 08, 2016 Pittsburgh, PA
Anoop [email protected]
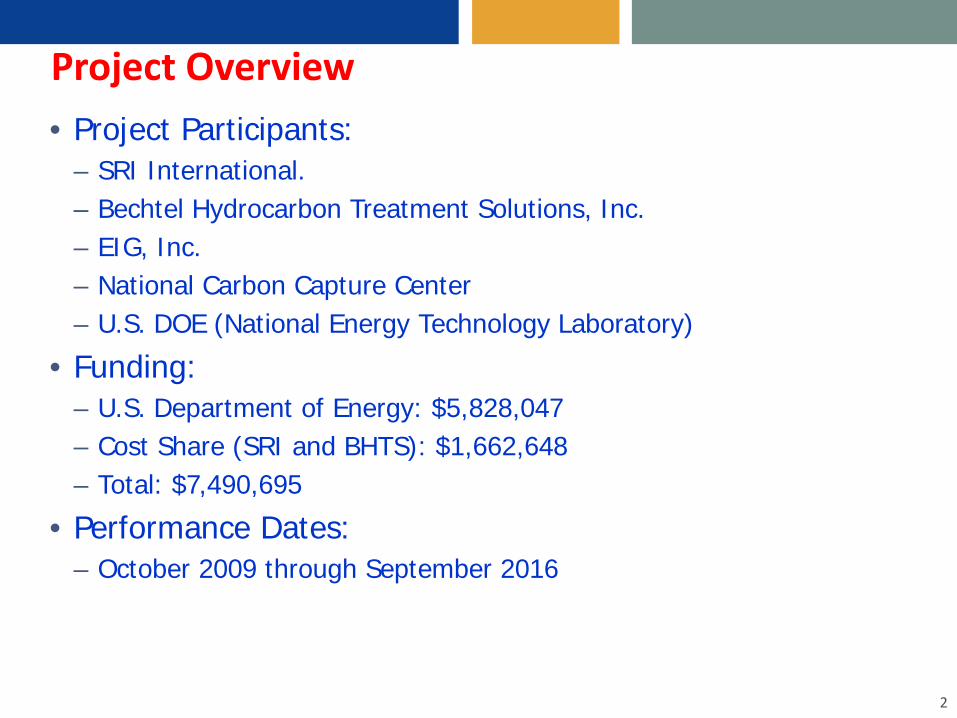
Project Overview• Project Participants:
– SRI International.– Bechtel Hydrocarbon Treatment Solutions, Inc.– EIG, Inc.– National Carbon Capture Center– U.S. DOE (National Energy Technology Laboratory)
• Funding:– U.S. Department of Energy: $5,828,047– Cost Share (SRI and BHTS): $1,662,648– Total: $7,490,695
• Performance Dates:– October 2009 through September 2016
2
Project Objectives
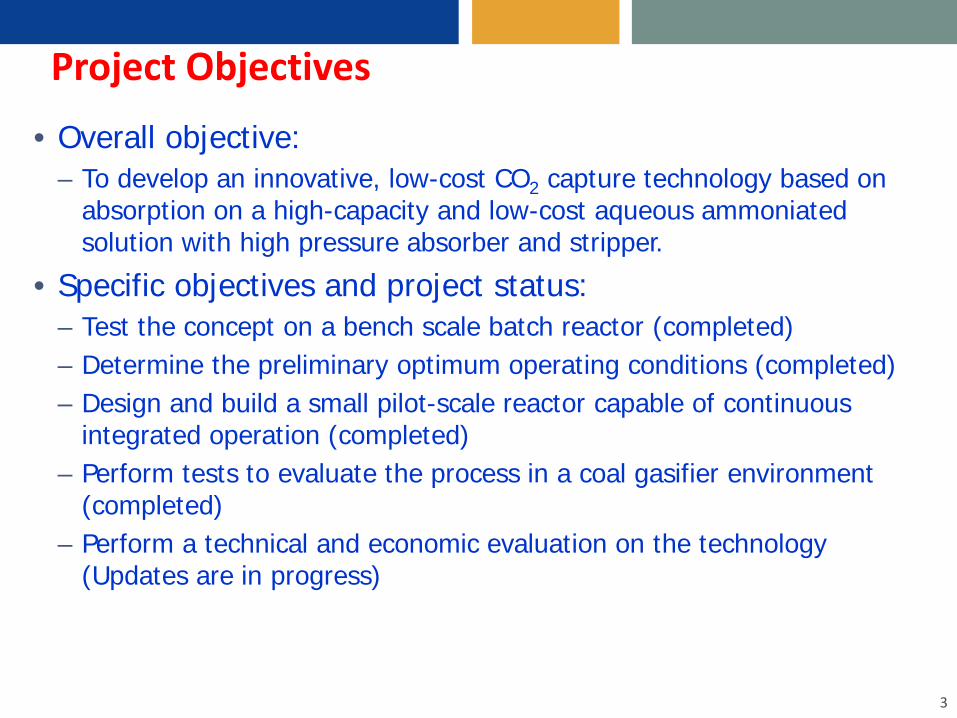
• Overall objective:– To develop an innovative, low-cost CO2 capture technology based on
absorption on a high-capacity and low-cost aqueous ammoniated solution with high pressure absorber and stripper.
• Specific objectives and project status:– Test the concept on a bench scale batch reactor (completed)– Determine the preliminary optimum operating conditions (completed)– Design and build a small pilot-scale reactor capable of continuous
integrated operation (completed)– Perform tests to evaluate the process in a coal gasifier environment
(completed)– Perform a technical and economic evaluation on the technology
(Updates are in progress)
3
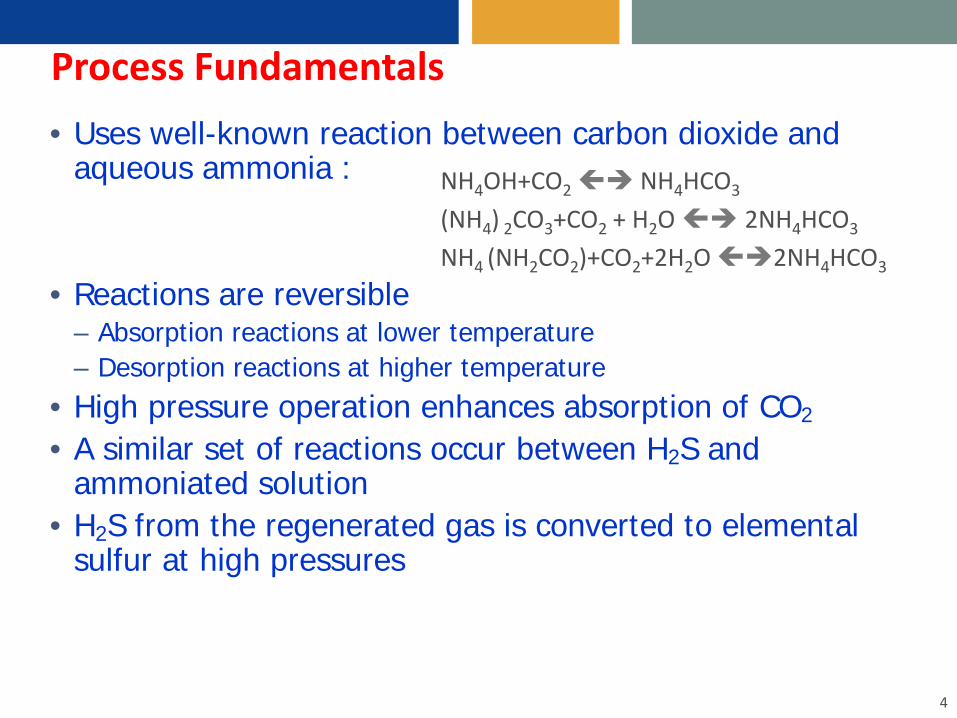
Process Fundamentals• Uses well-known reaction between carbon dioxide and
aqueous ammonia :
• Reactions are reversible – Absorption reactions at lower temperature – Desorption reactions at higher temperature
• High pressure operation enhances absorption of CO2
• A similar set of reactions occur between H2S and ammoniated solution
• H2S from the regenerated gas is converted to elemental sulfur at high pressures
4
NH4OH+CO2 NH4HCO3
(NH4) 2CO3+CO2 + H2O 2NH4HCO3
NH4 (NH2CO2)+CO2+2H2O 2NH4HCO3

Process Block Flow Diagram
5
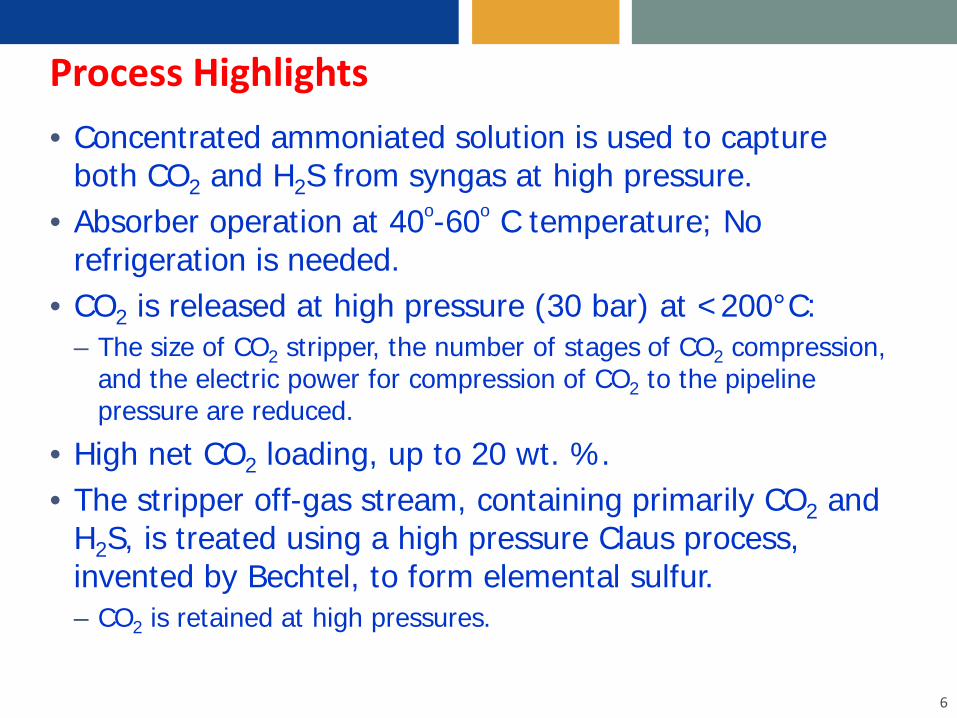
Process Highlights• Concentrated ammoniated solution is used to capture
both CO2 and H2S from syngas at high pressure.• Absorber operation at 40o-60o C temperature; No
refrigeration is needed.• CO2 is released at high pressure (30 bar) at <200°C:
– The size of CO2 stripper, the number of stages of CO2 compression, and the electric power for compression of CO2 to the pipeline pressure are reduced.
• High net CO2 loading, up to 20 wt. %.• The stripper off-gas stream, containing primarily CO2 and
H2S, is treated using a high pressure Claus process, invented by Bechtel, to form elemental sulfur.– CO2 is retained at high pressures.
6
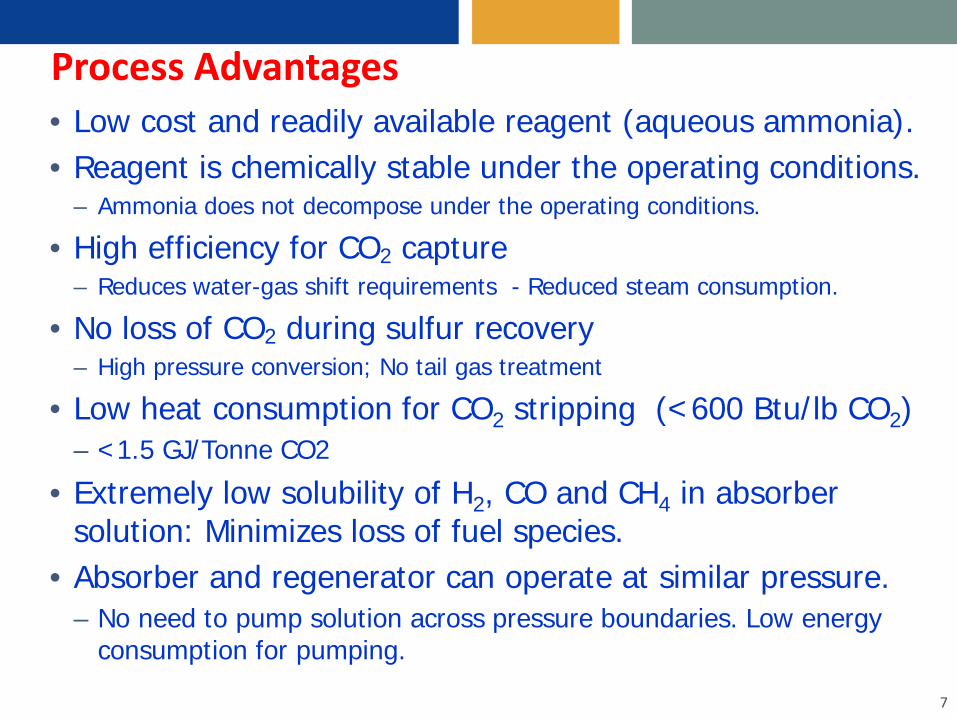
Process Advantages• Low cost and readily available reagent (aqueous ammonia).• Reagent is chemically stable under the operating conditions.
– Ammonia does not decompose under the operating conditions.
• High efficiency for CO2 capture– Reduces water-gas shift requirements - Reduced steam consumption.
• No loss of CO2 during sulfur recovery– High pressure conversion; No tail gas treatment
• Low heat consumption for CO2 stripping (<600 Btu/lb CO2)– <1.5 GJ/Tonne CO2
• Extremely low solubility of H2, CO and CH4 in absorber solution: Minimizes loss of fuel species.
• Absorber and regenerator can operate at similar pressure. – No need to pump solution across pressure boundaries. Low energy
consumption for pumping.
7
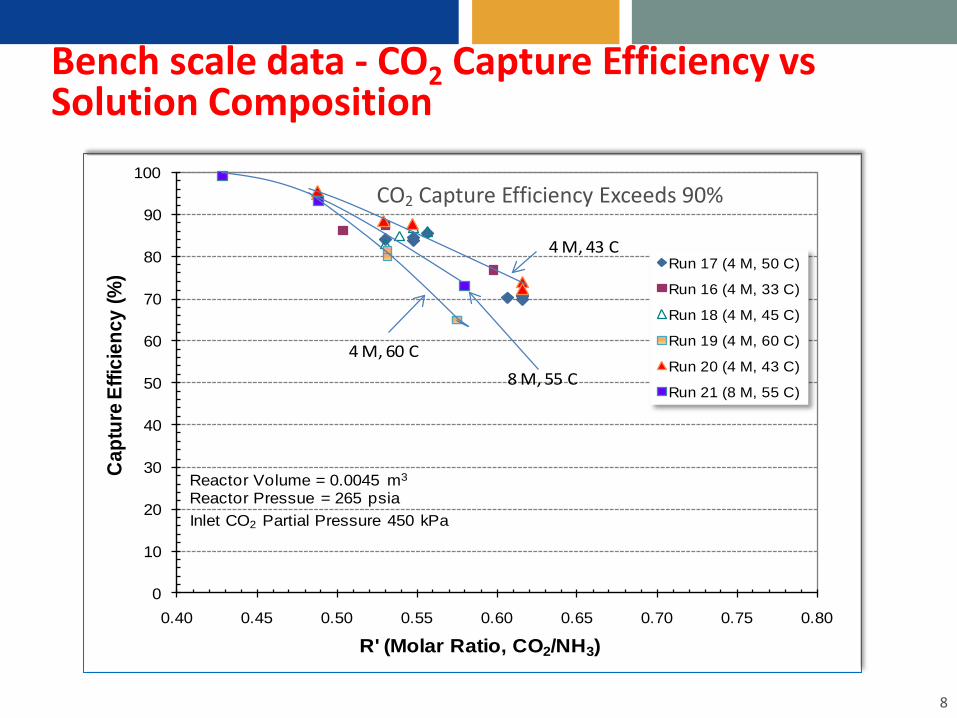
Bench scale data - CO2 Capture Efficiency vs Solution Composition
8
0
10
20
30
40
50
60
70
80
90
100
0.40 0.45 0.50 0.55 0.60 0.65 0.70 0.75 0.80
Cap
ture
Effi
cien
cy (%
)
R' (Molar Ratio, CO2/NH3)
Run 17 (4 M, 50 C)
Run 16 (4 M, 33 C)
Run 18 (4 M, 45 C)
Run 19 (4 M, 60 C)
Run 20 (4 M, 43 C)
Run 21 (8 M, 55 C)
Inlet CO2 Partial Pressure 450 kPa
8 M, 55 C4 M, 60 C
4 M, 43 C
Reactor Volume = 0.0045 m3
Reactor Pressue = 265 psia
CO2 Capture Efficiency Exceeds 90%
9
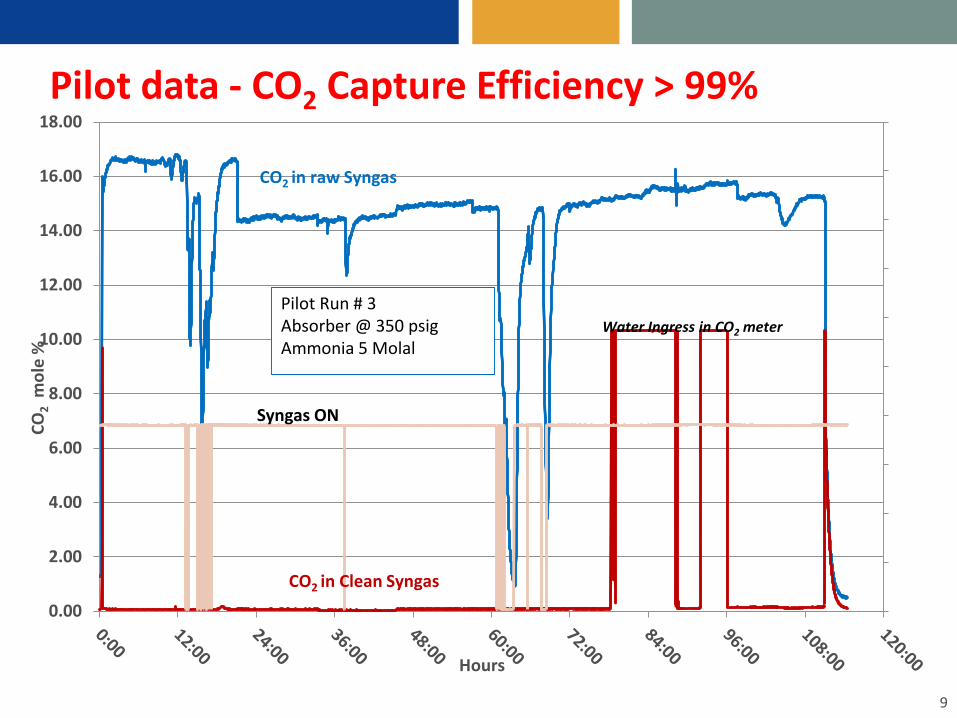
Pilot data - CO2 Capture Efficiency > 99%
0.00
2.00
4.00
6.00
8.00
10.00
12.00
14.00
16.00
18.00
CO2
mol
e %
Hours
CO2 in raw Syngas
CO2 in Clean Syngas
Syngas ON
Water Ingress in CO2 meterPilot Run # 3Absorber @ 350 psigAmmonia 5 Molal
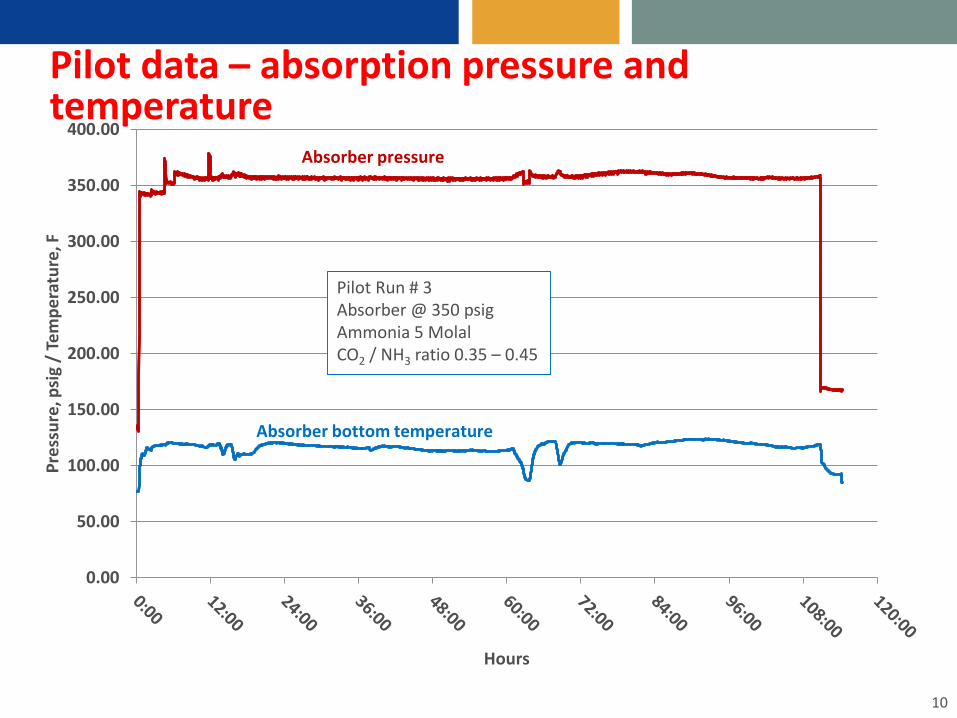
Pilot data – absorption pressure and temperature
10
0.00
50.00
100.00
150.00
200.00
250.00
300.00
350.00
400.00
Pres
sure
, psi
g /
Tem
pera
ture
, F
Hours
Absorber pressure
Absorber bottom temperature
Pilot Run # 3Absorber @ 350 psigAmmonia 5 MolalCO2 / NH3 ratio 0.35 – 0.45

Bench scale data - Rapid Rate of Reaction Approaching Equilibrium
11
0
10
20
30
40
50
0.1 0.2 0.3 0.4 0.5 0.6 0.7
CO
2Pa
rtial
Pre
ssur
e at
the
Exit
(psi
a)
R', Molar Ratio CO2/NH3
Run 17 (4 M, 50 C)
Run 16 (4 M, 33 C)
Run 13 (4 M, 45 C)
Run 11 (4 M, 45 C)
Run 18 (4 M, 45 C)
Run 19 (4 M, 60 C)
Run 20 (4 M, 43 C)
Run 21 (8 M, 55 C)
Equilibrium Line (10 M, 55 C)
Absorber Operating Pressure = 1800 kPa (265 psia)4 M and 8M Ammonia, 0.88 acfm CO2 flow rate (25 %v/v)
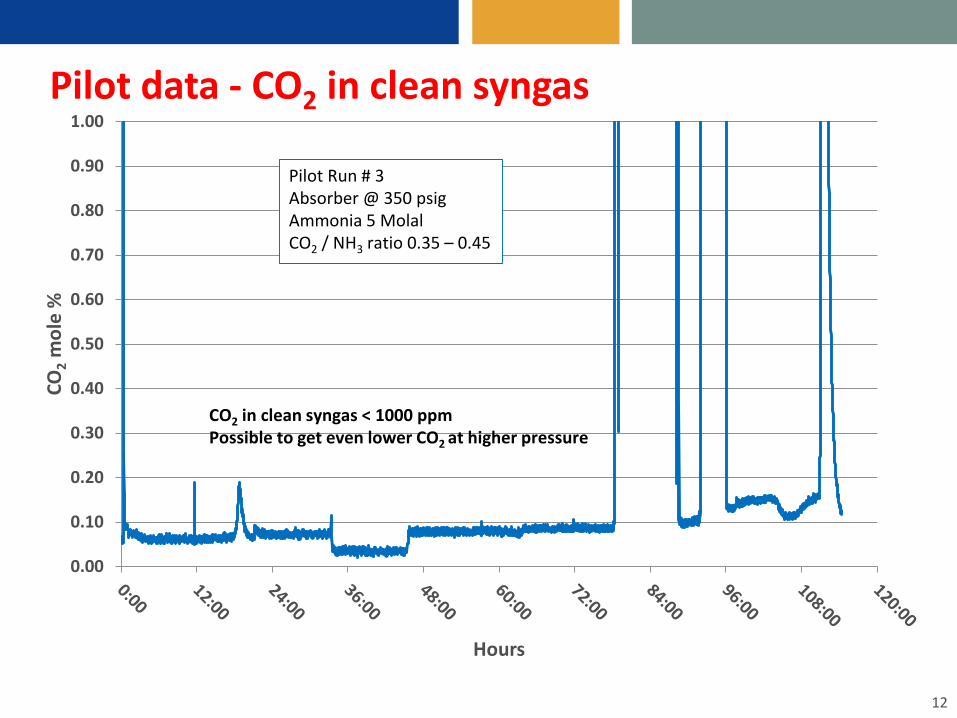
Pilot data - CO2 in clean syngas
12
0.00
0.10
0.20
0.30
0.40
0.50
0.60
0.70
0.80
0.90
1.00
CO2
mol
e %
Hours
CO2 in clean syngas < 1000 ppmPossible to get even lower CO2 at higher pressure
Pilot Run # 3Absorber @ 350 psigAmmonia 5 MolalCO2 / NH3 ratio 0.35 – 0.45
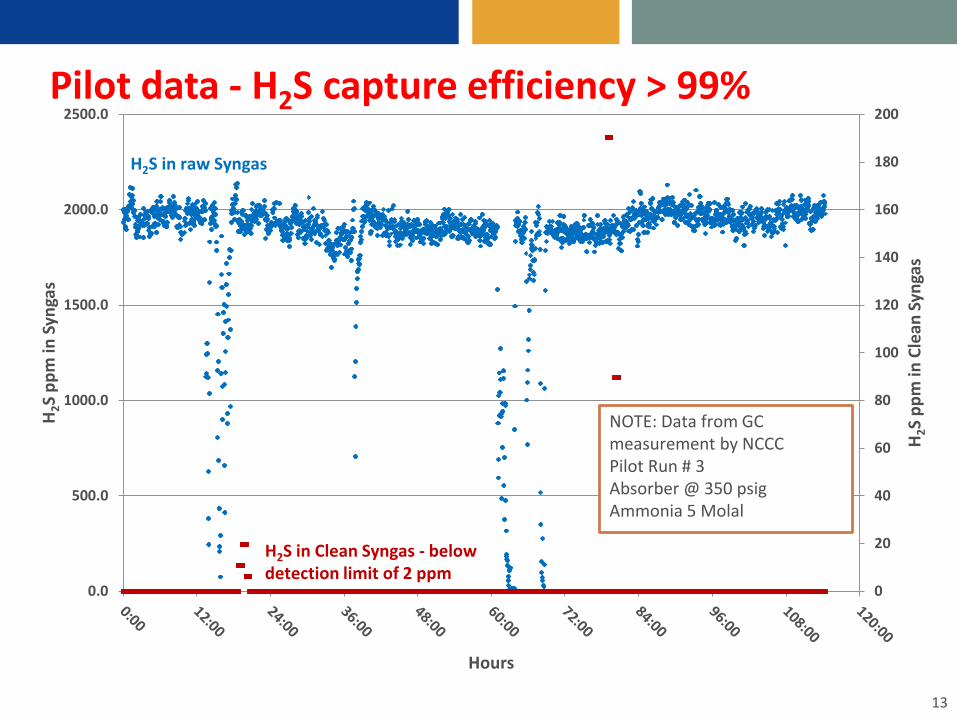
Pilot data - H2S capture efficiency > 99%
13
0
20
40
60
80
100
120
140
160
180
200
0.0
500.0
1000.0
1500.0
2000.0
2500.0
H2S
ppm
in C
lean
Syn
gas
H2S
ppm
in S
ynga
s
Hours
H2S in raw Syngas
H2S in Clean Syngas - below detection limit of 2 ppm
NOTE: Data from GC measurement by NCCCPilot Run # 3Absorber @ 350 psigAmmonia 5 Molal
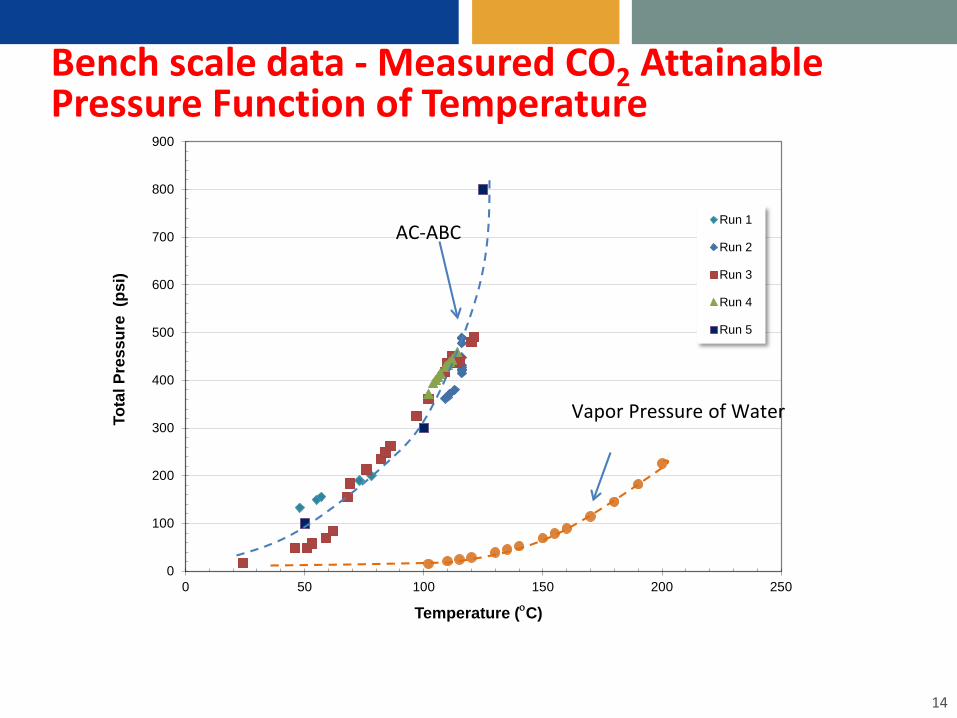
Bench scale data - Measured CO2 Attainable Pressure Function of Temperature
14
0
100
200
300
400
500
600
700
800
900
0 50 100 150 200 250
Tota
l Pre
ssur
e (p
si)
Temperature (οC)
Run 1
Run 2
Run 3
Run 4
Run 5
Vapor Pressure of Water
AC-ABC
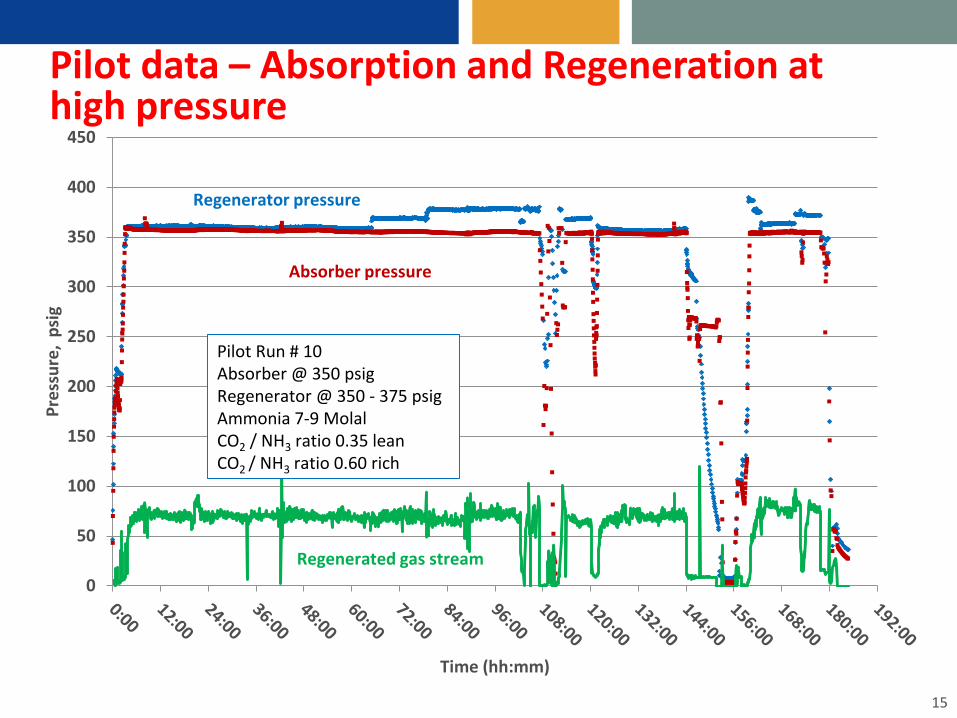
Pilot data – Absorption and Regeneration at high pressure
15
0
50
100
150
200
250
300
350
400
450
Pres
sure
, ps
ig
Time (hh:mm)
Absorber pressure
Regenerator pressure
Pilot Run # 10Absorber @ 350 psigRegenerator @ 350 - 375 psigAmmonia 7-9 MolalCO2 / NH3 ratio 0.35 leanCO2 / NH3 ratio 0.60 rich
Regenerated gas stream

Pilot data – Regeneration at moderate temperature
16
0
50
100
150
200
250
300
350
400
Tem
pera
ture
(F)
Time (hh:mm)
Reboiler temperature
Pilot Run # 10Absorber @ 350 psigRegenerator @ 350 - 375 psigAmmonia 7-9 MolalCO2 / NH3 ratio 0.35 leanCO2 / NH3 ratio 0.60 rich
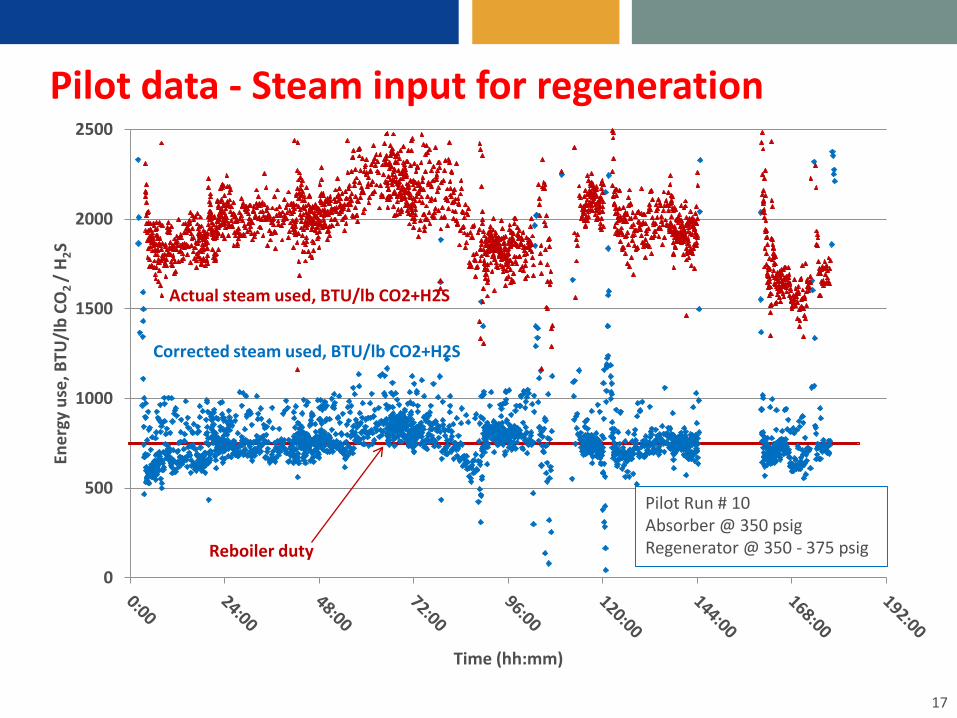
Pilot data - Steam input for regeneration
17
0
500
1000
1500
2000
2500
Ener
gy u
se, B
TU/l
bCO
2 /
H2S
Time (hh:mm)
Reboiler duty
Actual steam used, BTU/lb CO2+H2S
Corrected steam used, BTU/lb CO2+H2S
Pilot Run # 10Absorber @ 350 psigRegenerator @ 350 - 375 psig

Pilot data – Effective CO2 loading
18
0
2
4
6
8
10
12
14
16
0.00
0.10
0.20
0.30
0.40
0.50
0.60
0.70
0.80
CO2
load
ing,
wt%
CO2/
NH
3m
ole
ratio
Time (hours)
CO2/NH3 ratio in lean solution
CO2 loading
Pilot Run # 10Absorber @ 350 psigRegenerator @ 350 - 375 psigAmmonia 7-9 Molal
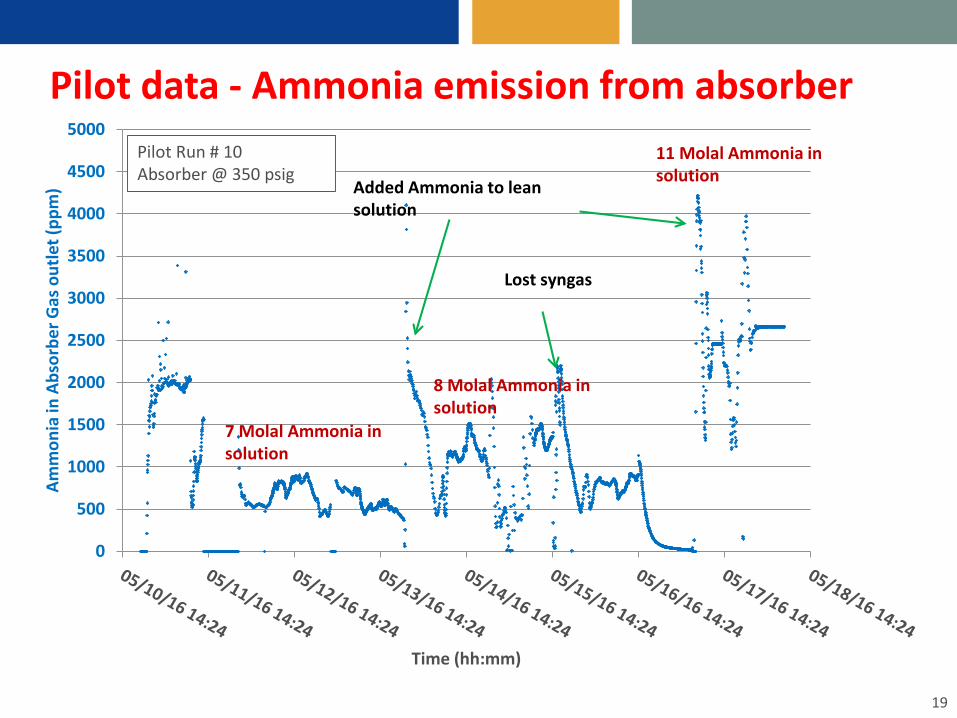
Pilot data - Ammonia emission from absorber
19
0
500
1000
1500
2000
2500
3000
3500
4000
4500
5000
Amm
onia
in A
bsor
ber G
as o
utle
t (pp
m)
Time (hh:mm)
Added Ammonia to lean solution
Lost syngas
7 Molal Ammonia in solution
8 Molal Ammonia in solution
11 Molal Ammonia in solution
Pilot Run # 10Absorber @ 350 psig
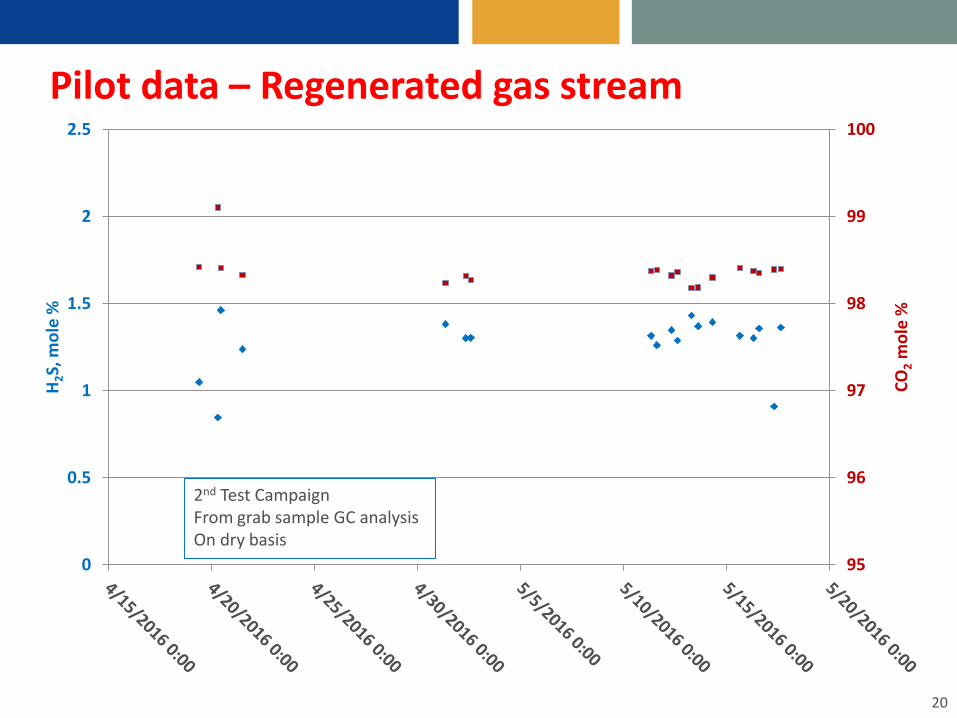
Pilot data – Regenerated gas stream
20
95
96
97
98
99
100
0
0.5
1
1.5
2
2.5
CO2
mol
e %
H2S
, mol
e %
2nd Test CampaignFrom grab sample GC analysisOn dry basis
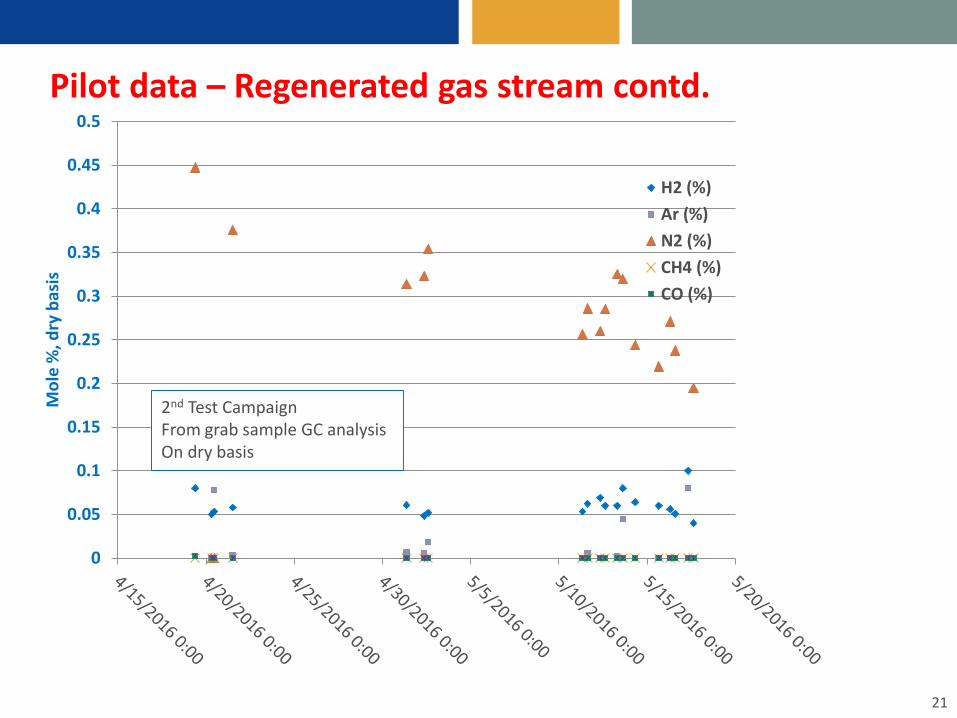
Pilot data – Regenerated gas stream contd.
21
0
0.05
0.1
0.15
0.2
0.25
0.3
0.35
0.4
0.45
0.5
Mol
e %
, dry
bas
is
H2 (%)Ar (%)N2 (%)CH4 (%)CO (%)
2nd Test CampaignFrom grab sample GC analysisOn dry basis

AC-ABC Process Schematic
22
Sour water
Clean Syngas
Syngas Feed Steam
Shift 1
Boiler Feed water
To BPSC
Steam
Shift 2
CO2/H2SStripper
dP=10-20psi
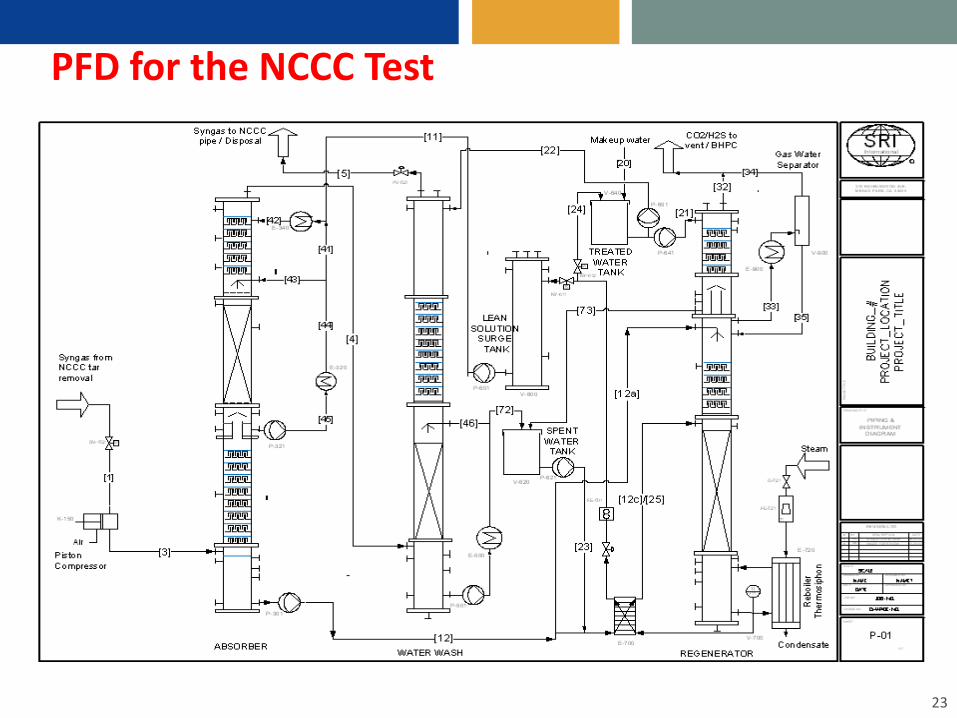
PFD for the NCCC Test
23
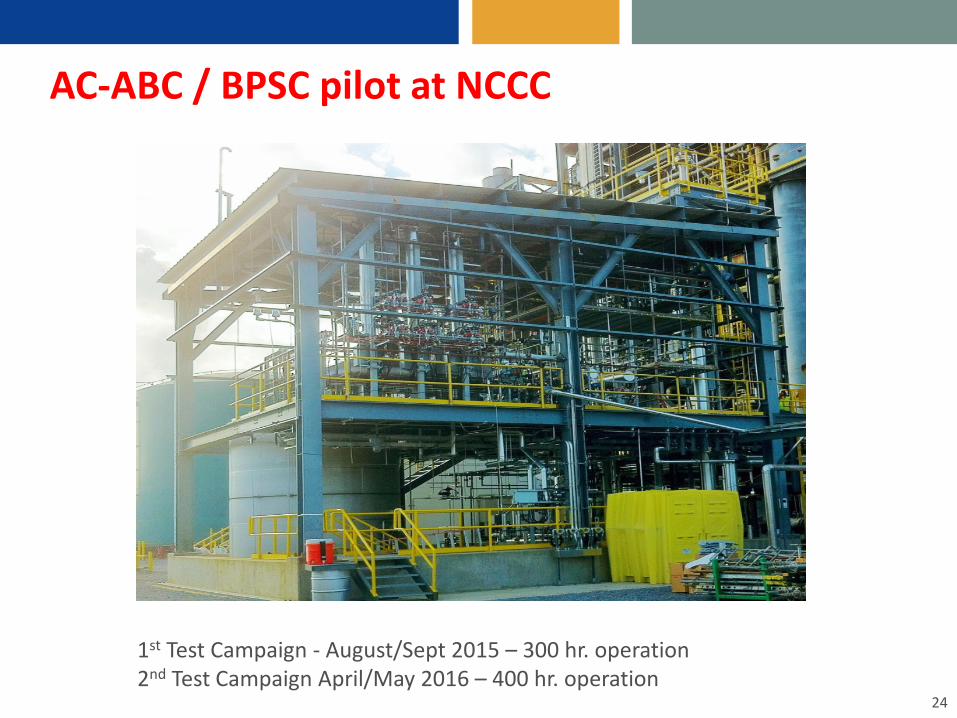
AC-ABC / BPSC pilot at NCCC
24
1st Test Campaign - August/Sept 2015 – 300 hr. operation2nd Test Campaign April/May 2016 – 400 hr. operation

Syngas Compressor and inlet gas manifold
25
Analytical equipment cabinet, pressurized- CO2 measurement- Ammonia
measurement
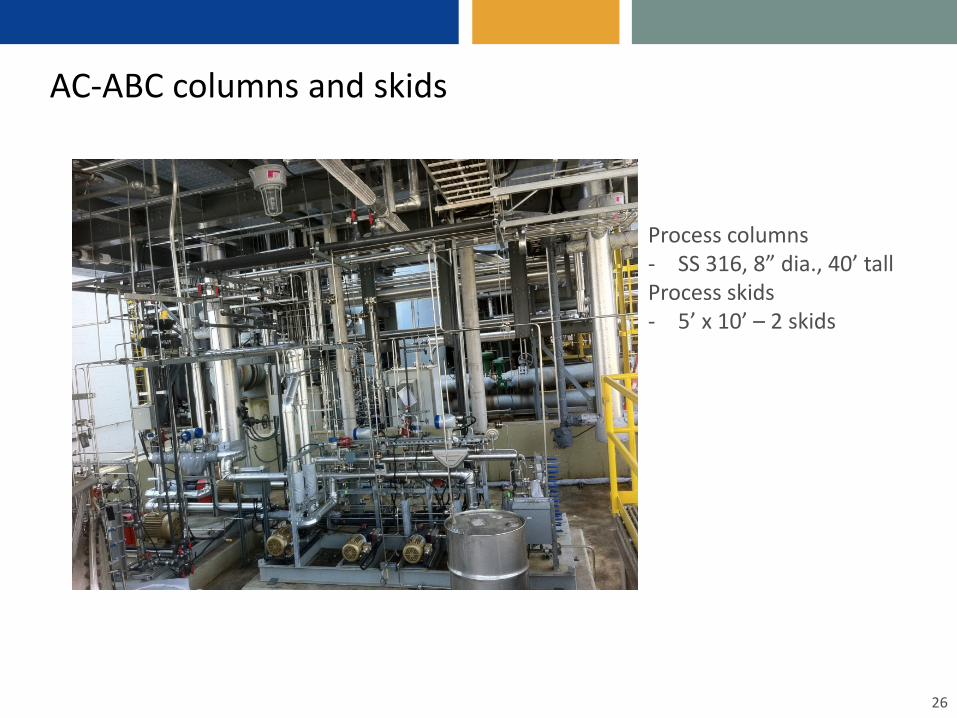
AC-ABC columns and skids
26
Process columns- SS 316, 8” dia., 40’ tallProcess skids- 5’ x 10’ – 2 skids
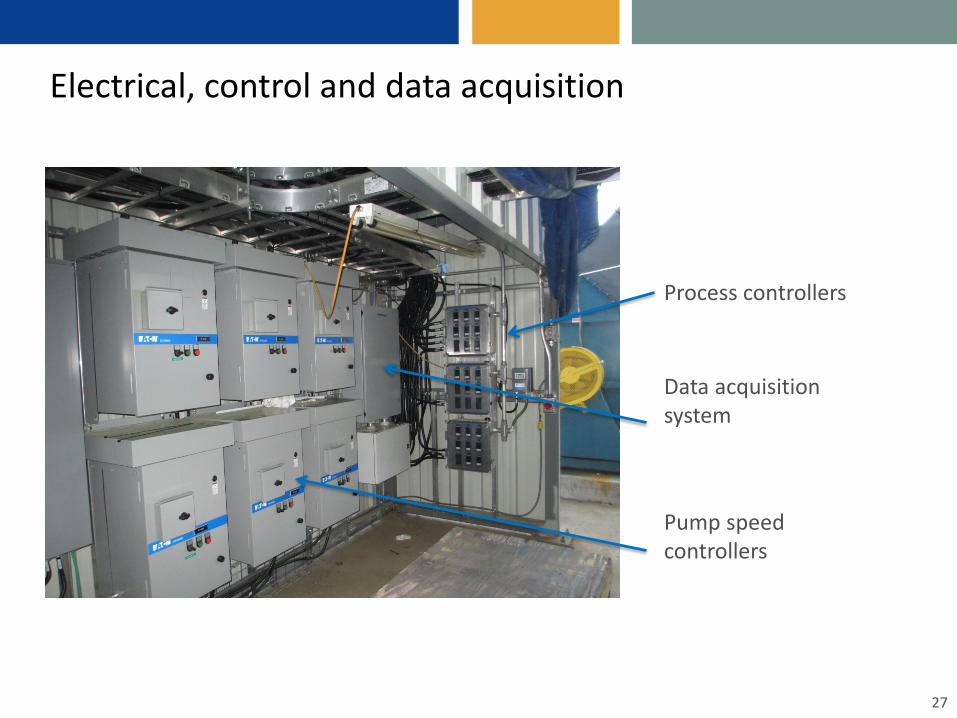
Electrical, control and data acquisition
27
Pump speed controllers
Process controllers
Data acquisition system
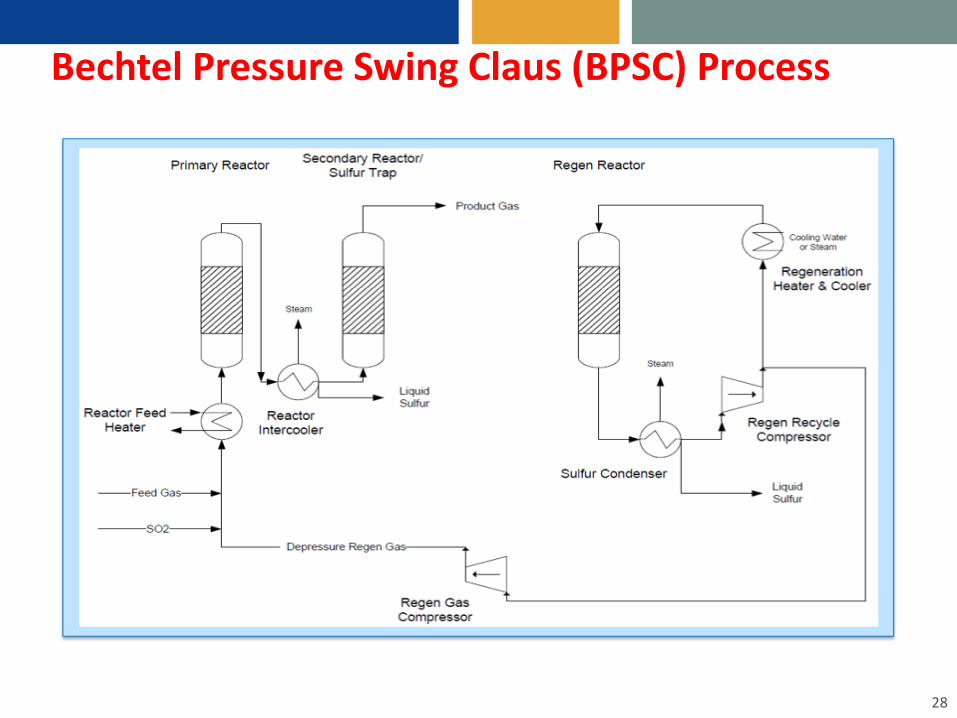
Bechtel Pressure Swing Claus (BPSC) Process
28
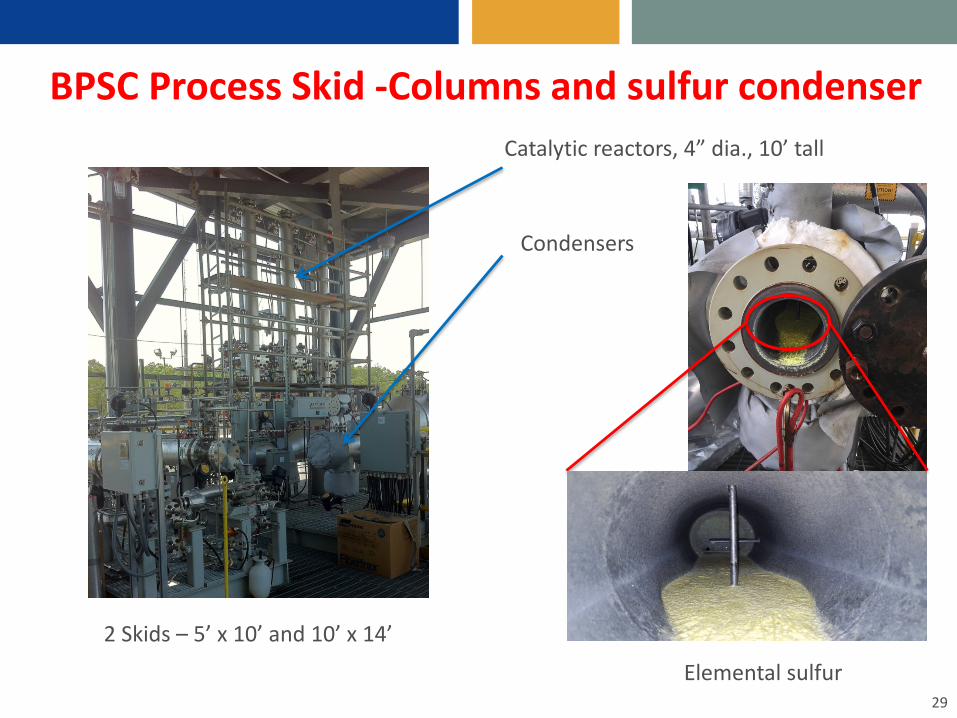
BPSC Process Skid -Columns and sulfur condenser
29
Catalytic reactors, 4” dia., 10’ tall
Condensers
2 Skids – 5’ x 10’ and 10’ x 14’
Elemental sulfur
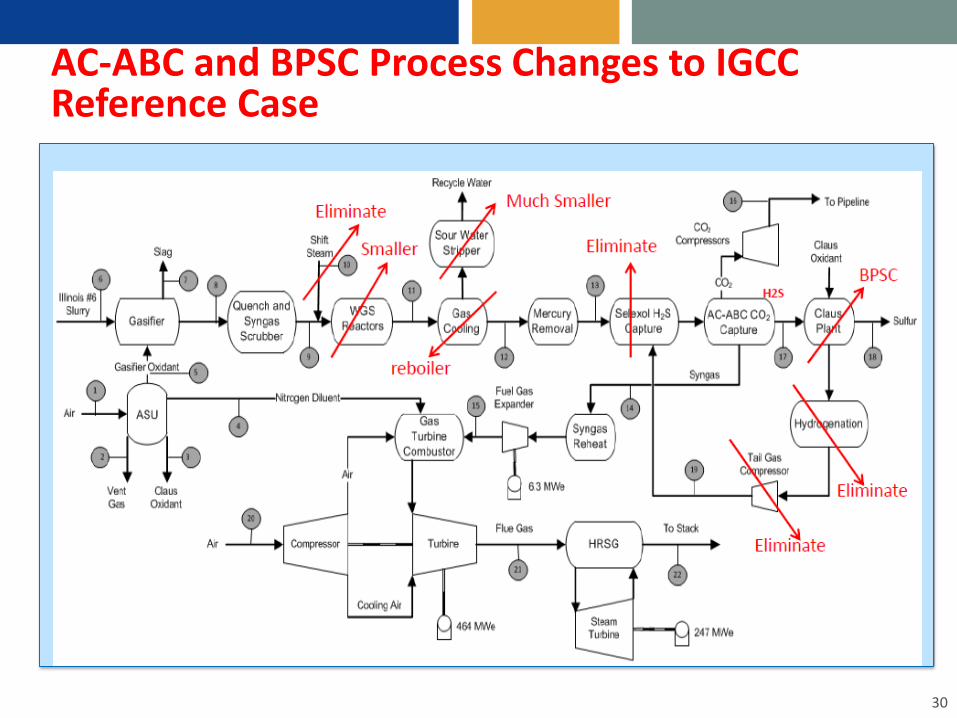
AC-ABC and BPSC Process Changes to IGCC Reference Case
30
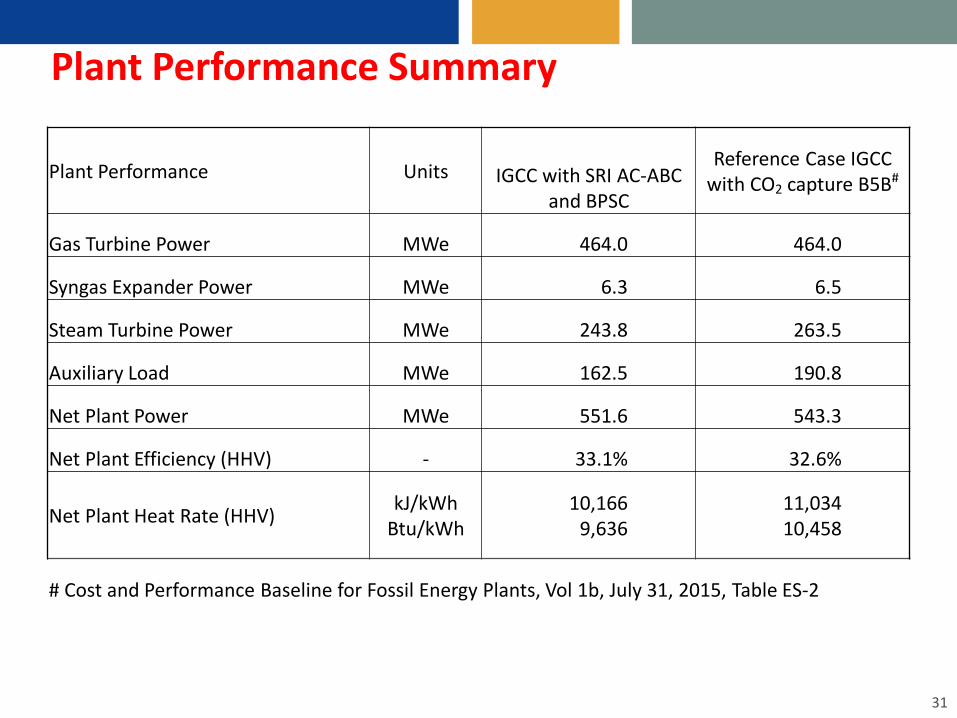
Plant Performance Summary
31
Plant Performance Units IGCC with SRI AC-ABC and BPSC
Reference Case IGCC with CO2 capture B5B#
Gas Turbine Power MWe 464.0 464.0
Syngas Expander Power MWe 6.3 6.5
Steam Turbine Power MWe 243.8 263.5
Auxiliary Load MWe 162.5 190.8
Net Plant Power MWe 551.6 543.3
Net Plant Efficiency (HHV) - 33.1% 32.6%
Net Plant Heat Rate (HHV) kJ/kWh Btu/kWh
10,1669,636
11,034 10,458
# Cost and Performance Baseline for Fossil Energy Plants, Vol 1b, July 31, 2015, Table ES-2

Economic Analysis
32
Economic Analysis (base 2011$) IGCC with SRI AC-ABC and BPSC
Reference Case IGCC with CO2 capture
B5B#
Total Plant Cost, before Owner's Costs, million $1,648 $1,840
Total Plant Cost, before Owner's Costs $2,988/kW $3,387/kW
Initial Chemical Fill Cost, million $4.90 $16.50
Annual Fixed O&M Cost, million $69.40 $69.40
Annual Variable O&M Cost, million $41.20 $46.60
Total Annual O&M Cost, million $110.60 $116.00
FY COE* without TS&M** $124.46 $135.56
FY COE with TS&M $133.66 $144.76
COE (% increase from base case IGCC, no CO2 capture) 30.3 % 41.2 %
*FY COE = First Year Cost of Electricity**TS&M = Transport, Storage, and Monitoring# Cost and Performance Baseline for Fossil Energy Plants, Vol 1b, July 31, 2015, Table ES-4
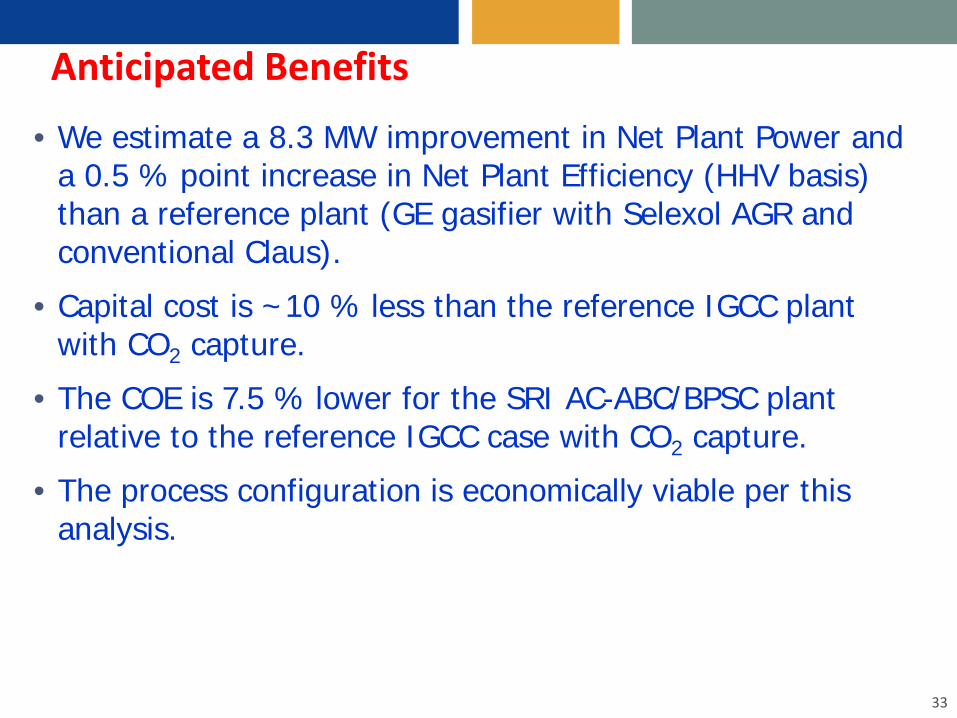
Anticipated Benefits
• We estimate a 8.3 MW improvement in Net Plant Power and a 0.5 % point increase in Net Plant Efficiency (HHV basis) than a reference plant (GE gasifier with Selexol AGR and conventional Claus).
• Capital cost is ~10 % less than the reference IGCC plant with CO2 capture.
• The COE is 7.5 % lower for the SRI AC-ABC/BPSC plant relative to the reference IGCC case with CO2 capture.
• The process configuration is economically viable per this analysis.
33
Acknowledgement• SRI International
– Anoop Nagar, Marc Hornbostel, Jin-Ping Lim, Elisabeth McLaughlin, Bill Olson
• EIG: – Eli Gal
• Bechtel Hydrocarbon Treatment Solutions: – Lee Schmoe, Martin Taylor
• National Carbon Capture Center: – Scott Machovec, Patrick Crossley
• DOE-NETL– Steve Mascaro
34

DISCLAIMERThis presentation was prepared as an account of work sponsored by an agency of the
United States Government. Neither the United States Government nor any agency
thereof, nor any of their employees, makes any warranty, express or implied, or assumes
any legal liability or responsibility for the accuracy, completeness, or usefulness of any
information, apparatus, product, or process disclosed, or represents that its use would
not infringe privately owned rights. Reference herein to any specific commercial product,
process, or service by trade name, trademark, manufacturer, or otherwise does not
necessarily constitute or imply endorsement, recommendation, or favoring by the United
States Government or any agency thereof. The views and opinions of authors expressed
herein do not necessarily state or reflect those of the United States Government or any
agency thereof.
35
Headquarters: Silicon ValleySRI International333 Ravenswood AvenueMenlo Park, CA 94025-3493650.859.2000
Washington, D.C. SRI International1100 Wilson Blvd., Suite 2800Arlington, VA 22209-3915703.524.2053
Princeton, New JerseySRI International Sarnoff201 Washington RoadPrinceton, NJ 08540609.734.2553
Additional U.S. and international locations
www.sri.com
Thank You
Contact:Anoop NagarSRI [email protected]