co2 capture and storage—a solution within - schlumberger
TRANSCRIPT
44 Oilfield Review
CO2 Capture and Storage—A Solution Within
Kamel BennaceurGatwick, England
Neeraj GuptaBattelle Memorial InstituteColumbus, Ohio, USA
Shinichi SakuraiBureau of Economic GeologyAustin, Texas
Steve WhittakerSaskatchewan Industry and ResourcesRegina, Saskatchewan
Mike MoneaPetroleum Technology Research CenterRegina, Saskatchewan, Canada
T.S. RamakrishnanRidgefield, Connecticut, USA
Trygve RandenStavanger, Norway
For help in preparation of this article, thanks to VéroniqueBarlet-Gouédart, Clamart, France; Austin Boyd, Ridgefield,Connecticut, USA; Pietro Di Zanno, Air Liquide, Paris, France;Martin Isaacs, Ali Mazen, Karen Sullivan Glaser, Erik Nelsonand Alexander Zazovsky, Sugar Land, Texas, USA; PhilippeLacour-Gayet, New York, New York, USA; Susan Hovorka,
MDT (Modular Formation Dynamics Tester), NGS (NaturalGamma Ray Spectrometry), Platform Express, RST (ReservoirSaturation Tool) and USI (UltraSonic Imager) are marks of Schlumberger.
Bureau of Economic Geology, Austin, Texas; Geoff Maitland,Cambridge, England; Lars Sonneland, Stavanger, Norway;and Tore Torp, Statoil, Trondheim, Norway.AIT (Array Induction Imager Tool), CMR (Combinable Magnetic Resonance), DSI (Dipole Shear Sonic Imager),ECLIPSE 300, FMI (Fullbore Formation MicroImager),
Burning fossil fuels releases carbon dioxide into the atmosphere. Many scientists believe this contributes, at least in part,
to the current upward trend in the Earth’s surface temperature. Capturing and storing carbon dioxide in the subsurface may
be one of the most promising of the likely short-term solutions to stabilize and reduce atmospheric carbon dioxide concentration.
The technology, although potentially costly, is available now and has been widely used in the oil and gas industry.
Autumn 2004 45
The people of Earth have a problem. Our planet’ssurface is warming at a rate that concerns manyscientists and climatologists. Various modelshave predicted outcomes that beg for action.While the data clearly show that the Earth’snorthern hemisphere is warming and there isstrong evidence that anthropogenic—humaninfluence on nature—effects exist, the pre-dicted consequences are poorly understood andcontested because the complexities and uncer-tainties in modeling are enormous. However,there is credible evidence that the currentwarming trend is partly due to the increasedcarbon dioxide [CO2] concentration in the atmo-sphere from burning fossil fuels and otherprocesses. With worldwide investment in, anddependence on, low-cost fossil fuels, it is uncer-tain whether we can extricate ourselves fromthis potentially dire situation, particularly when we consider the colossal financial burdenassociated with the restructuring necessary tosignificantly decrease fossil fuel use.
Global warming and its potential impacthave been widely discussed in government,academia and industry, and covered extensivelyin science and technical journals.1 Betweenthose who deny the problem exists and thosewho hyperbolize the global-warming conse-quences and required actions, there is a rationalapproach that relies on innovation and technol-ogy. A seed taking root in this valuable middleground is the process of capturing and securelystoring CO2—also called CO2 sequestration—that would otherwise be released into theatmosphere. This article discusses subsurfaceCO2 storage and its potential role in the reduc-tion of CO2 emissions. We present case studies ofCO2 projects that explore the application of current oilfield technologies, and we examinesome industry challenges that lie ahead.
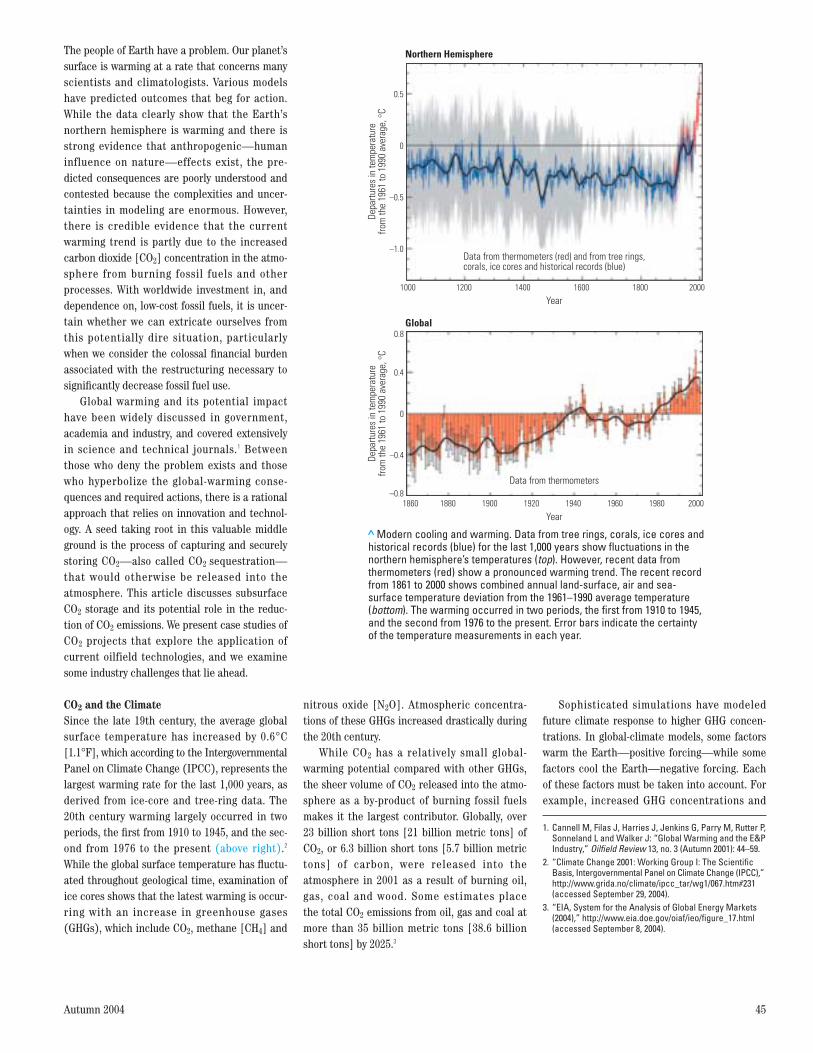
CO2 and the ClimateSince the late 19th century, the average globalsurface temperature has increased by 0.6°C[1.1°F], which according to the IntergovernmentalPanel on Climate Change (IPCC), represents thelargest warming rate for the last 1,000 years, asderived from ice-core and tree-ring data. The20th century warming largely occurred in twoperiods, the first from 1910 to 1945, and the sec-ond from 1976 to the present (above right).2
While the global surface temperature has fluctu-ated throughout geological time, examination ofice cores shows that the latest warming is occur-ring with an increase in greenhouse gases(GHGs), which include CO2, methane [CH4] and
nitrous oxide [N2O]. Atmospheric concentra-tions of these GHGs increased drastically duringthe 20th century.
While CO2 has a relatively small global-warming potential compared with other GHGs,the sheer volume of CO2 released into the atmo-sphere as a by-product of burning fossil fuelsmakes it the largest contributor. Globally, over23 billion short tons [21 billion metric tons] ofCO2, or 6.3 billion short tons [5.7 billion metrictons] of carbon, were released into the atmosphere in 2001 as a result of burning oil,gas, coal and wood. Some estimates place the total CO2 emissions from oil, gas and coal atmore than 35 billion metric tons [38.6 billionshort tons] by 2025.3
Sophisticated simulations have modeledfuture climate response to higher GHG concen-trations. In global-climate models, some factorswarm the Earth—positive forcing—while somefactors cool the Earth—negative forcing. Eachof these factors must be taken into account. Forexample, increased GHG concentrations and
1. Cannell M, Filas J, Harries J, Jenkins G, Parry M, Rutter P,Sonneland L and Walker J: “Global Warming and the E&PIndustry,” Oilfield Review 13, no. 3 (Autumn 2001): 44–59.
2. “Climate Change 2001: Working Group I: The ScientificBasis, Intergovernmental Panel on Climate Change (IPCC),”http://www.grida.no/climate/ipcc_tar/wg1/067.htm#231(accessed September 29, 2004).
3. “EIA, System for the Analysis of Global Energy Markets(2004),” http://www.eia.doe.gov/oiaf/ieo/figure_17.html(accessed September 8, 2004).
>Modern cooling and warming. Data from tree rings, corals, ice cores andhistorical records (blue) for the last 1,000 years show fluctuations in thenorthern hemisphere’s temperatures (top). However, recent data fromthermometers (red) show a pronounced warming trend. The recent recordfrom 1861 to 2000 shows combined annual land-surface, air and sea-surface temperature deviation from the 1961–1990 average temperature(bottom). The warming occurred in two periods, the first from 1910 to 1945,and the second from 1976 to the present. Error bars indicate the certaintyof the temperature measurements in each year.
1600
Depa
rture
s in
tem
pera
ture
from
the
1961
to 1
990
aver
age,
°C
–1.0
–0.5
0
0.5
1800 2000140012001000
Year
Northern Hemisphere
Data from thermometers (red) and from tree rings,corals, ice cores and historical records (blue)
1860
Year1880 1900 1920 1940 1960 1980 2000
–0.8
–0.4
0
0.4
0.8
Depa
rture
s in
tem
pera
ture
from
the
1961
to 1
990
aver
age,
°C
Data from thermometers
Global

tropospheric ozone levels are positive forcing,while increased tropospheric and stratosphericaerosols and cloud cover produce negative forc-ing. Some of these factors are well-understood,as for example, that of CO2 concentrations(above). However, other forcing mechanisms arenot understood. Cloud cover remains a majorsource of uncertainty in climate modeling becauseof the large variety of complex and interactive processes that contribute to cloud formation.4
During the last decade, climate modeling hasimproved immensely, aided by steadily improvingcomputing power and increased resourcesdevoted to the global-warming phenomenon.Improved modeling is extremely importantbecause it allows scientists to predict the scale,timing and consequences of global warming withgreater certainty. After all, the consequences,along with technology and economics, will ultimately drive government and business decisions about how best to address the problem.
Similar to reservoir forecasting, climate mod-eling relies on history-matching and models. Themodels include both natural and anthropogenic
effects to yield a reasonable match. Numerousscenarios based on future CO2 emissions andother factors produce a wide range of outcomes.CO2 concentration is predicted to increase fromtoday’s level of 374 parts per million (ppm) to550 to 1,000 ppm by 2100, resulting in a temper-ature increase of 2 to 4.5°C [3.6 to 8.1°F].5
However, the “business as usual” scenarioassumes that the world’s increased use of fossilfuels continues as in the past. Projecting thisscenario to 2100 may be unrealistic, given thesteady advance of technology, the decreasingsupply and increasing cost of oil, the growinguse of cleaner-burning natural gas, and renew-able energy sources—for example, solar andwind power.6 It is for this reason that IPCC pro-jections include a variety of scenarios.
Climate-change predictions for modelingmust be translated to actual climatic events onEarth and described in terms of human costs.Predictions based on conjecture include a rise insea level that would flood low-lying coastalareas, impacting densely populated areas andnatural habitats. Weather events, including
floods and droughts, are predicted to radicallychange the world’s vegetated zones. Glacier and arctic ice-melting rates are predicted to increase, threatening to change ocean circulation patterns and reduce the number of cold-water marine species, such as cod and haddock. Studies also foresee an increase inhuman and animal diseases as a result of alter-ing weather patterns.
There is some evidence that several of thesesymptoms of global warming are already occur-ring, making the estimation of both human andfinancial costs more urgent. However, many ofthese studies do not take into account man’s his-torical adaptive responses to climate changes,and some experts argue that the economic costof adapting would be significantly less than thecost of drastic actions to stabilize the climate.7
The debate on how likely and how severe theconsequences will be remains unresolved.
The Earth’s atmospheric CO2 contentincreases as a result of both natural and man-made emissions. This CO2 remains in theatmosphere for several decades, and is slowlyremoved by natural sinks that store CO2 forindefinite periods of time. Oceans store vastamounts of CO2, and vegetation and soils alsoproduce a common sink mechanism. Never-theless, it has become clear to many scientiststhat humans must work to diminish anthro-pogenic effects, primarily those derived fromburning fossil fuels.
Coal is the world’s most abundant fossil fuelenergy source. However, it also produces a largeamount—around 40%—of CO2 emissions fromfossil fuels. It remains a primary concern for climate and environmental scientists because, inmany regions, coal represents both a long-termand economical supply of energy, and is mainlyburned for electricity generation in power plants.Innovative ways to reduce CO2 emissions andtheir impact on the environment and climate arebeing developed to enable the continued burningof this important fuel (see “Produce CoalbedMethane, Hold the Carbon,” page 60).
Long-term remedies involve dramatic reduc-tion or elimination of man-made CO2 emissionsfrom the burning of fossil fuels (next page, top).In the short term, this is not a realistic solutionbecause the cost of switching to alternativesources of energy would be enormous and would,in itself, contribute to significant energy con-sumption. Moreover, there is no suitablereplacement for oil, gas and coal currently available to power the world’s economies. Short-term options may involve reducing CO2
emissions by using less energy through improved
46 Oilfield Review
> Forcing factors for global warming. The effect on global warming caused by changes in concentrationof some gas species, such as CO2, is well-understood, but the effects of solar activity and those of landuse, which affects reflectivity or albedo, are poorly known. The global, annual-mean radiative forcingdue to a number of agents is shown for the period from 1750 to the late 1990s. The height of therectangular bar denotes a central or best-estimate value. The vertical line about the rectangular barwith “x” delimiters indicates an estimate of the uncertainty range. A vertical line without a rectangularbar and with “o” delimiters denotes a forcing for which no central estimate can be given owing tolarge uncertainties. The uncertainty range specified here is a best-guess and is not based onstatistics. A “level of scientific understanding” index represents the subjective judgment about thereliability of the forcing estimate, involving factors such as the assumptions necessary to evaluate theforcing, the degree of knowledge of the physical and chemical mechanisms determining the forcing,and the uncertainties surrounding the quantitative estimate of the forcing.
Radi
ativ
e fo
rcin
g, W
/m2
War
min
gCo
olin
g
3
2
1
0
–1
–2
–3
Stratosphericozone
Sulfate
Fossilfuel
burning(organiccarbon)
Biomassburning
Mineraldust
HalocarbonsN2OCH4
CO2Tropospheric
ozone
Fossilfuel
burning(black
carbon)
Contrails Cirrus
Solar
Land use(albedo)
Troposphericaerosol direct
effect (1st type)
High Medium Medium Low Verylow
Verylow
Verylow
Verylow
Verylow
Verylow
Verylow
Verylow
Level of scientific understanding
Aviation-inducedclouds
Aerosols

Autumn 2004 47
efficiency while moving to low- or no-emissionenergy sources. Many scientists believe part ofthe short-term—within the next few decades—solution is to capture and store CO2 from theprocesses that create the largest or the mostconcentrated streams of CO2 gas. Developingthese man-made CO2 sinks would allow theworld to continue using its cheapest and mostabundant energy resources while significantlyreducing CO2 emissions.
Capturing and Storing CO2 EmissionsThe technology to separate and store CO2 isavailable now, but will require extensive invest-ment in infrastructure and considerablemeasures to reduce its cost. The separation andcompression of CO2 from emission streamsremain the most expensive part of the processand can occur before or after the combustionprocess. Currently, the most widely used pro-cess is based on chemical absorption to captureCO2 from flue gas using monoethanolamine(MEA) solvent. Flue gas is bubbled through thesolvent in a packed absorber column, where thesolvent preferentially absorbs the CO2. The sol-vent is heated as it passes through a distillationunit, stripping the CO2 from the solvent. A con-centrated gas that is 99% CO2 is produced.8 Thisis a high-cost process, so other methods arebeing investigated to separate CO2 from the sol-vent, including the use of microporousmembranes. The joint industry CO2 CaptureProject (CCP) is a collaboration of eight energyproducers, focusing on the development of tech-nologies that would reduce the cost of carbonseparation and capture.9
New membranes that contain hollow poly-meric fibers can be used in conjunction withamine systems. For instance, Air Liquide, a company specializing in the treatment and distribution of industrial gases, has developed amembrane technology that separates CO2 fromproduced gas streams (right). The feed gasenters from the outside shell at a higher pres-sure than that in the internal sections and,because of differential pressure and selectivepermeation across the polymeric fiber mem-brane, gases are separated.
4. “Climate Change 2001: Working Group I: The ScientificBasis, Intergovernmental Panel on Climate Change (IPCC),”http://www.grida.no/climate/ipcc_tar/wg1/271.htm(accessed September 29, 2004).
5. The concentration of CO2 is not uniform across the Earth.Higher concentrations are found in the northern hemisphere than in the southern hemisphere.
> Percentages of CO2 emissions produced by various economic sectors.
Other4%
Agriculture2%Residential
10%Transport
23%
Industry22%
Electricity generation39%
Global CO2 Emissions by Sector
> Advanced filters. Membrane technology separates CO2 fromproduced gas streams by keeping the feed gas on the outside shellat a higher pressure than that of the internal sections. Differentialpressure and selective permeation across the polymeric fibermembrane enable the separation of methane [CH4] and CO2. AirLiquide developed this technology as a compact, economical andenvironmentally friendly CO2 capture alternative to amine-treatmentprocesses.
Closed fibers
Open fibers
Residue gas
59.8 bar
CH4, C2H6, C3H8
Permeate gas
3 bar
CO2, H2S, H2O
Feed gas
60 bar
CH4, C2H6, C3H8,CO2’ H2S, H2O
6. Lomborg B: The Skeptical Environmentalist: Measuringthe Real State of the World. Cambridge, England: Cambridge University Press (2001): 258–324.
7. Lomborg, reference 6.De Vries B, Bollen J, Bouwman L, den Elzen M,Janssen M and Kreileman E: “Greenhouse Gas Emissionsin an Equity-, Environment and Service-Oriented World:An IMAGE-Based Scenario for the Next Century,” Technological Forecasting & Social Change 63, no. 2–3(February-March 2000): 137–174.
8. Herzog H and Golomb D: “Carbon Capture and Storage from Fossil Fuel Use,” http://sequestration.mit.edu/pdf/enclyclopedia_of_energy_article.pdf(accessed September 8, 2004).
9. For more on the CO2 Capture Project: http://www.co2captureproject.org/index.htm (accessed October 11, 2004).

There are also methods to remove the CO2
from fuels prior to combustion. In addition, sepa-ration of nitrogen from air using air-separationunits prior to combustion reduces the emission ofnitrogen oxides and sulfur oxides. Advanced fuel-conversion technologies produce hydrogen [H2]fuel from fossil fuels and capture CO2 to mitigateemissions. For example, coal gasification uses sol-vents to produce carbon monoxide [CO] and H2.Reacting CO with water produces CO2 and moreH2. The CO2 can be processed, transported andstored, while the H2 fuels gas turbines for elec-tricity generation and can be used in hydrogenfuel cells for transportation vehicles.
This technology is the core of projects likethe US FutureGen project, a US$1 billion pilotprogram, and the European HyPOGEN project,to create a zero-emission, coal-fired power plantthat sequesters CO2 and produces H2 for use infuel cells.10 Separation infrastructure requires alarge capital investment, and the technologiesused must be appropriate for both the sourceand volume being processed.
There are several ways of storing CO2 (aboveleft). Some involve enhancing natural sinks interrestrial ecosystems and oceans, such as refor-estation on land and iron fertilization of oceans.One proposed method dissolves CO2 into seawa-ter and then injects the mixture into the oceanat depths between 1,500 and 3,000 m [4,920 and9,840 ft]. Another method directly places CO2
liquid deep in the ocean, exploiting the densitycontrast between liquid CO2 and salt water.Despite the fact that the ocean represents thelargest total storage potential, likely around40,000 billion metric tons [44,000 billion shorttons] of carbon, the possible environmentalimpact on marine life near the injection point isa major drawback. Ocean storage is unlikely tobe the preferred mode, given that the environ-mental impact has not been adequatelyaddressed. While the storage of the world’santhropogenic CO2 emissions will likely requirethe combination of many different storageoptions, the oil and gas industry has had littleinvolvement in ocean-storage techniques. Manyscientists view geological storage as the alterna-tive that carries the lowest risk.
Given its vast experience in reservoir man-agement and its extensive range of technologies,the oil and gas industry is poised to take a leading role in the storage of CO2 in geologicalformations, such as depleted reservoirs, deepsaline aquifers and coalbeds. Moreover, manyjoint projects are under way to assess the potential of subsurface storage.
48 Oilfield Review
> CO2 storage options. Ocean storage represents the largest potential for carbon storage, but isthought to carry a higher level of environmental risk. The remaining four are geologic storage options,of which the largest capacity is estimated to be in saline reservoirs. The annual global carbonemissions in the year 2000 were 6.2 billion metric tons [6.8 billion short tons].
Capa
city
, bill
ion
met
ric to
ns c
arbo
n100,000
10,000
6,000
3,000
2,000
1,000
0
4,000
5,000
Deepocean
Salinereservoirs
Depletedoil
reservoirs
Depletedgas
reservoirs
Coalbedreservoirs
Storage options
Year 2000
Annual globalcarbon emissions
Maximum
Minimum
6.2 billionmetric tons
> CO2 phase diagram. The diagram describes the relationship betweentemperature and pressure on the resultant phase of CO2. Subsurface storageof CO2 is accomplished at supercritical conditions. To ensure this, both thephase behavior of CO2 and the reservoir conditions must be understood,since the reservoir temperature and pressure conditions are likely to changethroughout the life of a CO2 storage project.
Temperature, °F
Criticalpoint
Triple point
Liquid
SolidVapor
Normal boiling point
HydrateLiquid CO2Liquid H2O
Liquid H2OVapor CO2
Hydrate
Pres
sure
, MPa
0.07
0.007
7
0.7
Temperature, °C-100 -80 -60 -40 -20 0 20 40
–160 –120 –80 –40 0 40 80 120
Pres
sure
, psi
a
1,000
100
10
1
Pure CO2
CO2 hydrate conditionsWater freezing conditions
Autumn 2004 49
Geological storage of CO2 will be more effi-cient if it is in supercritical conditions. Carbondioxide has a low critical temperature of 31°C[88°F] and a moderate critical pressure of73.8 bar [1,070.4 psi] (previous page, bottom).Generally, this means that storage depths of600 m [1,970 ft] or deeper are required.
In 2002, more than 24 billion metric tons[26 billion short tons] of CO2 were released intothe atmosphere as a result of fuel combustion.11
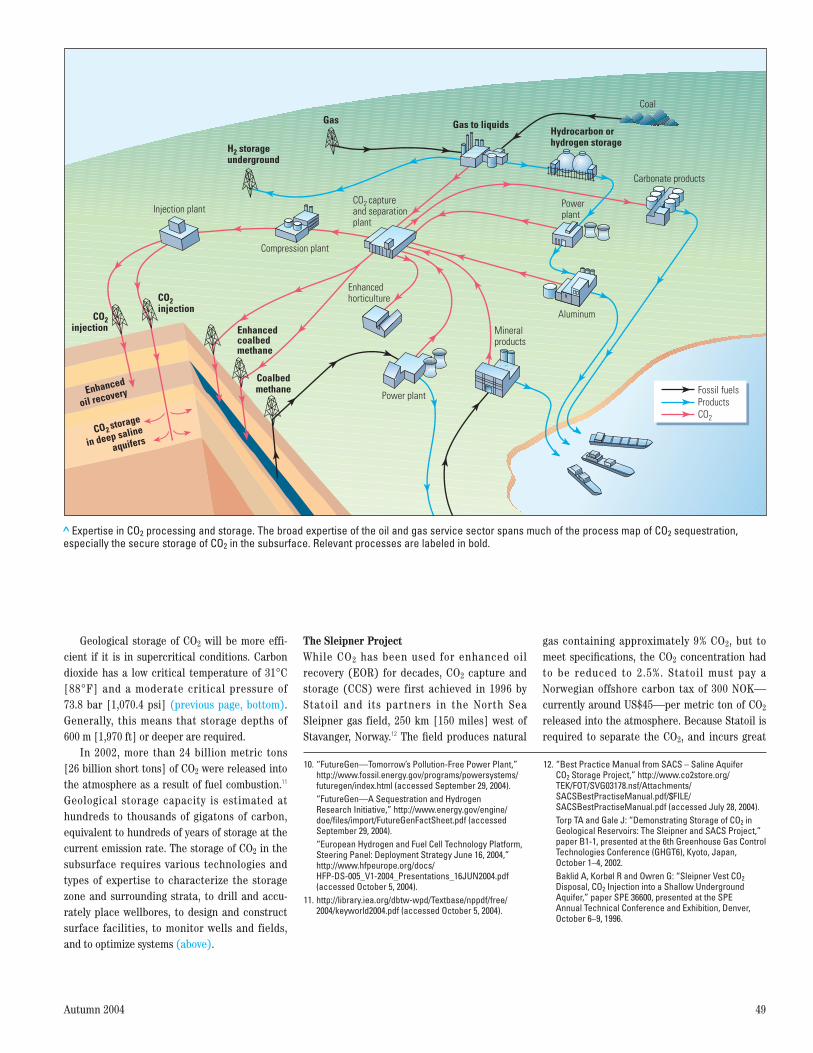
Geological storage capacity is estimated at hundreds to thousands of gigatons of carbon,equivalent to hundreds of years of storage at thecurrent emission rate. The storage of CO2 in thesubsurface requires various technologies andtypes of expertise to characterize the storagezone and surrounding strata, to drill and accu-rately place wellbores, to design and constructsurface facilities, to monitor wells and fields,and to optimize systems (above).
The Sleipner ProjectWhile CO2 has been used for enhanced oil recovery (EOR) for decades, CO2 capture andstorage (CCS) were first achieved in 1996 by Statoil and its partners in the North Sea Sleipner gas field, 250 km [150 miles] west ofStavanger, Norway.12 The field produces natural
gas containing approximately 9% CO2, but tomeet specifications, the CO2 concentration hadto be reduced to 2.5%. Statoil must pay a Norwegian offshore carbon tax of 300 NOK—currently around US$45—per metric ton of CO2
released into the atmosphere. Because Statoil isrequired to separate the CO2, and incurs great
> Expertise in CO2 processing and storage. The broad expertise of the oil and gas service sector spans much of the process map of CO2 sequestration,especially the secure storage of CO2 in the subsurface. Relevant processes are labeled in bold.
Injection plant
H2 storageunderground
Gas
Compression plant
CO2injection
Coalbedmethane
Enhancedcoalbedmethane
CO2 captureand separationplant
Enhancedhorticulture
Mineralproducts
Aluminum
Powerplant
Gas to liquids
Power plant
Carbonate products
CO2 storage
in deep saline
aquifers
Enhanced
oil recovery
CO2injection
Coal
Hydrocarbon orhydrogen storage
ProductsCO2
Fossil fuels
10. “FutureGen—Tomorrow’s Pollution-Free Power Plant,”http://www.fossil.energy.gov/programs/powersystems/futuregen/index.html (accessed September 29, 2004).“FutureGen—A Sequestration and Hydrogen Research Initiative,” http://www.energy.gov/engine/doe/files/import/FutureGenFactSheet.pdf (accessedSeptember 29, 2004).“European Hydrogen and Fuel Cell Technology Platform,Steering Panel: Deployment Strategy June 16, 2004,”http://www.hfpeurope.org/docs/HFP-DS-005_V1-2004_Presentations_16JUN2004.pdf(accessed October 5, 2004).
11. http://library.iea.org/dbtw-wpd/Textbase/nppdf/free/2004/keyworld2004.pdf (accessed October 5, 2004).
12. “Best Practice Manual from SACS – Saline Aquifer CO2 Storage Project,” http://www.co2store.org/TEK/FOT/SVG03178.nsf/Attachments/SACSBestPractiseManual.pdf/$FILE/SACSBestPractiseManual.pdf (accessed July 28, 2004).Torp TA and Gale J: “Demonstrating Storage of CO2 inGeological Reservoirs: The Sleipner and SACS Project,”paper B1-1, presented at the 6th Greenhouse Gas ControlTechnologies Conference (GHGT6), Kyoto, Japan, October 1–4, 2002.Baklid A, Korbøl R and Owren G: “Sleipner Vest CO2Disposal, CO2 Injection into a Shallow UndergroundAquifer,” paper SPE 36600, presented at the SPE Annual Technical Conference and Exhibition, Denver,October 6–9, 1996.

expense when CO2 is released, CCS became economically viable.13 To deal effectively withCO2, Statoil captures and separates it using MEA solvent and then injects CO2 into the Utsira formation using a single highly deviated injec-tion well (above). The Sleipner project has beeninjecting 1 million metric tons [1.1 million short
tons] of CO2 per year since September 1996 at asupercritical bottomhole flowing pressure ofapproximately 10.5 MPa [1,523 psi], which isbelow the Utsira fracture pressure.
Since 1996, the Sleipner operation hasinjected over 7 million metric tons [7.7 millionshort tons] of CO2 and the plan is to continue until
2020. Through the dedicated work of scientistsand the support of industry, Sleipner representsthe first industry-scale CCS project and thegroundwork for successful future projects.
The Utsira formation, a regional salineaquifer at a depth of 800 to 1,000 m [2,625 to3,280 ft] below the seabed at Sleipner field, is
50 Oilfield Review
> A milestone at the Sleipner field. Statoil separates CO2 from gas produced from the Heimdal formation and injects 1 million metrictons [1.1 million short tons] of CO2 per year into the overlying Utsira formation.
Ula
Ekofisk
Sleipner
Heimdal
Frigg
Gullfaks
Statfjord
Stavanger
NORWAY
GERMANY
DENMARK
SleipnerWest
SleipnerEast
m0 1,000
ft0 3,280
Sleipner T Sleipner A
CO2
Sleipner East productionand injection wells
CO2 injection well
Utsira formation
Heimdal formation
Dept
h, m
1,000
500
0
1,500
2,000
2,500
Seabed
N o r t h S e a

Autumn 2004 51
composed of uncemented quartz and feldsparsand with porosities from 27% to 40% and perme-abilities from 1 to 8 darcies. It contains thinlayers of shale that act as permeability baffles.14
Its thickness ranges from 200 to 300 m [656 to984 ft], and its total available storage volume,estimated at 660 million m3 [23.3 billion ft3],could store 600 billion metric tons [660 billionshort tons] of CO2.
Well logs indicate that the Utsira zone is well-defined, with sharp upper and basal con-tacts. An overlying caprock is several hundredmeters thick, beginning with a shale layer andoverlain by prograding sequences that gradefrom shales at the basin center to sandier faciestowards the basin margins. The top of thecaprock sequence consists mostly of glacio-marine clays and glacial tills. Close examinationof seismic, log and core data suggests that thiscaprock sequence forms an effective seal overthe Utsira formation.
Potential stratigraphic and structural barriers within the Utsira formation could affectCO2 migration dramatically. For this reason, an extensive characterization of the aquifer wasparamount. Established in 1998 and supportedunder the European Commission’s Thermie Program, the Saline Aquifer CO2 Storage (SACS)project and the subsequent SACS2 projectemployed a multidisciplinary approach todevelop “best practices” in the research, moni-toring and simulation of CO2 migration insubsurface storage aquifers. An important partof the project involves the time-lapse monitoringof the CO2 storage volume using three-dimensional (3D) seismic surveys.
Schlumberger has acquired four seismic surveys supporting this study: first in 1994before injection started in 1996, the second in1999, the third in 2001, and a fourth in 2002(above right).15 The location and migration ofsupercritical CO2 are visible, and geophysicistshave determined from modeling and time-lapse(4D) seismic data that high impedance contrastallows detection of CO2 accumulations as thin as1 m [3.3 ft]. The ability to observe such thinaccumulations gives scientists confidence thatno CO2 leakage is occurring beyond the overlyingcaprock. Schlumberger has been involved indata analysis and in the development of CO2
monitoring and simulation workflows.As the key monitoring technology, seismic
data have also shown the migration behavior ofCO2 in the aquifer. Thin shale layers within theUtsira storage interval dramatically affect theCO2 distribution. Because of its buoyancy, CO2 isforced to migrate laterally for several hundred
meters beneath the shale layers. Modelingshows that over long periods, as the brinebecomes more enriched with CO2, the mixturegrows denser than the water below, forming currents and enhancing dissolution.16 Thephysics of dissolution, segregation and mixingvaries depending on the characteristics of thereservoir, and specific simulations are necessary.
Storage mechanisms involving dissolution fromconvective mixing of supercritical CO2 arethought to take from centuries to millennia.
Exploiting the impedance contrasts betweenthe volume now containing CO2 and the volumepreviously containing only brine, scientists havebuilt elastic models to simulate various CO2
accumulation scenarios.17 Geophysicists have
13. Herzog HJ: “What Future for Carbon Capture andSequestration?” http://sequestration.mit.edu/pdf/EST_web_article.pdf (accessed July 28, 2004).
14. Chadwick RA, Zweigel P, Gregersen U, Kirby GA, Holloway S and Johannessen PN: “Geological Characterisation of CO2 Storage Sites: Lessons fromSleipner, Northern North Sea,” paper B1-3, presented at the 6th International Conference on Greenhouse Gas Control Technologies, Kyoto, Japan, October 1–4, 2002.
15. Experts from various institutions, companies and governments have collaborated to produce a series ofbest practices for future CO2 projects. This document isavailable to the public at http://www.co2store.org/TEK/FOT/SVG03178.nsf/Attachments/SACSBestPractiseManual.pdf/$FILE/SACSBestPractiseManual.pdf.
> The value of time-lapse seismic data. At Sleipner field, enhanced amplitude sections of time-lapseseismic surveys indicate the growing CO2 bubble (top). Maps of the integrated reflection amplitudesshow the areal growth of the storage volume (bottom). Four surveys that monitored the migration anddissolution behavior of injected CO2, verify the competence of the seal. Schlumberger and Statoilgained valuable experience in monitoring CO2 storage operations. The 2002 survey is not shownbecause it differs only slightly from the 2001 survey.
Enhanced Amplitude Sections
1999
Injection point
2001
PP tr
avel
time,
s
–0.8
–1.0
–1.2
1994Top Utsira sand
Base Utsira sand 500 m
1,640 ft
1999 2001
Integrated Reflection Amplitudes
1994
500 m
1,640 ft
16. Ennis-King J and Paterson L: “Role of Convective Mixingin the Long-Term Storage of Carbon Dioxide in DeepSaline Formations,” paper SPE 84344, presented at theSPE Annual Technical Conference and Exhibition, Denver, October 5–8, 2003.
17. Chadwick A, Noy D, Arts R and Eiken O: “4D GeophysicalMonitoring of the CO2 Plume at Sleipner, North Sea: Current Status and Aspects of Uncertainty,” prepared for presentation at the 7th SEGJ International Symposium on Imaging Technology, Sendai, Japan,November 24–26, 2004.Lygren M, Lindeberg E, Bergmo P, Dahl GV, Halvorsen KÅ,Randen T and Sonneland L: “History Matching of CO2Flow Models using Seismic Modeling and Time-LapseData,” presented at the SEG International Exposition and 72nd Annual Meeting, Salt Lake City, Utah, USA,October 6–11, 2002.

analyzed and modeled seismic pushdown effects,which result from a reduction in compressionalwave velocity through the CO2 storage intervaland which cause an increase in traveltime forreflections within and below the CO2 storageinterval (below right). Project scientists believethat the CO2 is distributed as a combination ofthin high-concentration layers and dispersedCO2. The modeled velocity pushdown due to thethin layers alone is lower than the observedpushdown. The difference, or residual push-down, is attributed to the presence of dispersed,lower saturation CO2 between the high-concen-tration layers.
The distribution of dispersed CO2 can be cal-culated by mapping saturations to the residualpushdown. In addition, modeling reveals howstorage temperature influences the estimationof total CO2 volume. Pushdown volumes fromtime-lapse seismic data have been history-matched with various flow models to help defineflow across the Utsira shale layers. This work hasbeen instrumental in understanding the size andextent of the CO2 bubble and the estimation ofCO2 volume.
The SACS project also investigated anotherlong-term CO2 storage mechanism associatedwith the subsurface called mineral trapping.Mineral trapping could occur when CO2 reactswith noncarbonate, calcium-rich, iron-rich andmagnesium-rich minerals to form carbonate precipitates. In the Sleipner case, drill-cuttingsstudies have shown that mineral trapping is nota major factor because of the limited reactivitybetween CO2 and the Utsira formation. In addi-tion, these studies have shown small porositydecreases observed at the base of the caprockcould further enhance sealing on a very longtime scale.18 Mineral trapping could be a signifi-cant geological storage mechanism in otherreservoirs and would likely impact the porosityand permeability within the reservoir.19
Before the SACS2 project completion in June 2002, the SACS and SACS2 projects had examined a full range of reservoir-characterization, monitoring and simulationproblems and published their findings and recommendations in a Best Practice Manual.However, the work continues in a EuropeanUnion-supported project called CO2STORE,which began in February 2003. The latest project
focuses on long-term storage aspects, other monitoring techniques and, with the knowledgegained from the Sleipner project, the develop-ment of site-specific plans for CO2 storageelsewhere in Europe. Partnering with power producers, new CO2STORE projects have beeninitiated in Denmark, Germany, Norway and theUnited Kingdom.
Win-Win at WeyburnEnhanced oil recovery (EOR) using CO2 hasoccurred since the 1970s, and has proved to beone of the most effective EOR methods in light-to medium-oil reservoirs. Supercritical CO2 has adensity similar to that of oil, but with a substan-tially lower viscosity. In miscible floods, CO2
mixes with the oil, causing the oil to swell and
become less viscous. Higher pressures at theinjector wells, coupled with the swelling oil,push the oil to producing wells, boosting oil production and recovery. In traditional EORoperations, concerns about the fate of the CO2
after injection were secondary to its impact onproduction. Consequently, most operators didnot attempt to determine the amount of CO2
that was being stored, or that could be stored,and did not tailor monitoring, modeling and simulation efforts to characterize the behaviorof CO2 in the swept reservoir, much less afterEOR was completed. Moreover, few EOR projectshave injected CO2 from anthropogenic sources tohelp reduce GHG emissions.
PanCanadian Resources, now EnCana Corporation, Saskatchewan Industry and
52 Oilfield Review
18. Gaus I, Azaroual M and Czernichowski-Lauriol I: “Reactive Transport Modeling of Dissolved CO2 in theCap Rock Base during CO2 Sequestration (Sleipner Site,North Sea),” presented at the 2nd Annual Conference onCarbon Sequestration, Alexandria, Virginia, USA,May 5–8, 2003.
19. Torp and Gale, reference 12.
> Pushdown of the base of the Utsira formation. Time-lapse surveys from 1994and 1999 reveal the pushdown effects (top). The CO2 volumes are estimatedquantitatively from modeling the pushdown effects over time. In the pushdown-volume maps, the black dot indicates the CO2 injection point (bottom).
0
10
20
30
40
50
60
Tim
e la
g, m
s
1999
500 m
1,640 ft
2001
Base Utsira sand
1994
500 m
1,640 ft
500
m
1,64
0 ft
Base Utsira sand
Injection point
1999

Autumn 2004 53
Resources, the Petroleum Technology ResearchCenter (PTRC) and the International EnergyAgency (IEA) began a unique CCS project in1999. It involved the transport of CO2 through a325-km [202-mile] pipeline from a coal gasifica-tion facility 12.1 km [7.5 miles] northwest ofBeulah, North Dakota, USA, to the Weyburn oilfield near Regina, Saskatchewan, Canada(right). The Great Plains Synfuels Plant, oper-ated by the Dakota Gasification Company,produces methane from the gasification of coaland the subsequent creation of methane fromthe purified product gases. Before the buildingof the pipeline, which is owned and operated bythe Dakota Gasification Company, the plantreleased most of the CO2 that it produced intothe atmosphere. Currently, this gas is com-pressed to a pressure of 15.2 MPa [2,200 psi] atthe plant, delivered by pipeline to the Weyburn field under supercritical conditions—14.9 MPa [2,175 psi]—and injected into the subsurface. The CO2 is 96% pure, containingtraces of hydrogen sulfide [H2S], nitrogen [N2]and hydrocarbons.
Discovered in 1954, the Weyburn field pro-duces oil from the Midale carbonate reservoir atan average depth of 1,419 m [4,655 ft] within theMississippian-age Charles formation (below).
> The first transnational EOR project involving CO2 capture, transport andstorage. The transport of CO2 is accomplished through a pipeline from a coalgasification facility in North Dakota, USA, to EnCana’s Weyburn oil field inSaskatchewan, Canada.
100
km0 100
miles0
Regina
Weyburn
Bismark
BeulahPipeline
Manitoba
North DakotaMontana
CANADAUSA
Saskatchewan
> Characterizing and modeling the geology of the Weyburn field. Many geologic factors have been incorporated into a risk-assessment model, including theMidale reservoir and Watrous seal characteristics, regional tectonics, surface lineaments, river systems and hydrogeological flow directions, all of whichcould influence CO2 migration behavior.
Bearpaw aquitard
Colorado aquitard
Potable aquifers
Belly River
Joli Fou aquitardNewcastle
Mannville
Vanguard aquitard
CO2 injection well
Jurassic
Watrous aquitard
Mississippian Midale beds
Level of CO2 injection
Surface lineaments
Area of detail
10 km6.2 miles
N
1.5
km
0.98
mile
s

The Midale reservoir is 30 m [98 ft] thick andincludes, from deepest to shallowest, the MidaleVuggy zone, the Midale Marly zone, and theMidale Evaporite. The most extensive seal abovethe injection interval is the low-permeabilityLower Watrous formation. The Midale Vuggyzone has been largely swept by waterflood opera-tions, which began in 1964. However, the MidaleMarly zone has lower permeability, lower sweepefficiency and still contains significant volumesof recoverable oil. Horizontal wells have tar-geted the bypassed pay within the Midale Marlyzone since 1991, and this zone remains the focusof current CO2 EOR operations. The field’s origi-nal oil in place has been estimated atapproximately 223 million m3 [1.4 billion bbl]and, prior to the start of CO2 injection inSeptember 2000, it had produced 55 million m3
[346 million bbl] of oil from primary and water-flood production.
The Weyburn field covers 180 km2 [70 sq miles].With more than 1,000 wells, including verticalproducer wells, vertical water-injection wells,horizontal producer wells, horizontal CO2-injec-tion wells and abandoned wells, reservoircontrol from well logs is extensive. Additionally,more than 600 wells have been cored, and pro-duction and injection data provide a completehistorical record of the field.
In July 2000, IEA launched a comprehensivegeological study of the Weyburn CO2 storagesite.20 The IEA concluded that the geology ofWeyburn field is suitable for long-term CCS, thatthe primary reservoir seals are competent, forming thick and extensive barriers to upwardfluid migration, and that faults and fractures inthe region show no fluid conductance. Risk-assessment modeling suggests that only approxi-mately 0.02% of the initial CO2 in place afterEOR operations are complete will migrate abovethe reservoir in 5,000 years. Of this CO2, mostwill diffuse into the overlying caprock, and nonewill reach near-surface strata containing potableaquifers. Moreover, the cumulative leakagethrough existing wells in the field is expected tobe less than 0.001% of the initial CO2 in place.21
ECLIPSE 300 reservoir simulation softwarewas used to investigate the long-term migrationbehavior of CO2 in the Weyburn reservoir. Adetailed reservoir model incorporating 75 injec-tion patterns was inserted into a much largergeological model, extending several hundredmeters below the reservoir to the ground surfaceabout 1,500 m [4,920 ft] above the reservoir.ECPLISE 300 software was used to simulate dispersion, diffusion and advection of water,
hydrocarbons and CO2 within this region for5,000 years beyond EOR.
A time-lapse seismic monitoring program isimproving understanding of CO2 flow behavior inthe reservoir. EnCana ran a baseline 3D seismicsurvey in August 2000, prior to the start of CO2
injection. Two multicomponent time-lapse sur-veys have been integrated with crosswell seismicdata, acquired by the Lawrence BerkeleyNational Laboratory, and vertical seismic pro-files (VSPs), acquired by Schlumberger, todefine the fluid-migration dynamics at a muchhigher resolution than standard seismic tech-niques. The time-lapse seismic results havecorrelated with the CO2 flood-front movements,supported by production and tracer data.
Scientists tested new passive seismic monitoring technology in the Weyburn field. In2003, an array of eight triaxial geophones wasinstalled in a vertical well planned for abandon-ment. Data acquisition, which began in August 2003, has detected discrete microseismicevents associated with the injection of CO2 anddemonstrates yet another possible monitoringtechnology for CO2 storage operations.22
On a daily basis, 3 million m3 [106 MMcf], or5,000 metric tons, of CO2 are transported andinjected into the Weyburn oil field to providesecure CO2 storage and to improve oil recovery.23
As of March 2004, about 3 billion m3 [106 Bcf] ofanthropogenic CO2 has been injected, and over
the project’s lifetime an estimated 22 millionmetric tons [24 million short tons] of anthro-pogenic CO2 will ultimately be stored in Weyburnfield. On the production side, EnCana estimatesan additional 20.7 million m3 [130 million bbl] ofproduced oil will be recovered over the next30 years as a result of the CO2 storage project.Daily production is anticipated to reach4,770 m3/d [30,000 B/D] by 2008, compared with1,590 m3/d [10,000 B/D] had the CO2 flood notbeen initiated (above).
Sitting on Top of a SolutionAn important field experiment entered its CO2-injection stage in September 2004. Designedto test storage modeling, monitoring and verification techniques, the project is intended tolower the cost, risk and time to implement a geo-logic CO2 storage project. More specifically, theproject has several specific aims: to demonstratethat CO2 can be injected safely and storedsecurely, to determine the subsurface distributionof CO2 using various monitoring techniques, andto validate models and gain the appropriate levelof experience to advance to large-scale injection.
The project is funded by the US Departmentof Energy (DOE) National Energy Technology Laboratory. The Bureau of Economic Geology(BEG) at the University of Texas at Austin is thelead institution; it is supported by GEO-SEQ, aresearch consortium that includes Lawrence
54 Oilfield Review
>Weyburn field production. The CO2 EOR storage project has clearly increased daily production ratesand is predicted to significantly extend the production plateau of the Weyburn field.
Jan
55
Jan
58
Jan
61
Jan
64
Jan
67
Jan
70
Jan
73
Jan
76
Jan
79
Jan
82
Jan
85
Jan
88
Jan
91
Jan
94
Jan
97
Jan
00
Jan
03
Jan
06
Jan
09
Jan
12
Jan
15
Jan
18
Jan
21
Jan
24
Jan
27
30,000
Prod
uctio
n, g
ross
BOP
D
35,000
40,000
45,000
50,000
25,000
20,000
15,000
10,000
5,000
0
Date
Actual Forecast
Original vertical wellsInfill vertical wells
Horizontal infill wellsCO2 EOR
Autumn 2004 55
Berkeley National Laboratory, Oak RidgeNational Laboratory, Lawrence LivermoreNational Laboratory, United States GeologicalSurvey (USGS) and the Alberta Research Council. The consortium selected Schlumbergerto provide formation evaluation, monitoring and sampling expertise. BP provides projectreview and assumes an advisory role during the experiment.
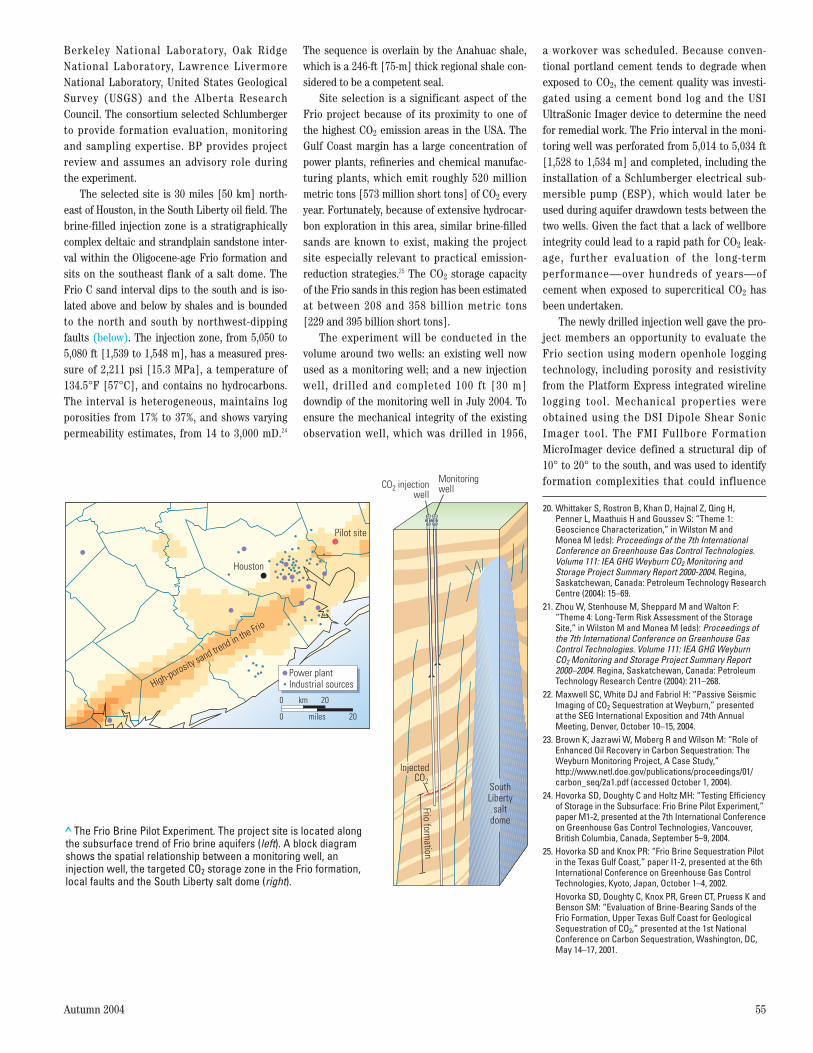
The selected site is 30 miles [50 km] north-east of Houston, in the South Liberty oil field. Thebrine-filled injection zone is a stratigraphicallycomplex deltaic and strandplain sandstone inter-val within the Oligocene-age Frio formation andsits on the southeast flank of a salt dome. TheFrio C sand interval dips to the south and is iso-lated above and below by shales and is boundedto the north and south by northwest-dippingfaults (below). The injection zone, from 5,050 to5,080 ft [1,539 to 1,548 m], has a measured pres-sure of 2,211 psi [15.3 MPa], a temperature of134.5°F [57°C], and contains no hydrocarbons.The interval is heterogeneous, maintains logporosities from 17% to 37%, and shows varyingpermeability estimates, from 14 to 3,000 mD.24
The sequence is overlain by the Anahuac shale,which is a 246-ft [75-m] thick regional shale con-sidered to be a competent seal.
Site selection is a significant aspect of theFrio project because of its proximity to one ofthe highest CO2 emission areas in the USA. TheGulf Coast margin has a large concentration ofpower plants, refineries and chemical manufac-turing plants, which emit roughly 520 millionmetric tons [573 million short tons] of CO2 everyyear. Fortunately, because of extensive hydrocar-bon exploration in this area, similar brine-filledsands are known to exist, making the project site especially relevant to practical emission-reduction strategies.25 The CO2 storage capacityof the Frio sands in this region has been estimatedat between 208 and 358 billion metric tons [229 and 395 billion short tons].
The experiment will be conducted in the volume around two wells: an existing well nowused as a monitoring well; and a new injectionwell, drilled and completed 100 ft [30 m]downdip of the monitoring well in July 2004. Toensure the mechanical integrity of the existingobservation well, which was drilled in 1956,
a workover was scheduled. Because conven-tional portland cement tends to degrade whenexposed to CO2, the cement quality was investi-gated using a cement bond log and the USIUltraSonic Imager device to determine the needfor remedial work. The Frio interval in the moni-toring well was perforated from 5,014 to 5,034 ft[1,528 to 1,534 m] and completed, including theinstallation of a Schlumberger electrical sub-mersible pump (ESP), which would later beused during aquifer drawdown tests between thetwo wells. Given the fact that a lack of wellboreintegrity could lead to a rapid path for CO2 leak-age, further evaluation of the long-termperformance—over hundreds of years—ofcement when exposed to supercritical CO2 hasbeen undertaken.
The newly drilled injection well gave the pro-ject members an opportunity to evaluate theFrio section using modern openhole loggingtechnology, including porosity and resistivityfrom the Platform Express integrated wirelinelogging tool. Mechanical properties wereobtained using the DSI Dipole Shear SonicImager tool. The FMI Fullbore FormationMicroImager device defined a structural dip of10° to 20° to the south, and was used to identifyformation complexities that could influence
20. Whittaker S, Rostron B, Khan D, Hajnal Z, Qing H,Penner L, Maathuis H and Goussev S: “Theme 1: Geoscience Characterization,” in Wilston M andMonea M (eds): Proceedings of the 7th InternationalConference on Greenhouse Gas Control Technologies.Volume 111: IEA GHG Weyburn CO2 Monitoring and Storage Project Summary Report 2000-2004. Regina,Saskatchewan, Canada: Petroleum Technology ResearchCentre (2004): 15–69.
21. Zhou W, Stenhouse M, Sheppard M and Walton F:“Theme 4: Long-Term Risk Assessment of the StorageSite,” in Wilston M and Monea M (eds): Proceedings ofthe 7th International Conference on Greenhouse GasControl Technologies. Volume 111: IEA GHG Weyburn CO2 Monitoring and Storage Project Summary Report2000–2004. Regina, Saskatchewan, Canada: PetroleumTechnology Research Centre (2004): 211–268.
22. Maxwell SC, White DJ and Fabriol H: “Passive SeismicImaging of CO2 Sequestration at Weyburn,” presented at the SEG International Exposition and 74th AnnualMeeting, Denver, October 10–15, 2004.
23. Brown K, Jazrawi W, Moberg R and Wilson M: “Role ofEnhanced Oil Recovery in Carbon Sequestration: TheWeyburn Monitoring Project, A Case Study,”http://www.netl.doe.gov/publications/proceedings/01/carbon_seq/2a1.pdf (accessed October 1, 2004).
24. Hovorka SD, Doughty C and Holtz MH: “Testing Efficiencyof Storage in the Subsurface: Frio Brine Pilot Experiment,”paper M1-2, presented at the 7th International Conferenceon Greenhouse Gas Control Technologies, Vancouver,British Columbia, Canada, September 5–9, 2004.
25. Hovorka SD and Knox PR: “Frio Brine Sequestration Pilotin the Texas Gulf Coast,” paper I1-2, presented at the 6thInternational Conference on Greenhouse Gas ControlTechnologies, Kyoto, Japan, October 1–4, 2002.Hovorka SD, Doughty C, Knox PR, Green CT, Pruess K andBenson SM: “Evaluation of Brine-Bearing Sands of theFrio Formation, Upper Texas Gulf Coast for GeologicalSequestration of CO2,” presented at the 1st National Conference on Carbon Sequestration, Washington, DC,May 14–17, 2001.
> The Frio Brine Pilot Experiment. The project site is located alongthe subsurface trend of Frio brine aquifers (left). A block diagramshows the spatial relationship between a monitoring well, aninjection well, the targeted CO2 storage zone in the Frio formation,local faults and the South Liberty salt dome (right).
Frio formation
CO2 injectionwell
Monitoringwell
SouthLiberty
saltdome
Injected CO2
Pilot site
Houston
High-porosity sand trend in the Frio
Power plantIndustrial sources
km0 20
miles0 20
fluid flow. The FMI log showed no evidence ofnatural fractures within the interval betweenthe faults.
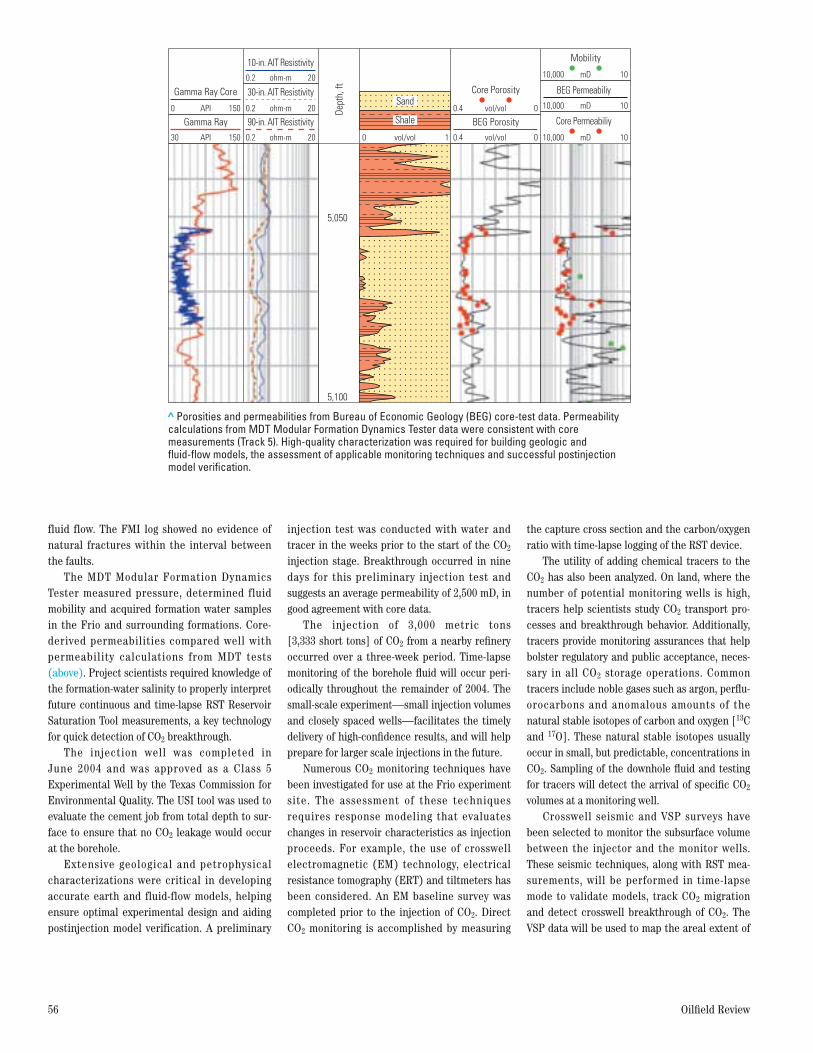
The MDT Modular Formation DynamicsTester measured pressure, determined fluidmobility and acquired formation water samplesin the Frio and surrounding formations. Core-derived permeabilities compared well withpermeability calculations from MDT tests(above). Project scientists required knowledge ofthe formation-water salinity to properly interpretfuture continuous and time-lapse RST ReservoirSaturation Tool measurements, a key technologyfor quick detection of CO2 breakthrough.
The injection well was completed in June 2004 and was approved as a Class 5 Experimental Well by the Texas Commission forEnvironmental Quality. The USI tool was used toevaluate the cement job from total depth to sur-face to ensure that no CO2 leakage would occurat the borehole.
Extensive geological and petrophysical characterizations were critical in developingaccurate earth and fluid-flow models, helpingensure optimal experimental design and aidingpostinjection model verification. A preliminary
injection test was conducted with water andtracer in the weeks prior to the start of the CO2
injection stage. Breakthrough occurred in ninedays for this preliminary injection test and suggests an average permeability of 2,500 mD, ingood agreement with core data.
The injection of 3,000 metric tons [3,333 short tons] of CO2 from a nearby refineryoccurred over a three-week period. Time-lapsemonitoring of the borehole fluid will occur peri-odically throughout the remainder of 2004. Thesmall-scale experiment—small injection volumesand closely spaced wells—facilitates the timelydelivery of high-confidence results, and will helpprepare for larger scale injections in the future.
Numerous CO2 monitoring techniques havebeen investigated for use at the Frio experimentsite. The assessment of these techniquesrequires response modeling that evaluateschanges in reservoir characteristics as injectionproceeds. For example, the use of crosswell electromagnetic (EM) technology, electricalresistance tomography (ERT) and tiltmeters hasbeen considered. An EM baseline survey wascompleted prior to the injection of CO2. DirectCO2 monitoring is accomplished by measuring
the capture cross section and the carbon/oxygenratio with time-lapse logging of the RST device.
The utility of adding chemical tracers to theCO2 has also been analyzed. On land, where thenumber of potential monitoring wells is high,tracers help scientists study CO2 transport pro-cesses and breakthrough behavior. Additionally,tracers provide monitoring assurances that helpbolster regulatory and public acceptance, neces-sary in all CO2 storage operations. Commontracers include noble gases such as argon, perflu-orocarbons and anomalous amounts of thenatural stable isotopes of carbon and oxygen [13Cand 17O]. These natural stable isotopes usuallyoccur in small, but predictable, concentrations inCO2. Sampling of the downhole fluid and testingfor tracers will detect the arrival of specific CO2
volumes at a monitoring well.Crosswell seismic and VSP surveys have
been selected to monitor the subsurface volumebetween the injector and the monitor wells.These seismic techniques, along with RST mea-surements, will be performed in time-lapsemode to validate models, track CO2 migrationand detect crosswell breakthrough of CO2. TheVSP data will be used to map the areal extent of
56 Oilfield Review
> Porosities and permeabilities from Bureau of Economic Geology (BEG) core-test data. Permeabilitycalculations from MDT Modular Formation Dynamics Tester data were consistent with coremeasurements (Track 5). High-quality characterization was required for building geologic and fluid-flow models, the assessment of applicable monitoring techniques and successful postinjectionmodel verification.
5,050
5,100
Gamma Ray Core
Gamma Ray
Dept
h, ft
API30 150
API0 150
0.2 20
0.2 20
ohm-m
ohm-m
0.2 20ohm-m
10-in. AIT Resistivity
0 1vol/vol vol/vol mD0.4 0
BEG Porosityvol/vol0.4 0
Core Porosity
10,000 10
mD10,000 10
BEG Permeabiliy
mD10,000 10
Mobility
30-in. AIT Resistivity
90-in. AIT Resistivity Core Permeabiliy
Sand
Shale

Autumn 2004 57
the CO2 plume and to validate the interpretationof a 3D seismic survey.
The Frio project is a major collaborativeeffort between government, business and insti-tutions to test current monitoring technologiesand validate the models used to simulate bothCO2 storage capacity and migration behavior. Inaddition, this project lays the groundwork forfuture CCS projects beneath this high-emissionsregion of the Gulf Coast.
Power Plant EmissionsThe Ohio Valley CO2 Storage Project is a collabo-rative endeavor to examine the potential for CO2
storage beneath another high-emissions regionof the USA. Initiated in November 2002, the pro-ject is supported by the US Department ofEnergy’s National Energy Technology Laboratory(NETL), Battelle Laboratories, American Elec-tric Power (AEP), BP, the Ohio CoalDevelopment Office of the Ohio Air QualityDevelopment Authority, Pacific NorthwestNational Laboratory and Schlumberger. Technical
support also comes from West Virginia University,the Ohio Geological Survey and Stanford Univer-sity.26 The Ohio Valley area relies heavily on large hydrocarbon-base power plants for elec-tricity generation.
The goal of this project is to identify and char-acterize reservoirs near major CO2 emissionsources and to assess the potential for subsurfaceCO2 storage in the region. Mountaineer PowerPlant in New Haven, West Virginia, USA, was chosen as a project site because it sits abovepotential geologic storage targets deep in theCambrian and Ordovician strata. The plant, whichis operated by AEP, produces 1,300 MW of powerfrom pulverized coal, and emits over 7 millionshort tons [6.4 million metric tons] of CO2 annu-ally.27 This project represents the first effort toassess subsurface CO2 storage targets from a sur-face site located within the power plant facility.As a result, the project has encountered manytechnical, regulatory and stakeholder issues thatwere not seen during previous CCS projects.
A complete geologic characterization wasrequired to establish whether the target inter-vals possessed the properties necessary forsuccessful and secure storage of injected CO2.Project partners acquired a two-dimensional(2D) seismic survey to define the geologicalstructure and confirm the continuity of the mainseismic horizons away from the site. The surveyquality was considered good. Special processingsteps minimized background noise from thepower plant and coal conveyor belt.
The next step in the site-characterization pro-cess involved acquiring downhole measurementsacross potential injection intervals. In 2003, a9,190-ft [2,800-m] exploratory well was drilled onthe Mountaineer plant site to evaluate deep CO2
storage potential (left). The main targetsincluded the basal sandstone overlying the Pre-cambrian igneous rocks, high-porosity zoneswithin the otherwise low-permeability carbonatessuch as the Copper Ridge dolomite, and the RoseRun sandstone and the Beekmantown dolomite.
Prior to this, few wells had been drilled totest these deep intervals in this area of theAppalachian basin. Formation-depth predictionsbased on seismic data and regional geology
26. Gupta N, Jagucki P, Sminchak J, Meggyesy D, Spane F,Ramakrishnan TS and Boyd A: “Determining CarbonSequestration Injection Potential at a Site-Specific Location Within the Ohio River Valley Region,” paper 302,presented at the 7th International Conference on Greenhouse Gas Control Technologies, Vancouver,British Columbia, September 5–9, 2004.
27. “West Virginia State Profile of Exposure to Coal-FiredPower Plants,” http://www.catf.us/publications/fact_sheets/children_at_risk/West_Virginia_Kids_Facts.pdf (accessed September 10, 2004).
> The Mountaineer Power Plant near New Haven, West Virginia, USA. Theexploratory well is located within the coal-fired Mountaineer Plant facilityand is indicated by the red dot.
Plant, WestVirginia, USA
Mountaineer

provided a reasonable match to drilling results,despite the scarcity of data. Extensive openholelogging and coring programs determined forma-tion properties, such as mineralogy, porosity,permeability, water saturation and salinity,mechanical properties and the presence of natural fractures. In conjunction with porosityand resistivity measurements, formation miner-alogy was defined by the NGS Natural GammaRay Spectrometry tool. Permeability and grain-size data, and a lithology-independent porositywere acquired by the CMR Combinable Magnetic
Resonance sonde. Also, the FMI tool was used toidentify natural fracturing and structural complexities that might affect injectivity. Inaddition, engineers used the MDT device toacquire formation-pressure and permeabilitydata, and to take fluid samples. While one MDTtest was successful, a packer failure compro-mised the data quality during the other tests.
Fullbore core testing and analysis also playeda crucial role in the complete characterization ofthe target intervals. A total of 293 ft [90 m] ofcore was taken across the Beekmantown
dolomite, Rose Run and basal sandstones. Full-bore coring was not practical in zones with slowcoring rates, so the Mechanical Sidewall CoringTool (MSCT) was used later to take sidewallcores in those intervals. Detailed core analysisand petrography examined important small-scalecharacteristics, such as sedimentary structures,porosity types, grain sizes and mineralogy. Coreporosity and permeability were also measured.The fullbore cores provided material for CO2-flood and relative-permeability experiments,and geomechanical tests.
58 Oilfield Review
>Wireline logs across the Rose Run sandstone. Log analysis shows the Rose Run sandstone interval consists of sand withinterbedded dolomite layers (Track 1). Porosity streaks in the Rose Run sandstone exceed 12% (Track 3), and permeabilitiescalculated from the CMR Combinable Magnetic Resonance data reach 10 mD (Track 2). The FMI Fullbore Formation MicroImagerdata show the interbedded nature and vertical complexity of the Rose Run interval (right).
Gamma Ray
API0 200
vol/vol1 0
Volumetric Analysis
0.02 200
CMR Permeabilityohm-m0.2 2,000
Array Resistivity Mode 2ohm-m0.2 2,000
Array Resistivity Mode 3ohm-m0.2 2,000
Array Resistivity Mode 4ohm-m0.2 2,000
Array Resistivity Mode 5ohm-m0.2 2,000
Flushed Zone Resistivity
Photoelectric Effect
Density
Delta T
Neutron Porosity
CMR Porosity
0 10
1.95 2.95
1.40 40
g/cm3
ms/ft
vol/vol0.45 -0.15
vol/vol0.45 -0.15
vol/vol0.45 -0.15
Low High
Amplitude Distribution
ms
T2 Distribution
0.3 3,000
T2 Cutoff
7,750
7,800
7,850
Siderite
Quartz
Bound Water
Illite
4 in. 14
Caliper
Dolomite
Dept
h, ft
Density Porosity
FMI ImageRes. Cond.
7,820
7,810
7,800
7,790
7,780
7,770
mD
0 120 240 360Orientation North

Autumn 2004 59
Using seismic measurements, openhole log-ging technology and core testing, this reservoircharacterization program identified the mostpromising zones for testing at a larger reservoirscale. Straddle packers isolated selected zonesfor testing and retrieving water samples. Injectivity, or minifracture, tests helped engineers determine hydraulic fracture-pressurethresholds in potential injection zones and alsohelped them calculate the maximum sustainablepressure in the caprock.
The wide range of measurements at differentvolume scales revealed that the investigated formations were continuous but fairly hetero-geneous. The basal sandstone was the mosthomogeneous zone, but had low porosity andpermeability values and was not a suitable injec-tion target at this site. However, several otherzones showed injection potential that could beused for future tests of CO2 injection and monitoring, and potentially even for long-termCO2 storage. For example, the Copper Ridgedolomite section contains thin intervals withgood porosity and high permeability, and
warrants further investigation to determine itsareal extent. The Rose Run sandstone showedsufficient permeability, but the porosity was vari-able, limiting its potential CO2-storage volume(previous page). While the Beekmantowndolomite exhibited thin layers with good poros-ity and permeability, the gross CO2 storagevolume in this formation was low at this location(above). In addition, formation-water analysisindicated high salinities—300,000 mg/L[2.50 lbm/gal]—indicating that, at these depthsand pressures, CO2 solubility in brine watercould be severely reduced.
>Wireline logs across the Beekmantown dolomite interval. The Beekmantown interval was dominantly dolomite with interbeddedsand and shale layers (Track 1). While the interval shows thin porous and permeable streaks, the overall storage quality of theBeekmantown is poor (Tracks 2 and 3). The FMI image identified vugular porosity at 7,418 ft [2,261 m] and drilling-inducedfractures striking NE-SW at a depth of 7,430 ft [2,265 m] (right).
Acoustic Impedance
80,000 30,000
vol/vol1 0
Volumetric Analysis
mD0.02 200
CMR Permeability
ohm-m0.2 2,000
Array Resistivity Mode 2ohm-m0.2 2,000
Array Resistivity Mode 3ohm-m0.2 2,000
Array Resistivity Mode 4ohm-m0.2 2,000
Array Resistivity Mode 5ohm-m0.2 2,000
Flushed Zone Resistivity CMR Porosity
1 11
1.95 2.95
90
0.15 -0.05
0.15 -0.05
vol/vol0.15 -0.05
Amplitude distribution
ms
T2 Distribution
0.3 3,000
T2 Cutoff
4 14in.
Caliper
40
7,400
7,410
7,420
7,430
Dolomite
Siderite
Quartz
Bound Water
Illite
Gamma Ray
API0 200De
pth,
ft
Photoelectric Effect
g/cm3
vol/vol
Neutron Porosityvol/vol
Density Porosity
Delta Tms/ft
Density
Low High
0 120 240 360Orientation North
FMI ImageRes. Cond.
(ft/s) (g/cm3)
7,400
7,450

The Ohio Valley CO2 Storage Project demon-strates the importance of thoroughly evaluatingpotential CO2 storage zones on a site-specificbasis. While the injectivity in individual zonesappeared to be low, the combined injectionpotential in multiple zones seems to be suffi-cient for medium- to large-scale injection tests.In addition, commercial-scale injection is possible with the use of multilateral well andreservoir-stimulation technologies. Tests alsoshowed that the containment of CO2 wouldnot be compromised.
This project clearly demonstrated the value ofadvanced logging measurements, such as thoseprovided by the CMR and FMI tools, to quicklyascertain formation properties and characteris-tics so that more costly testing can be directed tothe most promising intervals. This CCS project,like the others, emphasizes gathering informationand multidisciplinary collaboration. The projectalso provides a protocol for characterizing deep-basin sedimentary sequences that have sparsedata but high potential.
Produce Coalbed Methane, Hold the CarbonUnmineable coal seams have been identified asanother potential storage volume site for anthropogenic CO2, with an estimated CO2 stor-age capacity at 7.1 billion short tons [6.4 billionmetric tons].28 Given coal’s intrinsic storagepotential and the growth in coalbed methane(CBM) exploitation, placing CO2 in coal seams isan attractive possibility.29
In dry-core tests, CO2 adsorbs at nearly twicethe rate—sorption separation factor—of CH4,making CO2 injection an efficient production-enhancement technique in CBM reservoirs, alsocalled enhanced coalbed methane (ECBM). In
some experiments in which the moisture con-tent of the coal has been reconstituted, theobserved CO2 sorption was significantly less.30
Nonetheless, added production, as a result ofCO2 injection, could offset some, or all, of thecost associated with injection operations.
The complexity of coal necessitates extensivestudy at subsurface conditions. Coal is often heterogeneous and could possibly promoteunpredictable sweep behavior. For example, CO2
breakthrough at a producing well might occuralong the most connected and extensive frac-ture—or cleat—networks.
Other concerns unique to ECBM are currentlybeing investigated. Special care must be takenwhen drilling and completing both injection andproduction wells for ECBM. In many cases, pro-ducing wells may be converted to injection wells.Coals frequently break out during drilling, or are stimulated by cavitation, increasing the likelihood of compromised cement jobs, poor isolation and loss of containment. A large per-centage of CBM producing intervals have beenstimulated by hydraulic fracturing. Hydraulicfractures that extend too far outside the targetinterval may allow CO2 leakage, putting contain-ment at risk. Also, replacing CH4 with CO2
causes coals to swell, changing the stress condi-tions in the coals and surrounding layers.
The depth of coalbeds considered for CO2
storage is also crucial. Experience from CBMproduction shows that the productivity of coalssignificantly degrades below 5,250 ft [1,600 m],because at those depths cleats close and perme-ability decreases. This reduces injectivity atinjection pressures below the coal fracture pressure. Laboratory testing and field-scale simulations have investigated changes in coal-
storage properties with variations in stress andwater saturation.31
While the global CO2 storage capacity ofcoalbeds is much smaller than that of deep salineaquifers, the potential CBM production benefitsfrom injecting CO2 make this option attractive.However, many questions remain. Energy produc-ers and CO2 storage experts continue to study thebenefits and challenges of CO2 ECBM. CONSOLEnergy, the largest producer of high-Btu bituminous coal in the USA and a CBM producer,is conducting a seven-year project to inject CO2
into coal seams in West Virginia. BurlingtonResources and BP are both studying ECBM in theSan Juan basin, USA. Many important projectsand studies are ongoing in Europe, including inFrance, Germany, The Netherlands and Poland.Special ECBM potential exists in those countriesthat have vast coal resources, such as Canada,Australia and China, prompting numerous projects and initiatives.
What the World Needs NowThe acidity of CO2 can corrode downhole tubu-lars and degrade cement. While not consideredtoxic, high concentrations of escaped CO2 aboveground or in freshwater aquifers could causedamage. Because the storage of CO2 must belong term—hundreds or thousands rather thantens of years—the bar has been raised for well construction.
There is no better example of how oilfieldtechnology must respond to the challenges of CO2
storage than cementing technology for well con-struction. Portland cement is the most commonmaterial used in well cementing. When CO2 is dis-solved in water, approximately 1% of the CO2
forms dissociated carbonic acid [HCO3-], which
reacts chemically with the compounds in thehydrated portland cement matrix, such as calciumsilicate hydrate gel (C-S-H) and calcium hydroxide[Ca(OH)2]. The major reaction products are cal-cium carbonate and amorphous silica gel. The setcement gradually loses strength and becomesmore permeable. As a result, cement failures havebeen reported during the many years of CO2 EORexperience (next page).32 Schlumberger is investi-gating and testing CO2-resistant cements,formulation and mixing techniques, cement simu-lators, and periodic and permanent methods toevaluate cement-sheath integrity.
To minimize risk in CO2 operations, accuratemodeling and simulation are important, and confidence in monitoring is essential at all levels.Public confidence in industry’s ability to safelyand securely store CO2 below ground for exten-sive periods is a requirement to move forward,
60 Oilfield Review
28. Herzog and Golomb, reference 8.29. Anderson J, Simpson M, Basinski P, Beaton A, Boyer C,
Bulat D, Ray S, Reinheimer D, Schlachter G, Colson L,Olsen T, John Z, Khan R, Low N, Ryan B andSchoderbek D: “Producing Natural Gas from Coal,” Oilfield Review 15, no. 3 (Autumn 2003): 8–31.
30. Tsotsis TT, Patel H, Najafi BF, Racherla D, Knackstedt MAand Sahimi M: “Overview of Laboratory and ModelingStudies of Carbon Dioxide Sequestration in Coal Beds,”Industry Engineering and Chemistry Research 43, no. 12(2004): 2887–2901.
31. Wolf KHAA, Barzandji OH, Bruining H and Ephraim R:“CO2 Injection in and CH4 Production from Coal Seams:Laboratory Experiments and Image Analysis for Simulations,” in Proceedings of the 1st National Conference on Carbon Sequestration, Washington, DC,(May 14–17, 2001) CD-ROM, DOE/NETL-2001/1144: 1–13.
32. Skinner L: “CO2 Blowouts: An Emerging Problem,” World Oil 224, no. 1 (January 2003): 38–42.
33. Damen K, Faaij A and Turkenburg W: “Health, Safety andEnvironmental Risks of Underground CO2 Sequestration,”http://www.chem.uu.nl/nws/www/publica/e2003-30.pdf(accessed October 11, 2004).
Benson S, Hepple R, Apps J, Tsang CF and Lippmann M:“Lessons Learned from Natural and Industrial Analoguesfor Storage of Carbon Dioxide in Deep Geological Formations,” http://www.co2captureproject.org/reports/reports.htm (accessed October 11, 2004).
34. The Kyoto Protocol is an international environmentalagreement that establishes country-by-country emissionstargets for greenhouse gases. The Protocol requiresindustrialized countries to reduce their emissions by anaverage of 5.2% below 1990 levels by 2010. The Protocolwill enter into force on the 90th day after the date it isratified by at least 55 countries accounting for at least55% of the total carbon dioxide emissions, as calculatedin 1990. As of April 15, 2004, 122 countries had ratified oracceded to the Kyoto Protocol and accounted for 44.2%of baseline CO2 emissions.Cannell et al, reference 1.
35. http://energy.er.usgs.gov/projects/co2_sequestration/co2_overview.htm (accessed August 10, 2004).
36. For more on the Carbon Sequestration Leadership Forum:http://www.cslforum.org/ (accessed October 11, 2004).

Autumn 2004 61
and this confidence is the core issue associatedwith monitoring. Monitoring CO2 migration in the subsurface volume has come a long way in a short time, and involves advances in seismic measurements and processing techniques. Othersubsurface methods, such as passive seismic mon-itoring and crosswell electromagnetic imaging,show tremendous promise. Surface detection ofCO2 leaks is an active area of research, althoughless mature than subsurface monitoring.
The capture, transportation and storage of CO2 are not risk-free, but if these are properly planned, operated and monitored, risk can be reduced substantially.33 Seventyyears of experience in natural gas storage operations have resulted in extremely low leak-age rates. Consequently, today there are morethan 600 natural gas storage facilities, manynear population centers.
To be successful in reducing emissions, several key factors must be addressed for thecapture and storage of CO2. Secure storage wouldlikely be required for hundreds of years, eclips-ing the anticipated lifespan of today’s oil and gasinfrastructure. Economics is a major factor. Thecosts associated with CO2 separation, trans-portation and storage must be minimized. Therisk to health and the environment should alsobe minimized, and practices used to capture andstore CO2 must be in accordance with laws and regulations. Moreover, gaining the trust of the public, the media and nongovernmental organizations requires open and transparent dis-semination of information to facilitate education.Even if these general principles are achieved, theeconomic task ahead is monumental.
The USGS estimates that the total CO2 gas-emissions volume from fossil fuels in the USA,which produces roughly 24% of the world’s CO2
emissions, is around 114 Tcf [3.2 trillion m3] peryear. This volume is almost five times the totalannual US natural gas consumption. To meet the conditions of the Kyoto Protocol by 2015, the USwould have to reduce emissions by 500 millionmetric tons/yr [550 million short tons/yr].34 Thisequates to almost twice the annual US natural gas production, and it would require theinfrastructure to process, transport, inject andstore the CO2.35 As large as that seems, the storage of CO2 represents only 20 to 30% of thetotal costs of CO2 sequestration.
Today, multinational cooperation is evidentin the Carbon Sequestration Leadership Forum(CSLF).36 The CSLF focuses on the policy andtechnical framework needed to ensure the success of CCS in the coming decades. The CSLFis involved in information exchange, planning,
collaboration, research and development, publicperception and outreach, economic and market studies, regulatory and legal issues, andpolicy formulation.
Large CCS projects, like the Sleipner fieldproject, are under way or in the planning stages.For example, the In Salah gas field in Algeria,the Gorgon gas field in Australia and the Snohvitfield in the Barents Sea are targeting salineaquifers. Strategic small-scale projects also playan important role in developing technologiesand experience for CCS site monitoring and verification, as for example, the Ketzin project inGermany and the K12 B project for enhancedgas recovery (EGR) offshore The Netherlands.For CCS to become an acceptable option toreduce CO2 emissions, projects like these arecrucial and will become more numerous withadditional knowledge and experience.
Clearly we need more time—time to studythe global problem at hand and to make the bestdecisions based on a reasonable degree of certainty. We also need time to develop newforms of renewable energy sources to eventuallysupplant fossil fuels. Additional investigation ofCO2 capture and storage sites is needed tobridge that gap, allowing the continued use ofour most abundant and cost-effective energyresources. This would help in advancing worldeconomies, which is key to the development oftechnologies that may ultimately help stemglobal warming. The capture and secure storageof CO2 may be viewed as a way to buy some extratime. The technology and expertise to store CO2
in the subsurface are available now and comefrom within the oil and gas industry. —MGG
> Redefining cement sheath durability. Conventional portland cementsdegrade when exposed to CO2 in wet conditions. In tests, cement samplesshow degradation, cracking and the crystallization of aragonite whenexposed to CO2 (top). Defects in the cement sheath increase the exposure to degradation from CO2 (bottom). Risk-mitigation efforts will include a highlevel of cement quality monitoring and more frequent logging than in the past.
Wel
lbor
e
CO2
Cement
CO2