biomimetic membrane for co 2 capture from flue gas library/research/coal/ewr/co2... · biomimetic...
TRANSCRIPT

Biomimetic Membrane for CO2 Capture from Flue Gas Type of Report: Final Scientific/Technical Report Report Period Start Date: 05/10/06 Report Period End Date: 03/19/07 Principal Author: Michael C. Trachtenberg Date of Report: August 29, 2007 DOE Award: DE FG26-06NT42824 Submitting Organization: Carbozyme, Inc. 1 Deer Park Dr., H3 Monmouth Junction, NJ 08852

DOE Award #: DE FG26-06NT42824 Biomimetic Membrane for CO2 Capture from Flue Gas
Closeout Report 2
DISCLAIMER “This report was prepared as an account of work sponsored by an agency of the United States Government. Neither the United States Government nor any agency thereof, nor any of their employees, makes any warranty, express or implied, or assumes any legal liability or responsibility for the accuracy, completeness, or usefulness of any information, apparatus, product, or process disclosed, or represents that its use would not infringe privately owned rights. Reference herein to any specific commercial product, process, or service by trade name, trademark, manufacturer, or otherwise does not necessarily constitute or imply its endorsement, recommendation, or favoring by the United States Government or any agency thereof. The views and opinions of authors expressed herein do not necessarily state or reflect those of the United States Government or any agency thereof.”
DOE Award #: DE FG26-06NT42824 Biomimetic Membrane for CO2 Capture from Flue Gas
Closeout Report 3
ABSTRACT These Phase III experiments successfully addressed several issues needed to characterize a permeator system for application to a pulverized coal (PC) burning furnace/boiler
assuming typical post-combustion cleanup devices in place. We completed key laboratory stage optimization and modeling efforts needed to move towards larger scale testing. The SOPO addressed six areas. Task 1 - Post-Combustion Particle Cleanup – The first object was to determine if the Carbozyme permeator performance was likely to be reduced by particles (materials) in the flue gas stream that would either obstruct the mouth of the hollow fibers (HF) or stick to the HF bore wall surface. The second, based on the Acceptance Standards (see below), was to determine whether it would be preferable to clean the inlet gas stream (removing acid gases and particulates) or to develop methods to clean the Carbozyme permeator if performance declined due to HF block. We concluded that condensation of particle and particulate emissions, in the heat exchanger, could result in the formation of very sticky sulfate aerosols with a strong likelihood of obtunding the HF. These must be managed carefully and minimized to near-zero status before entering the permeator inlet stream. More extensive post-combustion cleanup is expected to be a necessary expense, independent of CO2 capture technology This finding is in agreement with views now emerging in the literature for a variety of CO2 capture methods. Task 2 - Water Condensation – The key goal was to monitor and control temperature distributions within the permeator and between the permeator and its surroundings to determine whether water condensation in the pores or the HF bore would block flow, decreasing performance. A heat transfer fluid and delivery system were developed and employed. The result was near isothermal performance that avoided all instances of flow block. Direct thermocouple measurements provided the basis for developing a heat transfer model that supports prediction of heat transfer profiles for larger permeators. Tasks 3. 4.1, 4.2 - Temperature Range of Enzymes – The goal was to determine if the enzyme operating temperature would limit the range of thermal conditions available to the capture system. We demonstrated the ability of various isozymes (enzyme variants) to operate from 4-85°C. Consequently, the operating characteristics of the enzyme are not a controlling factor. Further, any isozyme whose upper temperature bound is at least 10°C greater than that of the planned inlet temperature will be stable under unanticipated, uncontrolled “hiccups” in power plant operation. Task 4.4, 4.4 – Examination of the Effects of SOx and NOx on Enzyme Activity (Development of Flue Gas Composition Acceptance Standards) – The purpose was to define the inlet gas profile boundaries. We examined the potential adverse effects of flue gas constituents including different acids from to develop an acceptance standard and compared these values to actual PC flue gas composition. Potential issues include changes in pH, accumulation of specific inhibitory anions and cations. A model was developed and validated by test with a SO2-laden stream. The predicted and actual data

DOE Award #: DE FG26-06NT42824 Biomimetic Membrane for CO2 Capture from Flue Gas
Closeout Report 4
very largely coincided. The model predicted feed stream requirements to allow continuous operation in excess of 2500 hours. We developed operational (physical and chemical) strategies to avoid or ameliorate these effects. Avoidance, the preferred strategy (noted above), is accomplished by more extensive cleanup of the flue gas stream. Task 5 - Process Engineering Model – We developed a process-engineering model for two purposes. The first was to predict the physical and chemical status at each test point in the design as a basis for scale-up. The second was to model the capital and operating cost of the apparatus. These were accomplished and used to predict capex, opex and cost of energy. Task 6 - Preliminary Commercialization Plan – We carried out analyses of the market and the competition by a variety of parameters. The conclusion was that there is a large and rapidly growing market that will support good business growth.

DOE Award #: DE FG26-06NT42824 Biomimetic Membrane for CO2 Capture from Flue Gas
Closeout Report 5
TABLE OF CONTENTS
BIOMIMETIC MEMBRANE FOR CO2 CAPTURE FROM FLUE GAS ................................................1
DISCLAIMER......................................................................................................................................................2
ABSTRACT ..........................................................................................................................................................3
TABLE OF CONTENTS ....................................................................................................................................5
EXECUTIVE SUMMARY .................................................................................................................................6
PROJECT TASKS...............................................................................................................................................9
TASK 1 – FLUE GAS PARTICLE EVALUATION AND MANAGEMENT.................................................................9 TASK 2 - CHARACTERIZE THE EFFECT OF OPERATING PARAMETERS ON WATER CONDENSATION ............15 TASK 3, 4.1 AND 4.2. INVESTIGATE CO2 REMOVAL EFFICIENCY AT LOW TEMPERATURE BY DIFFERENT
ENZYMES (ISOZYMES). ....................................................................................................................................25 TASK 4.3 AND 4.4: INVESTIGATE CO2 REMOVAL AT HIGH TEMPERATURE BY CAM / EXAMINE EFFECTS OF
ACID GASES ON PERMEATOR OPERATION......................................................................................................27 TASK 5 - CARRY OUT PROCESS MODELING ...................................................................................................36 TASK 6 - DEVELOP A PRELIMINARY COMMERCIALIZATION PLAN................................................................46
PROJECT CONCLUSION ..............................................................................................................................54
REFERENCES ...................................................................................................................................................56

DOE Award #: DE FG26-06NT42824 Biomimetic Membrane for CO2 Capture from Flue Gas
Closeout Report 6
EXECUTIVE SUMMARY This Phase III project is an expansion of work done under DOE-funded Phase I, II and IIE projects. Phase III tasks were geared towards moving the research stage technology forward, emphasizing development, engineering and commercialization.
Key issues addressed in this work included: 1) understanding and developing a strategy to manage particles in the flue gas stream, 2) understanding and developing a strategy to manage water condensation in the permeator, 3) examining the efficacy of several different isozymes over a temperature range from 20 to 85oC, 4) development of acceptance standards for acid gases and mercury in the flue gas stream, 5) developing a process engineering model, and 6) developing a preliminary commercialization plan.
Managing Particulates The proposed test strategy was to examine potential reduction in permeance due to block of the hollow fiber bore and/or obstruction of the surface by clean, dry particles, a potential surrogate for flue gas particulates. The particulates present in flue gas from coal combustion include ash that is entrained in the flue gas, i.e. fly ash, and aerosols. When flue gas is maintained at a relatively high temperature (to guarantee sufficient atmospheric buoyancy and dispersion) the particulates act as dry materials. However, when flue gas temperatures drop below the dew point ~160°C for typical stack gas concentrations of SO2) acid gases can condense as liquid aerosols. Our investigation into managing flue gas particulates showed to achieve a flue gas temperature acceptable for delivery to the Carbozyme CO2 capture permeator, the gas must be cooled to well below the due point allowing acid aerosols to condense. Condensation of these sulfate and sulfite aerosols typically occurs by nucleation onto fly ash dust and fines (Miller 2006). Testing with clean, dry particles was not deemed a suitable surrogate. Extensive investigations, were carried out via expert input (Szalach 1998; Miller 2006; Blankenship 2006; Salvador 2006) and literature review (Li et al. 2006; McIlvaine 2006; Miller and Laudal 1998; EPA 2005), to address the key issues and to provide a strategy for subsequent testing. The data showed that cleanup of the flue gas stream prior to entry into the permeator was much preferred to secondary cleanup of the permeator. This conclusion is now preferred by developers of other liquid absorption technologies. (Details are described under Task 1 and Task 4 activities). In brief, 1) Cleanup of particulate and SOx is needed to minimize the probability that sticky
particles, derived from sulfate nucleation on particles, might attach to the membrane surface,
2) The greater the particulate and SOx load at the permeator mouth, the more maintenance will be required,
3) The maintenance required with higher loadings of particulates and SOx may include cleaning the membrane with low strength caustic solutions followed by drying of the membrane. If this process were required at high frequency it will be costly and time consuming,

DOE Award #: DE FG26-06NT42824 Biomimetic Membrane for CO2 Capture from Flue Gas
Closeout Report 7
4) High particulate and SOx loading may lead to decreased membrane life, due to frequent cleanings,
5) Technologies exist that eliminate all or virtually all acids and particles. These have been demonstrated at operating facilities, (Salavador, 2006).
A successful analysis of likely surface blocking materials and processes was achieved. We concluded that either alterations to current post-combustion cleanup or the addition of a washing/filtration stage would likely achieve a sufficiently low particulate and SOx load to allow non-detrimental entry to the permeator.
Managing Water Condensation - Condensation of water within the bore and/or on the surface or in the pores of the hollow fibers was previously identified as a potential problem that might arise under conditions of inadequate temperature control (Fang et al, 2004). Water evaporation occurs within the permeator making it necessary to add heat to prevent excessive cooling. These observations indicated the need to study the temperature profile within an operating permeator and analyze the data as a basis for the design of scaled-up permeators. The data showed that thermal management was readily accomplished by incorporating heat transfer (HT) elements within the current scale permeator. A heat transfer model for thermal management was calibrated using data collected from operation of the current scale permeator. These data provided the key information necessary for designing thermal management elements applicable to larger permeators. Thermal Range of CA Isozymes – The design parameters that account for system performance are the permeation rates of each gas component in addition to the physical dimensions of the membrane systems. For a specific hollow fiber (HF) and system layout all of the gases, other than CO2, have a fixed permeance. CO2 transport across the liquid membrane is more complex, since its permeance is not only dependent on the geometry, but also on the facilitation provided by the enzyme. It was desirable, therefore, to identify and test several different carbonic anhydrase (CA) isozymes with respect to their activity at different temperatures and to measure the permeate CO2 concentration when they were in use. This was accomplished by testing the performance of a lab scale permeator over a range of temperatures using three different isozymes. The data collected, while operating the permeator, show that regardless of the operating temperature selected (over the range of 20–85°C) it is possible to provide an isozyme that will work well. (Enzyme activity was tested at 4°C). Thus isozymes characteristics are not a controlling feature for selection of the operating temperature of the permeator. In view of this data, other engineering optimization considerations can be used to determine the operating temperature. Flue Gas Composition Acceptance Standards – Flue gas contaminants, SOx, NOx, HCl and HF can all affect permeator performance and influence carbonic anhydrase activity. This can occur via two mechanisms, primarily changes in CLM pH through acid accumulation, and secondarily, by inhibition of CA via accumulation of competitive anions in the CLM, both of which involve their accumulation in the CLM. Mercury can also impact permeator performance by serving as a cationic inhibitor of CA activity. To

DOE Award #: DE FG26-06NT42824 Biomimetic Membrane for CO2 Capture from Flue Gas
Closeout Report 8
do this it must accumulate in the CLM as Hg+2, i.e., oxidized mercury ions. Literature research, experiments, and simulation modeling were used to investigate each of these effects. The conclusions reached from this work were that: typical concentrations of HCl, HF, and NOx do not present a problem either because their concentration is too low or because the contaminants will be removed in the FGD to acceptable levels, provided that SOx is removed to an acceptable level. We predict successful operation of the permeator for >2500 h without CLM replacement when operated on a flue gas meeting the acceptance value conditions of SOx = <7.08 ppm, HCl = <7.08 ppm, HF =<7.08 ppm, NOx = no limit, Hg =<3.54 x 10⁻⁶ ppm as Hg+2. Finally, we have learned that the Carbozyme permeator acceptance limit for SOx is in line with that for other CO2 capture technologies (e.g., amine or ammonia) (EPRI 2000, 2007). Process Engineering Model – A process flow diagram was constructed in order to define the major pieces of equipment needed to operate the Carbozyme permeator and produce a dry, high pressure CO2 product. Heat and material balances were performed in order to determine the energy use of each major equipment item defined and to set sizing for several others. This information was then used to estimate the major equipment cost by use of the size or energy times a factor. This is not a complete detailed cost; rather it is an indication of cost. The sum of the major equipment items was multiplied by 3 to estimate the installed cost. Any first-of-a-kind installed system is expected to be more expensive because of all the unknowns and manufacturing at a scale that has not yet been developed. Modeling, using heat and material balance, showed that the simulation of the permeator and the compression train was sufficient to characterize the needs of the system. The simulation addressed process optimization, capital and operating cost and parasitic load. Using this simulation and the data provided in EPRI Case 7C (EPRI 2000) we showed a parasitic load of 60MW (of the 462 MW that would have been delivered to the electrical grid) would be required to remove 90% of the available CO2, drying and compressing the product gas up to 8274 kPa (1200 psig). Further pumping to 2400 psig would require additional energy of about 1.3MW. Preliminary Commercialization Plan - Our preliminary commercialization plan focused on a SWOT analysis (Strengths, Weaknesses, Opportunities and Threats). This included the technical features of key competitive technologies and the business status of the respective companies. The plan allowed a grouping based on physical-chemical properties and an analysis based on parasitic energy cost. A further analysis examined partnerships that are developing among companies in this space and examined development strategies to gain experience and the confidence of candidate customers. Our analysis confirmed the strength of the Carbozyme technology and helped to plot a development and interaction course for business success.
DOE Award #: DE FG26-06NT42824 Biomimetic Membrane for CO2 Capture from Flue Gas
Closeout Report 9
PROJECT TASKS
Task 1 – Flue Gas Particle Evaluation and Management
Task Description – The first objective of this task was to determine if particles being delivered to the permeator (leaving the baghouse or the FGD) would reduce permeance by either blocking the orifice (bore) of the hollow fibers or adsorb onto the inner surface of the fiber bore and thus increase the resistance to mass transfer presented by the hollow fiber membrane. The second objective was to devise and test permeator cleanup methods. The purpose of these cleanup methods was to determine if it was possible to return a clogged permeator back to usable operation. The third objective was to consider pre-treatment approaches that would prevent particulates from reaching the permeator. The objective being sufficient treatment of the flue gas prior to the permeator such that cleanup would not be required for a predetermined time period. The last objective was selection of a preferred management strategy. SOPO details are as follows:
Objective 1 – Design test and implement test apparatus • Task 1.1: Characterize the particle distribution • Task 1.2: Obtain particle design/generation method from NIST • Task 1.3: Design and construct particle test apparatus Objective 2 – Carry out test regimen • Task 1.4: Measure changes in axial and transverse flow on particle exposure Objective 3 – Consider remediation/recovery paradigms • Task 1.5: Examine benefit of increased filtration on improving gas flow blockage • Task 1.6: Examine benefit of membrane washout on improving gas flow blockage Objective 4 – Evaluate results of Tasks 1.4-1.6 • Task 1.7: Select preferred particle management strategy
Objective 1 – Design, test and implement a test apparatus. Tasks 1.1, 1.2 and 1.3 were targeted towards developing and implementing a test method to characterize the composition of the flue gas stream, following standard cleanup, i.e., SCR, baghouse and FGD. The key assumption was that the hot gas entering the stack contained fly ash and suspended acid aerosols that could be treated as dry materials. The surrogate material, in lieu of a burner and cleanup train, was Arizona road dust particles and/or fly ash, both available from NIST. These materials are used by membrane manufacturers to examine possible occlusion of hollow fiber membranes in dusty environments. On the basis of this assumption the experimental questions (Task 1.4) were to determine if the dust particles would occlude the mouth of the hollow fibers and/or attach to the walls of the hollow fibers thereby increasing the pressure drop through the hollow fibers and/or increasing the resistance to mass transfer through the membrane. Further, to determine if a reverse airflow (Task 1.6) would readily dislodge dust blocking the orifice and remove dust from the bore sidewalls, or if additional filtration prior the permeator was a necessary addition (Task 1.5).

DOE Award #: DE FG26-06NT42824 Biomimetic Membrane for CO2 Capture from Flue Gas
Closeout Report 10
To support Objective 2 we generated a preliminary model. The hollow fibers we use have an ID of 240!m. Given the EPA baghouse P10 requirement we anticipated that the stream exiting the FGD would consist largely of particles less than 10!m in diameter. As a rule-of-thumb the potential for face occlusion is quite low if the ratio of particle diameter to mouth orifice is <1:10. In the case of a 10!m particle and a 240!m ID hollow fiber the ratio is 1:24, thus occlusion by dry particles is unlikely. Prior data from hollow fiber manufacturers who had exposed hollow fibers to dry Arizona road dust indicated that if any surface blockage occurred it would likely be easily dislodged by reverse air flow (Membrana, 2006). Wet particles were more likely to form a resilient plug. Our initial assumption was that an air blow would be sufficient to dislodge the particles, presuming they were dust-like and dry (Task 1.5). Thus, a key approach was to develop capability to deliver clean, dry particles. To carry out dry particulate based tests we needed to obtain the appropriate particles (Task 1.2), a particle delivery and distribution apparatus (Task 1.3), and flow measuring equipment (Task 1.1). The hollow fiber permeator or a hollow fiber contactor would have to be instrumented to measure changes in gas flow in both the axial and transverse directions (Task 1.4). Task 1.2 – Obtaining Particle Test Equipment: We identified the Vilnius Dry Powder Aerosol Generator (CH Technologies Inc., Westwood, NJ) as an excellent piece of equipment to deliver dry dust particles in a low volume / low flow generation situation providing the precise regulation of flow and particle loading necessary. It is typically used in air pollution studies. We designed experimental protocols to measure decreases in tangential and in parallel flow conditions (Task 1.4). We anticipated measuring changes in pressure drop through the hollow fiber and across the membrane under a range of particle loading conditions. We would also examine face blockage and the ability of back blow, or a more aggressive wash method, to clear the hollow fiber mouth (Task 1.5, 1.6). The Vilnius devices are made to order; few are sold and the manufacturer does not lease or rent their devices. Efforts to borrow this item proved fruitless. Given the very small number of experiments and the high cost of the equipment outright purchase proved well beyond the project budget. In parallel with the efforts just described we were consulting with experts in post-combustion cleanup and particulate management to determine what alternative paths might be taken. The experts consulted were Stanley Miller at EERC (Energy and Environmental Research Center), George Blankenship at SRI (Southern Research Institute) and Carlos Salvador at CANMET. Their inputs were augmented with a review of the scientific and engineering literature on the subject (Li et al. 2006; McIlvaine 2006; Miller and Laudal 1998; EPA 2005). This learning forced the realization that the particle impact testing approach outlined in the application (use of dry road dust or fly ash) would not adequately address the issues that would be encountered in treating power plant flue

DOE Award #: DE FG26-06NT42824 Biomimetic Membrane for CO2 Capture from Flue Gas
Closeout Report 11
gas because of the need to lower the entry temperature and thereby create a new regimen with extensive acid aerosol condensation product. More specifically, the experts highlighted the complexity and variability of flue gas streams as a function of the rank of coal burned, the type of furnace used and the types of cleanup equipment in place (Szalach 1998; Miller 2006; Blankenship 2006; Salvador 2006). The effluent stream from a coal burning power plant, even in the presence of a full compliment of cleanup equipment given current standards and accepted procedures, still emits a gas stream that would have very high likelihood of fouling the hollow fiber membrane, due to the creation of very sticky particles. Going into this project the thought was that removal of the particulates that exit the burner – the fly ash – from the flue gas was going to be the controlling issue. What we found out was that even with effective control of these dry materials any appreciable concentration of SOX remaining in the flue gas would present a problem by forming acid aerosol particulates by condensation nucleation when the flue gas is cooled to the temperatures necessary for operation of the permeator. The stream exiting the FGD can include a fine aerosol particulate consisting of liquid acid aerosols and particles, collectively called particulates. Some of the sulfate aerosols are so small and tenacious they have a tendency to remain in the flow stream, despite the most intensive liquid scrubber, and not contact any surfaces so that they will exit the exhaust stack (Li et al 2006). This condition occurs even when the gas temperature is well below the dew point of acid aerosols (typically 127°C, 260°F). Cooling the flue gas to the temperature appropriate to enter the permeator (<85°C, 185°F) would result in complex condensation products with some coals. The sulfate aerosols tend to accumulate moisture and become sticky, thus increasing their potential for accumulating into larger particles. These larger sticky particles are expected to adhere tightly to the membrane, the fiber surface and possibly agglomerate at the bore mouth. These particulates behave quite differently than do dry or even wet fine dust particles This issue was discussed at a DOE sponsored conference held in 1998, “Formation, Distribution, Impact, and Fate of Sulfur Trioxide in Utility Flue Gas Streams Conference” (DOE 1998): The abstract by S J Miller and D L Laudal (1998) addressed the issue thusly –
“Clearly a scrubber will neutralize any SO3 or acid mist that contacts the low-pH liquid. The problem is that once the SO3 is in the form of an aerosol, there is poor mass transfer to the liquid. A scrubber will not collect acid mist any better than it collects fine ash particles. A fraction of the particles is collected by diffusion, interception, and impaction, but most pass through the scrubber uncollected. A scrubber may make opacity much worse because the rapid quench can cause significant acid condensation, which passes through the scrubber. If the scrubber were not present, much of the SO3 would remain in vapor form and have no effect on opacity. The best approach to controlling SO3 in coal-fired boilers is unclear.”

DOE Award #: DE FG26-06NT42824 Biomimetic Membrane for CO2 Capture from Flue Gas
Closeout Report 12
The complexity of managing the problem, in part, was illustrated in the paper by P Szalach et al. (1998) presented at the same conference. The principal issue here was tracking down the causes of blue and brown plumes in the air above the stack. Sulfate aerosols were seen as the culprits but a disassociation between sulfate management and plume formation was observed. More importantly (for our apparatus) the concentration of various sulfate species was dependent on interactions between the conditions in the burner and in the cleanup processes. The issue devolved to how to manage such sticky materials should they attach to the membrane. We contacted Membrana, the manufacturer of the hollow fibers we use, to determine how to manage the possibility of these sulfate particles sticking to the membrane. They indicated that sulfate aerosol accumulation on the polypropylene surface membrane would be very difficult to remove and would not come off with reverse airflow. Instead the HF would, at minimum, require cleaning off with a dilute caustic solution like that used to remove biological soils. Additionally, there was considerable uncertainty that all the particulates would be removed (Membrana, 2006). Additional analysis focused on determining the potential effects that acid condensates would have on the polypropylene. Data from the CRC Polymers database (http://www.polymersdatabase.com/) and Sterilitech (2006) on the chemical compatibility of polymer membrane filters showed that polypropylene is resistant to both dilute and concentrated acids, including individual concentrations of nitric, hydrochloric and sulfuric acid. Based on this information we concluded that failure of the polymer membrane due to acid aerosol loading would not be of significant concern. However, it is possible that, over time, the exposure of the membrane to strong acids could lead to partial oxidation of the membrane surface. This oxidation would decrease the membranes hydrophobicity. Sufficient loss in hydrophobicity results in membrane pores filling with water resulting in reduced performance. Catastrophic failure would not be expected, but reduced performance would be observed and could be resolved through module replacement. At the acceptance concentrations (see Below) there should be little possibility of damage due to acid condensation on the feed side. In contrast, Membrana’s observations are HF lifetime decreases with repeated cleaning cycles. According to Membrana engineers it is not possible to predict, even with accelerated testing, what the membrane lifetime will be in any specific situation (Membrana, 2006). The result of the Carbozyme and Membrana discussions was that if the acid aerosol loading to the permeator were kept to a minimum, it would be possible, with reasonable controls and occasional cleaning, to achieve our desired lifetime of 8 years (Membrana, 2006). This value is based on Membrana’s extensive experience with polypropylene membranes, replacement frequency and analysis of the cause of failure from such applications as pharmaceutical, diary and beer manufacture. Membrana does not carry out accelerated aging and did not have a protocol for doing so. Subsequent discussion with other membrane manufacturers confirmed that fouling and surface property changes were two principal reasons for membrane replacement. Fouling is idiosyncratic as a function of the feed stream and is best limited by effective filtration and cleanup before presenting the gas (or liquid) to the membrane.

DOE Award #: DE FG26-06NT42824 Biomimetic Membrane for CO2 Capture from Flue Gas
Closeout Report 13
Task 1 [Objective 2] Experimental Methods – The purpose of objective 2, using the answers discovered in Objective 1, was to proceed to test the effects of the particles in blocking a hollow fiber array and then to examine ways to remove any attached particles. Task 1 [Objective 2] Results and Discussion - In view of the results described above, i.e., the formation of acid condensates, we elected to delay implementation of experiments until they could be done properly and meaningfully using an appropriate coal flue gas streams to validate particulate management under condensing conditions. Task 1 [Objective 3] Experimental Methods – The purpose of objective 3 was to examine two different approaches to managing particulates – reducing the quantity delivered to the permeator (Task 1.5) or cleaning the permeator by blow back or by washing (Task 1.6). Task 1 [Objective 3] Results and Discussion - The data we had accrued showed that prior particulate management was far more preferred than was cleanup after partial or total occlusion.
These findings were augmented by data from water filtration manufacturers and, more importantly from Natco (Cynara). They use hollow fiber membranes to extract high pressure CO2 from oil, following enhanced oil recovery (EOR). They have over 20 years experience in this field. Over this period they have progressively increased the amount of pre-extraction cleanup. Today over 60% of their cost for such CO2 extraction is in pre-extraction cleanup to maximize the lifetime of their membranes and to minimize the need to replace modules (Sanders, 2003). Task 1 [Objective 4] Results and Discussion - Integrating the various inputs led to the clear conclusion that additional post-combustion pre-treatment was necessary. Further, that the type of pre-treatment needed would depend on the permeator inlet composition acceptance values. Pre-treatment could be of two types. One approach, provided that a full suite of clean-up equipment was in place, would be to modify the FGD to minimize aerosol particulates (now known as “deep FGD”). A second was to add either a WESP or some other type of aqueous absorber. If little or no post-combustion clean-up equipment were in place, the approach could be a condensing heat exchanger (CHX) or some other full treatment technology. The conclusion from all of these sources of information was that it was far wiser and more economical to clean the inlet stream of potentially problematic materials, i.e., prevention, then it was to attempt to repair the permeator. Cleanup could be managed by improvement of existing apparatus, addition of a guard column or installation of new, more efficient cleanup systems. Recent data indicate that other technology developers routinely discuss the idiosyncratic character of power plants and the need to match new equipment to that in place and to acceptance values. Discussions with C Salvador and K Zanganeh at CANMET indicated that use of two CHXs in series in their facility, burning

DOE Award #: DE FG26-06NT42824 Biomimetic Membrane for CO2 Capture from Flue Gas
Closeout Report 14
lignite, eliminated virtually all particles and reduced sulfates to only a few ppm (Salvador 2006; Zanganeh 2006). As noted, CANMET uses two CHXs in series and measured sulfur acids at the few ppm range and virtually no particles in the outlet stream.21 Many new cleanup procedures were presented at the American Filtration Society 2006 annual meeting (where Carbozyme presented). Specific examples include McIlvine (2006) (The McIlvaine Company) “Power Plant Filtration Decisions” (McIlvaine, 2006) and that of Li et al (2006), (Ohio Coal Research Center) “Acid Aerosol and other Fine Particulate Control with Wet Laminar Electrostatic Precipitation.” They concluded that with the appropriate design, for a given rank of coal, virtually all particulates could be removed. The data reported there were substantiated at meetings with Wheelabrator Air Pollution Control, Inc., a Siemens AG company (Wheelabrator, 2006). In both cases wet ESP (WESP) after the FGD and changes to the FGD were suggested as candidate methods to virtually eliminate all acids as well as virtually all particles. Task 1 Conclusion – The activities performed in fulfillment of Task 1 showed the following: Re Objective 1 – Current particulate streams, even after typical full treatment, have a strong possibility, over time, of blocking membrane surfaces. The most important reason is that when the inlet flue gas is cooled that even the highest temperature that a permeator would operate at, 85°C, is well below the dew point of acid aerosols, particularly that of of SOx (a few hundred ppmv). SO3 and sulfuric acid will condense. If any residual dust (fly ash) particles are present the acids will nucleate on them and form acid aerosols that are difficult to remove in scrubbers but are very likely to adhere to the bore surface of the hollow fiber membrane. Attachment of these sticky condensates may block the polymer membrane surface thus increasing the mass transfer resistance and decreasing permeator performance. Re Objective 2 – The data obtained led to the conclusion that experiments utilizing condensed acid aerosols from a PC source are the only reasonable test of mouth or surface blockage. Re Objective 3 – Cleaning of the permeator by use of an alkali wash will remove particulates and acid aerosols from the hollow fiber membrane surface. Most likely me debris will accumulate, over time, as not all of the adherent material will be removed by any given wash cycle. Repeated alkali washes will alter the membrane surface chemistry, eventually causing changes that can compromise performance. Higher particulate and SOx loading along with frequent cleaning would likely lead to decreased membrane life. Repeated surface management, if required at high frequency, will prove costly and time consuming. Thus, the alternate approach of improved cleanup of the flue gas stream is preferential and presents less risk. This conclusion contributed to our investigation into improved cleanup technologies.

DOE Award #: DE FG26-06NT42824 Biomimetic Membrane for CO2 Capture from Flue Gas
Closeout Report 15
Re Objective 4 - Our findings concur with those now emerging in the literature for a variety of CO2 capture methods, including towers using amine chemistry. Specifically, particle and particulate emissions must be managed carefully and minimized to near-zero status (for amine-tower systems to avoid foaming, flooding and obstruction of filters). This more extensive post-combustion cleanup is expected to be a necessary expense, independent of CO2 capture technology. As is discussed below (Task 4) treatment emphasis is on particles, particulates, mercury and especially SOx.
Task 2 - Characterize the Effect of Operating Parameters on Water Condensation
Task 2 Background and Description – Water evaporation from the contained liquid membrane of the permeator into the permeate gas stream is a natural part of as the permeator operation. This evaporation of water requires heat that must be replaced or the temperature of the permator will decrease (evaporative cooling) resulting in condensation of water in the feed/retentate side hollow fibers. Water condensation can decrease permeator performance by blocking the pores of the membrane and/or the bore of the hollow fiber. Pore blockage will decrease the effective area available for mass transfer and/or increase the mass transfer resistance for CO2 (decreased permeance). Bore blockage will decrease the effective area of membrane available by preventing gas to flow through the occluded hollow fiber tubes, thus preventing gas flow through some hollow fibers and increasing the pressure drop through the permeator at a given flow rate. We documented the decreased performance previously while running a cross flow permeator (Trachtenberg et al, 2005). Cooling of the permeator from 20°C to 17°C resulted in decreased performance – shown as decreased CO2 in the argon sweep diluted permeate. The data from this study are shown in Figure 2-1. A condensation event and recovery from that condensation event is shown for the time period from 230 to 310 hours. The time from 0 to 75 hours shows recovery from a previous event. The time from 675 to 700 hours shows the occurrence of another condensation event. The recovery from condensation events was achieved by increasing permeator temperature and providing time for water to evaporate. As seen in Figure 2-1 the permeator would return to the pre-condensation performance level. Condensation on gas permeable membrane surfaces was independently observed (in much shorter duration experiments by Fang et al. (2004).

DOE Award #: DE FG26-06NT42824 Biomimetic Membrane for CO2 Capture from Flue Gas
Closeout Report 16
SOPO Details are as follows: • Task 2.1: Examine operating temperature effects on water condensation • Task 2.2: Test thermal reversal of water blockage • Task 2.3: Measure heat distribution throughout permeator
Task 2 Experimental Methods – The approach taken was to study all three subtasks using a spiral wound hollow fiber (SWHF) permeator equipped with and internal heat transfer element and instrumented with thermocouples and pressure measurement devices (Figure 2-2). The proposed plan was to avoid condensation events, if possible. We achieved operation of the permeator without the occurrence of the condensation events. In other words, the improved design and operation eliminated the previously observed failure mode. A SWHFCLM will exhibit a temperature distribution along the length. To determine the axial temperature profile we constructed an apparatus instrumented with thermocouples. Thermal profiles within and particularly between the permeator and the surroundings turned out to be relatively complicated in this very small permeator because of the small diameter of the apparatus, with its attendant high surface area-to-volume ratio (Fig 2-4). Extensive insulation was installed to thermally isolate the permeator (Fig. 2-5). The experimental setup for measurement of gas permeance was described previously (Cowan et al., 2003). The heat transfer profile was determined by installing 12 thermocouples (TCs) onto the permeator, a thermocouple manifold and attendant amplifiers (National Instruments NI-9211). One TC was installed at each of two sites (inlet, and outlet) for each of the four flows of the permeator (feed, permeate, CLM and heat transfer). In addition, there was a TC installed near the feed end, one layer away

DOE Award #: DE FG26-06NT42824 Biomimetic Membrane for CO2 Capture from Flue Gas
Closeout Report 17
from the 1/8” HTF SS tube in the center axis of the permeator. A second was installed near the retentate end, one layer in from the outer edge of permeator (just inside the inner diameter of the PVC tubing). Both of these TCs are in contact with the CLM fluid. Pressure gauges and differential manometers were installed on the requisite flow lines to monitor pressure deviations. Figure 2-2 illustrates the test setup. The sites designated as T# indicate thermocouple locations. Flow pumps and pressure gauges are shown as indicated. The physical device is shown in Figure 2-4 with thermocouples installed but without insulation, etc. NI software was installed to support computerized real time monitoring of all thermocouples simultaneously. Calibration corrections were implemented for all of the thermocouples. This approach allows automatic, continuous and simultaneous recording from all thermocouples as illustrated in Figure 2-3. The particular selection of temperature profiles for the permeator shows a sampling rate every 20 seconds with the system operating dry (no CLM, but the HTF adjusted to have as little thermal differential as possible from the room, i.e., at approximately room temperature). Room temperature was measured by thermocouple T4 (orange) and is seen to cycle to higher and lower temperatures than the rest. All of these temperatures were easily converted to usable data by exporting them into an Excel spreadsheet for analysis. Calibration corrected measurements of the 12 thermocouples achieved a deviation of <0.1°C over a temperature range of 0-100°C. Initial thermocouple data indicated a large temperature differential between the inlet and outlet streams. This was traced to heat loss across various portions of the feed tubing to the surrounding air, before it reached the permeator. Ultimately we recognized that the heat capacity of the gases, given the low flow rates and the high heat transfer over only a few millimeters of exposed tubing, could compromise many of the readings. The very slow flow rate for the gases and liquids is necessary due to the small volume of the permeator. Addition of nichrome wire heating elements managed this issue. None-the-less, we detected additional heat loss from the permeator. Careful analysis revealed that the permeator tubing was radiating a large amount of heat from the surface to the room. Additional insulation largely managed this problem.

DOE Award #: DE FG26-06NT42824 Biomimetic Membrane for CO2 Capture from Flue Gas
Closeout Report 18
Figure 2-2. Schematic representation of the test apparatus.
In summary the TC designations are as follows:
T# DESCRIPTION 1. Core temperature away from
HTF tubing 2. CLM outlet 3. Retentate 4. Room Temperature 5. HTF outlet 6. HTF final return temperature 7. HTF supply temperature
8. Core Temperature near HFT tubing
9. CLM inlet 10. Permeate – note this is under
a significant vacuum 11. HTF inlet 12. Feed inlet
The main permeator section consists of a 13.5 mm OD (1/4”) PVC pipe. The effort to reduce its heat loss necessitated locating the permeator in the middle of a 15.24 cm (6”) metal duct and filling the space with urethane foam. While there was still some detectable heat loss but it was manageable provided the model-based controls were applied. The usual calculation method is based on the equation Q=U*A*"T where U is the overall heat transfer coefficient, A is the area and "T the temperature difference. Specific area was not a major contributor to this measurement. This allowed simplification of the calculations, by using UA as the basis. UA averaged out to 74 Cal/h*°C, provided that the temperature difference between room temperature (T-4) and the average HTF

DOE Award #: DE FG26-06NT42824 Biomimetic Membrane for CO2 Capture from Flue Gas
Closeout Report 19
temperature of T-5 and T11 is "T. This translates to 730 Cal/hr for the 9.9°C difference observed when the HTF averaged to 36.7ºC. When the permeator was filled with CLM and evaporation was taking place, the overall heat loss under this condition was 1237 Cal/h. This compared to a loss of over 4000 Cal/h before insulation. The improved, insulated, design is shown in Figure 2-5. In this small diameter permeator the HT in the center was sufficient to manage the heating requirements.
Figure 2-3. Example of temperature outputs from the twelve thermocouples
Figure 2-4. The naked spiral wound dual HF permeator.
This permeator was run under non-ideal conditions to more closely simulate real world conditions. Specifically, the temperature of the room varied (Fig. 2-6) over a range of 4°C. In contrast, due to good insulation and thermal management the difference between the feed gas and the permeate was less than 1°C (Fig. 2-6).

DOE Award #: DE FG26-06NT42824 Biomimetic Membrane for CO2 Capture from Flue Gas
Closeout Report 20
An HTF is used to maintain a constant temperature not only within the permeator but at the entry and exit sites as well. The HTF heats the core of the permeator via a centrally located 3.175 mm (1/8”) stainless steel tube. To reduce the potential for condensation in the retentate line the exiting HTF line is also wrapped in the 3.175 mm (1/8”) ID Tygon tubing as it is returned to the water bath. This temperature is recorded at T6. T1 is a thermocouple buried at the retentate side. Its location is as far away from the heating element as possible, just under the last wrap of the hollow fiber layer. T8 is at the feed/permeate end, buried as close to the stainless steel HTF tubing as practical, but not touching the tube. The effect of this difference can be noted by looking closely at Figure 2-6. T3 reflects the temperature of the retentate while T10 measures the temperature of the Permeate.
Figure 2-5. The permeator shown in Figure 2-4, insulated and in operation.

DOE Award #: DE FG26-06NT42824 Biomimetic Membrane for CO2 Capture from Flue Gas
Closeout Report 21
Figure 2-6. Temperature comparison between the room (T-4) and the permeator (T-
1).
Task 2 Results and Discussion - The evaporative loss to the retentate will depend on the humidity in the feed. Figure 2-7 demonstrates how the system responds to the heat losses. The data plot in Figure 2-7 illustrates the inlet and outlet temperature of the permeator starting without CLM in the permeator and then shows the greater temperature differences after the CLM is added with the resulting larger temperature difference to compensate for the additional heat loss due to evaporation. Figure 2-7 used data obtained from thermocouples T11 (inlet) and T5 (outlet). The illustration shows the temperature loss as the HTF flows through the permeator, here a length of 52 cm (20.5 in). The difference is about 0.9°C (1.62°F). While operating this resulted in a heat loss of 9.23 kJ/h (2,206 cal/h) for the center section of the permeator, with the water bath set at 52ºC.

DOE Award #: DE FG26-06NT42824 Biomimetic Membrane for CO2 Capture from Flue Gas
Closeout Report 22
Figure 2-7. Thermocouple record of the HTF inlet and outlet.
To better prepare for such situations in the future we constructed an analytical model to calculate heat loss. This model is applicable to any flow and for the total system. The model is based on the assumption that the heat loss to the room at different HTF flows is approximately the same and the temperature offset between two thermocouples will have a constant calibration difference. We constructed a spreadsheet and populated it with calibration data derived under different flow conditions. This allowed calculation of the heat loss at the different flow rates with reference to the same calibration cell. A standard deviation between the different heat losses was calculated. The calibration offset was adjusted until the standard deviation was at a minimum. The temperature offset for each TC is:
The actual deviation between the corrected temperature and the recorded output is very small as seen in the table.
The resultant water transfer is shown in Figure 2-8. The bar indicates the standard deviation.

DOE Award #: DE FG26-06NT42824 Biomimetic Membrane for CO2 Capture from Flue Gas
Closeout Report 23
Figure 2-8. Water heat transfer as a function of operating temperature.
The heat transfer within the permeator is the difference between T5 and T1 for one end and T11 and T8 for the other end. The two attached graphs (Figure 2-9) show the changes at both ends as the temperatures are changed. The temperature difference from one end to the other is only very slight. The average difference for T5-T1 starts out at near 0 at 25°C, rising to 0.26 at 30°C, and to 0.55 at 37°C. For the T11-T8 it is 0.28 and 0.34, respectively. T1 is about 2.9 mm from the stainless steel tube and the T8 is about 0.2 mm. The data presented in Figure 2-8 show that the amount of water that will evaporate is dependent on the temperature of operation of the system.

DOE Award #: DE FG26-06NT42824 Biomimetic Membrane for CO2 Capture from Flue Gas
Closeout Report 24
Figure 2-9. Heat transfer within the permeator.
Task 2 Conclusion – The data show that the temperature of the permeator can be rigorously controlled independent of room temperature. Additionally, the temperature difference between the inlet and outlet ends is modest and that the amount of water evaporating and the attendant evaporative cooling is readily controlled; posing no undue burden on the design or operation thereof. Sufficient information has been collected to allow design of heat transfer elements into permeators during scale-up. Further, heat loss from the permeator will be less of a problem as diameter increases due to the lower surface area to volume (S/V) ratio and because more effective insulation will be used. The distance between the HT fiber and the permeate fibers will be kept small to avoid formation of temperature gradients that might result in condensation in the fiber pores. The heat transfer surface area is specific to each permeator, given the feed conditions and is not related to the size of the power plant.

DOE Award #: DE FG26-06NT42824 Biomimetic Membrane for CO2 Capture from Flue Gas
Closeout Report 25
Condensation water from the interstage compressor condenser/coolers provides the needed heat thereby avoiding any additional parasitic cost to the power plant. The water that is used for the heat transfer within the compressor train is circulated through the HT fibers within the permeators and the rate of circulation is controlled by thermocouples in the permeator via a feedback loop.
Task 3, 4.1 and 4.2. Investigate CO2 Removal Efficiency at Low Temperature by Different Enzymes (Isozymes).
Task 3, 4.1 and 4.2 Description – Determine the operating temperature range for different isozymes and examine how differences in operating temperature may affect CO2 permeance. Task 3 and Task 4 (parts 4.1 and 4.2) required examination of a number of isozymes to determine the overall range of operating temperature. Task 3 and part of Task 4 have some issues in common. As such it is more logical to present them together and apart from those portions of Task 4 that are unrelated.
SOPO details are as follows: • Task 3.1: Test performance of 3 different enzymes at low temperatures • Task 3.2: Compare CO2 removal efficiency for 3 different enzymes at low
temperatures • Task 4.1: Develop an operating temperature profile for a CAM-based permeator • Task 4.2: Test temperature performance of CAM-based permeator
Task 3, 4.1 and 4.2 Results and Discussion – We tested several different enzymes for overall activity (0°C) and in the permeator where they were run at operating temperatures ranging from 20°C to 85°C. By so doing, presuming the isozymes operated in a satisfactory manner, we could then focus on optimal operating conditions for the permeator and for the knockback condenser to minimize system energy cost without being bound by the thermal requirements of the isozyme. To this end we examined three isozymes. The first, provided by Novozymes, was derived from a bacillus – !-NS81091. This isozyme has an upper temperature bound of 25°C
before it is denatured. This isozyme is produced via recombinant DNA expression. The second, obtained from Sigma-Aldrich, was !-BCA II, i.e., the bovine isozyme from red
blood cells and thus virtually equivalent to the similarly derived human isozyme !-HCA
II that we had tested some years before. It has an upper temperature bound of <45°C. The BCA II and one version of the HCA II were purified from natural sources while a second (tested previously) was derived by microbial expression from a modified plasmid. The third isozyme, obtained from Prof. J. G. Ferry at The Pennsylvania State University, was CAM, a member of the "-CA family derived from a methanogen but now obtained by
expression in E. coli. While the !-CAs are monomers the "-CA is a trimer. Dr. Ferry had
demonstrated in the laboratory that it would operate at temperatures in excess of 60°C.

DOE Award #: DE FG26-06NT42824 Biomimetic Membrane for CO2 Capture from Flue Gas
Closeout Report 26
Activity tests were performed at 0°C by means of the Maren assay, an end-point measure of enzyme activity (Maren, 1960). Each of these isozymes was tested in the same permeator. The permeator temperature was controlled by placing it in a temperature controllable water bath. The permeator was maintained at a fixed temperature for a minimum of 30 minutes and as long as 8h before the temperature was elevated by 5°C. This progression continued until the performance of the permeator dropped to that observed in the absence of enzyme, i.e., when the enzyme was denatured. CAM was tested over the range of 20°-85°C over a period of 4 days. This duration is more than sufficient to observe any denaturation related event as the temperature dependent failure mode of enzymes is well recognized to be dramatic, i.e. within 5-10°C of the point of maximal stable activity and declines within 5-15 min. and continues to fall, relatively linearly as temperature increases. For this reason we selected isozymes whose upper temperature bound was at least 10° above our operating temperature. More importantly, the thermal mass of the permeator is so large that no sudden change in feed gas entrance temperature could have a detrimental effect on the enzymes. Should it become necessary to protect against irregularities in the feed stream temperature inlet, a cooling loop could be incorporated that would activate when a thermal overload was detected.
Figure 3-1 illustrates the permeator performance, as CO2 concentration in an argon sweep gas stream for each of the three isozymes described above. Previous data had shown that the !-CA II isozyme would fail at temperatures in excess of 45°C (Trachtenberg et al.
2005). The triangles towards the bottom of the illustration correspond to the permeance obtained using a bicarbonate solution alone in the absence of any or viable enzyme. As can be seen NS81091 failed in excess of 25°C, BCA II in excess of 45°C but the CAM isozyme continued, thought with somewhat reduced performance to 85°C when the experiment was terminated. As usual all of the gas flows – feed, retentate, sweep and permeate were measured by RGA. The data were extracted and plotted using Excel. These studies explored enzyme performance over a range of temperatures including those that will be encountered when processing actual flue gas.

DOE Award #: DE FG26-06NT42824 Biomimetic Membrane for CO2 Capture from Flue Gas
Closeout Report 27
Figure 3-1. Effect of temperature of permeate stream CO2 concentration for three
different CA isozymes. (Data collected using a cross flow permeator with argon
sweep.)
Task 3, 4.1 and 4.2 Conclusion The data collected indicate that regardless of the operating temperature selected (in the range from 20 to 85°C), it will be possible to provide an isozyme that will work under those conditions. Therefore, other engineering optimization considerations can be used to determine the optimum operating temperature.
Task 4.3 and 4.4: Investigate CO2 removal at high temperature by CAM / Examine Effects of Acid Gases on Permeator Operation
Task 4.3 and 4.4 Description – Determine the sensitivity of CAM to SOx and NOx. Information on the inhibitory nature of HCl, HF and mercury was also collected. SOPO details are as follows: • Task 4.3: Design test protocol for measuring SOx and NOx effects on CAM • Task 4.4: Test effects of SOx and NOx on CAM activity

DOE Award #: DE FG26-06NT42824 Biomimetic Membrane for CO2 Capture from Flue Gas
Closeout Report 28
Task 4.3 and 4.4 Results and Discussion – The flue gas contaminants, SOx, NOx, HCl and HF can all affect permeator performance and influence CAM activity through two mechanisms, both of which involve their accumulation in the CLM. The two mechanisms operate via: (1) changes in CLM pH through accumulation of acids in the CLM; (2) inhibition of CA by accumulation of inhibitory ions (generally anions) in the CLM. Mercury can also impact permeator performance by serving as a cationic inhibitor of CA activity. To do this it must accumulate in the CLM as Hg+2, i.e., oxidized mercury ions. The influence of pH on performance has less to do with the optimum pH of the enzyme, carbonic anhydrase, and more to do with having acceptable conditions for high concentrations of bicarbonate and carbonate ions. This is a result CO2 transport through the CLM is dependent on the diffusion of bicarbonate from the source (feed side) to the sink (permeate side) and back diffusion of carbonate ions from the permeate side back to the feed side. The optimum pH range for permeator operation is therefore a complex function of the feed (flue) gas concentration of CO2, the % CO2 capture and the overall CLM chemistry (i.e., metal ion concentration). The optimum pH is typically in the range of 8.5 to 9.0. The acceptable limit of pH change was taken as that which decreased pH below 7.5. This is a somewhat arbitrary but conservative selection. It is arbitrary because there is no clear pH value beyond which permeator performance will be acceptable and below which the permeator performance will be unacceptable. It is conservative because we expect acceptable permeator performance to be possible even as low as pH 7. However, performance will drop as pH drops below the optimum value and the rate of pH drop with acid addition will accelerate as pH decreases outside the buffer range of the bicarbonate–carbonate acid–base pair. At pH values below pH 7.5 the rate of pH drop becomes very fast. This is shown clearly in later figures. To determine the CA inhibition based acceptance limits we captured key ion sensitivity data for each of the isozymes of carbonic anhydrase that have been studied. The Ki values (the concentration at which the activity of CA would be reduced to # of its maximum) were taken as the maximum acceptable concentration of each contaminant in the CLM. Considerable information is available in the literature regarding the inhibitory effects of monovalent anions, here with reference to NO3
- Cl-, and F-. Monovalent anions can bind
to the same catalytic sites, as does HCO3-, though with somewhat lower affinities because
of differences in molecular size. Certain divalent anions (such as SO4-2), with appropriate
charge distribution, can also bind to this bicarbonate site, though usually with lower affinity. By assembling these data we were able to get values for Ki, NO3
-, SO4=, Cl-, and
F- for "-CAM (Innocenti et al. 2004) and several other CA isozymes (Innocenti et al.
2004; Baird et al 1997). Ki information was also collected for mercury (Tu et al. 1981). The Ki values for the $-CAM isozyme are 36.5 mM for NO3
-, >200 mM for SO4=, and >
200 mM for both Cl- and F- (Innocenti et al. 2004). The lowest of these Ki values, that for NO3
-, is lower than we expected based on other information we gathered that suggests at least some CA isozymes are much less sensitive to nitrate ions than the value implies. In

DOE Award #: DE FG26-06NT42824 Biomimetic Membrane for CO2 Capture from Flue Gas
Closeout Report 29
experiments we had performed by Dr. CK Tu (unpublished data) we found no detectable inhibition of %-CA at 100 mM NaNO3. Also, Bond et al (2001) reported little inhibition of CA at NO3
- concentrations below 100 to 200 mM. Mercury, or more accurately oxidized mercury ions, is one of the most potent inhibitors of CA with a Ki = 1.7 µM Hg+2 for BCAII (Tu et al, 1981). A more conservative value of 1.0 µM was used in our analysis. Once the pH and inhibitor concentration limits in the CLM were set we then determined the concentration of contaminants (SOx, NOx, HCl, HF, and Hg) in the flue gas that would lead to these CLM concentrations. Because the flue gas flows through the permeator, the permeator contains a fixed volume of CLM, and the acids and ionic contaminants will accumulate in the CLM (as opposed to being in equilibrium with the gas phase concentration) the question is really one of loading (gas phase concentration * flue gas flow rate * time / volume of CLM). In addition, we had to consider the oxidation state of the gas phase contaminants and whether or not the contaminants would oxidize in the permeator. In a worst case analysis we assumed all of the SOx, NOx and Hg would oxidize and thus accumulate in the CLM as SO4
=, NO3- and Hg+2. In reality the
accumulation of SOx into the CLM as SO4= is expected as the conditions favor oxidation
of SO2 and its accumulation as sulfate. The accumulation of NOx into the CLM as NO3-
is expected to be minimal. Most NOx in flue gas is present as NO, which is unlikely to oxidize in the permeator and only a fraction of the small portion of the NOx. present as NO2, is likely to accumulate in the CLM. All of the HCl and HF are expected to accumulate in the CLM but the flue gas concentration of these is typically extremely low. All of the mercury present as Hg+2 can be expected to accumulate in the CLM but oxidation of that present as Hg0 is not expected to occur in the permeator. The data we have on Hg in the flue gas did not include speciation and remains an unknown. Hg speciation in flue gas varies widely based on the combustion conditions, the coal burned and the flue gas treatment processes in use. We sought was to determine the acceptable flue gas concentration of acid gases and mercury that can be loaded to the permeator over an operational duration of 2500 hours and not force the pH of the CLM below 7.5 and/or the CLM concentration of SO4
=, NO3-,
Cl-, F- and/or Hg+2 above their respective Ki values. The CLM phase acceptance values are given in Table 4-1.
Table 4-1. CLM (Liquid Phase) Acceptance Concentrations.
CONTAMINANT ACCEPTANCE CONCENTRATION
IN CLM
Ki (mM)
Cl- 200
F- 200
SO4= 200
NO3- 36.5
Hg+2 1.0 x 10⁻⁶
pH 7.5*

DOE Award #: DE FG26-06NT42824 Biomimetic Membrane for CO2 Capture from Flue Gas
Closeout Report 30
Model Data – To determine the gas phase acceptance values we first examined changes in pH and CLM concentrations that would be observed for a representative pulverized coal flue gas. We used the measured – post pollution control treatment – composition of a flue gas provided by a cooperating electric power company that burns pulverized coal (PC). The values for this flue gas are given in Table 4-2.
Table 4-2: Base Flue Gas Composition
Component Composition
%
Water1 H2O 7.709
Nitrogen N2 74
Carbon dioxide CO2 14.3
Oxygen O2 3
Argon Ar 0.9288
Nitrous oxide NO 0.035
Sulfur dioxide SO2 0.0264
Hydrogen chloride HCl 3.00E-04
Hydrogen fluoride HF 1.00E-05
Mercury Hg 2.00E-07
TOTAL 100
Two separate simulations were performed in which the pH and CLM composition were calculated. The conditions used for both simulations were the flue gas of the composition shown in Table 4.2 contacted with CLM at the ratio consistent with our expected flue gas treatment rate per volume of CLM. This allows the calculated CLM composition to be plotted against time. The differences between the two simulations were that for one we allowed for oxidation of SOx, NOx and Hg (Figure 4-2), while for the other we did not allow for oxidation of SOx, NOx or Hg (Figure 2). The thermodynamic modeling used for the simulations was performed using the OLI Stream Analyzer software (OLI, Morris Plains, NJ). The balance of the data analysis was performed using models we generated in Excel spreadsheets. Figure 4-3 shows that if all of the SOx, NOx, and Hg present in the representative flue gas were to be oxidized the permeator would fail within 8 hours. This is due to accumulation of NO3
-, 50 hours due to the accumulation of Hg+2, 77 hours due to the accumulation of SO4
=, and 90 hours due to the drop in pH to below 7.5. The Cl- and F- concentrations remain acceptable for >2500 hours. Clearly this means that additional pretreatment of the flue gas would be necessary before the Carbozyme permeator. Recall however that the conversion of all NOx and Hg to oxidized forms is not expected so a no oxidation case calculation was also performed.

DOE Award #: DE FG26-06NT42824 Biomimetic Membrane for CO2 Capture from Flue Gas
Closeout Report 31
Changes in CLM Chemistry with Typical Flue Gas
0.00E+00
1.00E+02
2.00E+02
3.00E+02
4.00E+02
5.00E+02
6.00E+02
7.00E+02
8.00E+02
0 50 100 150 200 250
Time of Permeator Operation, hr
Co
nta
min
an
t C
on
c. in
CL
M
0
1
2
3
4
5
6
7
8
9
pH
an
d H
g C
on
c.
In C
LM
Total Aqueous Cl mM
Total Aqueous F mM
Total Aqueous S mM
Total Aqueous N mM
Total Aqueous Hg microM
pH
assumes SO 2, NOx and Hg are oxidized
pH drops below pH limit of 7.5 at 90 hours
Hg exceeds 1 µM limit at 50 hours
S exceeds 200mM limit at 77 hours
N exceeds
35mM limit
at 8 hours
initial pH drop due to HNO 3,
later pH drop due to H 2SO4
Figure 4-2. Worst case analysis of the effects of a typical PC flue gas on CLM
chemistry – SOx, NOx, Hg oxidation condition.
Figure 4-3 contains the no oxidation case results for the PC flue gas. Here the CLM concentrations of all Hg species, all NOx species, Cl-, and F- remain acceptable for >2500 hours but the pH and SOx species (mostly SO3
=) exceed the acceptable values at 158 and 65 hours respectively. (Note: SO3
= does not necessarily have the same Ki as SO4= but has
been assumed in this analysis). Given that SOx is expected to oxidize and NOx and Hg are not, and even if SOx does not oxidize it will accumulate in the CLM and decrease CLM pH we therefore conclude that SOx acceptance values will drive pretreatment requirements for the permeator. This has been reported for other CO2 capture technologies as well (and the chemistry of CO2 capture essentially demands this will be true for all CO2 capture technologies).

DOE Award #: DE FG26-06NT42824 Biomimetic Membrane for CO2 Capture from Flue Gas
Closeout Report 32
Changes in CLM Chemistry with Typical Flue Gas
0
100
200
300
400
500
600
700
800
0 50 100 150 200 250
Time of Permeator Operation, hr
Co
nta
min
an
t C
on
c. in
CL
M
0
1
2
3
4
5
6
7
8
9
pH
an
d H
g C
on
c.
In C
LM
Total Aqueous Cl mM
Total Aqueous F mM
Total Aqueous S mM
Total Aqueous N mM
Total Aqueous Hg microM
pH
assumes SO 2, NOx and Hg are not oxidized
pH drops below pH limit of 7.5 at 158 hours
S exceeds 200mM limit at 65 hours
pH drop due to H 2SO3
N, Cl, F, Hg do not
exceed limits within
2500 hours
Figure 4-3. Analysis of the effects of a typical PC flue gas on
CLM chemistry for the no oxidation condition.
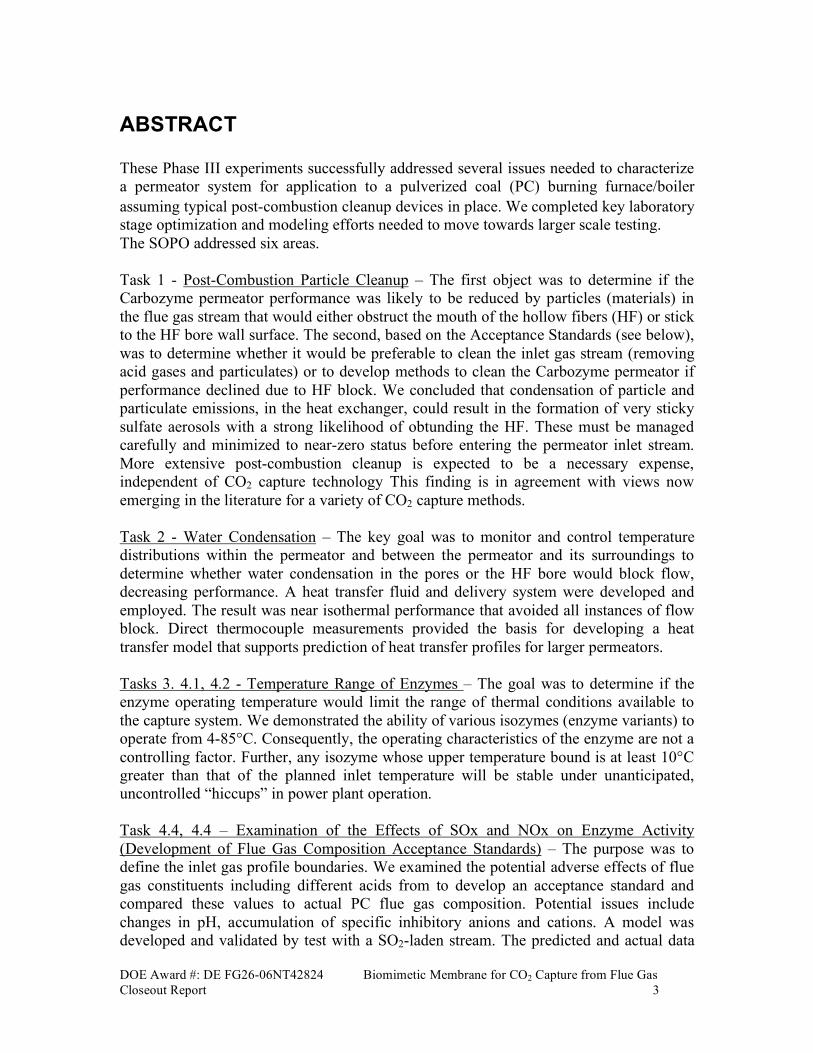
Once the typical PC flue gas analysis was completed it was necessary to determine the flue gas concentrations that would allow acceptable operation for >2500 hours. Figure 4-4 represents CLM contaminant concentrations and pH for the worst-case analysis (oxidation of SOx, NOx and Hg) for a flue gas meeting our most stringent acceptance criteria (Table 4-3). The flue gas concentrations that met the acceptance criteria were then used to simulate the change in CLM chemistry expected over 3000 hours of operation (goal of 2500 hours of operation). These results are given in Figure 5. The red circles show that the pH does not decline below 7.5 until 2,600h of continuous use. The pink squares show that CLM accumulation of sulfates, chlorides and fluorides do not exceed the CA Ki value of 200mM for 2550h. Similarly, the CLM nitrate concentration does not exceed the CA Ki of 35mM for a similar 2550h. Finally, the acceptable mercury limit of 1!M is not exceeded for 3,000h.
DOE Award #: DE FG26-06NT42824 Biomimetic Membrane for CO2 Capture from Flue Gas
Closeout Report 33
Figure 4-4. CLM composition at flue gas acceptance conditions.
Table 4-3. Flue Gas Acceptance Limits –
Based on Most Stringent Requirement Assumptions.
Contaminant Flue Gas Concentration
pH Based Acceptance
Value
Enzyme Based Acceptance
Value
Removal Required (2500h
Lifetime)
ppmv ppmv ppmv %
HCl 3 17.7 7.08 0
HF 0.1 17.7 7.08 0
SO2 (as SO3= or
SO4=)
264 8.85 7.08 97.3%
NO / NO2* 350 17.7 1.239 99.6%
Hg# 2.00E-03 3.54E-06 99.8%
* The acceptance level for NO / NO2 depends on the amount of NOx that is oxidized to HNO3 # The acceptance level for Hg depends on the amount of Hg which is present as Hg+2
Only the oxidized NOx and Hg will present a problem for operation of the permeator. Experimental Confirmation of SOx and NOx Capture in the CLM. A hollow fiber contactor was constructed using the feed fibers for a Carbozyme permeator for the purpose of studying the capture of SOx and NOx into a solution having

DOE Award #: DE FG26-06NT42824 Biomimetic Membrane for CO2 Capture from Flue Gas
Closeout Report 34
the same chemistry as the permeator CLM (1 M NaHCO3). A bottle of analyzed gas containing 0.0358% SO2, 0.0469% NO, 20.0% CO2 and balance N2 (79.9173%) was mixed with CO2 free air to make a nominally 15% CO2 feed gas which was passed through the contactor. The inlet and outlet gas concentrations of SO2, NO, NO2, CO2, N2, O2 and Ar were monitored using a Questor IV Mass Spectrometer (Extrel) and the pH of the re-circulated CLM solution was monitored using an computer interfaced pH meter. The experiment was conducted at 250C. Figures 4-5 and 4-6 present the experimental data collected as well as CLM pH values simulated using the same models as those used to determine the acceptance values. The model calculations performed included those with and without SOx oxidation; NOx oxidation was not allowed.
The results shown in Figure 4-5 indicate excellent agreement between the data collected and the model predictions. The decrease in pH with flue gas loading was gradual until the pH dropped below the acceptance limit of 7.5. Beyond this point the rate of pH drop with loading increased rapidly until the pH of the CLM fell below 3.15. Up until this point the pH and outlet SOx concentration observed and those predicted by the SOx oxidation based model were in good agreement. At loadings exceeding this point the outlet SOx concentration increased until eventually no removal was observed and the reduction in solution pH slowed and then stopped – which is consistent with no additional SOx capture. The difference between the data and the model can be directly attributed to a limitation in the model. At low pH the rate of SOx oxidation becomes very slow – this was not accounted for in the thermodynamic model used for the simulation.
Figure 4-6 includes the inlet and outlet NO and NO2 concentrations from the same experiment. Data confirm that at most a very small amount of NOx will be captured by the Carbozyme permeator. These data along with the good agreement between the pH and SOx capture data indicate the NOx acceptance value presented earlier is overly conservative and in fact the Carbozyme permeator acceptance value for NOx is likely much greater than the NOx concentration that would be present in any flue gas.
Additional Information on Hg: In the above analysis on the effect of mercury on permeator performance due to its inhibition of CA activity we found that if the mercury is present as Hg+2 it might cause a significant problem. This occurs because ionized mercury is one of the most potent inhibitors of carbonic anhydrase. The Ki value is about 1!M. If all of the mercury in the flue gas used in this analysis is present as Hg+2 the lifetime of the CLM is calculated to be 50 hours. Elimination of this problem could be accomplished by one of two strategies: a) reduction of the Hg+2 to Hg0, b) removal of 99.82% of the Hg+2, provided that the total amount was present as Hg+2.

DOE Award #: DE FG26-06NT42824 Biomimetic Membrane for CO2 Capture from Flue Gas
Closeout Report 35
Flue Gas Contaminant Loading Test, SOx and pH
0.000
0.005
0.010
0.015
0.020
0.025
0.030
0.035
0 10 20 30 40 50 60 70 80 90 100 110
Flue Gas Loading, moles
Gas C
om
po
nen
t C
on
c., %
0.0
1.0
2.0
3.0
4.0
5.0
6.0
7.0
8.0
9.0
pH
SO2 IN - measured
SO2 OUT - measured
SO2 Out - simulation with redox
SO2 Out - simulation without redox
pH - measured
pH Simulation - with redox
pH Simulation - without redox
Figure 4-5. Results of flue gas contaminant loading test and model simulation
showing SO2 capture by CLM controls CLM pH.
Flue Gas Contaminant Loading Test - NOx
0.000
0.005
0.010
0.015
0.020
0.025
0.030
0.035
0.040
0.045
0 10 20 30 40 50 60 70 80 90 100 110
Flue Gas Loading, moles
Ga
s C
om
po
ne
nt
Co
nc
., %
NO IN - measured
NO OUT - measured
NO2 IN - measured
NO2 IN - measured
NO IN - estimated
NO2 IN - estimated
Comparing average in to average out:
3.7 % NO removal
34.7% NO2 removal
Figure 4-6. Results of flue gas contaminant loading test confirming minimal capture
of NOx by the CLM. 3.7% of the NO and at most 34.7% of the NO2 were captured.

DOE Award #: DE FG26-06NT42824 Biomimetic Membrane for CO2 Capture from Flue Gas
Closeout Report 36
Final Flue Gas Acceptance Values: SOx = 7.08 ppm HCl = 7.08 ppm HF = 7.08 ppm NOx = no limit Hg = 3.54 x 10⁻⁶ ppm as Hg+2
Task 4.3 and 4.4 Conclusions: The model simulation results and the data collected detail the effect of flue gas contaminants on the chemistry of the CLM. Our conclusions are that the flue gas contaminant of dominant concern for removal during pre-treatment is SOx. The acceptance concentration for SOx is calculated to be 7.08 ppm. Higher concentrations can be accepted at the cost of requiring additional efforts are made to maintain acceptable CLM chemistry. The Carbozyme permeator acceptance limit for SOx is in line with that for other CO2 capture technologies.
Task 5 - Carry Out Process Modeling
Task 5 Description – Carry out process engineering towards developing a scale-up device and towards estimating final specifications and costs. SOPO details are as follows: • Task 5.1: Develop preliminary process flow sheet • Task 5.2: Develop heat and material balance • Task 5.3: Preliminary equipment size and component cost estimation • Task 5.4: Determine operating cost of design • Task 5.5: Preliminary system cost estimation
Task 5 Experimental Methods The Process Flow Diagram is based on the EPRI Evaluation of Innovative Fossil Fuel Power Plants with CO2 Removal 1000316, Interim Report, December 2000, Case 7C (EPRI 2000). In this model 151,295 kg/h of coal is burned, producing 1,841,410 kg/h of combustion gases, measured after the bag house and before entering the FGD. The CZ analysis data includes the mass of gas exiting the bag house, and the costs associated with the observed blower and FGD, all shown on the EPRI Case 7C flowsheets. The flue gas composition was estimated based on typical coal flue gas, as shown in Table 2-1.
CO2 13.06%
O2 3.0%
H2O vapor only 7.7%
N2 75.24%
CO 0.008500%
HCl 0.000300%
SO2 0.026400%

DOE Award #: DE FG26-06NT42824 Biomimetic Membrane for CO2 Capture from Flue Gas
Closeout Report 37
SO3 0.001000%
NOx 0.035000%
Hg 0.000000198%
Argon 0.92880%
Total 100.000%
Table 5-1. Flue gas composition. The pressure and temperature of the gas leaving the bag house is as noted in the Case 7C, 94,458 Pa (13.7 psia) and 137ºC (279ºF). The PFD is designed to send the gas flow through a CZ permeator system, to remove the CO2, and then exit in a normal stack at a pressure of 99,284 Pa (14.4psia). (Note that the CZ system may need a different pressure at the stack than that specified in Case 7C to account for differences in gas buoyancy. This will be determined during final engineering design.) The PFD is large. To facilitate viewing it, the PFD is shown divided into a series of five smaller sheets as follows:
(1) Figure 5.1 shows the final stage of flue gas cleanup and the Carbozyme permeator (2) Figure 5.2 shows the first three stages of permeate (purified CO2 product)
compression (3) Figure 5.3 shows the fourth and fifth stages of CO2 compression (4) Figure 5.4 shows CO2 drying, a final CO2 compression stage, and a CO2 cleanup
stage for removal of residual N2 and O2 (5) Figure 5.5 shows processes for CLM production and maintenance.
Figure 5-1 Process Flow Diagram – ID Blower, FGD and CZ Permeator

DOE Award #: DE FG26-06NT42824 Biomimetic Membrane for CO2 Capture from Flue Gas
Closeout Report 38
Figure 5-2 Process Flow Diagram – Compression Stages 1 through 3
Figure 5-3 Process Flow Diagram – Compression Stages 4 and 5
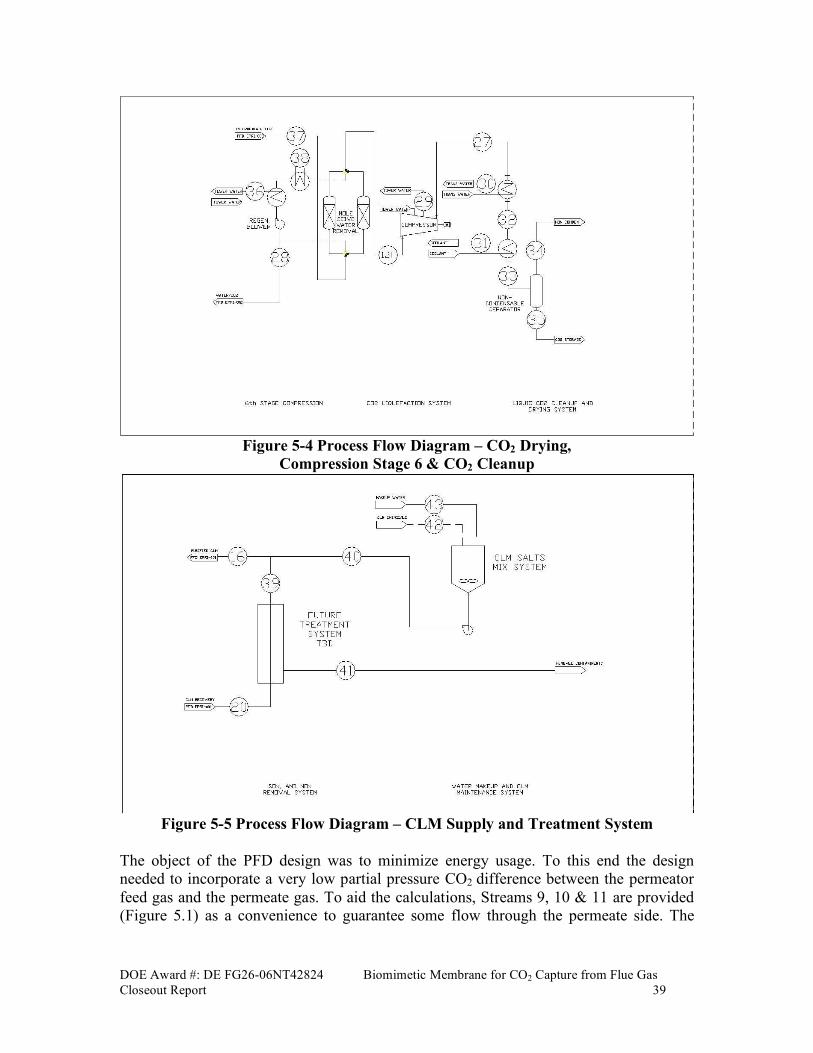
DOE Award #: DE FG26-06NT42824 Biomimetic Membrane for CO2 Capture from Flue Gas
Closeout Report 39
Figure 5-4 Process Flow Diagram – CO2 Drying,
Compression Stage 6 & CO2 Cleanup
Figure 5-5 Process Flow Diagram – CLM Supply and Treatment System
The object of the PFD design was to minimize energy usage. To this end the design needed to incorporate a very low partial pressure CO2 difference between the permeator feed gas and the permeate gas. To aid the calculations, Streams 9, 10 & 11 are provided (Figure 5.1) as a convenience to guarantee some flow through the permeate side. The
DOE Award #: DE FG26-06NT42824 Biomimetic Membrane for CO2 Capture from Flue Gas
Closeout Report 40
treated flue gas, indicated as Stream 7 and 7A (Figure 5.1), will be at the temperature of the Permeator and about 100% RH. Much of the rest of the Flow Diagram is used for compressing and drying the purified CO2. The use of interstage coolers and knockback condensers rests on the assumption that the most efficient energy utilization occurs when water removal takes place at the highest pressure possible. Drying is assumed to be by molecular sieves functioning slightly below the critical pressure for CO2. The closer compression is to the isothermal condition, vs. adiabatic condition, the lower the energy utilization. Six stages of compression were used to minimize the energy usage. The very large compressors considered here typically have an efficiency rating of 79%. The ID blower energy use, before the FGD, was assumed to be less efficient at ~60%. All the energy of the blower was included in the overall CZ energy consumption despite the fact that part of the blower energy was used to drive the flue gas through the FGD. In the molecular sieve, electric heating was used to desorb the water. This water, along with any attendant CO2, was sent back to the first stage compressor outlet so that all the water and CO2 was available for recovery. Although the CLM cleanup and makeup system was shown on the PFD, no work was done to evaluate this part of the system. Principally, because makeup is not a continuous operation, it was only preformed when the CLM was formulated for startup or when a section of the permeators had maintenance preformed. Otherwise, the water that was evaporated was made up from the condensate out of the compression train. Cleanup of the CLM was not preformed on a continuous basis; rather we anticipate replacement every 90 days. This expenditure was built into the operating cost and the limitations shown for the flue gas pretreatment in Task 4. Completion of the PFD analysis allowed attention to the heat and material balance. This resulted in an extensive estimation on how the system would react to each of the process equipment items, e.g., the energy requirement. The heat and material balance was generated via an Excel spreadsheet. A commercial simulator was unnecessary, as we did not modify the basic EPRI Case 7C work. Here the energy delivered to the grid is 462,058 kW. Any calculation of parasitic energy as a fraction of the power plant output uses this as the basis, i.e., for no parasitic load. In addition, the majority of the modeling activity focuses on the performance of the CZ permeator system, which is not modeled on commercial simulators. The compressor energy, with that of the attendant intercoolers, was modeled using Equations 10-80a, 10-81 & Fig 10-66 from Perry’s Handbook [Perry and Green, 1999]. The water calculations used an Excel add-in called water97_v13.xla, authored by Bernhard Spang, Hamburg, Germany, URL: http://www.cheresources.com/staff.shtml.
[Spang 2006]. Several approaches were explored before achieving this standardized approach, including the formulas in Poling et al [1987] and finally the water TABLE 2-352 from Perry and Green [1999] interpolating between the values provided in the tables. The system permeability is based on CZ permeability measurements under optimum

DOE Award #: DE FG26-06NT42824 Biomimetic Membrane for CO2 Capture from Flue Gas
Closeout Report 41
conditions. The pressure drop through the permeator was determined using Darcy equations and friction factors as developed in Cameron (1979). Pressure losses in other pieces of equipment were estimated by process engineering experience. Each stream number is characterized with sections to define the characteristics of the fluids in that stream: moles, volume %, partial pressure, enthalpy, mass & the physical section for temperature, total pressure, volume, % RH, energy usage, density, and viscosity. Other calculations are preformed outside the main grid. Table 5-1 shows the material balance that includes the sizing or each element. Task 5 Conclusion – The preliminary process flow sheets and the heat and material balance is a work in progress. Independent evaluation of these flow sheets support our estimate of a cost of energy for CO2 capture of about 13.5% for a PC power plant. Using the present permeation rates, the final CO2 concentration is 92%, at a pressure of 8.45 MPa. The parasitic load is 62 MW divided as follows: 7.9 MW for the blower, 2.8 MW for the HTF, 50.2 MW for compression and 1.3 MW for operation of the molecular sieve. All of this data was extracted from the tables above. Equipment Sizing and Equipment Cost Estimate Equipment Sizing Cost Basis
Compressors 50.2MW $15M $300/kw ID Fan 7.9 MW $3.4M $300/kw Permeator 13,440 m3 or 35.9 Mm2 $35.9M $1/m2 Enzyme 14,111 kg $0.7M $50/kg Mole Sieve 136 mt $0.46M $3.38/kg Mole Sieve Vessels 2 at 3.0 m dia and 15 m in height $0.46M same cost as Mole
Sieve HTF circ pumps 232,000 m3/h x 32 kPa "P or 2.8MW $0.83M $300/kw Total for identified equipment $55.8M (Y 2000 $ / costs) The above table notes the basis for each estimate to facilitate evaluation of system costs. We multiply by 3 to get an installed cost. The result is $167M (Y 2000 $ / costs) for a plant that processes 8,588 t/d of CO2 and captures 90% or 7,736 t/d of CO2. Operating Costs If we use $73.30/MWh of electricity then the capture cost in energy is $11.14/t. The cost table yielded a value for MEA of 8.56¢/kWh and an avoided cost of $44.05/t. In contrast, the CZ system cost is 7.33¢/kWh with an avoided cost of $28.30/t, a 36% savings.

DOE Award #: DE FG26-06NT42824 Biomimetic Membrane for CO2 Capture from Flue Gas Closeout Report 42
Table 5-1. Material Balance for EPRI Case 7C with Carbozyme Permeator for CO2 Recovery

DOE Award #: DE FG26-06NT42824 Biomimetic Membrane for CO2 Capture from Flue Gas Closeout Report 43

DOE Award #: DE FG26-06NT42824 Biomimetic Membrane for CO2 Capture from Flue Gas Closeout Report 44

DOE Award #: DE FG26-06NT42824 Biomimetic Membrane for CO2 Capture from Flue Gas Closeout Report 45

DOE Award #: DE FG26-06NT42824 Biomimetic Membrane for CO2 Capture from Flue Gas Closeout Report 46
Task 6 - Develop a Preliminary Commercialization Plan Task 6 Description A first set of objectives included: a) constructing a plan that targets specific task accomplishments and associated RD&E milestones, and matching these activities with the development of alliances with industrial partners (IPs) to prepare for progressively larger pilot and demonstration plant tests, b) developing an RD&E progression plan and building an understanding of relationship dynamics with candidate customers, IPs, and suppliers, c) evaluating competitors and potential IPs in terms of both CO2 and non-CO2 pollution control technologies.
A second objective was to select a pretreatment system available in the industry to combine with the CO2 treatment system. The object is to identify a process able to remove SOx, NOx, heavy metals, acids, and particulates from flue gas. A third objective is to propose alternatives to decrease the cost of the energy burden of the CO2 removal system in order to avoid derating of power plants including defining a process to mitigate the energy burden of the CO2 capture system. SOPO details are as follows:
• Task 6.1: Preliminary development of a commercialization milestone plan • Task 6.2: Define pretreatment system available for treatment of flue gas • Task 6.3: Define process to mitigate the energy burden of the CO2 capture system
Task 6.1 Results and Discussion RD&E Progression Plan: Successful commercialization of a permeator for CO2 capture requires strong consideration of the ecosystem dynamics between end customers, industrial partners, and suppliers. Critical insights included:
1. Candidate suppliers would enter into relationships for large-scale markets at an early developmental stage provided that: a) nominal amounts of material were supplied to win the business, b) partial funding was available for manufacturing ramp-up, and c) customer guarantees were provided for full-scale manufacturing.
2. Candidate IPs would enter under the same terms as the suppliers, provided that technology license relationships were available as scale-up demonstrations proved successful. The IPs would also monitor the development status of other appropriate technology suppliers, as well as the licensing activities of competing IPs, to determine when they are willing to solidify their relationships. Established companies in this domain tend to be risk adverse, and delay partnering and licensing decisions as long as possible.
3. Candidate customers, utilities in particular, want high levels of assurance before investing in new technology. They want to analyze and validate the slip stream field test data from multiple installations of varying size. Examination of the activities of Powerspan, Alstom Power, or Mitsubishi Heavy Industries, for example, support the approach and need for graduated size demonstrations.
Carbozyme has succeeded in developing relationships for Categories 1 and 2. For example, the Company succeeded in garnering the interest of Novozymes, the largest

DOE Award #: DE FG26-06NT42824 Biomimetic Membrane for CO2 Capture from Flue Gas Closeout Report 47
global supplier of enzymes, as a supplier and partner for the selection, development, and production scale-up of CA. Carbozyme has initiated discussion with a number of membrane and module suppliers, all capable of manufacturing and delivering integrated permeator systems on a commercial basis. In Category 3, the Company is being approached by a range of new Industrial Partners and Producers for licensing and early RFP quotations, respectively.
Competitor / Partner Evaluation: Combustion of hydrocarbon fuels, with particular emphasis on coal, results in the emission of a broad range of pollutants including NOx, SOx, mercury, particulates, and carbon dioxide (CO2). Air Pollution Control (APC) technologies for NOx, SOx, mercury, and particulates are readily available. Existing power plants have incorporated APC technologies to varying degrees based on a variety of demographic, regulatory, economic, and technological factors. New CO2 capture systems need to be developed, engineered, demonstrated, and installed to access the dilute, low pressure, streams from post-APC clean-up. Existing APC products are unlikely to satisfy the more stringent requirements for CO2 capture systems, independent of specific technology. For example, EPRI states a preferred SO2 concentration of 7 ppm for amines to reduce the formation of heat stable salts in the MEA solvent [EPRI 2007, page 54].
There are four distinct technical approaches to controlling NOx, SOx, mercury, and particulate emissions:
1. End-of-pipe Approach: Status – Widely installed, mature status though continued development is ongoing. Discrete pieces of equipment are concatenated, with each pollutant addressed individually. Inasmuch as there has been no interest in CO2 capture heretofore, a CO2 scrubber would be appended at the end of the existing train. Candidate CO2 capture technologies are discussed below.
2. Single Integrated Post-Combustion Scrubbing System: Status - Under development. A single integrated scrubbing system is used that also might remove some CO2. It is generally insufficient, in its own right, to achieve the required CO2 performance standard, thus necessitating additional CO2 scrubbing. One example is the WOW Energy system.
3. Fully Integrated End-of-Pipe System: Status – Some field tests completed, others planned. This approach adequately deals with all pollutants including CO2. An example is that provided by Powerspan. This approach is best used in Greenfield applications.
4. Integrated System with Boiler Changes: Status – Established technology. One example is that provided by Evergreen Energy.
A Preliminary Commercialization plan was assembled in two phases. In the first phase, the Rutgers University School of Business Interfunctional Team (RUSB) was hired to carry out a business analysis for entry into CO2 capture markets. In the second phase, an in-house competitive assessment was completed, including a SWOT analysis of both corporate and technological capabilities.

DOE Award #: DE FG26-06NT42824 Biomimetic Membrane for CO2 Capture from Flue Gas Closeout Report 48
The RUSB effort used Porter’s Five Forces model to provide an analytical and evaluation basis for the Carbozyme commercialization plan. The issues addressed included:
• Suppliers – enzyme and membranes • Competitors for CO2 Capture
• Legal Environment in the US and Canada • Pipeline companies
• Greenfield Power Plants and Retrofit Power Plants The major conclusions of the RUSB study were:
• Multiple suppliers have to be developed to limit the pricing power of an single supplier as is the situation at this early stage
• Other CO2 Capture solution providers present varying degrees of challenges, in areas such as IP, financial resources, early time-to-market advantage, etc.
• The legal environment in Canada is far more conducive to rapid implementation • Pipeline companies will be hard pressed to supply and install the amount needed
in a reasonable time • For Greenfield power plants, Canadian operations present financial and regulatory
benefits • For retrofit operations, several progressive utilities could be approached for
participation with certain industrial partners being preferred The RUSB study was completed in February 2006. Corporate level elements from Carbozyme’s in-house competitive analysis were integrated with the RUSB report to generate a summary view of the corporate capabilities for key CO2 Competitors. The conjoint analysis is presented in Table 6-1. Carbozyme used a SWOT-based (Strengths, Weaknesses, Opportunities and Threats) methodology to evaluate competitors, with an emphasis on core technology capabilities. These analyses provide valuable information across multiple dimensions:
• Core Technology: What are the physicochemical processes and mass transfer device(s) employed? Examples include chemical absorption, e.g., amines, ammonia, catalyzed and non-catalyzed bicarbonates. Examples of adsorption include MOFs, and zeolites. Several polymer and supported liquid membranes are also under development.
• Air Pollution Control: Does the competing technology address CO2 alone or does it have multi-pollutant capabilities?
• State of Technology Development: What is the near-term level of threat posed by the candidate competitor?
• Business Maturity: How established is the parent company, e.g. start-up or Fortune 50?

DOE Award #: DE FG26-06NT42824 Biomimetic Membrane for CO2 Capture from Flue Gas Closeout Report 49
• Complementary Value Proposition: What is the probability that a company could become an industrial partner or a licensee?
Various technologies and companies can be plotted on two or three-dimensional graphs to get a clearer idea of extent of competition or opportunity in a given domain. The most important dimension in the SWOT analysis is Core Technology, as this defines the boundaries for costs and effectiveness of a given CO2 Capture System. A portion of Carbozyme’s in-house SWOT analysis is shown in Table 6-2.
Task 6.2 Results and Discussion The plan is to develop a method of flue gas treatment, following the existing pollution control system (ESP, SCR, AC injection system for Hg control, and wet FGD) before entering the Carbozyme permeator. This pre-treatment system shall polish the flue gases from diverse feedstocks to remove acid aerosols and/or particulates that could interfere with operation of the permeator. Existing commercial systems will be evaluated to determine their potential to meet the clean-up need. Should an existing system not be available, a pre-treatment system shall be designed in collaboration with a pre-treatment vendor that had the closest capability in satisfying the need. The project plan for this activity will include:
• Development of a specification for a flue gas pre-treatment system • Procurement of a flue gas pre-treatment system, preferably off-the-shelf, that
meets the specifications • Installation of the pre-treatment system on a post-combustion test bed
• Validate the ability of the pre-treatment system to meet the desired specifications We examined the EPA evaluation of post-combustion control technologies under development [EPA 2005, Table 4-1, pages 137-138], added to this list other solutions that we had located and then re-organized the list by physicochemical process, types of pollutants managed, state of development, and ancillary process requirements. More than 35 candidates were identified in addition to existing and established clean-up processes. We are correlating these with acceptance criteria discussed above. However, for retrofit applications, we will ultimately accept whatever post-combustion clean-up equipment is in place at a given plant and make modifications accordingly. Tables 6-3 and 6-4 list post-combustion control technologies identified by the EPA in the above reference.

DOE Award #: DE FG26-06NT42824 Biomimetic Membrane for CO2 Capture from Flue Gas Closeout Report 50
Table 6-1: Corporate Analysis of Key CO2 Competitors Post-Combustion Solution Provider
Carbozyme CO2 Solutions Alstom Powerspan Mitsubishi Heavy Industries Aker Kvaerner
HQ Princeton Junction, NJ Quebec City, Quebec Levallois-Perret, France Portsmouth, NH Norway and Houston
Business Focus (Relevant)
Enzyme-based systems for CO 2
management and removal
Enzyme-based systems for CO2 management and
removal
Energy infrastructure: power generation, environmental controls
Develop and commercialize clean-energy technologies for
electric power plants
Global provider of industrial equipment and machinery
Global provider of engineering & construction services, technology
products, and integrated
solutions.
2006 Revenue $258,322 $259,916 !13.4BNot Available ($60M equity
capital since 1994)$23.7B 50.5B KON ($8.468B)
#1 Coal-fired power plants CO2 capture for power plants Coal-fired power plants Coal-fired power plantsCO2 capture for coal-fired power
plants
CO2 capture in NG-fired power
plants for EOR
#2 NG-fired power plants NG-fired power plants NG-fired power plants NG dehydration
#3 Cement plants NG sweetening
#1 CO2 separation technologies CO2 separation technologies Power plant integration Multi-pollutant control systems Power systemsLarge-scale processing
equipment
#2 Enzyme-based catalysis Enzyme production Emissions control equipment CO2 capture Environmental systems Gas conditioning
#3 Enzyme immobilization Enzyme immobilization Fertilizer production Large-scale construction Reclamation and regeneration
Trademark NameCarbozyme: Solutions forAffordable Clean Energy
CO2 Solution Chilled Ammonia CO2 ECO 2 KM CDR Process JustCatch
Chemistry Enzyme-based facilitation Enzyme-based facilitation Amine Chilled ammonia (carbonate) Aqua ammonia KS-1 solvent Amine and membrane contactor
CO 2 Platform
ComponentsPermeator
Bioreactor Absorber/ IER Stripper
Tower, absorber-stripper Tower, absorber-stripper Tower, absorber-regenerator Absorber-Stripper
Attributes 4-85°C HF Permeator30-50°C Packed Bead Bed
Abs / 50°C Stripper0-10°C Abs / 40°C Des 40°C Abs / 40°C Des
Uses low value heat to treat biomass for additonal fuel
Multipollutant Platform Under development with EERC N/AEnvironmental Control
Systems
Environmental Control
SystemsConvert NOx, SOx to fertilizer
# Patents 2 received; 10 pending 12 granted, 21 pending Several Many 13 granted, 5 pending Many Pending
Energy Burden
CO 2 Avoidance Cost
($/tonne CO 2)
CO2 Capture Concentration
CustomerWE Energies, Pleasant
Prairie, WisconsinFirst Energy R.E. Burger Plant,
Shadyside, OhioMatsushima, Japan Kårstø, Norway
Development Status Pre-Pilot / EERC Pre-Pilot Lab Development Univ of Texas Pilot Pilot Pilot demonstration Commercial
Scale 0.9 MW / 0.4 t/d at end 0.25 t/d .25 MW 5 MW1 MW (20t/d) slipstream from
50MW ECO demo unit10t/d 100kt/d
Partner(s) Siemens Power Generation Babcock & Wilcox EIG (exclusive license)Wheelabrator APC; BP
Alternative EnergyKEPCO, RITE, J-Power
Gassnova, Statoil, Shell, plus 10 others
Committed Delivery Date 2011 1H09 July-Nov 2007 Mid-2007 Early 2008 April 2007 (4000h test) 2009
#1Patents: Chemical facilitation, Mass
transfer designsPatent position re: uses of
CO23 year backlog
Diversified product line, ECO/ECO 2 technologies
Strong market position: vertically
integrated operations, wide distribution network, and efficient
prodction systems
Strong backlog
#2 Systems engineering Diversified services portfolio and geographic presenceIntegrated solutions (lower cost
and space required)Diversified services portfolio and
geographic presenceDiversified services portfolio and
geographic presence
#1 Insufficient capital for growth Insufficient capital for growth Negative cash flows Coal-fired plants only Weak revenue growthProjects depend on state
supported subsidies
#2 Systems engineering Unfunded benefit obligations Low ROI Low margins
Technology
Performance
Metrics
Core
Competencies
Sub-Criteria
Background
Target Markets
Criteria
Weaknesses
Strengths
First
Deployment
This information is Carbozyme Confidential and is available under NDA only

DOE Award #: DE FG26-06NT42824 Biomimetic Membrane for CO2 Capture from Flue Gas Closeout Report 51
Table 6-2: Carbozyme In-House SWOT Analysis
Core Technology Companies Corporate Focus CO 2 Capture Focus Strengths Weaknesses Opportunities Threats
CA-based HFCLM CO2 Capture
CA-based EDI CO2 Capture
Siemens Power
Generation :
Wheelabrato r APC
Siemens: power generation
systems and instrumentation
Wheelabrator: APC
Working with Carbozyme & with Powerspan
CO2 So lu tion CA-bead CO2 capture CA-bead CO2 capture - PSA
Babco ck & Wilcox
Power generation and
environmental equipment, and
associated services
Working with CO2 Solution
Carbonate - Bicarbonate RTI In tl.Independent research
organization
Dry solid sodium carbonate / Bicarbonate water
facilitated absorption, TSA desorption
Alsto m Power -
Enviro nmental
Systems Div / EPRI
Traditional SCR, FGD, ESP,
WESP, etc.; expanding into CO2Chilled ammonia
PowerspanIntegrated capture SOx, NOx, Hg,
particles,CO2Aqua ammonia
Alsto m Power /
Enviro nmental
Systems Div
Traditional SCR, FGD, ESP,
WESP, etc.; expanding into CO3Hindered amine
M itsub ish i Heavy
In dustries
Traditional SCR, FGD, ESP,
WESP, etc.; expanding into CO2Hindered amines; standartd towers; novel packings
HTC Purenerg y Oil & Gas Structured packing with new amine
Un iv. Akron University research Metal monolithic amine-grafted zeolites
MOF UOP Chemicals / Separations Micorporous metal organic frameworks (MOFs)
Membrane
M emb rane
Techno logy &
Research
Solid polymer separations
permselective membranes
pervaporation
Polymer membrane
Ionic liquid membrane Univ. Wyomin g University research Ionic liquid membranes via polyymerizable ILs
Ionic liquid Univ. No tre Dame University research Ionic liquids; via NETL ionic liquid membrane
Proprietary Evergreen En ergy
Vertically integrated, coal-based
platform to deliver combined
energy, environmental and
economic solutions
K-Fuel® process uses heat and pressure to physically
and chemically transform high moisture, low BTU
coals into a more energy efficient, lower emission fuel.
A co-benefit of the K-Fuel® process is the removal of
significant amounts of Hg and reductions in the
emissions of CO2, SO2,and NOx.
This information is Carbozyme Confidential and is available under NDA only
CA (Carbonate-Bicarbonate)
Ammonia
Amine
Carb ozyme CO2 capture - multiple methods

DOE Award #: DE FG26-06NT42824 Biomimetic Membrane for CO2 Capture from Flue Gas Closeout Report 52
Table 6-3: EPA Post-Combustion Technologies Part 1
Table 6-4: EPA Post-Combustion Technologies Part 2
Task 6.3: Results and Discussion It is impossible to avoid derating the output of a given power plant. The target is to minimize the parasitic energy burden or to introduce additional energy sources that can

DOE Award #: DE FG26-06NT42824 Biomimetic Membrane for CO2 Capture from Flue Gas Closeout Report 53
be managed with little additional capital and operating expense. Our considerations are focused fully on the HFCLM design we are developing.
The Sequestration program goals are 90% CO2 capture and less than 20% parasitic load. The pipeline pressure referenced in the DOE guidelines, using the EPRI case 7A, only required compression of the CO2 to 1200 psig. The data gathered to date suggest that the HFCLM permeator will have a parasitic burden of under 13%, and possibly less, to provide a CO2 stream of 95% at 1200 - 1800 psi at the utility plant gate (this is minimal to average pipeline pressure; higher pressure, e.g., 2400 psi, is used when gas is moved uphill). Elevating the pipeline pressure from 1200 psig to 2400 psig adds an additional cost of 1.3MW to our estimates.
The data also show that the operation of the HFCLM permeator design is robust. The system can be deliberately stressed by altering operating temperature, enabling spontaneously recovery once the operating temperature reaches the desired range. The permeator will accept a variety of isozyme catalysts and the isozyme will operate fully, each within its temperature range, but certainly to temperatures as high as 85°C. A key cost is that of drying and compression. The vacuum assisted desorption results in a wet stream. We have generated a series of novel ideas to increase the exit pressure and reduce the amount of water that exits with the permeate stream. These will contribute significantly to energy mitigation. Another key cost is additional pre-treatment of the flue gas. This includes acids, metals, and gummy particulates. Metals are easily addressed but one gummy particulate, i.e. SO3 condensed on dust/fines, is an issue as it blocks the gas permeation surface (mechanical). Clean up with strong alkali is costly & faces pressure drops, i.e. liquid in small bore, and may decrease membrane lifetime. Solutions are available to clean and filter the stream. Using data from CANMET, two CHX in series are able to remove all SOx and particulates.20 Note; assertions from EERC and SaskPower argue that all ranks of coal may not respond equally.
Task 6 Conclusion Carbozyme has initiated collaborative relationships with several technology suppliers and potential IPs for scale-up. In addition, the Company is being approached by a number of IPs regarding licensing agreements. Carbozyme completed a preliminary commercialization assessment, including a detailed SWOT analysis of competitors and their associated technologies.
To sustain reliable operation over long time-periods, the permeator requires additional post-combustion cleanup, of pre-treatment system(s), if internal to the Carbozyme permeator, to clean up the flue gas to specific control limits. We reviewed over 35 multi-pollutant control technologies and determined that adequate processes exist to meet the permeator feed requirements. Process engineering methods were developed to calculate and measure physical and chemical properties at more than 45 streams in the flow diagram model. The streams selected were determined to be those with the greatest impact on performance, providing the ability to optimize the overall design.

DOE Award #: DE FG26-06NT42824 Biomimetic Membrane for CO2 Capture from Flue Gas Closeout Report 54
PROJECT CONCLUSION These phase III experiments support continued development of the Carbozyme hollow fiber contained liquid membrane approach for capture of CO2 from fossil fuel combustion flue gas. Post-Combustion Particulate Cleanup – We accomplished the intent of the task by determining that improved post-combustion cleanup was the preferred strategy. Use of real flue gas streams from coal combustion will be necessary to provide a sufficient test of the impact of residual particulates present in coal combustion derived flue gas on the permeator. Our conclusion that efforts should be focused of improved pretreatment to limit particle and particulate loading to the CO2 capture process is consistent with those now emerging in the literature for a variety of CO2 capture methods. It is also the consistent with the experience of Natco (Cynara) using their high pressure, dense membrane process for CO2 separation from EOR CO2/oil mixtures. Water Condensation – We have accomplished key goals towards monitoring and controlling temperature distributions within the permeator itself and between the permeator and its surroundings. This was accomplished by incorporating heat transfer elements within the permeator, direct thermocouple measurements, development of an attendant heat transfer model and demonstration of near isothermal performance using a heat transfer fluid and delivery system. The results of this effort provide the information necessary for design of heat transfer elements larger permeators. The measurement systems and the analytical model are central to understanding the conditions that control possible condensation in the hollow fibers during operation that would decrease separation performance. Prevention of such an episode is critical to avoid downtime during field operations. Temperature Range of Enzymes – The data collected indicate that regardless of the operating temperature selected (in the range from 20 to 85°C), it will be possible to provide an isozyme that will work under those conditions. Therefore, other engineering optimization considerations can be used to determine the optimum operating temperature. Flue Gas Composition Acceptance Standards – Development of acceptance criteria requires classification of the mode of action and evaluation of the magnitude of the types of adverse effects that might follow from the presence of certain acids and mercury in the feed gas. In this report we examined the potential adverse effects of many different acids and other constituents of the feed flue gas towards developing the acceptance standards. The model simulation results and the data collected detail the effect of flue gas contaminants on the chemistry of the CLM. Our conclusions are that the flue gas contaminant of dominant concern for removal during pre-treatment is SOx. The acceptance concentration for SOx is calculated to be 7.08 ppm. Higher concentrations can be accepted at the cost of requiring additional efforts are made to maintain acceptable CLM chemistry. The Carbozyme permeator acceptance limit for SOx is in line with that for other CO2 capture technologies. We now know both the potential magnitude of the problems and have developed operational (physical and chemical) strategies to avoid

DOE Award #: DE FG26-06NT42824 Biomimetic Membrane for CO2 Capture from Flue Gas Closeout Report 55
(preferred) or ameliorate these effects. The preferred strategy is more careful and complete cleanup. Process Engineering Model –Preliminary process flow sheets and heat and material balances were developed to provide estimates of the parasitic energy, capital and operating costs for CO2 capture and compression. These are preliminary estimates which will be updated as more detailed design is carried out. Independent evaluation of these flow sheets support our estimate of a parasitic energy cost of approximately 13.5% for a PC power plant. This value and the construction and operating costs were developed based on the EPRI 7c, 462 MW, PC power plant. Using the present permeation rates, the final CO2 concentration is 92%, at a pressure of 8.45 MPa. The parasitic load is 62 MW divided as follows: 7.9 MW for the blower, 2.8 MW for the HTF, 50.2 MW for compression and 1.3 MW for operation of the molecular sieve. The total capital cost (installed) was calculated as $167M (Y 2000 $, equipment and labor costs) for the plant that processes 8,588 t/d of CO2 and captures 90% or 7,736 t/d of CO2. The operating costs for the Carbozyme process were calculated to be 7.33¢/kWh with an avoided cost of $28.30/t, a 36% savings from the MEA base case of 8.56¢/kWh and an avoided cost of $44.05/t when using $73.30/MWh of electricity then the capture cost in energy is $11.14/t. Preliminary Commercialization Plan – We have carried out two analyses of the market and the competition. The obvious conclusion is that there is a large and rapidly growing market and that even with existing and yet to be developed competition the opportunity is sufficiently large to support good business growth.

DOE Award #: DE FG26-06NT42824 Biomimetic Membrane for CO2 Capture from Flue Gas Closeout Report 56
REFERENCES Baird T.T., A. Waheed, T. Okuyama, W.S. Sly and Fierke C. A.; 1997. Catalysis and
Inhibition of Human Carbonic Anhydrase IV; Biochemistry, 36, 2669-2678, 1997. Blankenship G. 2006. Personal communication with George Blalankenship, Southern
Research Institute. Blencoe JG, Anovitz AM, Palmer DA, Beard JS, 2003. Carbonation of calcium silicates for
long-term CO2 sequestration. Proceedings of the Second National Conference on Carbon Sequestration (May 5–8, 2003), DOE NETL, Alexandria, VA,
Bond G.M; Medina MG; Stringer J; Simsek-Ege FA: 2001. CO2 Capture from Coal-Fired Utility Generation Plant Exhausts, and Sequestration by Biomimetic Route Based on Enzymatic Catalysis-Current Status. Presented at the 1st National Conference on Carbon Sequestration, Washington, DC, 2001; Paper Sa.5.
Cameron Hydraulic Data Book, 1979. Ingersoll-Rand Company, Woodcliff, N.J., 16 ed. Cowan RM, Ge J-J, Qin Y-J, McGregor ML, Trachtenberg MC: 2003. CO2 capture by
means of an enzyme-based reactor. Ann. NY Acad. Sci. 984:453-470. DOE 1998. Formation, Distribution, Impact, and Fate of Sulfur Trioxide in Utility Flue
Gas Streams Conference. http://www.netl.doe.gov/publications/proceedings/98/98fg/98fg_toc.html.
Ellis B. editor: 2000. CRC, A Polymers Database, EPA 2005 Multipollutant Emission Control Technology Options for Coal-fired Power
Plants EPA-600/R-05/034 Mar 2005, Table 4-1, pages 137-138, http://www.epa.gov/airmarkt/resource/docs/multipreport2005.pdf
EPRI 2000. Evaluation of Innovative Fossil Fuel Power Plants with CO2 Removal. Electric Power Research Institute. Document Number: 1000316
EPRI 2007. Update on Clean Coal Technologies and CO2 Capture & Storage, presented by EPRI to the Oregon PUC in Salem, OR on 27-Jun-07, page 54. www.puc.state.or.us/PUC/meetings/pmemos/2007/062707/OregonPUCCCTCCS62707.ppt
Fang Y, Nowak PJ, Hozalski RM, Cussler EL, and Semmens MJ: 2004. Condensation Studies in Gas Permeable Membranes, J. Memb. Sci., 231, 47-55.
http://www.polymersdatabase.com/. http://www.sterlitech.com/pdf/membrane_filter_chemical_compatibility.pdf. Innocenti A, Zimmerman S, Ferry JG, Scozzafava A, Supuran CT: 2004. Carbonic
anhydrase inhibitors. Inhibition of the zinc and cobalt c-class enzyme from the archaeon Methanosarcina thermophila with anions. Bioorg. Med. Chem. Lttr. 14:3327-3331.
Li KS, Liming K, Gregory G, and Bayless DJ. 2006 Acid Aerosol and Other Fine Particulate Control with Wet Laminar Electrostatic Precipitation Ohio University, Ohio Coal Research Center held at The American Filtration & Separations Society’s Fall conference - Oct 16-18 2006 Pittsburgh, PA
Maren, TH. 1960. A simplified micromethod for the determination of carbonic anhydrase and its inhibitors. J. Pharmacol. Exp. Ther., 130:26-29.

DOE Award #: DE FG26-06NT42824 Biomimetic Membrane for CO2 Capture from Flue Gas Closeout Report 57
McIlvaine R. 2006. “Power Plant Filtration Decisions” or Decision Tree. The McIlvaine Company - The American Filtration & Separations Society’s Fall conference - Oct 16-18 2006 Pittsburgh, PA
Membrana. 2006. Personal communication with P Patterson, Membrana, a division of PolyPore, Inc., Charlotte, NC.
Membrana: 2006. Membrana Liqui-Cel Membrane Contactors Cleaning Guidelines, http://www.liquicel.com/documents/Cleaning%20Guide%20%2008_2004.pdf.
Miller S. 2006. Personal communication with Stanley Miller, Energy and Environmental Research Center, South Bend, ND
Miller SJ and Laudal DL 1998 Observation of SO3 Behavior in a Pilot-Scale Combustor .in Formation, Distribution, Impact, and Fate of Sulfur Trioxide in Utility Flue Gas Streams Conference.
Perry RH, Green DW, 1999 Perry’s Chemical Engineers’ Handbook 7th Ed. McGraw-Hill.
Poling et al. 1987. – get reference from david Reid RC, Prausnitz JM, Poling BE. 1987 The properties of gases and liquids. 4th Ed.
McGraw-Hill. Salvador C. 2006. Personal communication with Carlos Salvador, CANMET. Sanders E. 2003. Large scale application of membranes for carbon dioxide removal. 14th
Annual Meeting of the North American Membrane Society (NAMS) May 17-21, 2003, Jackson Hole, WY.
Spang B. 2006. Excel add-in: water97_v13.xla, authored by Bernhard Spang, Hamburg, Germany, URL: http://www.cheresources.com/staff.shtml.
Sterilitech (2006) Chemical Compatibility Chart for General Laboratory Filtration Products,
Szalach PJ. 1998 Formation, Distribution, Impact, and Fate of Sulfur Trioxide in Utility Flue Gas Streams Conference - DOE Conference Proceedings - New York Electric & Gas Corporation's Utility Experience with Sulfur Trioxide and Sulfuric Acid Mist.
Trachtenberg MC, Bao L, Smith DA, Goldman SL, Wu X. 2005. Enzymatically Driven, Cost-Efficient, Capture of Flue Gas CO2. Fourth Annual Conference on Carbon Capture and Sequestration, Alexandria, VA.
Tu CK, Wynns GC and Silverman DN, 1981. Inhibition by Cupric ions of O18 Exchange Catalyzed by HCAII. J. Biol. Chem., 256, 9466-9470.
Tu CK, Wynns GC, and Silverman DN: 1981. Inhibition by cupric ions of 18O exchange catalyzed by human carbonic anhydrase II. Relation to the interaction between carbonic anhydrase and hemoglobin. J. Biol. Chem. 256: 9466-9470.
Wheelabrator 2006. Personal communication, Wheelabrator, Pittsburgh, PA. Zanganeh K CETC’S OXY-FUEL COMBUSTION PROGRAM. Oxy fuel_e.pdf www.cetc-ctec.gc.ca
Zanganeh K. 2006. Personal communication with K Zanganeh, CANMET.