co storage in geological formations · 2 storage in geological formations as hydrate ... – develo...
TRANSCRIPT
CO2 Storage in Geological Formations as Hydrate
Mehran Pooladi‐Darvish, Olga Zatsepina, Farhad Qanbari, Hamed Tabatabaie
Energy from clathrate hydrates –Energy from clathrate hydrates –Advances in gas production and CCS
IASS, PotsdamNovember 8 – 9, 2011
1

Background (Hydrate Research)g ( y )• University of Calgary; since 1998
– Development of two numerical simulators, forp• Improved understanding• Answering some research questions (e.g. upscaling, ice formation, etc)
– Development of reservoir engineering models• Material balance• Welltesting
• Fekete Associates Inc.– Used STARS– Consulting projects (e.g., Mt. Elbert MDT modeling & MMS
recovery estimate in GoM)A id di l d CO i if– Acid gas disposal and CO2 storage in aquifers
• University and Fekete– CO2 storage in a depleted gas reservoir
2

Motivation100
onStructural, Stratigraphic & Hydrodynamic Trapping
ontr
ibut
io
Residual CO2
Trapping
rapp
ing
C Trapping
S l bilit
% T
r Solubility Trapping
Mineral TrappingAccelerate the processes
01 10 100 1000 10000
Time Since Cessation of Injection (Years)
TrappingpStore as Hydrate
Time Since Cessation of Injection (Years)
Fekete Technical Video’s 10 and 15 3

1‐ STORAGE IN DEPLETED GAS POOLS1 STORAGE IN DEPLETED GAS POOLS
4

Possibilities in AlbertaPossibilities in Alberta
• Wright et al. 2008Wright et al. 2008– 62 depleted gas pools
– Capacity for many years of oil sands emissions
• “Considerable work remains …”
5
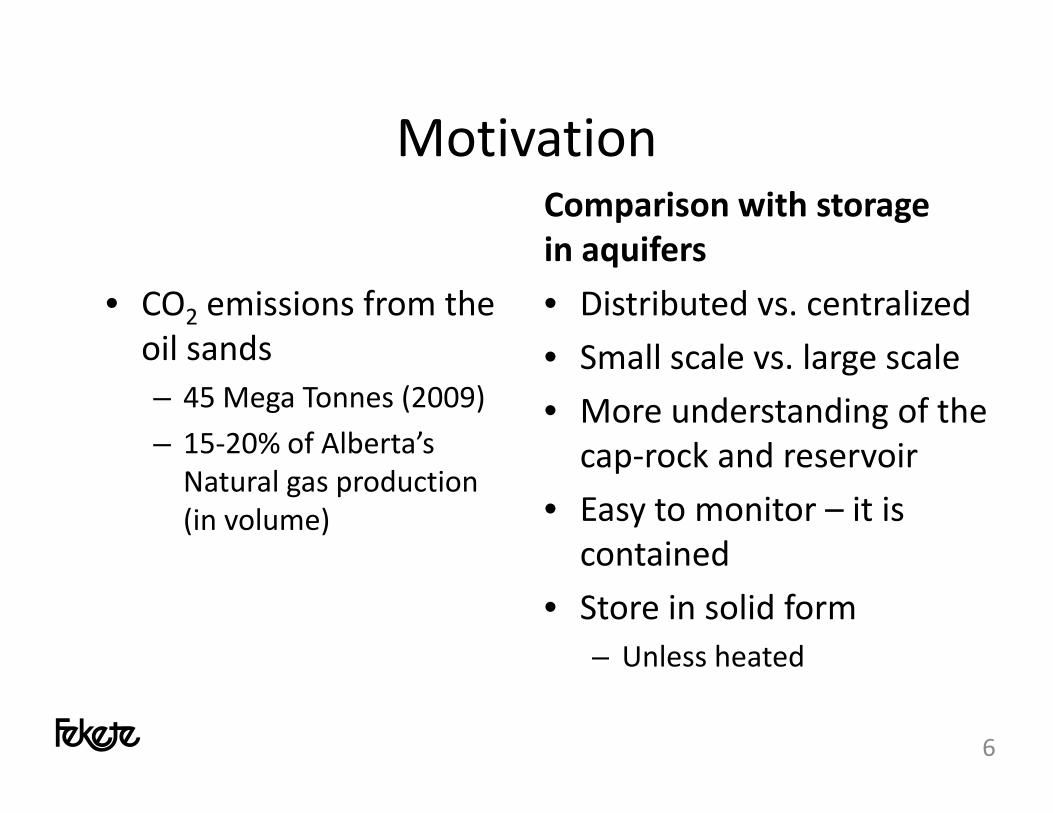
MotivationMotivationComparison with storage in aquifers
• CO2 emissions from the oil sands
in aquifers
• Distributed vs. centralized
• Small scale vs large scaleoil sands– 45 Mega Tonnes (2009)
– 15‐20% of Alberta’s
• Small scale vs. large scale
• More understanding of the cap‐rock and reservoir
Natural gas production (in volume)
cap‐rock and reservoir
• Easy to monitor – it is containedcontained
• Store in solid form – Unless heatedUnless heated
6

Effect of Gas Composition
• CO2 : Pressure (T: constant)• Heat of formation: 60 KJ/mole needs to be dissipated 7

Modeling Studies (with STARS of CMG)Modeling Studies (with STARS of CMG)
• Formulation– General heat transfer
• Mixing Vessel – Isothermal
• Mixing Vessel – Non‐– Multi‐phase flow
– Simplified thermodynamics
– Reaction
Mixing Vessel Nonisothermal
• Reservoir modeling– Reaction
• Assumptions– No geomechanics
– Homogeneous properties
– Fast kinetics (i.e. equilibrium)
8
MIXING VESSEL ‐ ISOTHERMALMIXING VESSEL ISOTHERMAL
9

Mixing Vessel ‐ isothermal• Pressure: 2 MPa
• Temperature: 5 °C
P it 30%
• Swi: 25%
• Final P: 4 MPa
I j t t t t t• Porosity: 30%
14000
e
• Inject at constant rate
0 6
0.83000
and
hydr
ate
Pa)
P
0.4
0.6
2000
s of
wat
er a
ress
ure
(kP
ShLimiting factor: Water
0.21000
Satu
ratio
nsPr Sw
000 5 10 15 20 25
S
Time (days) 10
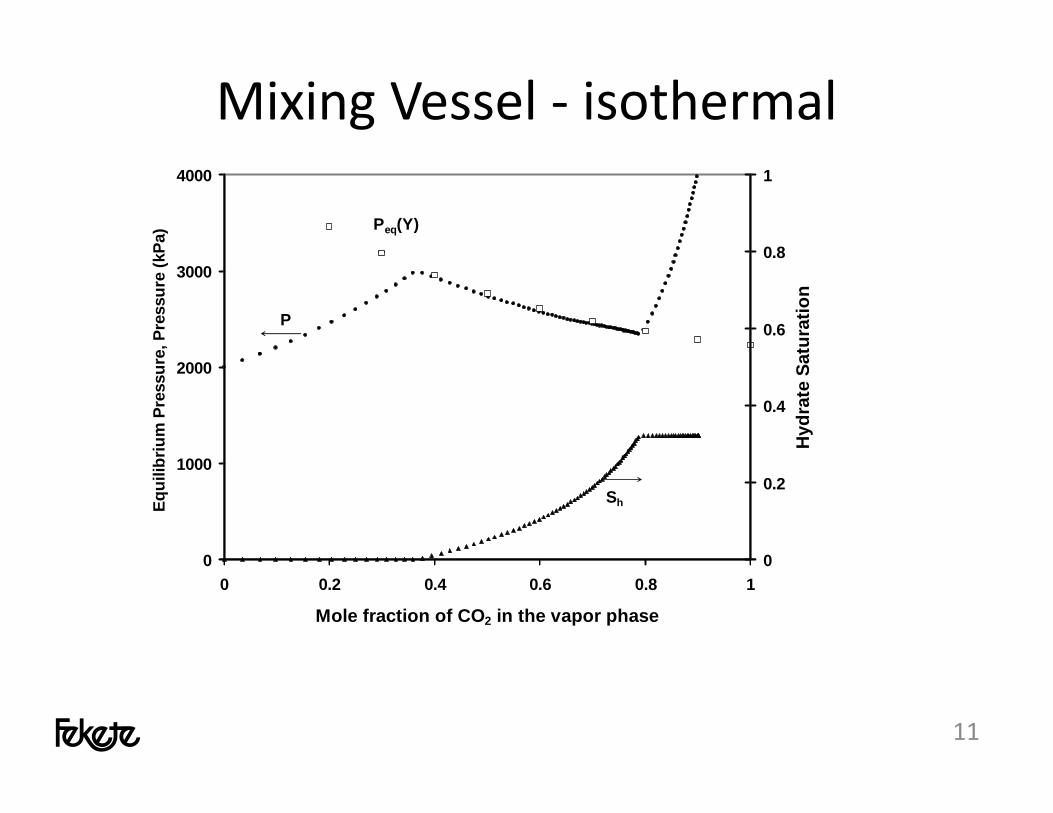
Mixing Vessel ‐ isothermal4000
Pa)
0 8
1
Peq(Y)
3000
e, P
ress
ure
(k
0.6
0.8
atur
atio
n
P
2000
rium
Pre
ssur
e
0.4
Hyd
rate
Sa
0
1000
Equi
lib
0
0.2Sh
00 0.2 0.4 0.6 0.8 1
Mole fraction of CO2 in the vapor phase
0
11

MIXING VESSEL – NON‐ISOTHERMALMIXING VESSEL NON ISOTHERMAL
12

Mixing Vessel – Non‐isothermal
8
10
e (
C)
0.8
1
6
, Tem
pera
ture
0.6
Satu
ratio
n
T
2
4
essu
re (M
Pa),
0.2
0.4
Hyd
rate
P
00 2 4 6 8 10 12 14
Pre
0
Sh
Time (days)
• T and p increase• Slope of pressure increase: declinesSlope of pressure increase: declines• Final hydrate saturation: 6%
13

Mixing Vessel – Non‐isothermal
5000
6000Pa
)
0 8
1
4000
, Pre
ssur
e (k
P
0.6
0.8
tura
tion
2000
3000
um P
ress
ure,
0.4
Hyd
rate
satPeq. (T) at 40% CO2
P
1000Equi
libriu
0.2
H
Peq. (T) at 70% CO2
Sh
02 4 6 8 10
Temperature (C)
0
• Limiting factor: Heat capacity14

RESERVOIR MODELINGRESERVOIR MODELING
15

Base Case
qinj= 0.1 106 m3/dayqinj 0.1 10 m /day
Tinj = 10 C 300 m
5 = 30%K = 500 mD
Sw = 0.25pi = 500 kPa Ti = 5 C
5 m Sg = 0.75
OGIP = 1 7106 m3OGIP 1.710 m
p = 4 MPa then shut-inpmax= 4 MPa, then shut-in
16

Results
10 1 4500 1Average T/p/SH T/p on Phase diagram
8
10
ratu
re (
C)
0.8
1
tura
tion
3500
500
ure
(kPa
)
0.8
tion
4
6
re (M
Pa),
Tem
pe
0.4
0.6
e H
ydra
te S
atT
2500
ssur
e, P
ress
u
0.4
0.6
ydra
te S
atur
at
Peq(T)
0
2
Av.
Pre
ssu
0
0.2 Ave
rag
PSh
500
1500
Eq. P
re0
0.2
Hy
P
Sh
00 50 100 150 200 250
Time (days)
0 5004 5 6 7 8 9 10
Temperature (C)
0
17

ResultsResults
Temperature Hydrate Saturation10 0.18
8
9
(C
)
180 days
240 days
0.12
0.15
ratio
n7
8
Tem
pera
ture
120 days
y
0.06
0.09
Hyd
rate
sat
ur180 days
240 days
5
6
0 50 100 150 200 250 300
Radial distance (m)
60 days0
0.03
0 50 100 150 200 250 300
Radial distance (m)
60 days
120 days
Radial distance (m) Radial distance (m)
18
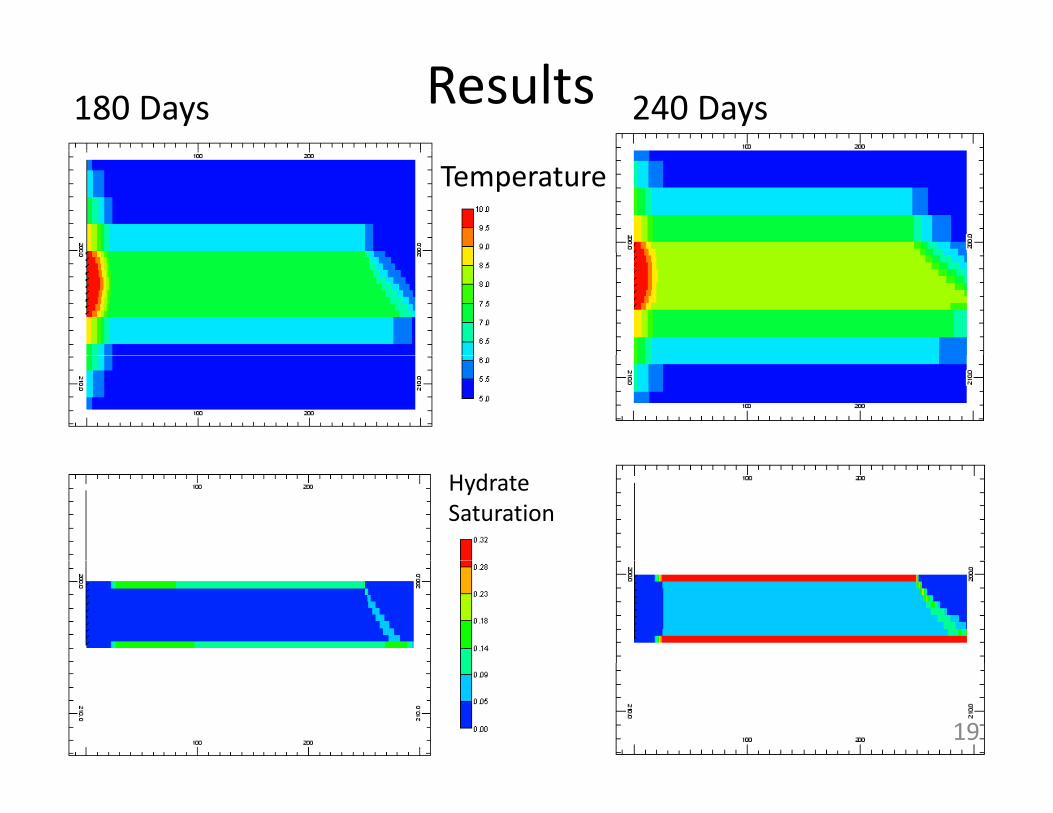
Results180 Days 240 Days
Temperature
HydrateSaturation
19

What happens after shut‐in?What happens after shut in?5 1
4
MPa
) 0.8
atio
n
Pressure
3
ress
ure
(M
0.6
ate
Satu
ra
1
2
vera
ge P
r
0 2
0.4
Av.
Hyd
ra
0
1A
0
0.2 A
Sh
5 6 7 8 9 10Average Temperature (C)
20
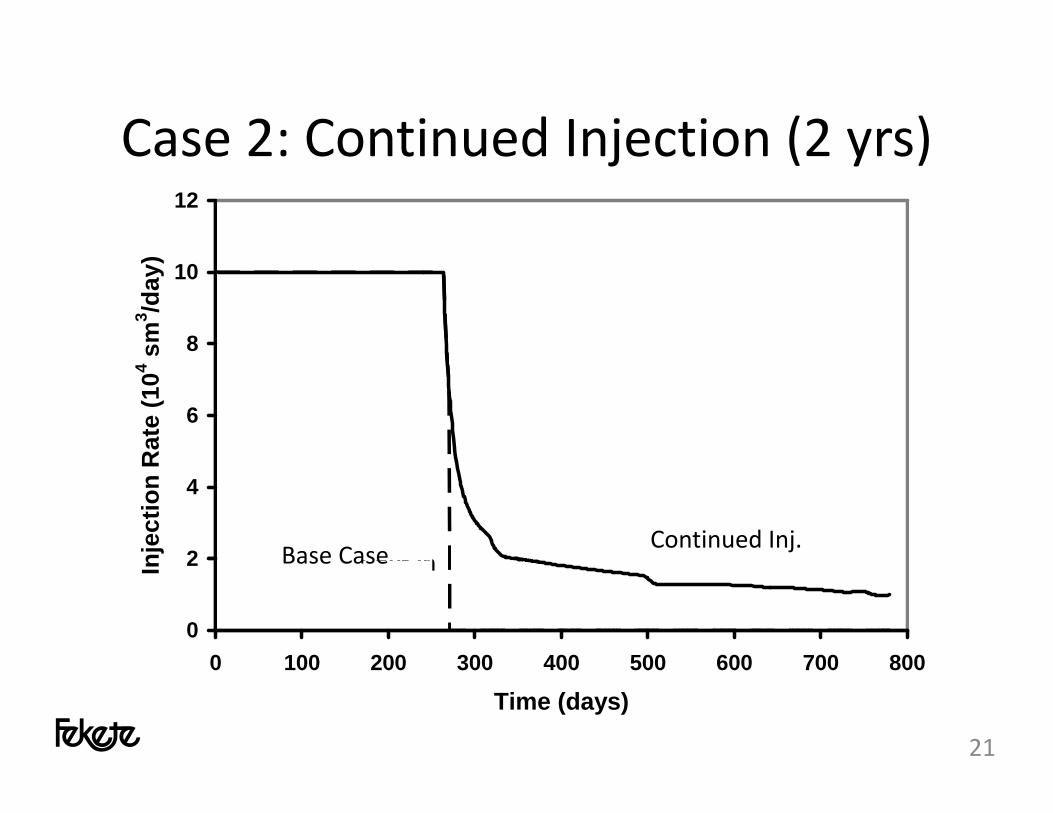
Case 2: Continued Injection (2 yrs)Case 2: Continued Injection (2 yrs)12
8
10
sm3 /d
ay)
6
Rat
e (1
04 s
2
4
njec
tion
R
Base CaseShut inContinued Inj.
Base Case
0
2
0 100 200 300 400 500 600 700 800
In Shut-inBase Case
0 100 200 300 400 500 600 700 800
Time (days)
21

ResultsResults10
C)
8
Tem
p. (C
Temperature
4
6
Pa),
Av.
BCContinued Inj.
2
4
Pres
. (M
Pressure SHUT-IN
j
Base Case
0
2
Av.
0 125 250 375 500 625 750Time (days) 22

Results20
m3 )
BC
Results
Continued Inj.OGIP = 1.7106 m3
16
te (1
06 sm BCContinued Inj.
8
12
n hy
drat SHUT-INBase Case
4
8
sto
red
i
0
4
CO
2
0 125 250 375 500 625 750Time (days)
23
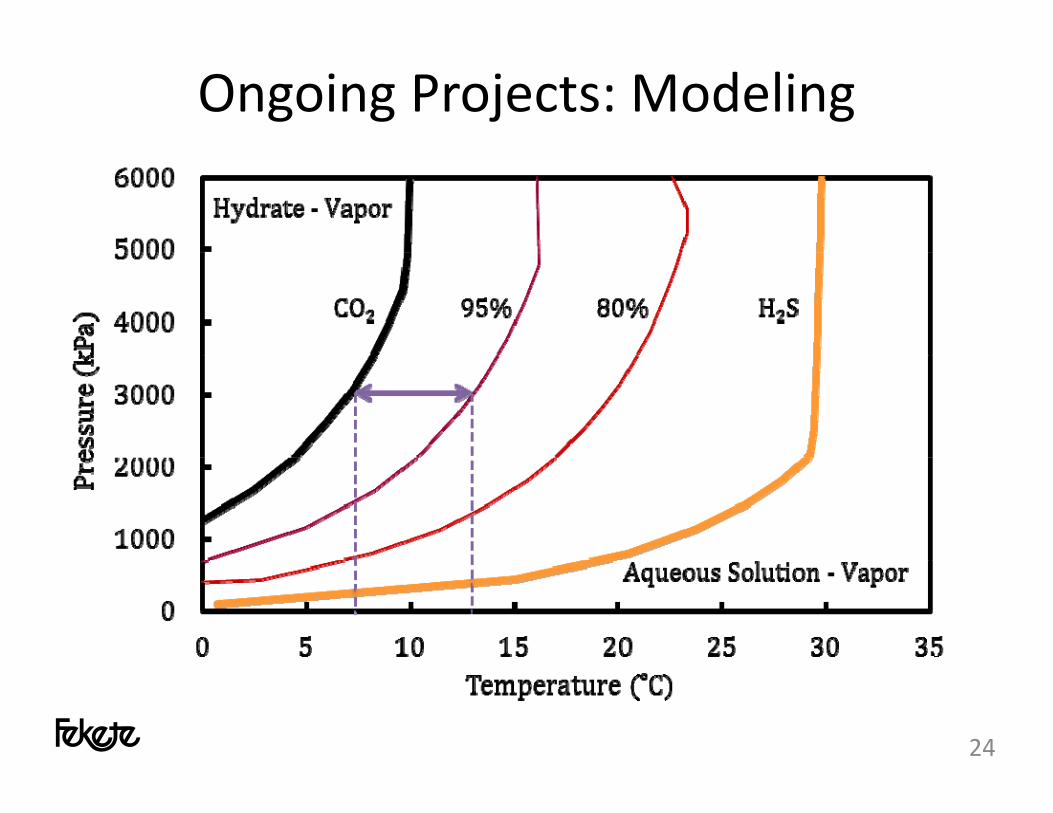
Ongoing Projects: Modeling
24

2‐STORAGE BELOW OCEAN FLOOR2 STORAGE BELOW OCEAN FLOOR
26

Density kg/m3
Density of CO2 vs. Water – Negative Buoyancy Zone
0
500
0 200 400 600 800 1000Density kg/m3
500
1000
15001500
2000
2500h m
ρCO2 ρwater2500
3000
3500
Depth
ρCO2 ρwater
3500
4000
4500 Density of carbon dioxide NBZ
27
4500
5000
Density of waterρCO2 ρwater
ρCO2 ρwater
(Schrag et al. 2006)

Hydrate Formation Zone (HFZ)Hydrate Formation Zone (HFZ)
28

Interaction between NBZ and HFZ
29

HFZ and NBZ –h dThe Cascadia Accretionary Prism
30

Common Propertiesqinj= 1 Mtonne/yr
Injection time: 50 Years80 km
KH = 100 mDSw = 100%KV = 20 mD
= 15%
KV 20 mD
• Ocean depths• Ocean depths– 600 m (shallow),
2800 m (deep),
– 2800 m (deep)
• Injection depth: 800 m below ocean floor31

Shallow Injection @ 600 m (50 years)Shallow Injection @ 600 m (50 years)CO2 Saturation No hydrate forms
32

Shallow Injection @ 600 m (1000 years)Shallow Injection @ 600 m (1000 years)CO2 Saturation
33

Deep Injection @ 2800 m (50 years)Deep Injection @ 2800 m (50 years)
CO2 Saturation Hydrate Saturation
34

Deep Injection @ 2800 m (1000 years)Deep Injection @ 2800 m (1000 years)
CO2 Saturation Hydrate Saturation
35CO2 can move past the initial NBZ and HFZ boundaries

Summary & ConclusionsSummary & Conclusions
• Modeling studies of CO2 storage as hydrateModeling studies of CO2 storage as hydrate have been carried out
• Two geological settings have been consideredTwo geological settings have been considered– Depleted gas pools (of low temperature)– Beneath the oceanfloor
• These could provide attractive alternatives• For CO2 storage in depleted gas reservoirsFor CO2 storage in depleted gas reservoirs
– Field‐scale modeling is under way– Addition of H2S is being considered
36
Addition of H2S is being considered
AcknowledgmentsAcknowledgments
• Dr. Dennis Coombe of CMG, and ,• Dr. Tadahiro Okazawa of Imperial Oil• Former students: Huifang Hong, Dr. Shahab Gerami,
D A i Sh hb iDr. Amir Shahbazi• NSERC, Imperial Oil, NRCan, CMG for funding
37
ReferencesReferences• Qanbari, F., Pooladi‐Darvish, M., Tabatabaie, S.H., and Gerami, S.:
“Disposal as hydrate in ocean sediments” accepted for publication in the“Disposal as hydrate in ocean sediments”; accepted for publication in the Journal of Natural Gas Science and Engineering; (October 21, 2011)
• K.Z. House, D.P. Schrag, C.F. Harvey, K.S. Lackner, Permanent Carbon Dioxide Storage in Deep‐Sea Sediments, Applied Physical Sciences 103, 33 ( )(2006) 12291‐12295
• Wright, J., Côté, M., and Dallimore, S. Overview of regional opportunities for geological sequestration of CO2 as gas hydrate in Canada. Proc. 6thIntern. Conf. Gas Hydrates. (2008). Vancouver, Canadaf y ( ) ,
• Zatsepina, O., and Pooladi‐Darvish, M.: “CO2 Storage as Hydrate in Depleted Gas Reservoirs" SPE‐137313 accepted for publication in SPE Reservoir Evaluation & Engineering‐Reservoir Engineering (August 26, 2011)2011)
• Zatsepina, O.Y., and Pooladi‐Darvish, M.: “Storage of CO2 Hydrate in Shallow Gas Reservoirs – Pre‐ and Post‐Injection Periods”, in Journal of Greenhouse Gases: Science and Technology, (May 2011) Vol. 1, pp.223‐236
38
