co-operatives in modern times
TRANSCRIPT

Wiebe Draijer 5 July 2018
Co-operatives in Modern Times Some contemplations

Content
1. Global snapshot and prospects
2. European co-operative banks
3. Rabobank
2

Some astonishing facts and figures……
• Over 1.2 billion people are members of a co-operative
• Co-operatives provide employment for or supports the
livelihood of 280 million people globally
• UN estimates that there are 2.5 million co-operatives around
the world
• About 10% of working population works in or through co-
operatives
• There are three times as many member owners of co-
operatives as individual shareholders worldwide
• In 2016 the largest 300 coops had a combined annual turnover
of over US$ 2.2 trillion (equals GDP of France)
• Over 1,400 coops have a turnover of US$ 100m+
3
0%
10%
20%
30%
40%
50%
60%
70%
80%
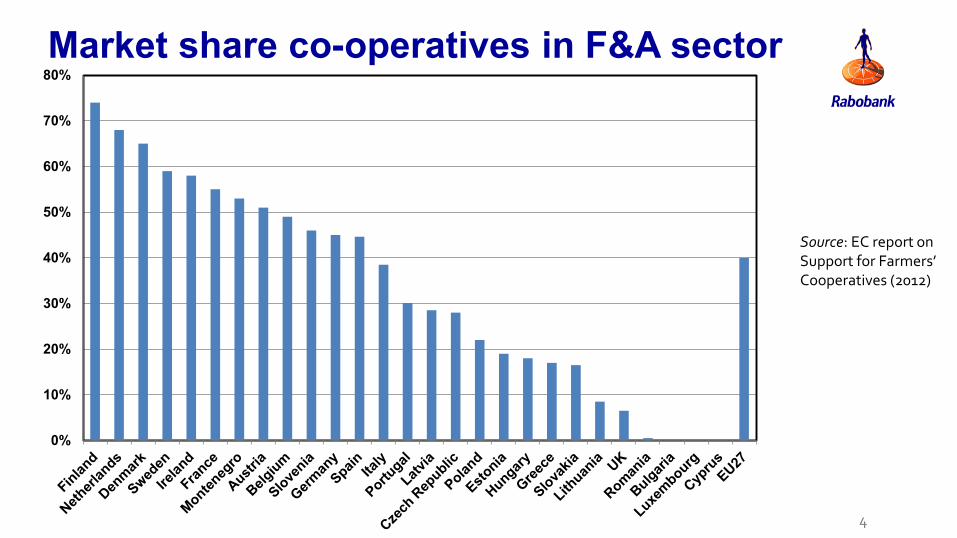
Market share co-operatives in F&A sector
4
Source: EC report on Support for Farmers’ Cooperatives (2012)

0
500
1,000
1,500
2,000
2,500
3,000
3,500
4,000
4,500
0
500
1,000
1,500
2,000
2,500
3,000
3,500
4,000
4,500
1949 1953 1957 1961 1965 1969 1973 1977 1981 1985 1989 1993 1997 2001 2005 2009 2013
Total Agriculture Local Rabobanks and mutual insurers Energy
Evolution of active co-operatives in the Netherlands
Source: own calculations based on
data of Statistics Bureau and
National Co-operative Council
5

0
500
1,000
1,500
2,000
2,500
3,000
3,500
4,000
4,500
0
500
1,000
1,500
2,000
2,500
3,000
3,500
4,000
4,500
1949 1953 1957 1961 1965 1969 1973 1977 1981 1985 1989 1993 1997 2001 2005 2009 2013
Total Agriculture Local Rabobanks and mutual insurers Energy
Evolution of active co-operatives in the Netherlands
Source: own calculations based on
data of Statistics Bureau and
National Co-operative Council
6

Important reasons for increasing global popularity of co-operative organisational form
• Observed resilience of coops during and after Great
Financial Crisis
• High (youth) unemployment and new forms of flexible
employment (e.g. self-employed workers)
• Withdrawing government (in combination with ageing
population in EU)
• Policy support (e.g. ‘Social Economy’ in EU)
• Betrayed trust in institutions, professionals, market
forces, scale increase, Europe,…..
• People’s initiatives are taken away by the market,
government and professionals (i.e. ‘democratic deficit’)
• Imminent or existing exclusion or ‘unmet’ needs in the
broadest sense of the word
7
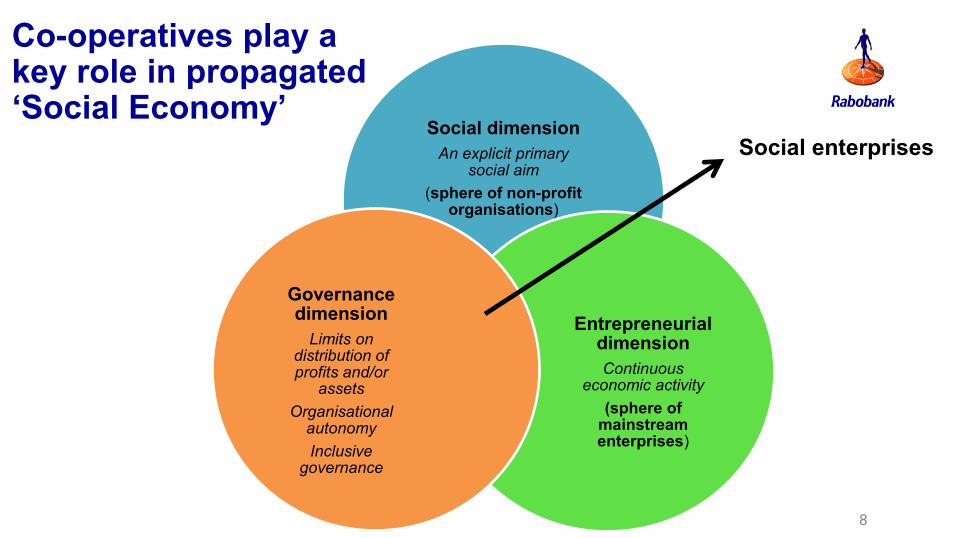
Social dimension
An explicit primary social aim
(sphere of non-profit organisations)
Entrepreneurial dimension
Continuous economic activity
(sphere of mainstream enterprises)
Governance dimension
Limits on distribution of profits and/or
assets
Organisational autonomy
Inclusive governance
Co-operatives play a key role in propagated ‘Social Economy’
Social enterprises
8

Hugh potential for all types of co-operatives
Source: Global Findex database (2014)
9
Part II: European co-operative banking groups
10 10
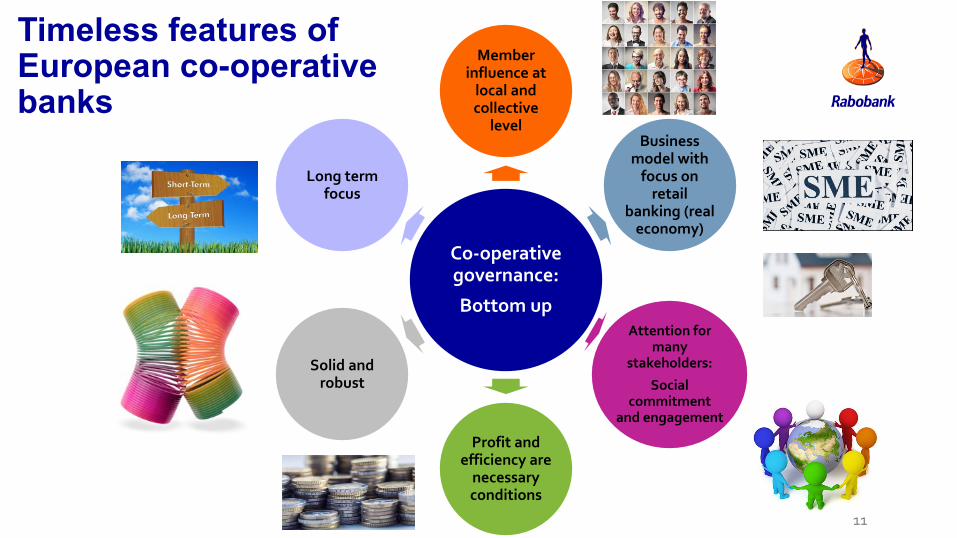
Timeless features of European co-operative banks
Co-operative governance:
Bottom up
Member influence at
local and collective
level Business
model with focus on
retail banking (real
economy)
Attention for many
stakeholders:
Social commitment
and engagement
Profit and efficiency are
necessary conditions
Solid and robust
Long term focus
11

12 12
Communalities and differences between co-operative banks

Members and member-population ratio
0
3
6
9
12
15
18
21
24
27
0
10,000,000
20,000,000
30,000,000
40,000,000
50,000,000
60,000,000
70,000,000
80,000,000
90,000,000
1996 1998 2000 2002 2004 2006 2008 2010 2012 2014 2016
Ra
tio
Nu
mb
er
Members (left scale) Member to population ratio 13

Loan and deposit growth (2011 = 100)
14
90.0
95.0
100.0
105.0
110.0
115.0
120.0
90.0
95.0
100.0
105.0
110.0
115.0
120.0
2011 2012 2013 2014 2015 2016
Ind
ex
Ind
ex
Loans co-operative banks Loans entire banking sector
Deposits co-operative banks Deposits entire banking sector

Co-operative banks: at the service of their members and society
• Long and rich history
• Long-term orientation as opposed to short-termism
• Frequent adaptations of governance and strategy in response to or
in anticipation of many changes in society, technology, etcetera.
• Opportunities
– Social goals and agenda (sustainable development of local territories)
– Participation in local networks and communities
– Commitment and dedication to serve the real economy (with focus on
private households, SMEs and agricultural sector)
• Challenges
– Digitalisation and virtualisation
– Constant adjustments in regulatory and supervisory framework
– A new risk: compliance cost risk
• Contribute to diversity – and hence systemic stability – in banking
15
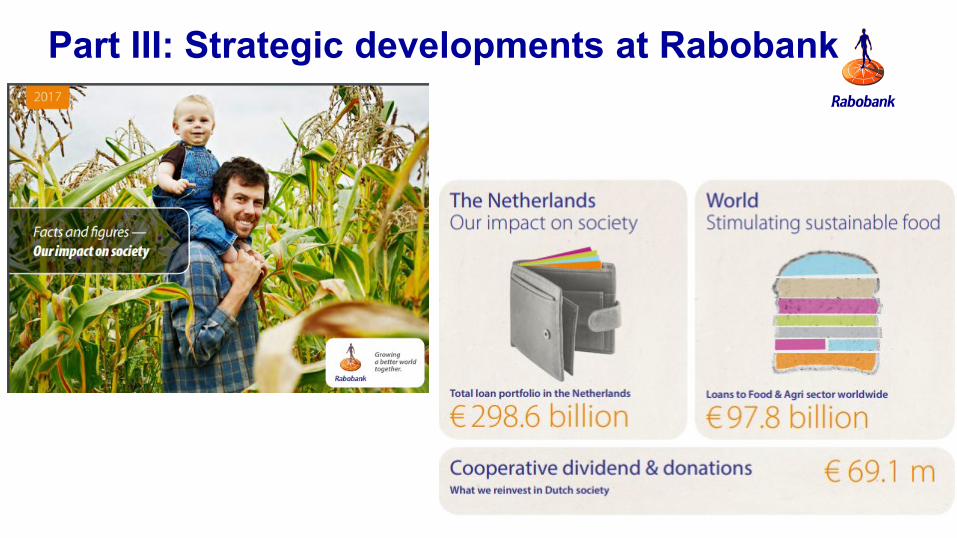
Part III: Strategic developments at Rabobank

Profile of Rabobank
• Simplified, focused top structure
• Dedicated Fintech & Development team
• Centralised Portfolio Management unit
• Shared back-offices
• Integration of FGH Bank into Rabobank; non-core CRE portfolio managed separately
Organisational changes support our strategy
A+/Stable/A-1
Aa2/Negative/P-1
AA-/Stable/F1+
AA/Stable/R-1(high)
Ratings unchanged and at a high level in 2017
One Rabobank as the basis
Market shares 2017 2016
Mortgages 22% 21%
Savings 34% 34%
Trade, Industry & Services (TIS) 39% 41%
Food & Agri 86% 84%
Commanding domestic market shares
New governance: • One legal entity: local Rabobanks + central organisation • One banking license • One balance sheet
New governance: • One legal entity: local Rabobanks + central organisation • One banking license • One balance sheet
Active in 40 countries 8.5 million customers worldwide
7.3 million local Rabobank customers 1.9 million members
Specialised Rabobank subsidiaries
17
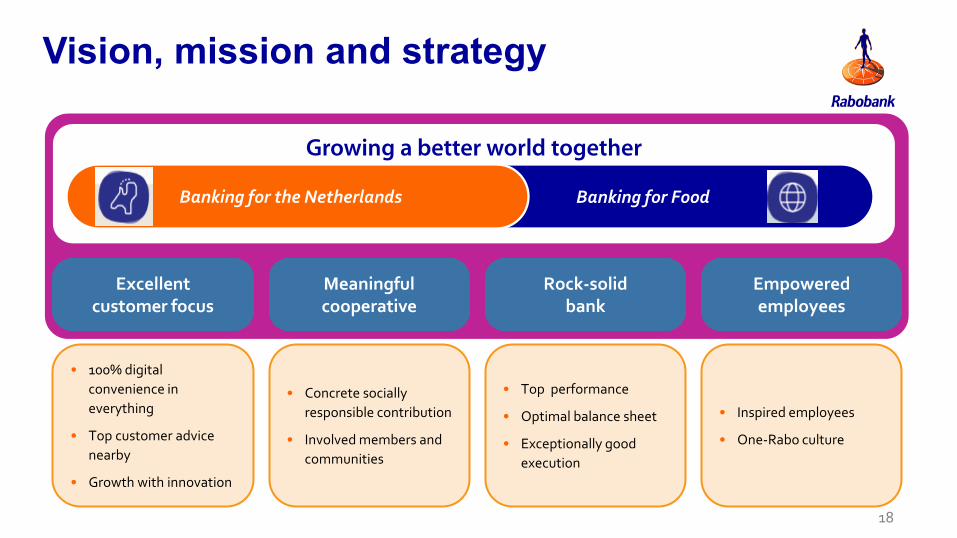
Vision, mission and strategy
Growing a better world together
Excellent customer focus
Excellent customer focus
• Top performance
• Optimal balance sheet
• Exceptionally good
execution
• Concrete socially
responsible contribution
• Involved members and
communities
• Inspired employees
• One-Rabo culture
• 100% digital
convenience in
everything
• Top customer advice
nearby
• Growth with innovation
Banking for Food Banking for the Netherlands
Meaningful cooperative Meaningful cooperative
Rock-solid bank
Rock-solid bank
Empowered employees
Empowered employees
18

Main outcomes of governance revision
Better cooperative
Enhanced member influence on Rabobank's strategic course and identity
Increased transparency in roles and responsibilities in organisation
Increased distinctiveness, enhanced visibility and participation in local communities
Streamlined consultation structure
Better bank
Annual accounts and P&L reflect solidity of Rabobank Group
Full and prompt compliance with new regulatory, supervisory, and resolution requirements in the future
More efficient and effective internal processes due to abolition of delegated supervision
Improved cost efficiency
19

± 100
Elect
Supervise local bank
Employer’s role
Chairman is member
of GMC • Approval of
decisions by MB
• Amendment of
statutes Local
authorisations and
responsibilities
Appoint
Bank Managing Board ultimately responsible for local banks and all subsidiaries
Members’
Department A
Members’
Council A
Local
Supervisory
Body A
1.9 million members
Members’
Department B
Members’
Council B
Local
Supervisory
Body B
Members’
Department C
Members’
Council C
Local
Supervisory
Body C
Members’
Department D
Members’
Council D
Local
Supervisory
Body D
Accountable
Local bank A Local bank B Local bank C Local bank D
Appoint and
supervise
MB
Supervisory
Board
Ac
co
un
tab
le
Ap
po
int
General
Members’
Council
Main internal governance relationships
20

Banking for Food Today, Rabobank has large food & agriculture portfolios all over the world
US & Can
€ 20,1 bln.
S. Am
€ 7,8 bln.
Europe
€ 11,2 bln.
NL & Afr.
€ 35,6 bln.
Asia
€ 5,1 bln.
Aus & NZ
€ 18,2 bln.
North
Americas
36%
11%
Netherlands
21%
8%
5%
19% Asia
Europe
South
Americas
Aus. & NZ
21

Thank you for your attention