co-evolution of three mega-trends nurtures un-captured gdp ... · contrasting disruptive innovation...
TRANSCRIPT

Informaatioteknologian tiedekunnan julkaisujaNo. 29/2016
Chihiro Watanabe, Naveed Kashif, Pekka Neittaanmäki
Co-evolution of Three Mega-trends Nurtures Un-captured GDP – Uber’s Ride-sharing Revolution

ISBN 978-951-39-6929-5 (verkkoj.)ISSN 2323-5004
Informaatioteknologian tiedekunnan julkaisujaNo. 29/2016

Co-evolution of Three Mega-trends Nurtures Un-cap-tured GDP – Uber’s Ride-sharing Revolution
Chihiro Watanabe, Kashif Naveed, Pekka Neittaanmäki
Abstract
Uber used a disruptive business model driven by digital technology to trigger a ride-sharing revolution. The institution-al sources of the company’s platform ecosystem architecture were analyzed to explain this revolutionary change. Both an empirical analysis of a co-existing development trajectory with taxis and institutional enablers that helped to create Uber’s platform ecosystem were analyzed. The analysis identified a correspondence with the “two-faced” nature of ICT that nurtures uncaptured GDP. This two-faced nature of ICT can be attributed to a virtuous cycle of decline in prices and an increase in the number of trips. We show that this cycle can be attributed to a self-propagating function that plays a vital role in the spinoff from traditional co-evolution to new co-evolution. Furthermore, we use the three mega-trends of ICT advancement, para-digm change and a shift in people’s preferences to explain the secret of Uber’s system success. All these noteworthy elements seem essential to a well-functioning platform ecosystem architecture, not only in transportation but also for other business institutions.
Keywords: Ride-sharing revolution, ICT-driven disruptive business model, Uber’s system success, Two-faced nature of ICT, Un-captured GDP
The research leading to these results has received funding from the Strategic Research Council at the Academy of Finland under grant agreement no: 293446 – Platform Value Now: Value capturing in the fast emerging platform ecosystems.
Platform Value Now will focus on understanding the fast emerging platform ecosystems, their value creation dynamics and requirements of the supportive institutional environment. We will analyze ecosystems with systems tools and develop new methods for platform-centric ecosystems management. Data collection is based on active scanning of global technology and platform ecosystems and fast solution oriented case experiments with Finnish corporations and policy planners. The aim of the project is to operationalize the collected understanding into a Platform Profile framework that will enable more efficient method and tool development for ecosystem management.

2
1. IntroductionThe dramatic advancement of information and communication technology (ICT) in recent
years has brought about a new reality in which information, people, organizations, logistics,and finance are constantly connected on a global level and mutually influence one another.This constant connection is starting to produce a hitherto non-existent synergy without beingbound to the confines of existing industrial structure and technology fields. Therefore, thesynergy allows the creation of new businesses and markets, and is also starting to change howwe work and live (Council of Science, Technology and Innovation, 2016) [9].
Uber, an on-demand ridesharing service that connects passengers to local drivers in realtime using smartphone technology, demonstrates this ICT-driven disruptive business modelby triggering a ride-sharing revolution.
In light of its conspicuous accomplishment, to date, considerable studies have beenundertaken in elucidating, conceptualizing and operationalizing Uber’s system success. Thestudies can be classified into five streams: (i) prospect of automotive industry, (ii) ride-sharing revolution, (iii) disruptive innovation, (iv) ICT-driven innovation, and (v) newbusiness model.
Schlze et al. (2015) [24] pointed out that automotive firms cope with turbulence causedby globalization, new government regulations, and advances in electronics, communication,and drive train technologies. In the mean time, these technologies are facilitating not onlynew product features but also new business models which Uber deployed as consumerpreferences move toward mobility as a service rather than vehicles as products. They stressedthe significance of a wide lens (Adner, 2012) [1] with change and stability. Avital et al.(2014) [2] stressed that an economy based on the exchange of capital, assets and servicesbetween individuals has grown significantly, spurred by the proliferation of Internet-basedplatforms that allow people to share underutilized resources and trade with reasonabletransaction costs. The movement to the ride-sharing revolution triggered by Uber was alsopostulated by Blk (2014) [5], Koopeman et al. (2014) [17], King (2015) [16] and Ehret(2015) [11]. Ehret referred Rifkin’s “Zero marginal cost society” (Rifkin, 2014) [23] andsuggested un-captured GDP (Watanabe et al., 2016) [36] that Uber may emerge by stressingthat “Soon we will have access to most products and services at almost no marginal cost.Mega-corporation will cease to make profits and the capitalist market economy will bereplaced by a collaborative commons, where people exchange ideas and support each otherwith creative solutions.”
This emerging paradigm is disruptive to the conventional company-driven economicparadigm as evidenced by a large number of peer-to-peer based services (Avital et al., 2014)[2] on which Uber is based. Isaac et al. (2014) [15] appreciated Uber as one of the mostdisruptive, successful tech start-up company which has severely disrupted the taxi serviceindustry. They pointed out that much of the success Uber has generated so quickly relies on(i) its ability to classify itself as a “technology company” instead of a transportation company,(ii) the ability to classify their drivers as independent contractors instead of employees, and(iii) a depressed market in which workers are willing to assume the burden of risks and costsassociated with driving for the company. They pointed that much of the reason why Uber hasbeen so threating to the traditional taxi industry lay in its efficient and innovative utilizationof modern technology, particularly ICT. Baiyere et al. (2015) [4] supported this view bystressing that rapid continuous advancement in ICT corresponds to the emergence of

3
disruptive ICT innovation increases. Horpedahl (2015) [14] highlighted smartphone apps arestressing that they allow consumers to bypass traditional taxicabs. All led to a new businessmodel. Cohen et al. (2014) [7] reminded that some altogether new and different business hasemerged over the several past years. These developments have started to challenge traditionalthinking about how resources can and should be offered and consumed. This way of thinkingsupports the arguments that incremental improvements in our existing production andconsumption systems are insufficient to transform our global economy toward sustainability(Lovins et al., 2011 [18], Stead et al., 2013 [26]). From these, a new business modelinevitably emerges toward the shared economy. Cohen et al. (2014) [7] pointed out thatshared mobility solutions can be attributed to multiple agents, including public and privateproviders, seek to develop business models which address deficiencies in publicinfrastructure and public transit systems, historically the exclusive purview of local andregional governments. They also warned that the common interest in sustainability amongthese different types of agents does not always lead to harmony, instead giving rise to agencyconflicts that can reduce the positive sustainability impact of their individual and collectiveinitiatives. Indeed, Uber has been confronting legal battles with the traditional automotiveindustry, particularly the taxi industry in some countries.
All the preceding streams intertwine with each other leading to a new system design orsystems web. Uber’s system success and ICT-driven disruptive business model, on whichUber is based, can be attributed to a co-evolution of this systems web. However, scholarshave yet to undertake an analysis of a co-evolution of a systems web which connects thesenew streams.
Inspired by noting the contrast between the world’s leading ICT countries with respect tohappiness/welfare amidst great stagnation in Finland and conspicuous economic growth inSingapore, authors have demonstrated that current ICT-driven global development dependson a trend shifting from traditional co-evolution of computer-initiated ICT, captured GDP,and economic functionality to new co-evolution of the Internet, un-captured GDP, and supra-functionality beyond economic value. The authors then demonstrated that the above contrastcan be attributed to the difference between the two states in the shifting trends describedabove (Watanabe et al., 2016) [36].
This paper elucidates and conceptualizes Uber’s system success based on Uber’scontrasting disruptive innovation development trajectory and contrasts the ICT-drivendisruptive business model with the traditional taxi industry based on a traditional businessmodel. An empirical analysis similar to the analysis done on the co-evolution of three mega-trends governing the difference of the state in the shifting trends was conducted.
Section 2 reviews Uber’s conspicuous start-up. Section 3 analyzes institutional enablerscreating platform ecosystems. Section 4 demonstrates co-evolution of three mega-trendsleading to sharing economy. Section 5 briefly summarizes noteworthy findings, implications,and suggestions for future works.

4
2. Uber, Its Conspicuous Start-up
2.1 Digital Technology Driven Disruptive Business Model
Ride-sharing company Uber is a high-tech company founded in March 2009 (Table 1). Itis seen as the jewel of ICT as it brilliantly connects the transportation industry with ICT viaits ride-sharing application and it leverages the sharing revolution (Belk, 2014) [5], leading tothe transformation of the market for taxi cabs and limousines. It offers its service in over 375cities worldwide in 2015 (Figs. 1a, 1b). Uber is regarded as the highest-valued venture-supported company. It is currently one of the fastest growing start-ups worldwide. It’s valueexceeds the value of the full US taxi and limousine industry.
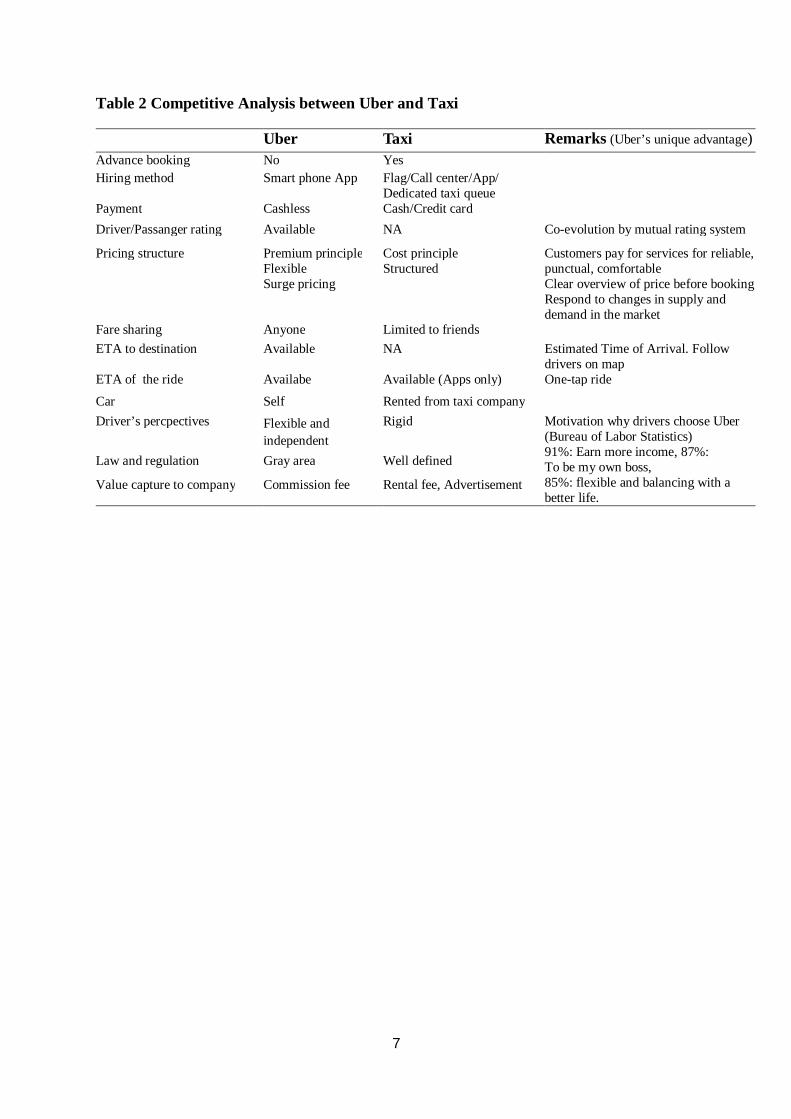
Uber gives passengers a better service with cost and time savings in reaching a location,and it provides its drivers with a highly efficient operation without additional investment andlicense fees (Table 2). Its system is convenient also for drivers. They can work flexible hoursand can reject unwanted clients.
Through a cashless system based on credit cards, Uber can trace and choose highly-rateddrivers. Reliance on digital technology provides passengers with a transparent view of qualityand prices. Similarly, drivers can memorize passenger’s behavior. Thus, Uber has establisheda mutual rating system among the company, drivers, and passengers.
In this way, Uber has triggered a disruptive business model which is driven by digitaltechnology. This technology has been significantly impacting traditional business, not only intransportation but also almost all business institutions.
Uber appraised itself for this business model as “Uber epitomizesdisruption. The company has changed the way we think about grabbing aride, incorporating the same technology we take for granted today into abrand new experience for consumers and an opportunity for producers” (A Brief History ofUber) [29].

5
Table 1 Parallel Paths between History of Uber and ICT Advancement
Year Uber’s Story Advancement of ICT2008 Winter The story of Uber in Paris Apple’s iPhone (2007), Google’s Android (HTC)
2009 March UberCab (renamed to Uber in 2011) wasestablished in SF
Many new smartphone models and OS launched.
2010 July UberCab (on-demand car service via an iPhoneapp or SMS (short message service)) released inSF.
Apple iPad tablet, Instagram was founded.
2011 May Expanded into a new city each month includingNYC, Chicago and Washington DC
3 Billion Android downloads,
Tablet pc’s by Samsung, Sony, Acer, etc.Dec In operation in Paris (first outside of the US)
Raised 44.5 m US$
2012 July UberX (low cost Uber: for-pay rideshare scheme,trips cost less than the same journey in an ordinarytaxi)
Android and iOS dominated the market share.
US smartphone sales passed featured phone sales.
2013 Summer Faced competition from ride-sharing services likeLyftExperimental Uber Chopper (helicopterstransporting service)
85% of US adults use the Internet, 2 Million apps,
U.S. consumer spends 126 minutes per day on
Mobile apps compared to 168 minutes on TV
2014 April Banned by the government in Berlin In person, Mobile payments in the US doubled to $3.7B
59% of US smartphone owners do mobile shopping.
Since 2010 the Digital media time spent on
Smartphone increased by 394% and tablets by 1,721%
Both platforms account for 60% of total time spent.
June Taxi drivers in London, Paris, and Madrid staged alarge-scale protest
August UberPool (matching passenger with another riderheading in the same direction)
October Received an “F” (flunk) rating from the BetterBusiness Bureau (BBB)
November Uber Go (officially the cheapest ride in town)
2015 Feb Established Uber Advanced Technology Center(collaboration with Carnegie Mellon)
78% of US mobile subscribers owned a smart phone.
US consumers spend 4.7 hours on average on smartphone
each day.
U.S. consumer now spends 198 minutes per day on
Mobile apps compared to 168 minutes on TV
U.S. has the highest average rate of monthly data
consumption via smartphone: a colossal 20 GB.
April UberEATS program (food delivery service)
May Uber Military Families Coalition, Appaccommodating for drivers for deaf or hard ofhearing58 countries and 300 cities
2015 Dec Market value 62.5 B US$

6
Uber’s Worldwide Expansion Trajectory
Fig. 1.1. Uber’s Expansion Trajectory Worldwide. Source Uber.com.
Uber’s Expansion in 375 cities Worldwide (as of Jan.2016)
Fig. 1.2. Uber’s Expansion in 375 Cities on World Map (as of Jan. 2016).Source: Author’s geocoded map based on Uber’s cities list at Uber.com (see Appendix 5).
Uber Expansion 2010-2014
7
Table 2 Competitive Analysis between Uber and Taxi
Uber Taxi Remarks (Uber’s unique advantage)Advance booking No YesHiring method Smart phone App Flag/Call center/App/
Dedicated taxi queuePayment Cashless Cash/Credit cardDriver/Passanger rating Available NA Co-evolution by mutual rating system
Pricing structure Premium principleFlexibleSurge pricing
Cost principleStructured
Customers pay for services for reliable,punctual, comfortableClear overview of price before bookingRespond to changes in supply anddemand in the market
Fare sharing Anyone Limited to friendsETA to destination Available NA Estimated Time of Arrival. Follow
drivers on mapETA of the ride Availabe Available (Apps only) One-tap ride
Car Self Rented from taxi companyDriver’s percpectives Flexible and
independentRigid Motivation why drivers choose Uber
(Bureau of Labor Statistics)91%: Earn more income, 87%:To be my own boss,85%: flexible and balancing with abetter life.
Law and regulation Gray area Well defined
Value capture to company Commission fee Rental fee, Advertisement

8
2.2 Astounding Rise
As a general consequence of the numerical analysis of newly emerged innovation,elucidation of Uber’s systems success was a challenge in exploring the dark continent withoutpublished statistical data.
Fig. 2 attempts to trace the trajectory of Uber’s astounding rise. Conspicuousness ofUber’s disruptive business model can be confirmed by the astounding rise in the number ofits users. Based on expense reports from business travelers, Certify (2015) [6] revealed thatan average 46% of all total paid car rides were through Uber in major markets across the USin March 2015. This demonstrates a steep rise particular in business use over the 14 monthsfrom a mere 15% in January 2014 as demonstrated in Fig. 2.
Uber’s fast rise to success directly correlates with the decrease in the number oftraditional taxi users. The share of taxi, limousine and shuttles of that number felldramatically from 85% to 54% over this 14 months. This observation is rather biasedtowards Uber, as the report is focused on business travelers, it has been estimated that thenumber of people using Uber is higher than the number of people using a taxi now (Frier,2015) [12].
Fig. 2. The trend in Share of Rides by Taxi and Uber in the US (Jun. 2013 – Sep. 2015).Sources - Jan. 2014 – Mar. 2015: Certify (2015) [6], other periods: authors’ estimate based on TLC and Uber(See Appendix 1).

9
Fig. 3-3. Trend in Taxi Prices in NYC (Jun. 2013 – Sep. 2015).
Fig. 3-1. Trend in Taxi Trips in NYC (Jun. 2013 – Sep. 2015). Fig. 3-2. Trend in Meter Revenues in NYC (Jun. 2013 – Sep. 2015).
2.3 Trend in the Substitution for Taxi
(1) Trends in Taxi Revenues, Trips and Prices (Jun. 2013 – Sep. 2015)
Figs. 3-1 – 3-3 demonstrate trends in taxi revenues, trips and prices in NYC over theperiod June 2013 – September 2015.
As a consequence of Uber’s astounding rise in a co-existing development trajectory withtaxis, the number of trips in taxis demonstrates rapid decline (Fig. 3-1) which resulted in theirrevenues decline (Fig. 3-2) and subsequent increase in their prices (Fig. 3-3).
Sources: TR and TT- Jun. 2013 – Mar. 2015: Hickman (2015) [13] based on NYC Taxi and LimousineCommission (TLC), another period: authors’ estimate based on TLC. PT = TR/TT (See Appendix 1).
Trips per day per medallion
5 months moving average. 5 months moving average.
Meter revenues/trips
TTTR
PT

10
0
10
20
30
40
50
60
Jun-
13Ju
ly-1
3A
ug-1
3Se
p-13
Oct
-13
Nov
-13
Dec
-13
Jan-
14Fe
b-14
Mar
-14
Apr
-14
May
-14
Jun-
14Ju
ly-1
4A
ug-1
4Se
p-14
Oct
-14
Nov
-14
Dec
-14
Jan-
15Fe
b-15
Mar
-15
Apr
-15
May
-15
Jun-
15Ju
ly-1
5A
ug-1
5Se
p-15
Trips per day
Uber
Taxi
UT
TT
$10$12$14$16$18$20$22$24
Jun-
13Ju
ly-1
3A
ug-1
3Se
p-13
Oct
-13
Nov
-13
Dec
-13
Jan-
14Fe
b-14
Mar
-14
Apr
-14
May
-14
Jun-
14Ju
ly-1
4A
ug-1
4Se
p-14
Oct
-14
Nov
-14
Dec
-14
Jan-
15Fe
b-15
Mar
-15
Apr
-15
May
-15
Jun-
15Ju
ly-1
5A
ug-1
5Se
p-15
Taxi
Uber
Average prices per trip
PT
PU
2014/5 14/8 14/10 14/11 2015/1
Fig. 4. Trends in Uber and Taxi Trips in NYC (Jun. 2013 – Sep. 2015).
Sources – Taxi: Fig. 3-1. Uber: authors’ estimate based on ,
Fig. 5. Trends in Uber and Taxi Prices in NYC (Jun. 2013 – Sep. 2015).
Sources – Taxi: Fig. 3-3, Uber – Jun. 2013 - Nov. 2014: Lunden (2014) [20], otherperiod: Authors ‘estimate based on TLC, Uber, Stone (2015) [27] andSilverstein (2014) [25] See Appendix 1).
(2) Comparison of the Trends in Trips and Prices between Uber and Taxi
Fig. 4 demonstrates trends in Uber and taxi trips in NYC over the period June 2013 –September 2015. Similarly, Fig. 5 demonstrates trends in Uber and taxi prices in NYC overthe same period.1
At the same time as Uber’s astounding success, Uber’s prices continued to decline and inMay 2014 they reached the same level as taxis. The prices further declined with theintroduction of UberPool in August 2014. The decline in prices was reversed as aconsequence of Uber’s surge pricing, and resulted in an “F” (flunk) rating from the BetterBusiness Bureau (BBB) in October 2014 when complaints about unexpectedly high chargeswere cited. In response to such complaints and also to competition from competitors such asLyft, Uber managed to decrease prices by introducing Uber Go in November 2014. Thismove, together with technology advancement effort by the establishment of the UberAdvanced Technology Center in February 2015, led to lower prices again in 2015.
TD
DT T
UUU ×-
=1
1 This analysis focuses on the state in NYC as it demonstrates pioneer state of ridesharing revolution in the US(Hickman, 2015 [13]; Silverstein, 2014 [25]; Stone, 2015 [4]), and all data in Figs. 4 and 5 are based on the statein NYC, except Uber share (UD) in estimating Uber trip (UT) in Fig. 4. Due to unavailability of reliable statisticson UD in NYC, it based on the average Uber share in the US focusing on business use (Fig. 2) which should beinterpreted slightly reserved to Uber trips in NYC.
where UT: Uber trip, TT: Taxi trip, UD: Dependency on Uber(share of Uber trips out of sum of Uber and taxi trips asdemonstrated in Fig. 2) (See Appendix 1).

11
3. Institutional Enablers Leveraging Uber’s Astounding Rise3.1 Sharing Economy for Physical Products
Uber’s astounding rise can largely be attributed to dissemination of sharing economyfrom digital products to physical products.
In line with people’s preferences shift from economic functionality to supra-functionalitybeyond economic value (Watanabe et al., 2014 [34]), sharing economy in physical products(i.e., rooms and cars) has been gaining momentum.
The underlining paradigm of the original sharing economy is that users aim at increasingresource-use efficiency, to lower costs or to create new value. Online trading platforms suchas Napster and eMula were amongst the first to provide users with shared access to digitalmusic and videos. It was possible to download these digital products from lenders on theplatform for free, and uploading and downloading happened simultaneously (Winterhalter etal., 2015 [35]).
People’s preference shift to supra-functionality has led to requests for a similar platformalso for physical products. People wish to use such products (which were provided passively,primarily with economic functionality) in a more sophisticated manner by their initiative(Adner, 2012 [1]).
Sharing economy for physical products initiated by Uber and AirbnB is needed by themarket with such underlining paradigm.
3.2 Institutional Enabler of Sharing Economy in Physical Products
(1) Advancement of ICT
The main enablers of the sharing economy are ICT and Internet connectivity, which alloweffective peer-to-peer contact (The Economist, 2013 [28]).
Thanks to the dramatic advancement of the Internet, countless websites connect people ona peer-to-peer basis with separate resources of almost any kind (not only time, digitalinformation and knowledge resources but also space and fixed assets) to the needs of otherssearching for these resources.
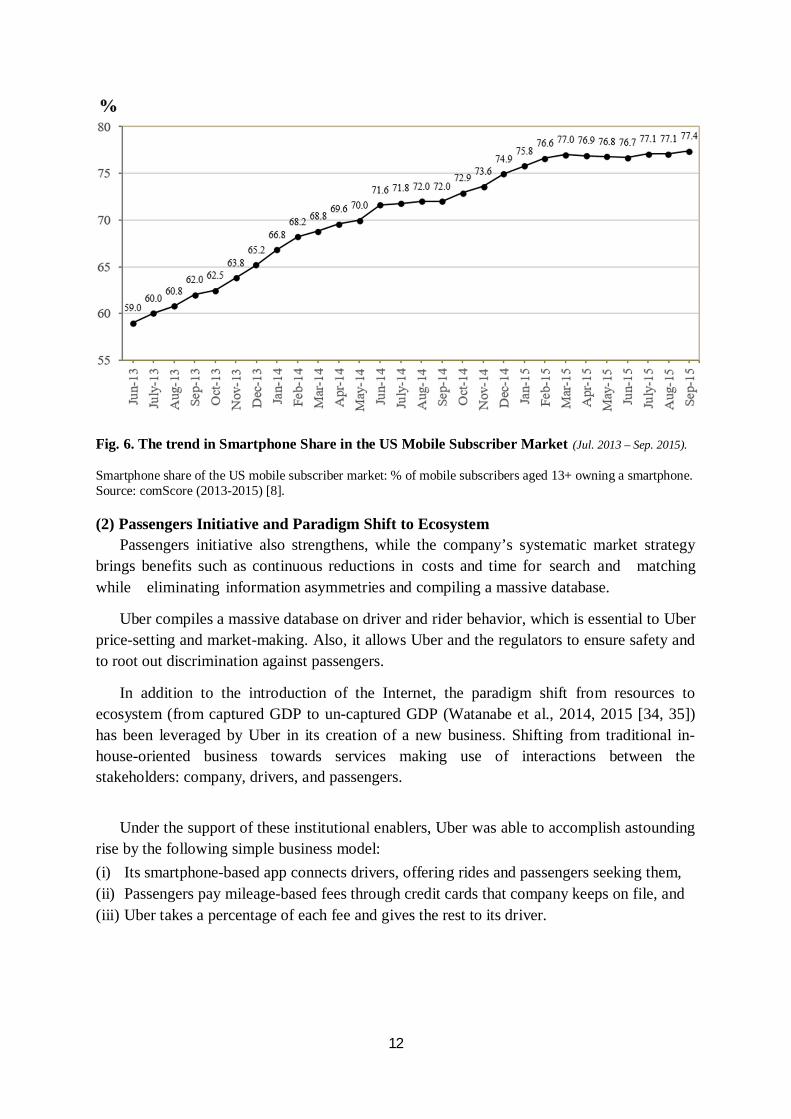
Such advancement, particularly of a smartphone, nurtures Uber by enabling highqualified services with lower cost 2 and shorter time. Fig. 6 demonstrates a trend insmartphone share in the US mobile subscriber market over the period July 2013 - September2015. Looking at Fig. 6 we note that while smartphone has gained popularity, and its share inthe mobile subscriber market demonstrated a sharp increase in the US, there has beenstagnation in the upward surge and a shift from quantity to quality in 2015 in nationwide inthe US (comScore, 2013-2015 [8]).
2 e.g., from downtown L.A. to the airport (Uber: 22 US$, Taxi: 46.5 US$ (56 $ with 20% tip)) in 2015.
12
Fig. 6. The trend in Smartphone Share in the US Mobile Subscriber Market (Jul. 2013 – Sep. 2015).
Smartphone share of the US mobile subscriber market: % of mobile subscribers aged 13+ owning a smartphone.Source: comScore (2013-2015) [8].
(2) Passengers Initiative and Paradigm Shift to EcosystemPassengers initiative also strengthens, while the company’s systematic market strategy
brings benefits such as continuous reductions in costs and time for search and matchingwhile eliminating information asymmetries and compiling a massive database.
Uber compiles a massive database on driver and rider behavior, which is essential to Uberprice-setting and market-making. Also, it allows Uber and the regulators to ensure safety andto root out discrimination against passengers.
In addition to the introduction of the Internet, the paradigm shift from resources toecosystem (from captured GDP to un-captured GDP (Watanabe et al., 2014, 2015 [34, 35])has been leveraged by Uber in its creation of a new business. Shifting from traditional in-house-oriented business towards services making use of interactions between thestakeholders: company, drivers, and passengers.
Under the support of these institutional enablers, Uber was able to accomplish astoundingrise by the following simple business model:(i) Its smartphone-based app connects drivers, offering rides and passengers seeking them,(ii) Passengers pay mileage-based fees through credit cards that company keeps on file, and(iii) Uber takes a percentage of each fee and gives the rest to its driver.

13
3.3 Self-propagating Virtuous Cycle(1) Governing Factors of Uber Prices Decline
Since Uber prices (PU) are governed by the increase in smartphones demonstrated by itsshare in the mobile subscriber market (SP), learning and economy of scale effects, their trendcan be depicted as follows:
TU
TU
USPAPUSPAP
lnlnlnln la
la
-+=××= -
A: scale factor, UT : Uber trips, :a SP elasticity to PU, and :l learning coefficients (learningand economy of scale effects)
Based on this equation, Table 3 identifies governing factors of Uber prices in NYC overthe period June 2013-September 2015 by dividing into three periods: 2013/6-2014/7 (sharpdecline), 2014/8-2014/11 (change to increase due to surge pricing), and 2014/12-2015/9 (decline byintroducing Uber Go and technology advancement effort) corresponding to Fig. 5 analysis.
Table 3 Governing Factors of Uber Prices in NYC (Jun. 2013 – Sep. 2015)
25.1980.0.ln376.0ln278.0ln213.0ln551.0ln015.1ln717.0361.6ln 2321321 DWRadjUDUDUDSPDSPDSPDP TTTU -+----=
PU: Uber’s prices, SP: Smartphone subscriber market share (%), UT: Uber trips, and D1, D2, D3: Dummy variables.
D1: 2013.6 – 2014.7 = 1, rest = 0. D2: 2014.8 – 2014.11 = 1, rest = 0, D3: 2014.12 – 2015.9 = 1, rest = 0.Figures in parenthesis indicate t-statistics: significant at *1 :1%, *2 :2%, *4 :10%, *5 : 15% level.
Table 3 demonstrates that while SP elasticity to PU maintains negative with smaller valuein the 3rd period, learning co-efficient changed from negative to positive in the 2nd period andchanged again to negative in the 3rd period. The former corresponds to the observation in Fig.6 while the latter corresponds to the observation in Fig. 5.
Utilizing the results of Table 3, the contribution of Uber prices decrease can be identifiedas summarized in Table 4.
Table 4 Contribution of Uber Prices Decrease in NYC (Jun. 2013 – Sep. 2015) - % p.a.
PU decreaserate
Contribution by Period
SP increase rate UT increase rate Miscellaneous
-3.07 -0.717 x 1.52 = -1.09 -0.213 x 11.92 = -2.54 0.56 2013/6 - 2014/7
1.87 -1.015 x 0.62 = -0.63 0.278 x 13.02 = 3.62 -1.12 2014/8 - 2014/11
-3.43 -0.551 x 0.51 = -0.28 -0.376 x 9.57 = -3.60 0.45 2014/12 - 2015/9
Looking at Table 4 we note that Uber’s prices have been governed by the increase in itstrips and own strategy together with the increase in smartphones. Contribution of tripsincrease can be attributed to learning and economy of scale effects (Watanabe et al., 2009
U
U
PPD
(4.06*1) (-1.80*4) (-2.62*2) (-1.49*5) (-3.63*1) (2.52*2) (-10.84*1)

14
[32]) while contribution of smartphones increase can be attributed through ICT’s self-propagating function that accelerates learning and economy of scale effects (Watanabe et al.,2004 [30], Watanabe et al., 2009 [32]).
As analyzed in Fig. 5, sharp decline in Uber prices stagnated from August 2004 andchanged to upward trend by serious complaints about unexpectedly high charges due to surgepricing in October 2014. While this upward shifting factor remains, the price decline trendwas maintained by introducing Uber Go in November 2014 together with technologyadvancement effort. This challenge in the 3rd period demonstrated high elasticity of trips toprices and compensated the stagnation of smartphones share increase in 2015. Upward trendin the 2nd period can be attributed to surge pricing strategy.
Table 4 demonstrates these rise and fall trends. Noteworthy is a resilient recovery in pricedecline in the 3rd period despite stagnation of smartphones contribution to this decline. Thissuggests a sophisticated dynamism in Uber’s ICT-driven trips and prices coordination whichis beyond simple ICT’s self-propagating function as well as learning and economy of scaleeffect.
(2) Virtuous Cycle between Uber Trips Increase and Its Prices Decline
Inspired by the foregoing suggestion, Fig. 7 analyzes the correlation between Uber’s tripsand their prices in NYC over the same period.
Fig. 7. Correlation between Uber’s Trips and Their Prices in NYC (Jun. 2013 – Sep. 2015).
Fig. 7 demonstrates three phases trends corresponding to the three periods in Table 4.While Uber’s prices demonstrated sharp decline as smartphones increased in the 1st period,after recovering from the upward trend in the 2nd period, prices decline was maintained undertrips increase initiative despite smartphones direct effect decreased. This dynamism promptsus the sources of Uber’s success leading to its astounding rise as reviewed earlier. GivenUber as the jewel of ICT as reviewed in 2.1, this success is considered to depend on ICT’sunique comprehensive function beyond simple self-propagation, learning and economy ofscale effects.
15
4. Co-evolution of 3 Mega-trends Leading to a Spinoff to Sharing Economy4.1 Emergence of Un-captured GDP
(1) Medallion Prices as a Proxy of the Trend in Taxi Demand
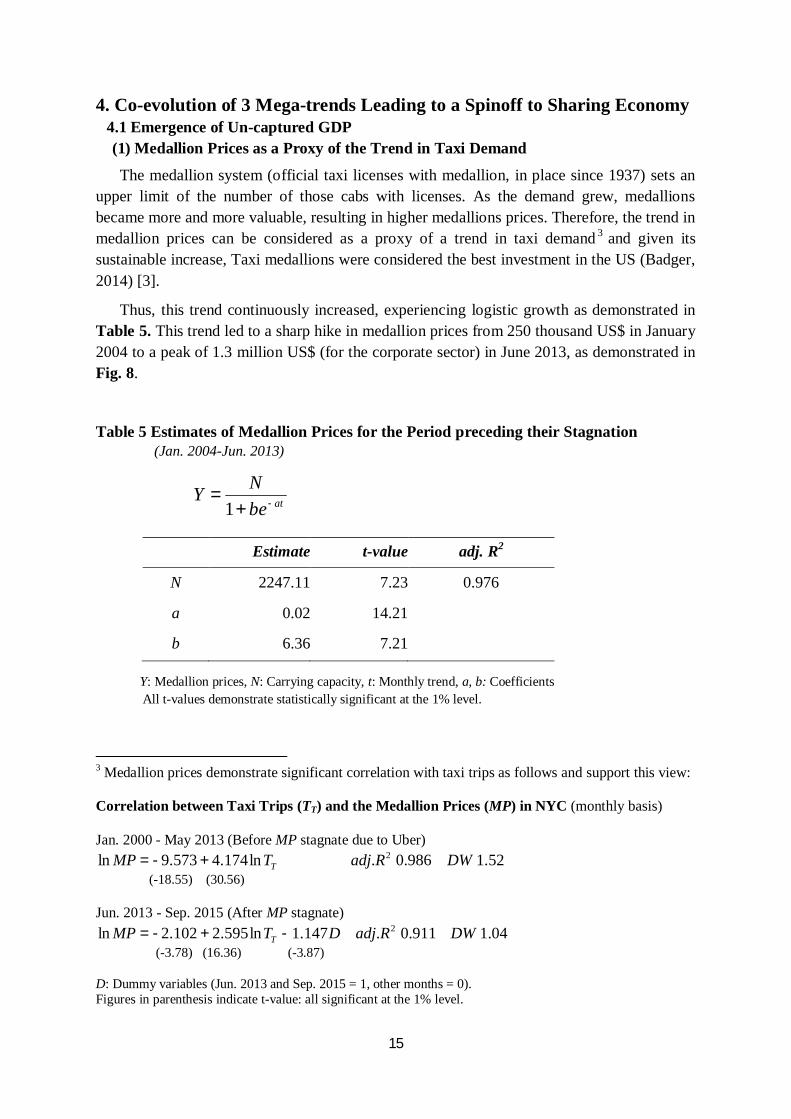
The medallion system (official taxi licenses with medallion, in place since 1937) sets anupper limit of the number of those cabs with licenses. As the demand grew, medallionsbecame more and more valuable, resulting in higher medallions prices. Therefore, the trend inmedallion prices can be considered as a proxy of a trend in taxi demand 3 and given itssustainable increase, Taxi medallions were considered the best investment in the US (Badger,2014) [3].
Thus, this trend continuously increased, experiencing logistic growth as demonstrated inTable 5. This trend led to a sharp hike in medallion prices from 250 thousand US$ in January2004 to a peak of 1.3 million US$ (for the corporate sector) in June 2013, as demonstrated inFig. 8.
Table 5 Estimates of Medallion Prices for the Period preceding their Stagnation(Jan. 2004-Jun. 2013)
Y: Medallion prices, N: Carrying capacity, t: Monthly trend, a, b: Coefficients All t-values demonstrate statistically significant at the 1% level.
3 Medallion prices demonstrate significant correlation with taxi trips as follows and support this view:
Correlation between Taxi Trips (TT) and the Medallion Prices (MP) in NYC (monthly basis)
Jan. 2000 - May 2013 (Before MP stagnate due to Uber)52.1986.0.ln174.4573.9ln 2 DWRadjTMP T+-=
(-18.55) (30.56)
Jun. 2013 - Sep. 2015 (After MP stagnate)04.1911.0.147.1ln595.2102.2ln 2 DWRadjDTMP T -+-=
(-3.78) (16.36) (-3.87)
D: Dummy variables (Jun. 2013 and Sep. 2015 = 1, other months = 0).Figures in parenthesis indicate t-value: all significant at the 1% level.
Estimate t-value adj. R2
N 2247.11 7.23 0.976
a 0.02 14.21
b 6.36 7.21
atbeNY -+
=1

16
However, starting in May 2011, Uber added more and more drivers, the medallion pricesstarted stagnating after a peak in June 2013. The prices then fell precipitously from May 2014,corresponding to the time when Uber prices reached the level of taxis prices as demonstratedin Fig. 5.
Fig. 8. Trends in Corporate Medallion Prices and their Estimate without Uber in NYC– 2013 prices (Jan. 2004 – Sep. 2015).
Source: NYC Taxi and Limousine Commission (TLC).
(2) Correlation between Dependency on Uber and Medallion PricesThe more cabs are booked through Uber, the less money the cab drivers make and the
worse the taxi medallions look like as an investment. Medallion prices have continued todrop considerably after Uber, with prices declining, caught up with the price level of atraditional taxi in May 2014.
Fig. 9. Correlation between Dependency on Uber and Medallion Prices in NYC(Jun. 2013.6 – Sep. 2015).
Sources: NYC Taxi and Limousine Commission (TLC) and Certify [6].
Actual medallion prices
Dec. 2013

17
Fig. 9 illustrates the correlation between dependency on Uber (share of Uber trips out of sumof Uber and taxi trips) and medallion prices (as a proxy of taxi demand) in NYC over the period June2013 – September 2015.
Uber’s astounding success brought its prices lower than a taxi in May 2014 (Fig. 5).Uber's success resulted in a significant decrease in medallion prices (Fig. 8). Reducedmadallion prices (taxi demand decrease) induce further dependency on Uber, leading to avirtuous cycle between medallion prices decline and increase in this dependency, asdemonstrated in Fig. 10.
)07.5()31.3()22.14()06.1()50.11()43.77( 7*
22131211 77.1948.0.131.0895.1ln420.0ln220.0ln554.0435.8ln
----
---+-= --- DWRadjDDUDDUDDUDDMP tttt
MP: Medallion prices, UD: Dependency on Uber, D1, D2, D3, D: Dummy variables.D1: 2013.6 – 2013.12 = 1, rest = 0. D2: 2014.1 – 2014.5 = 1, rest = 0. D3: 2014.6 – 2015.9 = 1, rest = 0.D: 2013.7-8, 2015.9 = 1, other months = 0.
)62.3()88.11()06.3()11.13()22.15(
46.1980.0.770.92ln910.1ln030.11ln051.2022.17ln 2111 2321
---
--+-= --- DWRadjDMPDMPDMPDUD tttt
D1: 2013.6 – 2013.12 = 1, rest = 0. D2: 2014.1 – 2014.5 = 1, rest = 0. D3: 2014.6 – 2015.9 = 1, rest = 0.
Fig. 10. Virtuous Cycle between Dependency on Uber and Medallion Prices(Jun. 2013 – Sep. 2015).
Figures in parenthesis indicate t-statistics: all significant at the 1% level except *7: 30% level.
This demonstrates a structural source of the contrast between precipitous fall of themedallion prices and astounding rise of Uber.
(3) Two-faced Nature of ICT and Subsequent Un-captured GDP
The impacts of Uber’s sharing revolution on the medallion system in NYC can beclassified into two periods:
(i) During the first two years after the launch of Uber in May 2011, Uber’s shareremained below 10% (Fig. 2), and its impact on medallion prices was limited. Themedallion prices continued to increase, due primarily to the increase in demand for ataxi.
(ii) However, after this “pregnancy period,” once Uber’s share reached 10% in June2013 overcoming the Chasm in a diffusion trajectory (Moore, 1999 [22]), 4 the
4 Analysis based on the diffusion theory identifies this timing of Uber in NYC as early 2013 (See Appendix 2).
Dependency on Uber Medallion prices

18
sharing revolution made a structural change to the medallion price formation system,leading to the above-mentioned precipitous fall.
Table 5 suggests that without such sharing revolution which made a structural change inthe price formation system, the medallion prices may continue to logistic growth as illustratedin Fig. 8 by a broken line. Contrast of actual and estimated medallion prices corresponds tothe two-faced nature of ICT which postulates that while the advancement of ICT contributesto enhancing its prices by increasing new functionality development, dramatic advancementof the Internet tends to decrease ICT prices due to freebies, easy copying, and massstandardization, among other things as illustrated in Fig. 11 (Cowen, 2011 [10]).
Prices of technology at fixed prices are equibalent to marginal productivity of technology giventhe firm seeks to profit maximum condition under the competitive circumstances.
Fig. 11. Two-faced Nature of ICT.
This suggests the emergence of un-captured GDP as Uber advances. Advancement of ICTcan largely be attributed to the dramatic advancement of the Internet, which has changed thecomputer-initiated ICT world significantly. The Internet promotes a free culture,consumption of which provides utility and happiness to people but cannot be capturedthrough GDP data that measure revenue (Lowrey, 2011 [19]) leading to increasingdependency on un-captured GDP (Watanabe et al., 2014, 2015 [34, 35]).
Uber’s better service with cost and time savings for passengers by highly efficientoperation without additional investment and license fees for drivers correspond to thisconcept. Therefore, discrepancy between actual medallion prices and estimated medallionprices without Uber in Fig. 8 can be considered as demonstrating the magnitude of un-captured GDP (See Appendix 2).
PI
Un-captured GDP
19
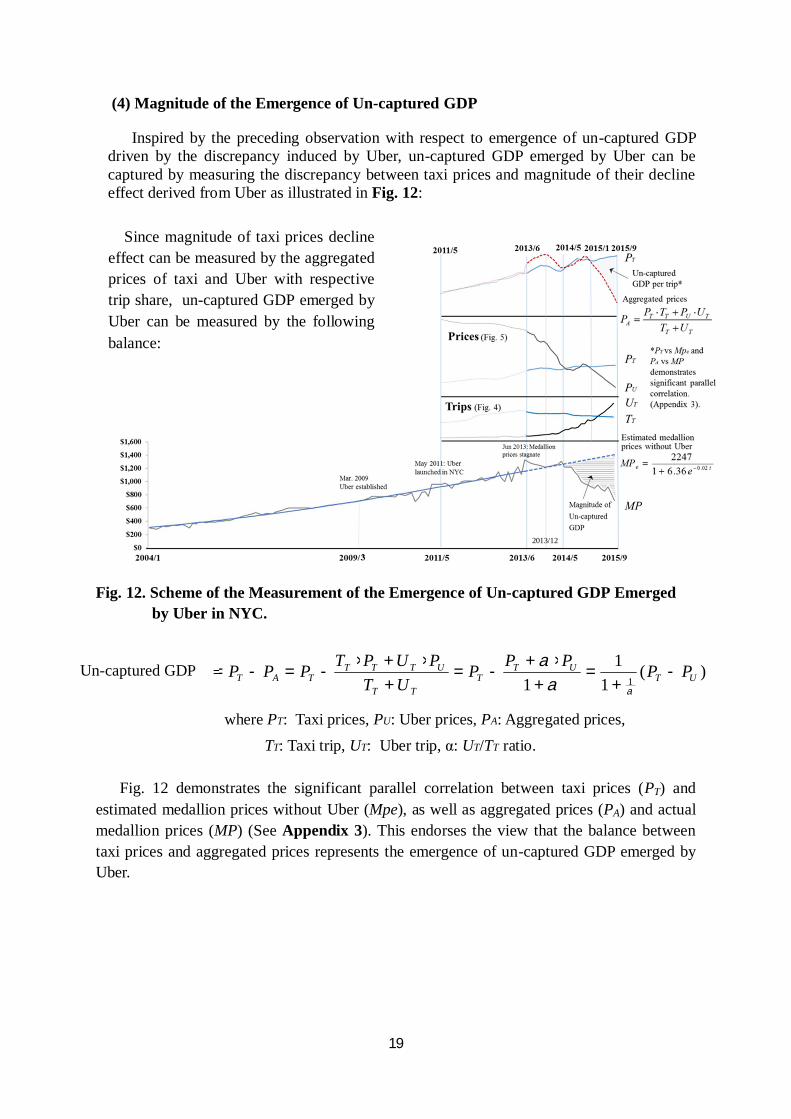
(4) Magnitude of the Emergence of Un-captured GDP
Inspired by the preceding observation with respect to emergence of un-captured GDPdriven by the discrepancy induced by Uber, un-captured GDP emerged by Uber can becaptured by measuring the discrepancy between taxi prices and magnitude of their declineeffect derived from Uber as illustrated in Fig. 12:
Fig. 12. Scheme of the Measurement of the Emergence of Un-captured GDP Emergedby Uber in NYC.
Fig. 12 demonstrates the significant parallel correlation between taxi prices (PT) andestimated medallion prices without Uber (Mpe), as well as aggregated prices (PA) and actualmedallion prices (MP) (See Appendix 3). This endorses the view that the balance betweentaxi prices and aggregated prices represents the emergence of un-captured GDP emerged byUber.
where PT: Taxi prices, PU: Uber prices, PA: Aggregated prices, TT: Taxi trip, UT: Uber trip, α: UT/TT ratio.
)(1
11 1 UT
UTT
TT
UTTTTAT PPPPP
UTPUPTPPP -
+=
+×+
-=+
×+×-=-=
aaaUn-captured GDP
Since magnitude of taxi prices declineeffect can be measured by the aggregatedprices of taxi and Uber with respectivetrip share, un-captured GDP emerged byUber can be measured by the followingbalance:
2013/12

20
4.2 Emergence of Uber-Driven Un-captured GDP (1) Substance of the Uber-driven Un-captured GDP
Supported by the preceding endorsement, Fig. 13 demonstrates the magnitude of un-cacaptured GDP per trip emerged by Uber.
Fig. 13. Trends in Taxi Prices and Aggregated Prices in NYC (Jun. 2013 – Sep. 2015).
Aggregated prices PA are measured by the following equation:TT
TUTTA UT
UPTPP+
×+×=
The substance of this un-captured GDP can be summed up as follows:
High-qualified services with lower cost and shorter time. An increasing initiative ofpassengers and the company’s systematic market strategy of continuous reduction of costsand time in search and matching, eliminating information asymmetries and compiling amassive database.
Fig. 13 demonstrates that while Uber nurtured “negative un-captured GDP value” (itsservices were unable to catch up with those of taxi accumulated over the last 120 years) byJune 2014, it succeeded in nurturing increasing un-captured GDP from the beginning of 2015corresponding to its success in sustainable decline in prices from the end of 2014 (Fig. 5).
(2) Increase in the Emergence of Un-captured GDP
On the basis of the preceding review, the trend in the value of un-captured GDP per tripby Uber in NYC was measured as illustrated in Fig. 14. This Figure demonstrates that un-captured GDP induced by Uber has been increasing significantly from the beginning of 2015.
Average prices (US$/trip)
13,5
14,0
14,5
15,0
15,5
16,0
16,5
17,0
17,5
18,0
Jun-
13Ju
ly-1
3A
ug-1
3Se
p-13
Oct
-13
Nov
-13
Dec
-13
Jan-
14Fe
b-14
Mar
-14
Apr
-14
May
-14
Jun-
14Ju
ly-1
4A
ug-1
4Se
p-14
Oct
-14
Nov
-14
Dec
-14
Jan-
15Fe
b-15
Mar
-15
Apr
-15
May
-15
Jun-
15Ju
ly-1
5A
ug-1
5Se
p-15
PT
PA
2014/6 2015/1
Un-captured GDP
Taxi
Aggregated prices

21
ratioTU
T
T=a
As emulating in the following equation, this can be attributed to a virtuous cycle betweenUber’s prices (PU) decline and trips (UT) increase.
Un-captured GDP
where
Fig. 14. Trend in the Emergence of Un-captured GDP Emerged by Uber in NYC(Jun. 2013 – Sep. 2015).
-1,0
-0,5
0,0
0,5
1,0
1,5
2,0
2,5
3,0
Jun-
13Ju
ly-1
3A
ug-1
3Se
p-13
Oct
-13
Nov
-13
Dec
-13
Jan-
14Fe
b-14
Mar
-14
Apr
-14
May
-14
Jun-
14Ju
ly-1
4A
ug-1
4Se
p-14
Oct
-14
Nov
-14
Dec
-14
Jan-
15Fe
b-15
Mar
-15
Apr
-15
May
-15
Jun-
15Ju
ly-1
5A
ug-1
5Se
p-15
Un-captured GDP (US$/trip) 2015/1
)(1
11 1 UT
UTT
TT
UTTTTAT
PPPPP
UTPUPTPPP
-+
=+
×+-=
+×+×
-=-=
aaa
22
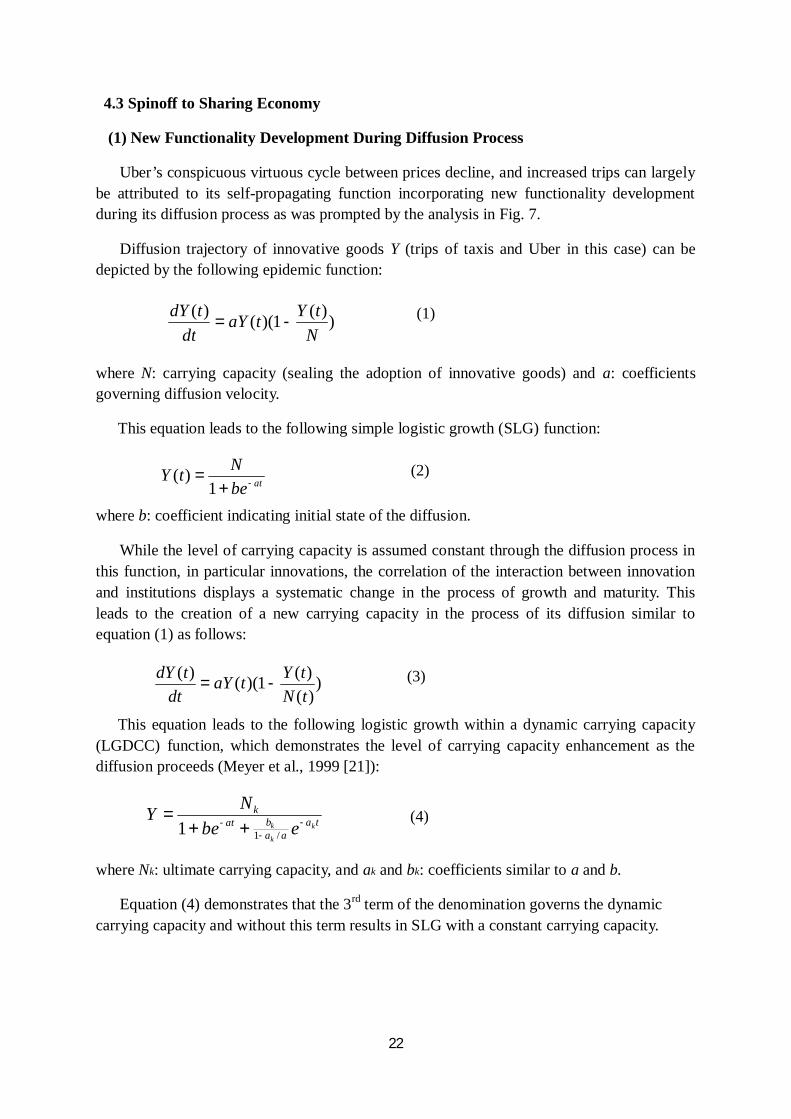
4.3 Spinoff to Sharing Economy
(1) New Functionality Development During Diffusion Process
Uber’s conspicuous virtuous cycle between prices decline, and increased trips can largelybe attributed to its self-propagating function incorporating new functionality developmentduring its diffusion process as was prompted by the analysis in Fig. 7.
Diffusion trajectory of innovative goods Y (trips of taxis and Uber in this case) can bedepicted by the following epidemic function:
where N: carrying capacity (sealing the adoption of innovative goods) and a: coefficientsgoverning diffusion velocity.
This equation leads to the following simple logistic growth (SLG) function:
where b: coefficient indicating initial state of the diffusion.
While the level of carrying capacity is assumed constant through the diffusion process inthis function, in particular innovations, the correlation of the interaction between innovationand institutions displays a systematic change in the process of growth and maturity. Thisleads to the creation of a new carrying capacity in the process of its diffusion similar toequation (1) as follows:
This equation leads to the following logistic growth within a dynamic carrying capacity(LGDCC) function, which demonstrates the level of carrying capacity enhancement as thediffusion proceeds (Meyer et al., 1999 [21]):
where Nk: ultimate carrying capacity, and ak and bk: coefficients similar to a and b.
Equation (4) demonstrates that the 3rd term of the denomination governs the dynamiccarrying capacity and without this term results in SLG with a constant carrying capacity.
))(1)(()(N
tYtaYdt
tdY-= (1)
atbeNtY -+
=1
)( (2)
))()(1)(()(tNtYtaY
dttdY
-= (3)
taaa
batk
k
k
k ebeNY -
-- ++
=/11
(4)

23
(2) Uber’s Self-propagating Function
From equation (3), dynamic carrying capacity can be expressed as follows:
÷÷ø
öççè
æ
×-=
)(/11)()( )(1 tY
tYtNdt
tdYa
This demonstrates that N(t) increases together with the increase of Y(t), and its growthrate as time goes by. This implies that the LGDCC function demonstrates functionalitydevelopment in the context of the self-propagating behavior (Watanabe et al. (2004) [30],Watanabe et al. (2009) [32]).
Table 6 compares this self-propagating function in taxi and Uber in NYC by examiningtheir adaptability to LGDCC.
Table 6 Adaptability of Taxi and Uber’s Development Trajectories to LGDCC (NYC)
Nk a b ak bk adj. R2
Taxi (Jan. 2004 – Jun.2013) 2247.12(6.42)
0.017(12.61)
6.364(6.63)
0.439(0.00x)
10.30(0.00x) 0.976
Uber (Jun.2013 – Sep.2015) 119.27(41.41)
0.121(36.67)
49.650(11.13)
0.016(2.42*3)
0.200(1.43*5) 0.999
Taxi: based on medallion prices (Fig. 8), Uber: based on trips (Fig. 4) with spline interpolation (see Appendix4).
LGDCC: Logistic growth with dynamic carrying capacity,Figures in parenthesis indicate t-statistics: all significant at the 1% level except *3: 5 %, *5: 15 %, x: non-significant.
Table 6 demonstrates that while taxis depend on SLG as its 3rd term of the denomination(ak and bk) demonstrates statistically insignificant, Uber demonstrates depending on LGDCCwith statistically significant 3rd term of the denomination.
This demonstrate that Uber has developed with the self-propagating function.
(3) Spinoff from Taxi to Uber
This self-propagating function plays a vital role of the engine in spinning-off fromtraditional co-evolutional three mega-trends to new co-evolution as illustrated in Fig. 15. Thisspin-off plays significant role in inducing ICT-driven innovation (Watanabe et al. (2015,2016) [35, 36]). Here spin-off is defined as jumping to more sophisticated co-evolutionaldynamism from traditional co-evolutional dynamism in inducing innovation (Watanabe et al.,2011 [33]).
From equation (5) functionality development in the LGDCC function can be depicted asfollows:
(5)
taaa
batk
k
k
k ebeNY -
-- ++
=/11
(eq. (4)).

24
Functionality development =)(/1
1)()(
)(1 tYtYtNFD
dttdY
a ×-== (6)
This equation demonstrates that functionality development can be accelerated as itsgrowth rate increases. Since functionality development plays a locomotive role in leveragingspin-off (Watanabe et al. (2011) [33]), equation (6) indicates self-propagating functionleverages spin-off by inducing functionality development.
Fig. 15. Scheme of Spin-off Dynamism.
This spin-off can be observed in industries not only transportation (Fig. 16) but alsomusic industry, game industry and printing and publishing industry. Nowadays, eveneducation industry has been behaving the similar trend.

25
Fig. 16. Co-evolution of 3 Mega-trends in Transportation Industry.
Digitalization of taxi industry
In Jan. 2016 the Uber has expandedto 375 cities worldwide.
Ride on demand serviceE-hailing and payment servicevia mobile phone App
Uber is cheaper thanother taxies in US.
Paradigmchange
People’spreferences
shift

26
4.4 Dynamism of Uber’s ICT Driven Disruptive Business Model
By the preceding analyses, the dynamism of Uber’s ICT driven disruptive business modelcan be identified as illustrated in Fig. 17.
Fig. 17. The dynamism of Uber’s ICT Driven Disruptive Business Model.
Co-existing development trajectory with taxi corresponds to two-faced nature of ICT thatis behind the emergence of un-captured GDP.
This emergence can be attributed to a strong substitution from taxi to Uber accelerated bycontrasting vicious cycle between price increase and trips decrease in taxi and a virtuouscycle between price decline and trips increase in Uber.
Uber’s virtuous cycle can be attributed to ICT’s self-propagating function that enhancesthe level of functionality as its diffusion proceeds.
This self-propagating function plays a vital role in spin-offs from traditional co-evolutionto new co-evolution between ICT advancement, paradigm change to increasing un-capturedGDP dependence, and people’s preferences shift to supra-functionality beyond economicvalue.
This spin-off accelerates further lower cost and higher services, which accelerates theforegoing virtuous cycle.
Uber’s success can be attributed to constructing such ICT driven disruptive businessmodel.
Business models have been moving from pipes to platforms and we are in the midst oftransformative shift in business design. Platforms allow participants to co-create andexchange value with each other. External developers can extend platform functionality andcontribute back to the infrastructure of the business. Pltform users who act as producers cancreate value on the platform for other users to consume. All have been demonstrated by Uber.
Uber’s disructive business model can be thus appreciated as a leader of transformativeshift in business design by constructing the foregoing platform ecosystem.

27

28
5. Conclusion5.1 Secret of the Uber’s System Success
In light of the disruptive digital-technology-driven business model that Uber has used totrigger a ride-sharing revolution, the institutional sources of the company’s platformecosystem architecture were analyzed.
Aiming at elucidating institutional enablers creating Uber’s platform ecosystem, anempirical analysis of its co-existing development trajectory with taxi was attempted.
Noteworthy findings include:
(i) This co-existing development trajectory corresponds to two-faced nature of ICT thatis behind the emergence of un-captured GDP,
(ii) This emergence can be attributed to a strong substitution from taxi to Uber acceleratedby contrasting vicious cycle between price increase and trips decrease in taxi and avirtuous cycle between price decline and trips increase in Uber,
(iii) Uber’s virtuous cycle can be attributed to ICT’s self-propagating function thatenhances the level of functionality as its diffusion proceeds,
(iv) This self-propagating function plays a vital role in spin-offs from traditional co-evolution to new co-evolution between ICT advancement, paradigm change toincreasing un-captured GDP dependence, and people’s preferences shift to supra-functionality beyond economic value,
(v) This spin-off accelerates further lower cost and higher services, which accelerates theforegoing virtuous cycle, and
(vi) Uber’s success can be attributed to constructing such ICT driven disruptive businessmodel.
5.2 Noteworthy Elements Essential to Well-Functioning Platform EcosystemArchitecture
These findings form the base for the following suggestions supportive to constructing awell-functioning platform ecosystems:
(i) Penetrate the current demand and challenge to meet it (e.g., sharing economy,saturation of taxi business, popularity of smartphone),
(ii) Fully utilize the advancement of ICT, particularly of the Internet (e.g., smartphone,digital payment, big data analysis),
(iii) Construct a co-evolution between sophisticated platform ecosystems andconsolidation of broad stakeholders (e.g., mutual rating system among company, itsdrivers, and their passengers),
(iv) Take care of the platform orchestration for efficiency, development and innovation(e.g., successive innovation for novel services as competitor like Lyft boosting andalso as against movement emerging),
(v) Thereby, creating a novel business model which has never been conceived before.

29
5.3 Implications of Un-captured GDP
The emergence of un-captured GDP emerged by Uber can be attributed to:
(i) People’s preferences shift to sharing economy and advancement of ICT, particularlyof the Internet and subsequent smartphones,
(ii) Better services, with cost and time saving for passengers, high efficient operationwithout additional investment and licenses fees for drivers, and optimal price-settingand market making beyond marginal cost for company through a massive database ondriver and passenger behavior, and
(iii) The paradigm shift from resources to the ecosystem that corresponds to the shift fromcaptured GDP to un-captured GDP.
Thus, Uber’s un-captured GDP can be considered as a consequence of the co-evolutionbetween people’s preferences shift, advancement of ICT and this paradigm shift.
This co-evolution has been leveraged Uber to create new business, to create servicesthrough interactions between stakeholders: company, drivers, and passengers.
All this can be attributed to systems success: platform ecosystem architecture under thecontemporary digital economy.
5.4 Criticism to be Solved
However, as a consequence of the transition to this new dynamism, there remain thefollowing areas of criticism:
(i) Business philosophy for discrimination (e.g., equivalence of services for remote areaswith low population density),
(ii) Safety issues,(iii) Treatment of privacy issues, and(iv) Compliance with labor standards.
Given the noted contrast between co-evolutionary success with institutional systems inhost countries/cities and legal battles with quite a few countries/cities through Uber’s globalexpansion, thesources of this contention as a a consequence of business strategy, platformecosystems design, and institutional systems in host country/city should be further studied.
5.5 Future Works
This analysis has explored a prototype of the analysis of the ICT-driven disruptivebusiness model using the analysis of the co-evolution of three mega-trends that nurtures un-captured GDP.
Furthermore, analyses applying this approach is expected to be undertaken for similardisruptive business models in the (i) music industry, (ii) electronic gaming industry, (iii)printing and publishing industry, and (iv) education. In addition, business areas as fintech,legal and real estate should also be explored.

30
Appendix 1. Data ConstructionAs a consequence of the numerical analysis of newly emerged innovation, elucidation of
Uber’s systems success was a challenge in exploring the dark continent without publishedstatistical data. Therefore, the challenge started from constructing series of reliable statisticaldata which can be summarized as follows. A sensitive analysis of the estimated data wasconducted to ensure the reliability of constructed data, (Appendix 4).
Fig. A1. Estimate of Supplemental Period (2013/6 – 2015/9).
Data were constructed by cross evaluating earlier work listed on the right-hand side anddata/information by TLC and Uber. Supplemental estimate of the missing periods of theabove estimates was based primarily on the spline functions illustrated above.
*1 : Estimated parallel with individual’s medallion prices
*2-1:
*2-2:
*3 :
tAeUD l=2ctbtaUD ++=
tAeTR l=
*5UT(Uber
MP (Medallion prices)1,000 US$(NYC TLC)
2013/6 2015/4
*1
2015/9
*2-1 *2-2UD (Uber dependency)% of total rides
2014/1 2015/3
*4TT (Taxi trips)Trips per day per medallion
2015/3
*3TR (Taxi revenues)Taxi meter revenues per day
*6PT (Taxi prices)Taxi prices per trip
*7PU (Uber prices)
2014/11
TLC: Taxi and LimousineCommission
Certify (2015), TLC, Uber
Hickman (2015), TLC
Hickman (2015), TLC
UT = UD/(1-UD) x TT
TR/TT
Lunden (2014), Uber.
*4 :
*5 :
*6 :
*7 :2ctbtaPU ++=
TT TUD
UDU ´-
=1
TT T
TRP =
tT AeT l=
atT beNU -+
=1

31
Appendix 2. Two-faced Nature of ICT and Un-captured GDP
A2.1 Two-faced Nature of ICT and Subsequent Un-captured GDP
The trend in medallion prices as a consequence of co-existing diffusion trajectory of ataxi with prices increase and that of Uber with prices decrease suggests that this trajectory issubject to the two-faced nature of ICT that is behind the emergence of un-captured GDP.
Source: NYC Taxi and Limousine Commission.
Fig. A2. Trend in Corporate Medallion Prices in NYC and Contributors (2004-2015).
Fig. A3. Two-faced Nature of ICT.
Fig. A4. Anticipating Un-captured GDP.

32 .,.0,.,1
,,0
.,.1,1
),0(,0
jiIjj
J
Iii
I
bbThereforepJWhenN
bNb
NNpJWhen
NpIWhenNbb
NpIWhen
>>=¥=-
=-=+
-==
=¥=-==+
»==
eeee
eee
A2.2 ICT Prices Trajectory and Two-faced Nature
(1) Modified Bi-logistic Growth
ICT prices can be depicted by the following modified bi-logistic growth as illustrated in Fig.A5:
Iai
Jaj
I ij ebN
ebNp
++
+= - 11
where I: ICT stock, J: dependency on the Internet, N: carrying capacity, jiji bbandaa ,, : diffusion velocity of I and J. 5
Iai
Jaj
I ij ebN
ebNp
++
+= - 11
Fig. A5. Modified Bi-logistic Growth due to Two-faced Nature of ICT.
Equation (A1) can be developed as follows:
01
,01
,01
)1)(1(1
1
1111
)1(1
)1(11
1111
11
1
1
11
1
11
1
2
12
)1)(1(11
>-
-=<-
-=<-++
=-
+++=
++º-
--
+-
+++=
--
-+-
--+
-»-
--
--+
-=-
=-
+++
-=-
+++
-+=
+++
++»
+++
++=
++
+++=
-
-
--
-
--
-
-
-
ji
ii
ji
jj
ji
ji
ji
jiji
ji
ii
ji
jj
ji
jiji
iji
ij
ji
j
ji
ji
ji
Iai
ji
Jaj
ji
ji
Np
I
Iai
Jajji
jiI
Iai
Jajji
jiIa
iJa
jji
Iai
Jaj
JaIaji
Iai
Jaj
Iai
Jaj
Jaj
Iai
Iai
JajI
bbba
bbba
bbbb
bbbbbb
where
IJIbb
baJbb
babb
bbbb
Iabb
bJabb
bbbbb
bbeb
bbeb
bbbb
pNN
ebebbbbb
Np
ebebbbbb
ebebbbebeb
eebbebebebeb
ebebebeb
Np
ij
I
ij
ijij
ij
jiij
ij
ji
ij
gba
gba
5 Since the Internet has been playing a leading role in the whole ICT and providing significantimpacts on the diffusion trajectory of ICT, carrying capacity of logistic growth in I and reverselogistic growth in J as well as their diffusion tempo ( JaandIa ji
) were treated as behaved in the similar
way (a i I=a jJ).
(A1)
(A2)
(A3)
Uber Taxi
PI

33
In case of a co-existing diffusion of taxis and Uber, J and I correspond to UT (Uber trips)and TT (taxi trips) and Eq. (A2) can be represented as Table A1.
Table A1 Co-existing Trajectory of Taxis and Uber in NYC (Jun. 2313 – Sep. 2015)
35.1970.0.178.0103.0005.0355.1 2 DWRadjDTUMPN
NTT ++--=
-
Where N (carrying capacity) = 2247, (Table 5) MP: medallion prices, D: 2014. May, Aug., Sep. = 1.
Figures in parenthesis indicate t-statistics: all significant at the 1% level.
This demonstrates that coexistence of taxi and Uber is subject to two-faced nature of ICT.
(2) Diffusion Coefficient
Coefficients governing modified bi-logistic growth in Eq. (A1) can be identified asfollows (here J and I correspond to UT and TT):
hh
bgg
aaa
haahhh
hahaahh
ahhah
hha
gbhh
gb
gb
<<<>--=>-=-
×=
>-<<
>-
+-++-+==>
-+-++-+
=
=+-+---
+++-=
<<<<×-=º××-==×-=-=
jijiij
jjii
jii
ji
iji
iii
ii
ijiijjii
j
ii
jj
bbbbbb
abbb
bba
bbfornecessaryisas
bbb
bbb
bb
bbasIJbb
IJbThereforeJaIa
bb
JI
baba
,1,1)0()1()0()1(1
.0,1.0
)0()1(2
)1)(1(4)1()1()0(
)1(2)1)(1(4)1()1(
0)1()1()1(1
)1(1
)1(,)(
22
22
2
Q
Thus, co-existing trajectory of taxis and Uber as demonstrated in Table A1 can bedemonstrated as follows:
TT TUI eeP 33.020.0 31.01
224703.01
2247-+
++
=
* Demonstrate the state in Sep. 2015 when h = 0.08.
This modified bi-logistic growth demonstrates contributors to medallion prices levelillustrated in Fig. A2.
(A4)
(A5)
(A6)*
(-3.12) (-2.96) (8.54) (5.42)

34
(3) Trip Elasticity to Prices
The marginal contribution of Uber and taxis dependency to medallion prices change canbe depicted as follows:
)1(1
),1(1 N
ppaIp
ebNp
Nppa
Jp
ebNp I
IiI
Iai
II
IjI
Jaj
I ij-=
¶¶
Þ+
=--=¶¶
Þ+
= - (A7)
Thus, the elasticity of Uber and taxi dependency to prices elasticity can be depicted asfollows:
0)1(
0)1(
>++
=-=׶
¶º
<++
-=--=׶
º
IJIa
NpIa
pI
Ip
IJJa
NpJa
pJ
Jp
iIi
I
Ii
jJj
J
Jj
gbak
gbak
This demonstrates that contrary to taxis prices increase as their trips increase, Uber pricesdecrease as its trips increase leading a virtuous cycle for Uber. All this support the analysis ofinstitutional sources being behind the emergence of un-captured GDP.
(A8)

35
A2.3 Prospect of Un-captured GDP Nurtured by Uber
As reviewed in Fig. 8, the magnitude of un-captured GDP can be measured by the balancebetween actual medallion prices and medallion prices without Uber.
While the former can be estimated by Eq. A6, the latter can be estimated by Table A2.Table A2 demonstrates how the trend in medallion prices without Uber can be estimated bothby logistic growth and parabolic growth. The latter provides a higher estimate.
Fig. A7 demonstrates prospect of un-captured GDP emerged by Uber estimated by thepreceding approach.
Fig. A6. Estimate of Uber’s Impact on Medallion Prices Decline(Jan. 2004 - Sep. 2015).
Table A2 Estimates of Medallion Prices (Jan. 2004 - Jun. 2013)
Logistic growth
Estimate t-value adj. R2
N 2247.11 7.23 0.976a 0.02 14.21b 6.36 7.21
Parabolic growth
Estimate t-value adj. R2
a 288.30 25.80 0.977b 5.31 11.91c 0.02 5.42
Y: Medallion prices, N: Carrying capacity, t: Monthly trend, a, b, c: Coefficients
Fig. A7. Estimate of Un-capturedGDP Anticipated by Uber(May. 2014 - May. 2032).
atbeNY -+
=1
2ctbtaY ++=

36
A2-4 Timing when Uber Overcame Chasm
Chasm is a deep trench compelling new ventures start-up (Moore, 1991) [22].
It’s timing in the logistic growth diffusion trajectory can be depicted as follows(Watanabe et al., 2011) [33]:
abt )32ln( -
= (A9)
where logistic growth diffusion trajectory is: atbeNY -+
=1
In case of the following logistic growth within a dynamic carrying capacity (LGDCC)diffusion trajectory, a and b in the above equation can be approximated as follows (Watanabeet al., 2009) [31]:
÷÷ø
öççè
æ
-××=-=
-=
aa
kkkb
bbbbbaa
abt
11exp'),1(',
'')32ln( (A10)
Provided that Uber has been developing in line with the LGDCC diffusion trajectory asdemonstrated in Table 6 in NYC from its launching in May 2011 (t = 1), t in eq A10 can be
t = 21.5 (March 2013).
This demonstrates that Uber has overcome the Chasm at the timing just before its sharereached 10% in June 2013.
taaa
batk
k
k
k ebeNY -
-- ++
=/11
37
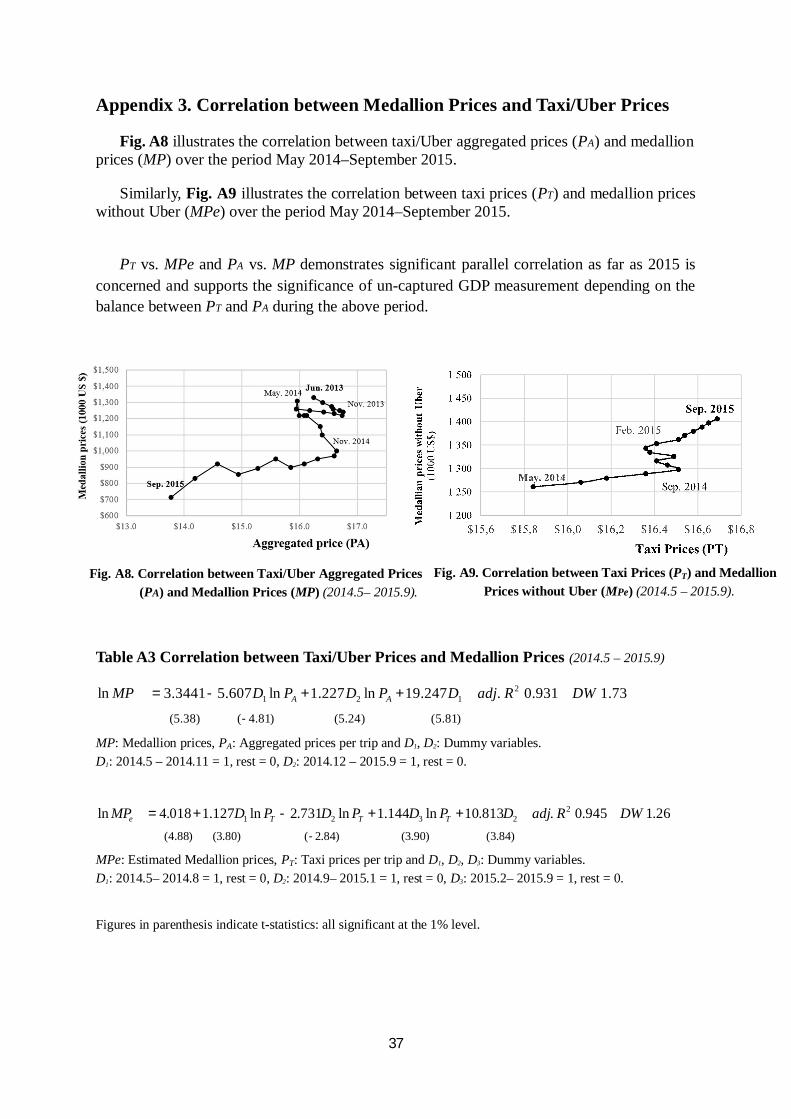
Appendix 3. Correlation between Medallion Prices and Taxi/Uber Prices
Fig. A8 illustrates the correlation between taxi/Uber aggregated prices (PA) and medallionprices (MP) over the period May 2014–September 2015.
Similarly, Fig. A9 illustrates the correlation between taxi prices (PT) and medallion priceswithout Uber (MPe) over the period May 2014–September 2015.
PT vs. MPe and PA vs. MP demonstrates significant parallel correlation as far as 2015 isconcerned and supports the significance of un-captured GDP measurement depending on thebalance between PT and PA during the above period.
Table A3 Correlation between Taxi/Uber Prices and Medallion Prices (2014.5 – 2015.9)
)81.5()24.5()81.4()38.5(
73.1931.0.247.19ln227.1ln607.53441.3ln 2121
-
++-= DWRadjDPDPDMP AA
MP: Medallion prices, PA: Aggregated prices per trip and D1, D2: Dummy variables.D1: 2014.5 – 2014.11 = 1, rest = 0, D2: 2014.12 – 2015.9 = 1, rest = 0.
)84.3()90.3()84.2()80.3()88.4(
26.1945.0.813.10ln144.1ln731.2ln127.1018.4ln 22321
-
++-+= DWRadjDPDPDPDMP TTTe
MPe: Estimated Medallion prices, PT: Taxi prices per trip and D1, D2, D3: Dummy variables.D1: 2014.5– 2014.8 = 1, rest = 0, D2: 2014.9– 2015.1 = 1, rest = 0, D3: 2015.2– 2015.9 = 1, rest = 0.
Figures in parenthesis indicate t-statistics: all significant at the 1% level.
Fig. A8. Correlation between Taxi/Uber Aggregated Prices (PA) and Medallion Prices (MP) (2014.5– 2015.9).
Fig. A9. Correlation between Taxi Prices (PT) and Medallion Prices without Uber (MPe) (2014.5 – 2015.9).

38
Appendix 4. Sensitivity of Uber Trips Estimate
A4.1 Estimate without and with Spline Interpolation
In analyzing Uber diffusion trajectory (4.3 (1) and (2)), given the sensitive impacts offluctuation on the trajectory formation within the limited samples, a comparative analysis wasattempted by comparing Uber trips estimate with and without spline interpolation as shown inFig. A10 and Table A4. The function used for the spline interpolation was based on thelogistic growth function (Appendix 1).
Fig. A10. Comparison of Uber Trips Estimate (Jun. 2013 – Sep. 2015).
UT: Uber trips estimated by taxis trips and Uber dependency (Appendix 1)UT2: Uber trips estimate with spline interpolation
Table A4 Comparison of Uber Trips Estimate (Jun. 2013 – Sep. 2015).

39
A4.2 Effects of the Estimates of Uber-Driven Un-captured GDP(1) Un-captured GDP Emerged by Uber
Sensitivity analysis of the effects of the estimated data was conducted by comparing theeffects of un-captured GDP measurement as demonstrated in Fig. A11. The resultdemonstrates no substantial differences between estimates with and without splineinterpolation.
Fig. A11. Trends in Taxi Prices and Aggregated Prices in NYC (Jun. 2013 – Sep. 2015).
Aggregated prices PA are measured by the following equation:
(2) Increase in the Emergence of Un-captured GDP Emerged by UberSimilarly, no substantial differences in an increase in the emergence of un-captured GDP
between estimated data with and without spline interpolation were confirmed as demonstrated inFig. A12.
Fig. A12. The trend in Un-captured GDP Emerged by Uber in NYC (Jun. 2013 – Sep. 2015).
13,514,014,515,015,516,016,517,017,518,0
Jun-
13Ju
ly-1
3A
ug-1
3Se
p-13
Oct
-13
Nov
-13
Dec
-13
Jan-
14Fe
b-14
Mar
-14
Apr
-14
May
-14
Jun-
14Ju
ly-1
4A
ug-1
4Se
p-14
Oct
-14
Nov
-14
Dec
-14
Jan-
15Fe
b-15
Mar
-15
Apr
-15
May
-15
Jun-
15Ju
ly-1
5A
ug-1
5Se
p-15
Un-captured
Average prices (US$/trip)
Taxi prices
Aggregated prices
2014/6 2015/1
PT
PA2
PA
With spline interpolation
Without spline interpolation
TT
TUTTA UT
UPTPP+
×+×=
-1,0-0,50,00,51,01,52,02,53,0
Jun-
13Ju
ly-1
3A
ug-1
3Se
p-13
Oct
-13
Nov
-13
Dec
-13
Jan-
14Fe
b-14
Mar
-14
Apr
-14
May
-14
Jun-
14Ju
ly-1
4A
ug-1
4Se
p-14
Oct
-14
Nov
-14
Dec
-14
Jan-
15Fe
b-15
Mar
-15
Apr
-15
May
-15
Jun-
15Ju
ly-1
5A
ug-1
5Se
p-15
Un-captured GDP (US$/trip)
Un-captured GDP
ratioTU
T
T=a
)(1
11 1 UT
UTT
TT
UTTTTAT
PPPPP
UTPUPTPPP
-+
=+
×+-=
+×+×
-=-=
aaa
where
Un-captured GDP withoutspline interpolationUn-captured GDP2 withspline interpolation

40
A4.3 Effects of Uber’s Development Trajectory Estimate
While Uber’s development trajectory, estimated using trips trend, without spline
interpolationdemonstrates the slight possibility of self-propagation by the LGDCC. Splineinterpolation demonstrates explicit self-propagation by demonstrating the significance of theLGDCC.
While this difference does not have any significant effects on aggregated prices and un-captured GDP estimates, the effects on self-propagation can be attributed to a slightly higherpace (1-9%) of trips estimate after March 2015. This suggests that an optimal and not toorapid development pace seems essential for incorporating the self-propagating function.
Table A5 Estimates of Taxi and Uber’s Development Trajectories in NYC by LGDCC
Nk a b ak bk adj. R2
Taxi(2004/1-2013/6)
2247.12(6.42)
0.017(12.61)
6.364(6.63)
0.439(0.00x)
10.30(0.00x) 0.976
Uber(2013/6-2015/9)
UT144.13(2.95)
0.123(12.68)
25.800(3.29)
0.0001(0.10x)
3.04(1.29*6) 0.992
UT2119.27(41.41)
0.121(36.67)
49.650(11.13)
0.016(2.42*3)
0.200(1.43*5)
0.999
Taxi: based on medallion prices (Fig. 8), Uber: based on trips (Fig. 4) without spline interpolation (UT) andwith spline interpolation (UT2) (See Table A4).
LGDCC: Logistic growth with dynamic carrying capacity,Figures in parenthesis indicate t-statistics: all significant at the 1% level except *3: 5 %, *5: 15 %, *6: 20 %, x:non-significant.
(eq. (4)).taaa
batk
k
k
k ebeNY -
-- ++
=/11

41
Appendix 5. Uber’s Expansion in 375 Cities Worldwide (America as of January 2016)
North America North America North America North America Central and SouthAmerica
Abilene Fayetteville, NC Miami San Luis Obispo BarranquillaAkron Flagstaff Midland-Odessa Santa Barbara Belo HorizonteAlbuquerque Flint Milwaukee Santa Fe BogotáAmarillo Florida Keys Minneapolis - St. Paul Sarasota BrasiliaAmes Fort Myers-Naples Mobile, AL Savannah-Hilton Head BucaramangaAnn Arbor Fort Wayne Modesto Seattle Cali - ColombiaAsheville, NC Fresno Monterrey South Bend CampinasAthens Gainesville Montreal Spokane CartagenaAtlanta Georgia Coast Myrtle Beach Springfield, IL CucutaAugusta Grand Rapids NW Indiana St Louis GoianiaAustin Greater Maine Nashville State College IbaguéBakersfield Greater Maryland New Hampshire Stillwater LimaBaltimore Green Bay New Jersey Tacoma MedellínBaton Rouge Greenville, SC New Jersey (Shore) Tallahassee MontevideoBeaumont Guadalajara New Orleans Tampa Bay Panama, PanamaBellingham Hamilton New York City Taos Porto AlegreBirmingham, AL Hampton Roads Niagara Region Tijuana Rio De JaneiroBoise Harrisburg Ocala, FL Toledo San Jose, Costa RicaBoston Honolulu Oklahoma City Toluca SantiagoBowling Green, KY Houston Omaha Topeka Santo DomingoBurlington Indianapolis Orange County Toronto São PauloCentral Atlantic Coast, FL Inland Empire Orlando Tucson VillavicencioChampaign Jackson Ottawa TulsaCharleston, SC Jacksonville Outer Banks, NC TuscaloosaCharlotte Kalamazoo Oxford Vancouver, WACharlottesville-Harrisonburg Kansas City Palm Springs VenturaChattanooga Killeen Pensacola, FL WacoChicago Kingston Peoria & Bloomington-Normal Washington D.C.Cincinnati Kitchener-Waterloo Philadelphia Western MACleveland Knoxville Phoenix WichitaCoeur D'Alene Lafayette, LA Piedmont Triad, NC Wilkes-Barre ScrantonCollege Station Lancaster, PA Pittsburgh Wilmington, NCColumbia, MO Lansing Portland WindsorColumbia, SC Las Cruces Portland, ME WorcesterColumbus Las Vegas Puebla YumaConnecticut Lawrence Quad Cities the HamptonsCorpus Christi Lehigh Valley Quebec CityDallas-Fort Worth Leon QueretaroDayton Lexington Raleigh-DurhamDelaware Lincoln Reading, PADenver Little Rock RenoDes Moines London, Ont Rhode IslandDetroit Los Angeles RichmondEastern Idaho Louisville Roanoke-BlacksburgEastern North Carolina Lubbock RockfordEdmonton Madison SacramentoEl Paso Manhattan Salt Lake CityErie Maui San AntonioFargo Memphis San DiegoFayetteville, AR Mexico City San Francisco Bay Area

42
Appendix 5. Uber’s Expansion in 375 Cities Worldwide (2) (Other countries than America as of January 2016)
Europe Europe East Asia South Asia Australia andNew Zealand
Amsterdam Saint Petersburg Beijing Ahmedabad AdelaideAthens, GR Sheffield Changsha Ajmer AucklandBasel Sochi Chengdu Bangalore BrisbaneBelfast Sofia Chongqing Bhubaneswar CanberraBerlin Stockholm Dalian Chandigarh GeelongBirmingham, UK Strasbourg Foshan Chennai Gold CoastBordeaux Tallinn Guangzhou Coimbatore MelbourneBratislava Toulouse Guiyang Colombo Mornington PeninsulaBristol Trojmiasto Hangzhou Guwahati PerthBrussels Vienna Hong Kong Hyderabad Sunshine CoastBucharest Vilnius Incheon Indore SydneyBudapest Warsaw Jinan Jaipur WellingtonCopenhagen Wroclaw Macau JodhpurDublin Zagreb Nanjing KochiEdinburgh Zurich Ningbo KolkataEkaterinburg Qingdao MangaloreFlorence Middle East Seoul MumbaiGeneva Abu Dhabi Shanghai MysoreGenoa Amman Shenzhen NagpurGlasgow Baku Suzhou NashikGothenburg Beirut Taichung New DelhiHelsinki Doha Taipei PuneIstanbul Dubai Tianjin SuratKazan Eastern Province, KSA Tokyo ThiruvananthapuramKrakow Jeddah Wuhan UdaipurLausanne Manama Xi'An VadodaraLeeds Riyadh Xiamen VisakhapatnamLille Tel Aviv YantaiLisbonLondon Africa South East AsiaLyon Alexandria BaliManchester Cairo BandungMarseille Cape Town BangkokMerseyside Casablanca CebuMilan Durban HanoiMinsk Johannesburg Ho Chi Minh CityMoscow Lagos IpohMunich Nairobi JakartaNantes Port Elizabeth Johor BahruNewcastle Kuala LumpurNice ManilaNovosibirsk PenangOslo SingaporeParis SurabayaPortoPortsmouthPoznanPragueRomeRostov-On-Don
Source: Uber.com

43
References
[1] Adner, R., 2012. The Wide Lens. Portfolio/Penguin, New York.[2] Avital, M., Andersson, M., Nickerson, J., Sundararajan, A., Alstyne, M.V. and
Verhoeven, D., 2014. AIS Electronic Library, Atlanta, 1-7.[3] Badger, E., 2014. Taxi Medallions have been the Best Investment in America for Years:
Now Uber may be Changing That. The Washington Post, 20 Jun. 2014.[4] Baiyere, A. and Salmela, H., 2015. Wicked yet Empowering: When IT Innovations are
also Disruptive Innovations. AIS Electronic Library (AISel).[5] Belk, R., 2014. You are What You can Access: Sharing the Collaborative Consumption
Online. Journal of Business Research 67, 1595-1600.[6] Certify, 2015. Sharing the Road: Business Travelers Increasingly Choose Uber. A
Ground Transportation Sharing Economy Report. 2015 Q1.[7] Cohen, B., Kietzmann, J., 2014. Ride On! Mobility Business Models for the Sharing
Economy. Organization & Environment 27 (3), 279-296.[8] comScore, 2013-2015. Reports on the US Smartphone Subscriber Market Share.
comScore, Reston, Virginia.[9] Council for Science, Technology and Innovation, 2016. The 5th Science and Technology
Basic Plan. Cabinet Office, Government of Japan, Tokyo.[10] Cowen, T., 2011. The Great Stagnation. Dutton, New York.
[11] Ehret, M., 2015. The Zero Marginal Cost Society: The Internet of Things, theCollaborative Commons, and the Eclipse of Capitalism. The Journal of SustainableMobility 2 (2) 67-70.
[12] Frier, A., 2015. Uber Usage Statistics and Revenue. Business of Apps, 14 Sep.2015.
[13] Hickman, J., 2015. How Uber is Actually Killing the Value of a New York City TaxiMedallion. The Street Quant Rating, 26 May. 2015.
[14] Horpedahl, J., 2015. Ideology Uber Alles?: Economics Bloggers on Uber, Lyft, andOther Transportation Network Companies. Econ Journal Watch 12 (3), 360-374.
[15] Isaac, E and Davis U.C., 2014. Disruptive Innovation: Risk-Shifting and Precarity in theAge of Uber. BRIE Working Paper 2014-7.
[16] King, S.P., 2015. Sharing Economy: What Challenges for Competition Law? Journal ofEuropean Law & Practice 6 (10), 729-734.
[17] Koopman, C., Mitchell, M. and Thierer, A., 2014. The Sharing Economy and ConsumerProtection Regulation: The Case for Policy Change. The 8 Journal of Business,Entrepreneurship and the Law 2014-2015, 529-540.
[18] Lovins, H. and Cohen, B., 2011. Climate Capitalism in the Age of Climate Change. Hill& Wang, New York.
[19] Lowrey, A., 2011. Impacts of the Great Stagnation. New York Times.
[20] Lunden, I., 2014. Uber Rides High, Dominates Transport App Revenues andDownloads up to November. 7PARK DATA, 24 Nov. 2014.

44
[21] Meyer, P.S. and Ausbel, J.H., 1999. Carrying Capacity: A Model with LogisticallyVarying Limits. Technological Forecasting and Social Change 61 (3), 209-214.
[22] Moore, G.A., 1999. Crossing the Chasm: Marketing and Selling Technology Productsto Mainstream Customers. Harper Business Essentials, Harper Collins, New York.
[23] Rifkin, J., 2014. The Zero Marginal Cost Society: The Internet ofThings, The Collaborative Commons, and The Eclipse of Capitalism. PalgraveMacmillan, New York.
[24] Schlze, A., MacDuffie, J.P. and Taube, F.A., 2015. Introduction:Knowledge Generation and Innovation Diffusion in the Global AutomotiveIndustry - Change and Stability during Turbulent. Industrial and Corporate Change.Oxford University Press, Oxford.
[25] Silverstein, S., 2014. These Animated Charts Tell You Everything About Uber Prices in21 Cities. Business Insider Transportation, 16 Oct. 2014.
[26] Stead, J.G. and Stead, W.E., 2013. The Co-evolution of Sustainable StrategicManagement in the Global Marketplace. Organization & Environment 26 (2), 162-183.
[27] Stone, B., 2015. Uber is Winning over America’s Expense Accounts. Bloomberg, 2015.
[28] The Economist, 2013. All Eyes on the Sharing Economy. The Economist 406, 13-15.[29] Uber, 2015. A Brief History of Uber. Techcrunch.com/gallery/a-brief-history-of-uber.
[30] Watanabe, C., Kondo, R., Ouchi, N., Wei, H. and Griffy-Brown, C., 2004. InstitutionalElasticity as a Significant Driver of IT Functionality Development. TechnologicalForecasting and Social Change 71 (7), 723-750.
[31] Watanabe, Lei, S. and Ouchi, N., 2009. Fusing Indigenous Technology Developmentand Market Learning for Higher Functionality Development: An Empirical Analysis ofthe Growth Trajectory of Canon Printers. Technovation 29 (2), 265-283.
[32] Watanabe, C., Moriyama, K. And Shin, J.H., 2009. Functionality DevelopmentDynamism in a Diffusion Trajectory: A Case of Japan’s Mobile Phones Development.Technological Forecasting and Social Change 76 (6), 737-753.
[33] Watanabe, C., Shin, J.H., Heikkinen, J., Zhao, W. and Griffy-Brown, C., 2011. NewFunctionality Development through Follower Substitution for a Leader in OpenInnovation. Technological Forecasting and Social Change 78 (1), 116-131.
[34] Watanabe, C., Naveed, K. and Zhao, W., 2014. New Paradigm of ICT Productivity:Increasing Role of Un-captured GDP and Growing Anger of Consumers. Technology inSociety 41, 21-44.
[35] Watanabe, C., Naveed, K. and Neittaanmäki, P., 2015. Dependency on Un-capturedGDP as a Source of Resilience Beyond Economic Value in Countries with AdvancedICT Infrastructure – Similarity and Disparities between Finland and Singapore.Technology in Society 42, 104-122.
[36] Watanabe, C., Naveed, K., Neittaanmäki, P. and Tou, Y., 2016. Operationalization ofUn-captured GDP: The Innovation Stream Under New Global Mega-trends. Technologyin Society 45, 58-77.
[37] Winterhalter, S., Wecht, C.H. and Kreig, L., 2015. Keeping Reins on the SharingEconomy: Strategies and Business Models for Incumbents. St. Gallen MarketingReview 32 (4), 32-39.

45
Authors Curriculum Vitae
Chihiro Watanabe graduated from University of Tokyo, Japan and is currently ProfessorEmeritus of Tokyo Institute of Technology, Visiting Professor of National University ofSingapore, Research Professor of University of Jyväskylä, Finland and also a Research Scholar,International Institute for Applied Systems Analysis (IIASA). ([email protected])
Kashif Naveed graduated with Bachelor’s degree in Computer Science from HamdardUniversity Karachi, Pakistan, Master of Science in Economics and Business Administration fromUniversity of Jyväskylä, Finland, and currently doing his Ph.D. in Economics and BusinessAdministration from University of Jyväskylä, Finland. ([email protected])
Pekka Neittaanmäki graduated from the University of Jyväskylä and is currently a Dean of theFaculty of Information Technology, University of Jyväskylä, Finland.([email protected])

Informaatioteknologian tiedekunnan julkaisujaNo. 29/2016
Editor: Pekka NeittaanmäkiCovers: Jarno Kiesiläinen
Copyright © 2016Chihiro Watanabe, Kashif Naveed, Pekka Neittaanmäki ja Jyväskylän yliopisto
ISBN 978-951-39-6929-5 (verkkoj.) ISSN 2323-5004
Jyväskylä 2016