clustered networks protect cooperation against ...gspencer/pub/networksci.pdf · of fast di usion...
TRANSCRIPT

Clustered Networks Protect Cooperation
Against Catastrophic Collapse
Gwen Spencer∗
Smith College, Northampton, MA 01063, USA
Abstract
Assuming a society of conditional cooperators (or moody conditional cooperators), this computationalstudy proposes a new perspective on the structural advantage of social network clustering. Previous workfocused on how clustered structure might encourage initial outbreaks of cooperation or defend againstinvasion by a few defectors. Instead, we explore the ability of a societal structure to retain cooperativenorms in the face of widespread disturbances. Such disturbances may abstractly describe hardshipslike famine and economic recession, or the random spatial placement of a substantial numbers of puredefectors (or round-1 defectors) among a spatially-structured population of players in a laboratory game,etc.
As links in tightly-clustered societies are reallocated to distant contacts, we observe that a societybecomes increasingly susceptible to catastrophic cascades of defection: mutually-beneficial cooperativenorms can be destroyed completely by modest shocks of defection. In contrast, networks with higherclustering coefficients can withstand larger shocks of defection before being forced to catastrophically-low levels of cooperation. We observe a remarkably-linear protective effect of clustering coefficient thatbecomes active above a critical level of clustering. Notably, both the critical level and the slope of thisdependence is higher for decision-rule parameterizations that correspond to higher costs of cooperation.Our modeling framework provides a simple way to reinterpret the counter-intuitive and widely-citedhuman experiments of Suri and Watts (2011) while also affirming the classical intuition that networkclustering and higher levels of cooperation should be positively associated.
Keywords: cooperation, clustering, threshold models, social influence, contagion, repeated game-play.
1 Introduction and Motivation
The ubiquity of short average path lengths in social networks is often explained as reflecting the advantageof fast diffusion of information (starting from the foundational work of Granovetter (1973)). In graphs withlow density, “weak ties” that reach to otherwise-distant members of the network are key to obtaining shortaverage path lengths, giving rise to a “small world” property (Granovetter (1973); Watts & Strogatz (1998)).A model in which all utility is gained through quick access to information would predict a strong preferencefor these longer ties. At the same time, observations of significant network clustering (which requires manyshort ties to neighbors of neighbors) are also ubiquitous in real data about social networks. In fact, cluster (orcommunity) detection is a very active area of contemporary research, For example, see (Fortunato (2010));(Leskovec et al. (2010)), and many others. What advantages might contribute to the popularity of shortties?
∗Corresponding author: Gwen Spencer. Address: Burton Hall, Smith College. Northampton, MA 01063. Phone: 413-585-3830. Fax: (413) 585–3786. [email protected]. This research did not receive any specific grant from funding agencies in thepublic, commercial, or not-for-profit sectors.
1

While some factors that encourage clustering are circumstantial (e.g. it is easier to meet friends of friends)there is also a recent interest in ways that social network clustering may itself be utility-providing.1 Movingaway from well-mixed populations, extensive classical study in evolutionary biology and evolutionary gametheory has posited that a stable (or semi-stable) interaction networks could promote cooperation amongself-interested individuals. Nowak et al. (1994) conducted early computational work in lattices (see Nowak(2006) and Roca et al. (2009) for more comprehensive surveys). Sociologists have studied “outbreaks ofcooperation” (Glance & Huberman (1993)): could more-clustered network structure foster sudden transi-tions to widespread cooperation (Watts & Strogatz (1998))? Since, “many of the benefits sought by livingthings are disproportionately available to cooperating groups” (Axelrod & Hamilton (1981)) clustered socialstructure would then yield advantage, and might be interpretable as strategic.
We conduct a computational study to explore another source of utility that can stem from highly-clusteredsocial networks. Suppose that a society starts from a state of widespread cooperation: how robust is thiswidely-cooperative equilibrium against a wide rash of defections? Consider acts of theft that are unlikely tobe discovered. In times of plenty, the cooperative norm of not stealing in such cases may be comfortablymaintained. In contrast, during times of pressing hardship (e.g., depression or famine), individuals maybe increasingly likely to weigh the financial benefits of stealing above the (often non-monetary) benefits ofadhering to a cooperative norm of not stealing. If thefts are no longer rare, and individuals are conditionalcooperators or moody conditional cooperators,2 how will behavior evolve in the wider society?
This unobserved-theft motivation references a common game-theoretic interpretation of the decision toconditionally cooperate as the outcome of a cost-benefit calculation. In particular, each individual weighs a(usually fixed) cost of cooperation against a benefit of cooperation that is non-decreasing in the fraction of(nearby) cooperators. In economics, such a benefit function is said to exhibit a network effect. Our questionabout robustness of cooperative norms supposes that for various external reasons, the cost-benefit calculationsof a sizable number of individuals is temporarily perturbed so that they choose to defect in circumstanceswhere they might have typically cooperated. In addition to this abstract economic argument about howspontaneous temporary defections might emerge we mention several behavioral phenomena documented inrepeated networked game play that could threaten long-term levels of cooperation in similar ways. First,in human experiments, the uncontrolled spatial placement of large percentages of round-1 defectors andeven the pure defectors from Grujic et al. (2010) functions as a randomly-distributed shock to cooperation:can long-term cooperation thrive in the network despite these “bad actors” entering the game as defectors?Secondly, networked human experiments have documented exploration behavior (players test to gauge whatrewards are available from temporarily switching to defection) (Traulsen et al. (2010)). Our question iswhether such perturbations (or shocks) are less damaging to societies that are structured in special ways.
Can the structure of a society or organization protect against a complete collapse of cooperative norms?If so, what advantages might this afford? Societies that retain a stable cooperative core despite occasionalmodest cascades of defection may regrow widespread cooperative norms more easily and quickly, effectivelymaking cooperative norms more resilient and leading to a higher stream of benefits over time. How doesreallocation of local short links to long weak ties impact the ability of a social network to retain at leastsome cooperative foundation?
Relationship to Existing Literature. The “outbreaks of cooperation” or cooperation as a “social conta-gion” modeling framework draws on ideas from epidemiology, assuming that the society initially exists in awidely-uncooperative state before cooperative behavior arises (and begins to spread) (Fowler & Christakis(2010); Centola & Macy (2007)). This emphasis extends classical (pre-network) exploration of the initialviability of cooperative strategies (Axelrod & Hamilton (1981)). In this framework, the question is whethercooperation (arising from a few acts of spontaneous altruism) can invade a society of defectors, and in
1Behaviors which are utility-providing may emerge as a result of conscious rational choice, or unconsciously as a result ofsome kind of evolutionary selection at the individual, family, or group level.
2They cooperate or contribute when others they observe also cooperate or contribute, as described in modeling work (Gra-novetter (1978); Glance & Huberman (1993)), and empirical studies (Fowler & Christakis (2010); Suri & Watts (2011)). Themoody variant also permits dependence on the player’s own past actions (see, for example, Grujic et al. (2010), Gracia-Lazaroet al. (2012), Grujic et al. (2014)) and (Horita et al. (2017)).
2

particular, how the social structure of the society might encourage or discourage such an invasion.In contrast, behavioral studies seem to suggest that cooperation (arising locally) is a rather natural state
for groups of humans. For example, empirical studies in behavioral economics show that humans learn tocooperate quite successfully when a game is played repeatedly in small groups (van Huyck et al. (1990);Knez & Camerer (2000); Weber (2006)). In fact, even types of games that end divisively if played froma cold start can be played cooperatively by a group that has previous experience playing cooperativelytogether (Cason et al. (2012); Knez & Camerer (2000)). Remarkably, cooperative play can even spill overinto play with different groups of partners (Cason et al. (2012); Fowler & Christakis (2010)). Experimentsalso indicate that, even for divisive weakest-link games (where payoffs are equal to the contribution of thestingiest contributor), large cooperative groups can be created by slowly adding new members to groups thathave been observed successfully cooperating (Weber (2006)). Weber’s experiments in (Weber (2006)) weremotivated by the lack of prior lab-based evidence replicating the wide-scale cooperation plainly apparentin real-world observations: large groups like “firms and communities-where coordination plays a crucialrole...have managed to coordinate successfully.” Inverting the “outbreaks” modeling framework, considerthat an extensive social network in a widely-cooperative state may emerge from long ties being formedbetween many small communities where cooperation arose (and stabilized) spontaneously, or by adding newmembers slowly to increase the size of successfully-cooperating groups. Once a large increasingly-connectedcooperative society is formed, can this widespread cooperation be maintained?
Mirroring the classical study of how spontaneous acts of personal altruism might seed outbreaks of co-operation, both theoretical and empirical lines of reasoning highlight the plausibility of spatially-distributedacts of defection in the midst of a highly cooperative society. Above we’ve mentioned an abstract economicargument about how depression or famine might cause temporary shifts in the cost-benefit calculations ofsome members of a society (increasing the relative cost of cooperation, and thus introducing defections).We’ve also noted empirical observations of exploration strategies where a player occasionally chooses defec-tion while surrounded by cooperating neighbors (an exploitation behavior observed in repeated Prisoner’sDilemma games), and the existence of substantial populations of players who enter controlled laboratorygames by defecting in round 1 or even applying pure defection strategies for the duration of a repeatednetwork game. Defections in the presence of widespread cooperation may even be unintentional. In thebehavioral literature, researchers consider the situation of cooperative intentions being interrupted by in-advertent defections very plausible: extensive human experiments have explored how players respond whenboth a neighbor’s intention (to cooperate) and a randomly-realized action are observed (Rand et al. (2015)).The finding is that subjects behave as if defections which arise without the malicious intent of the opposingplayer are less sanction-able. Given a broad range of mechanisms that might introduce many spatially-distributed defections across a cooperative society, are some social structures better at avoiding catastrophiccollapse of cooperation in the face of these large disturbances?
Our Contribution. Our computational study considers a fully-cooperative network of conditional co-operators that is hit by a randomly-spatially-distributed shock of defection. Under our basic ConditionalCooperation (CC) Model individuals apply a widely-studied threshold decision rule to determine when tocooperate (as in (Granovetter (1978); Glance & Huberman (1993); Watts & Strogatz (1998); Watts (1999))).Simply, if an h-fraction of their neighbors cooperated in the previous time step, then the individual will co-operate in the next time step. If an individual is shocked with defection then they defect for a short periodof time regardless of neighbor behavior. What is the long-term impact of such a defection shock on thesociety-wide level of cooperation? We focus on what size of defection shock is sufficient to cause catastrophiccollapse of initially widespread norms of cooperation.
We repeat our analysis for a generalization of the basic CC model, the Heterogeneous Moody ConditionalCooperation (MCC) Model. This extended model was developed and refined across a growing body ofcompelling behavioral studies on repeated Prisoner’s Dilemma (e.g. see Grujic et al. (2010), Gracia-Lazaroet al. (2012), Grujic et al. (2014)) and Public Goods Games (Horita et al. (2017)).
To avoid confusion, we comment explicitly on our purpose in the present study. Extensive behavioralstudies have sought to clarify what decision rules humans use to play a variety of repeated network games.
3

For example, Grujic et al. (2010) demonstrated that a heterogeneous MCC Model predicts human play ofnetworked Prisoner’s Dilemma much more faithfully than an “imitate-the-best” decision model. We takeas given that different games (e.g. Prisoner’s Dilemma vs. Public Goods Games) and different specifics ofgame presentation and reward structure can impact the form of player decision rules, and the parametervalues of observed decision rules. Further, an extremely interesting body of work has begun to exposehow reinforcement learning may be the driving mechanism behind the phenomena of Moody ConditionalCooperation decision rules (e.g. Horita et al. (2017)). In contrast, our interest in the present study is tounderstand what implications the widely-studied basic CC and heterogeneous MCC decision rules have forpossible advantages available to specially-structured societies. Our experimental framework could certainlybe applied to other decision rules of interest in the future (for example, the stochastic strategy updatingsuggested by the human studies of Traulsen et al. (2010)).
In Sections 3 and 5, using the random-rewiring procedure of Watts & Strogatz (1998), we study Con-ditional Cooperation (CC) and Moody Conditional Cooperation (MCC) across a “continuous” series ofnetworks. Community structure is gradually eroded as links are reallocated from dense local communitiesto information-seeking long ties. We comment on key observations that appear remarkably consistent acrossseveral synthetic networks and a sizable real-network example.
• A Protective Effect of Clustering. Highly-clustered networks can provide protection of cooperativenorms from catastrophic collapse caused by a randomly-distributed shock of defections in the network.Nevertheless, some defection shocks are large enough to cause catastrophic collapse across topologies:pushed into catastrophic collapse by severe defection shocks, the behavior of topologies will be verydifficult to distinguish.
As links are reallocated from local communities, we observe a surprisingly smooth decreases in thesize of shock the network can endure before catastrophic collapse of cooperation. A society with anincreasing prevalence of long ties appears to foster large-scale cascades of defection, even under milderinitial defection shocks.
• The Protective Effect Only Becomes Active Above a “Critical Level of Clustering.” For ConditionalCooperation, the clustering coefficient at which a protective effect of clustering becomes active con-sistently appears to increase with threshold h. When players apply high thresholds for cooperation,the protective effect of clustering only becomes active at quite high levels of clustering. Experimentsfor Moody Conditional Cooperation exhibit a similar “critical level” that increases as a heterogeneouspopulation of players is increasingly composed of Stingy players.
When many players behave as if the cost of cooperation is high, a protective effect of clustering ispredicted only at higher levels of clustering.
• Under Very “Low Cost of Cooperation” No Protective Effect of Clustering is Predicted. For Condi-tional Cooperation, when players apply low thresholds h, and for Heterogeneous Moody ConditionalCooperation, when many players behave very generously (cooperating despite high rates of neighbordefections), we observe no protective effect of clustering.
That is, the parameter values of local decision rules applied by players (in response to game presentationand reward structure) determine whether variation in topology has a predicted impact on long-termrates of cooperation in the network.
Our study as community structure is “smoothly eroded” via random rewiring has some conceptual simi-larities to how Garcia & Vega-Redondo (2015) model the evolution of altruism as a function of levels of localcohesion of a population that is uniformly distributed on a one-dimensional space. Roughly speaking, localcohesion describes the fraction of within-group connections. Our second finding (that a critical level of clus-tering must be reached to activate a protective effect of clustering) may be interpretable as a message aboutregime change in the local-cohesion parameter space: only above a certain level of local cohesion is a protec-tive effect of clustering predicted. Like their study, our results highlight that the initial conditions that fall in
4

the “basin of attraction” of catastrophic collapse of cooperation depends critically on the cost of cooperation.3
A Novel View of Several Human Experiments. Our model can be used to reinterpret an empiricalstudy that is often cited to argue against the importance of clustering towards higher levels of cooperative be-havior. Suri & Watts (2011) cite theoretical predictions of a cooperation-promoting effect of clustering as themotivation for their human experiments. The human experiments of Suri and Watts (Suri & Watts (2011))failed to find significant variation in cooperation levels when a repeated public-goods games was playedacross five network topologies of widely-varying clustering coefficient. Such an effect had been predicted ona qualitative basis in classical papers, so this experimental evidence appeared quite counter-intuitive whenpublished.
In Section 4, we interpret the Suri and Watts experimental results in our modeling framework: because ofthe large fraction of human defectors in the first round of their laboratory game whose spatial placement in thenetwork was not controlled, our model predicts that the experimenters should observe little-to-no significantvariation among the varying network topologies studied. We argue that the major observations from the Suriand Watts experiments are not incompatible with either conditional cooperation or an important associationbetween high clustering and cooperation: their observations are anticipated (across the studied topologies)by our simple threshold-for-cooperation model with threshold of 4/5, and initial defection shock of 45%.The proportion of initial defectors for the Suri and Watts public-goods game (modeled now as a randomly-spatially-distributed defection shock) appears to have simply been too large to be overcome by variation insocial-network structure.
That is, perhaps the experimental design of Suri and Watts simply tested the “wrong” part of theparameter space where no impact of topology was predicted. In a systematic study on ring-topologies ofvarying degree, Rand et al. (2014) make a similar point: for some relationships of costs of cooperation andnode degree, no effect of network variation is predicted, and an experiment with such cost/reward parametersshould be doomed to fail. Under other costs of cooperation, however, an impact of topology is predicted,and conducting a human study with such parameters, Rand et al. (2014) actually do empirically detect animpact of topology.
Some prominent human studies focused on Moody Conditional Cooperation (MCC) are also cited toargue that network topology doesn’t impact rates of cooperation. However, in addition to documenting highpercentages of first round defectors (as we highlight for Suri & Watts (2011)), many of these studies focus ona small number of networks where each has low clustering (well below 0.5). A comparative survey of humanMCC studies (Grujic et al. (2014)) acknowledges that clustering may play a role, but points out that thisnetwork feature has not been systematically explored.
For example, Grujic et al. (2010) considered a degree-8 lattice (each ego node is surrounded by a “MooreNeighborhood”) with clustering coefficient of only 0.43 (and nothing resembling dense community structure).In fact, Gracia-Lazaro et al. (2012) announced emphatically that network topology is irrelevant for coopera-tion after testing only two different networks, where both networks had low clustering coefficient. Due in partto the complex logistics and cost of conducting large human experiments, Gracia-Lazaro et al. (2012) testonly two networks: the degree-4 lattice with periodic boundary conditions (clustering coefficient of 0), and asingle alternate network with scale-free degree distribution. Based on the degree distribution and scale-freenetwork visualization provided in Gracia-Lazaro et al. (2012) 4 we estimate that the clustering coefficient oftheir scale-free network is at most 0.4. Gracia-Lazaro et al. (2012) observe cooperation collapse in both thedegree-4 lattice and their particular scale-free network, and boldly title their work, “Heterogeneous networksdo not promote cooperation when humans play a Prisoner’s Dilemma.”
Our computational exploration of Hetrogeneous Moody Conditional Cooperation in Section 5 providesseveral insights about why the cooperation collapse Gracia-Lazaro et al. (2012) observe for both their low-clustering networks may be a completely predictable outcome in the portion of the parameter space tested by
3In some sense, this cost can be qualitatively reverse-engineered from the decision rules applied by players.4Precise construction information was not included either in the body or SI section of Gracia-Lazaro et al. (2012). The long
paths of degree 2 in their scale-free network visualization (their Figure 1) don’t appear consistent with the common preferentialattachment method. We note that, given a fixed degree distribution, many different networks with widely-varying hierarchicaland community structure can be constructed.
5

their experimental design. In particular, they document a sizable 35-40% shock of round-1 defections (theirFigure 2), and large populations of very-stingy players (roughly 40% based on the right-hand intercepts ofpanels A and B of their Figure 3). Our framework suggests that the experimental findings of Gracia-Lazaroet al. (2012) (namely, cooperation collapse for both networks they study) are not incompatible with theexistence of a strong protective effect of clustering in other portions of the parameter space for networkedHeterogeneous MCC.
2 Methods
First we give precise statements of the conditional-cooperation spread models we that we will study.
2.1 Basic Conditional-Cooperation Model
Input: G = (V,E) is an undirected graph. Each node v ∈ V has a given fractional threshold for cooperation,hv. At each timestep t ∈ {0, 1, 2, ...}, the function ct(v) describes whether node v is cooperating or defecting:
ct(v) =
{1 if v cooperates at time t0 otherwise
Update Dynamics: At each timestep t, each node v ∈ V updates its behavior depending on the behaviorof v’s neighbor set, δ(v), in the previous time step:
ct+1(v) =
{1 if
∑u∈δ(v) ct(u) ≥ hv ∗ |δ(v)|,
0 otherwise.
Shock Treatment: Let d denote the duration of the shock, and let s denote the fraction of nodes to beshocked. A subset of nodes D, with |D| = ds ∗ |V |e, is selected uniformly at random from V . For u ∈ D,and i ∈ {0, 1, ..., d}, the value of ci(u) is forced to 0.5 All non-shocked nodes, v ∈ V \D, have c0(v) = 1.
Measurement of Treatment Effect: We simulate update dynamics until the convergence6 of∑v∈V ct(v).
Letting C denote the “Catastrophic-Collapse Threshold” we say cooperation has catastrophically collapsedif ∑
v∈Vct(v) < C ∗ |V |.
2.2 Extended Model: Heterogeneous Moody Conditional Cooperation
While the basic conditional cooperation model described above has been studied for many years, a compellingrecent series of behavioral experiments on repeated Prisoner’s Dilemma (e.g. see Grujic et al. (2010), Gracia-Lazaro et al. (2012), Grujic et al. (2014)) and additionally Public Goods Games (Horita et al. (2017)) onnetworks has exposed that human behavior can be more complex. In particular, choices to cooperate ordefect (or to contribute generously vs. stingily to a public good) may depend both on the context facedby a player (how many of his neighbors cooperated at time t) and on the player’s own actions at t. Thisphenomena was termed Moody Conditional Cooperation in Grujic et al. (2010). In particular, given fixedbehavior of his neighbors, a player may be more inclined to cooperate at t+ 1 if he cooperated at t (his pastaction putting him in a cooperative mood). Conversely, if the player defected at t (putting him in a defectivemood) then he may respond to the same fixed behavior of his neighbors at t with defection at t+ 1.
Furthermore, many such experiments document that populations of players can appear quite heteroge-neous in their decision rules. For example, Grujic et al. (2010) identifies 5 different player types. At the
5After d, nodes u ∈ D resume normal updating.6Under this model, there theoretically exist instances where convergence is to an oscillation between two values, but this is
highly rare in practice.
6

extremes are sizable populations of players who are either pure defectors (they always defect regardless ofneighbor behavior) or pure cooperators (they always cooperate regardless of neighbor behavior). Remark-ably, in a second experiment (after players have already played one full set of rounds), Grujic et al. (2010)find that 19.5% of players act as pure defectors. We note that the spatial placement of these pure defectorsis not controlled and is highly similar to our shock treatment model feature where the shock has indefiniteduration.
We apply a shock treatment and measurement of treatment effect in the same way as described for thebasic conditional-cooperation model above. Using the notation introduced above, the input and updatedynamics are generalized to the heterogeneous moody conditional-cooperation setting as follows.
Moody Input: G = (V,E) is an undirected graph. Each node v ∈ V has two given fractional thresholdsfor cooperation: hcv (a cooperative-mood threshold for cooperation) and hdv (a defective-mood threshold forcooperation).
Moody Update Dynamics: Each node v updates its behavior depending both on the behavior of v’sneighbors in the previous time step, and depending on v’s own behavior at the previous time step:
If ct(v) = 1, then ct+1(v) =
{1 if
∑u∈δ(v) ct(u) ≥ hcv ∗ |δ(v)|,
0 otherwise.
If ct(v) = 0, then ct+1(v) =
{1 if
∑u∈δ(v) ct(u) ≥ hdv ∗ |δ(v)|,
0 otherwise.
We note that, based on empirical evidence, we might generally assume that hcv ≤ hdv. That is, when vhas cooperated at t (and is in a cooperative mood), v may be satisfied by observing k neighbors cooperatingat t and then choose to cooperate at t + 1, so that ct+1(v) = 1, while for the same player v in a defectivemood (having defected at t), observing k neighbors cooperating at t may fail to persuade v to cooperate att+ 1, so that ct+1(v) = 0.
In our formalism, it is easy to capture the pure cooperators and pure defectors from Grujic et al. (2010):pure cooperators simply have (hcv, h
dv) = (0, 0) while pure defectors may have, for example (hcv, h
dv) = (1.1, 1.1).
0 0.1 0.2 0.3 0.4 0.5 0.6 0.7 0.8 0.9 1
Fraction of Cs in neighborhood of Ego Player
0
0.1
0.2
0.3
0.4
0.5
0.6
0.7
0.8
0.9
1
Fra
ctio
n of
Ego
Pla
yers
that
Cho
ose
C
Threshold Distribution Can Simulate Observed Human Behavior
Ego played C last turnEgo played D last turn
0 0.1 0.2 0.3 0.4 0.5 0.6 0.7 0.8 0.9 1
Fraction of Cs in neighborhood of Ego Player
0
0.1
0.2
0.3
0.4
0.5
0.6
0.7
0.8
0.9
1
Fra
ctio
n of
Ego
Pla
yers
that
Cho
ose
C
Threshold Distribution Can Simulate Observed Human Behavior
Ego played C last turnEgo played D last turn
0 0.1 0.2 0.3 0.4 0.5 0.6 0.7 0.8 0.9 1
Fraction of Cs in neighborhood of Ego Player
0
0.1
0.2
0.3
0.4
0.5
0.6
0.7
0.8
0.9
1
Fra
ctio
n of
Ego
Pla
yers
that
Cho
ose
C
Threshold Distribution Can Simulate Observed Human Behavior
Ego played C last turnEgo played D last turn
Figure 1: Heterogeneous Distributions Over (hcv, hdv) Players Can Simulate a Range of Empirically-observed
Moody Conditional Cooperation Responses. Panels are each generated by a different distribution overplayers, and quite-closely simulate the decision rules observed empirically in Figure 2 of Grujic et al. (2010)(two leftmost panels above) and Figure 3 from Horita et al. (2017) (rightmost panel above). Arbitrarycombinations of intercepts and (non-negative) slopes for the cooperative mood response and the defectivemood response can be easily captured by our modeling framework.
To make visually clear the connection between our formalism and observations from empirical behavioral
7

studies, Figure 1 demonstrates how varying distributions over vectors of type[hcvhdv
]for the nodes of V gives rise to a range of decision rules highly similar to those observed in the humanexperiments from Grujic et al. (2010), Gracia-Lazaro et al. (2012), Grujic et al. (2014)) and (Horita et al.(2017)), etc. As noted in the insightful analysis of Grujic et al. (2014) that compares several studies thatdocument moody conditional cooperation, the variety of observed slopes and intercepts of similar plots fromother human experiments are likely a response to the particular presentation and reward structure of thegame, and even may depend on the players’ level of prior experience with the game (a compelling findingfrom Grujic et al. (2010)). We do note that the slightly-negative slopes sometimes observed for players indefective moods (indicating exploitative behavior) are not captured by our formalism.
To motivate our experimental design, described explicitly in Section 5, we highlight that some featuresof the panels from Figure 1 are attributable to moodiness while others are driven by heterogeneity of thepopulation of players. The vertical separation between cooperative mood response (shown in blue) anddefective mood response (shown in red) is due to moodiness.
Next, consider the intercepts in Figure 1. In the leftmost panel, an intercept of roughly 0.2 for thedefective mood response indicates that, for 20% of the players, even if they defected at t and every oneof their neighbors defected at t, they will still choose to cooperate at t + 1. An intercept of 0.4 for thecooperative mood response indicates that, for 40% of the players, if they cooperated at t, even though alltheir neighbors defected at t, they will choose to continue cooperating at t+ 1. That is, a large percentageof players observed by Grujic et al. (2010) are remarkably generous in their choice to cooperate at t + 1,behaving as if they view the cost of cooperation to be very low.
On the other hand, for the same leftmost panel of Figure 1, the value of the the cooperative mood responsewhen all of a player’s neighbors cooperate at t is roughly 0.7. That is, fully 30% of players, despite being ina cooperative mood, and observing every one of their neighbors cooperating at t, will change to a defectionstrategy at t + 1. A large percentage of players observed by Grujic et al. (2010) are remarkably stingy,behaving as if they view the cost of cooperation to be very high.
Within our exploration of heterogeneous moody conditional-cooperation, we hope to avoid presentingan overwhelming number of population distributions. The 11 distributions we test are described explicitlyat the beginning of Section 5, and are designed to vary gradually. Our objective in this design is thatdepartures in catastrophic collapse behavior should be somewhat interpret-able. We hope that the tests wepresent will motivate further theoretical and computational examination of the implications of this morebehaviorally-realistic space of decision rules.
2.3 Reallocating local links to long ties
Our first set of experiments considers a class of synthetic networks obtained by randomly-rewiring denselocal communities (small complete graphs). As in (Watts & Strogatz (1998)), we start from an initialnetwork, and “rewire” each edge of the network with probability p. In particular, for each edge e ∈ E,with probability p we rewire it as follows. First, randomly choose one of e’s endpoints to be retained, thenchoose an alternative second endpoint from V uniformly at random. Larger values for rewiring probabilitylead to decreased clustering coefficient of the network.7 By increasing p gradually, we erode the communitystructure of G in a somewhat “smooth” manner.
Our synthetic examples initialize this rewiring procedure with a set of small complete graphs.8 Wewill report results both for cases where the small communities have uniform sizes, and where these smallcommunity sizes are chosen from a normal distribution (included in the Appendix). We find consistent results
7We compute the clustering coefficient in the standard way. For each node v in G = (V,E), compute the ratio of the numberof edges between neighbors of v and the number of edges a complete graph on the neighbors of v would contain. Average thisratio over all nodes in G to obtain the clustering coefficient for the whole graph G.
8This roughly replicates a sequence of stochastic block models in which average degree is maintained.
8

Light rewiring → More rewiring →
Figure 2: Schematic of Random Rewiring of Dense Local Communities (Complete Graphs). Clusteringcoefficient decreases gradually as the probability of rewiring, p, increases. This schematic depicts rewiringof four initial communities of size 4. Clustering coefficients left to right are: 1, 0.7, and 0.31. An additionalimpact of rewiring is visible here: G’s degree distribution changes, in this case becoming non-uniform.
for both cases. For a real network data set on Co-boardmembership in Norway involving 1,421 individuals,we perform a similar gradual rewiring procedure, and also observe strikingly-similar behavior.
For each network, at each level of random rewiring, we consider the long-term cooperation at a rangeof increasing random-shock sizes: we focus on the size of random shock sufficient to push the network intocatastrophic collapse of cooperation. Throughout our experiments, we regard cooperation to be in a state ofcatastrophic collapse if (after the period of shock ends) cooperation converges to less than 15%.9 Notice thatthe sufficient shock size to pass this boundary is a random variable that depends both on the realization ofthe rewired network, and on the placement of the random shock in the network.
All simulations were implemented in MATLAB running on a standard desktop computer.
3 Results: Basic Conditional Cooperation
Throughout this section, nodes apply a uniform threshold for cooperation, h. We examine 5 possible thresh-olds for cooperation: h is in {0.5, 0.6, 0.7, 0.8, 0.9}. In this section we consistently consider a shock of durationd = 6.
After this six-step shock duration, for networks of 50 nodes we almost always observed convergencewithin 5 additional time steps (at all thresholds tested). For networks of 200 nodes we noted somewhatrare instances that required up to 10 additional time steps (the vast majority still converged within 5 timesteps post-shock). For our real-world network (1,421 nodes) convergence was almost always reached within10 additional time steps (very rare instances required 20 time steps post-shock), and convergence appearedto occur more rapidly when thresholds were higher. Convergence times appeared similar for our MoodyConditional Cooperation tests in Section 5.
3.1 Rewiring Dense Communities of Uniform Size
Our first experiment considers an initial society composed of 5 complete graphs of 10 nodes each.Figure 3 depicts how the size of a defection shock required to cause catastrophic collapse of cooperation
depends on the probability of rewiring p. The five lines plotted in Figure 3 correspond to 5 possible thresholds.Confidence intervals depicted show two sample standard deviations on each side of the mean. All confidenceintervals in the paper are computed based on sample size of 100.
As local links are rewired with higher probability, the size of shock required to push cooperative behaviorto catastrophic levels (15% or less) decreases in a surprisingly smooth linear manner. The society becomesprogressively less able to retain cooperation in the face of randomly-distributed shocks of defection. This
9The choice of 15% is somewhat arbitrary: in the appendix we include versions of many figures for an alternative definitionof catastrophic collapse of 30%. The trends are very similar.
9

Figure 3: Rewiring Reduces Ability to Withstand Defection Shocks. Five initial communities of ten individ-uals each.
Figure 4: High Clustering Increases Ability to Withstand Defection Shocks. Five initial communities of tenindividuals each.
10

Figure 5: Ability to Withstand Defection Shocks vs. Rewiring (left panel) and Clustering Coefficient (rightpanel). Twenty initial communities of ten individuals each (total society of 200 nodes).
appears to hold for each uniform threshold in {0.5, 0.6, 0.7, 0.8, 0.9}. As rewiring increases, particularly atthe higher thresholds (0.8 and 0.9), we observe that even modest levels of rewiring have caused such a steepdecrease in ability to withstand shocks that a kind of “bottoming out” is observed: there is a rewiringprobability above which the defection shock size required to cause catastrophic collapse stabilizes.
As rewiring probability increases, the clustering coefficient decreases. In Figure 4 we depict the samedata from Figure 3 as a function of the expected clustering coefficient for the rewired graph.
Consider Figure 4. After an initial period where the shock required to cause catastrophic collapse isstable, we observe a remarkably-linear-looking increasing protective effect as clustering coefficient increases.Notably, the clustering coefficient at which this protective effect becomes active increases with the thresholdfor cooperation applied by nodes. For example, when nodes apply threshold for cooperation 0.6 a linearprotective effect appears to become active as clustering passes 0.35, whereas for threshold 0.8 this protectiveeffect isn’t active until clustering passes roughly 0.75. Interpreting this trend: when nodes apply highthresholds-for-cooperation to the behavior of their neighbors, our model predicts that networks with a widerange of clustering coefficients will be forced into catastrophic collapse by a modest shock of defection. Insuch cases, the long-term behavior of such networks will be difficult to distinguish. This point will be centralin considering the human experiments from (Suri & Watts (2011)).
Running the same experiment in a larger initial society of 20 communities of 10 individuals each, weobtain Figure 5. Qualitatively the behavior appears very similar to Figures 3 and 4 even though the relativesize of the small initial communities and the total society is very different (1/20th vs. 1/5th). Further, weobserve very similar behavior under alternate choices for the shock duration (rather than the d = 6 we useas a standard in this section and Section 5). See the Appendix for these supplemental figures.
Our results in Figures 3, 4, and 5 are remarkably consistent. To verify that this consistency is not anartifact of our choice that initial communities have uniform size of 10 individuals, we conducted the sameanalysis when the initial community sizes were realized randomly from a normal distribution. We testedseveral parameter combinations (described in Table 1 below). Our results were very similar. Figures fromthese supplemental tests are included in the Appendix.
11

Total society Mean Community Size St. Dev. of Community Size50 10 5200 10 5200 20 5
Table 1: Non-uniform Initial Community Sizes Produce Highly Similar Findings. See Appendix for corre-sponding figures.
3.2 Rewired Norwegian Co-boardmembership Network
Our results for synthetic networks suggest that in networks with high clustering (but low overall density),reallocating local links to long random ties results in a decrease in the network’s ability to withstand largerandom shocks of defection. Will such a trend occur in data sets describing real patterns of human interac-tion?
To examine the trend across the range of clustering coefficients, we test in a real network data set withvery high clustering. We consider a network created in (Seierstad & Opsahl (2011)) based on boards ofpublic limited companies in Norway: each individual is represented by a node, and two nodes are connectedif the corresponding individuals serve on a common board. As a result of this construction method, thenetwork is composed of a number of small complete subgraphs (one corresponding to each board) that mayoverlap in multiple members. As a result, the initial form is somewhat similar to the synthetic examples weconstructed, with a significant departure.
Figure 6 depicts the degree distribution for the Norwegian Co-boardmembership network. In contrastwith our synthetic examples that have binomial-like degree distribution (due to their construction), theNorwegian Co-boardmembership degree distribution appears power-law-like (or scale-free-like). This scale-free degree distribution shape is considered to be typical of many real social network data sets.
Figure 6: Degree Distribution for Norwegian Co-boardmembership Network (1,421 nodes).
Figure 7 shows our experimental results for the Norwegian Co-boardmembership network. As in thesynthetic networks generated earlier, we observe a linear-looking protective effect of clustering that becomesactive at (and above) a critical value of the clustering coefficient. This critical value appears to increaseas a function of the threshold for cooperation applied by each node. Findings are milder but qualitativelysimilar for a definition of catastrophic collapse of 30%-cooperation-or-less (see the Appendix for this alternateversion of Figure 7).
3.3 Basic Conditional Cooperation When Thresholds are Very Low
Figures 3 - 7 focus on shock sizes that cause catastrophic collapse for thresholds h from {0.5, 0.6, 0.7, 0.8, 0.9}.In the interval of clustering coefficients where a protective effect of clustering is observed, it appears that the
12

Figure 7: Ability to Withstand Defection Shocks vs. Rewiring (left) and Clustering Coefficient (right).Norwegian Co-board-membership Network (1,421 nodes).
slope of this effect is higher when h is higher. For example, consider the right-hand panel of Figure 5. Whenh = 0.8 a protective effect of clustering is observed above a critical level of 0.65, in the range [0.65, 1]. Theslope of this protective effect is quite steep when compared to the slope of the protective effect of clusteringobserved for threshold h = 0.5 over the longer range [0.15, 1].
Suppose that the uniform threshold is decreased from 0.5: Figure 8 shows that the protective effect ofclustering will continue to become more shallow as h decreases, vanishing completely for the lowest thresholds.
0 0.1 0.2 0.3 0.4 0.5 0.6 0.7 0.8 0.9 1
Expected Clustering Coefficient
0
0.1
0.2
0.3
0.4
0.5
0.6
0.7
0.8
0.9
1
Sho
ck S
ize
Req
uire
d to
Col
laps
e N
orm
Size of Shock Required for Catastropic Collapse of Cooperation (C.C.= 0.15)
Threshold 0.1Threshold 0.2Threshold 0.3Threshold 0.4Threshold 0.5
0 0.1 0.2 0.3 0.4 0.5 0.6 0.7 0.8 0.9 1
Expected Clustering Coefficient
0
0.1
0.2
0.3
0.4
0.5
0.6
0.7
0.8
0.9
1
Sho
ck S
ize
Req
uire
d to
Col
laps
e N
orm
Size of Shock Required for Catastropic Collapse of Cooperation (C.C.= 0.15)
Threshold 0.1Threshold 0.2Threshold 0.3Threshold 0.4Threshold 0.5
Figure 8: At the Very-Lowest Thresholds, No Protective Effect of Clustering is Observed. Left Panel: Fiveinitial communities of ten individuals each. Right panel: Twenty initial communities of ten individuals each.
Qualitatively, when players respond as if the cost of cooperation is very low (that is, even a small numberof cooperating neighbors are sufficient to persuade the focal individual to cooperate), cooperation is soresilient that clustered network structure can’t yield improvements over more randomly-structured networks.We draw special attention to this behavior under “very generous” conditional cooperators: our analysis ofthe heterogeneous Moody Conditional Cooperation Model in Section 5 will also show that diluting a moredemanding population with generous players can suppress the impact of network topology.
13

4 Interpreting the Suri and Watts experiments in terms of defec-tion shock and likelihood of catastrophic collapse
In 2011, Suri and Watts published a highly-cited empirical study that appeared to discredit the classically-predicted advantage of network clustering to aid cooperation. We demonstrate how our simple model canbe parametrized to anticipate the catastrophic collapse they observe across topologies. We argue that theobservations in (Suri & Watts (2011)) can be understood as specific to a portion of the parameter space,and not as a general evidence against the role of clustered topology in encouraging cooperation.
Background on (Suri & Watts (2011)). To explore the traditional reasoning that wide-scale human co-operation is reinforced when humans interact with more stable groups of contacts, Suri and Watts conducteda series of web-based human experiments.
Twenty-four players were arranged as nodes in different network topologies and player payoffs for eachround of a public-goods game depended on (observed) contributions of the player’s neighbors. Each experi-ment lasted for 10 rounds. In each round, every player had 10 points to allocate. A player can either keep apoint, or put it into a local community pool. At the end of the round, a player’s total points are the pointsthey kept plus 40% of the points contributed by them and their neighbor set to the local community pool.All network topologies tested had uniform degree 5. Thus, if all nodes contributed 10 points to the localcommunity pool, then each node would receive 24 points. At the other extreme, if all nodes contributed0 to the pool, then each node would get only its 10 original points. Under this payoff structure there is asignificant benefit to being in a highly-cooperative society.
In observations that span from disconnected cliques (high clustering) to random regular graphs (low cluster-ing) Suri and Watts observe a race to nearly-complete defection.10 Suri and Watts write,
“In contrast with previous theoretical work, we found that network topology had no significanteffect on average contributions. This result implies either that individuals are not conditional co-operators, or else that cooperation does not benefit from positive reinforcement between connectedneighbors.”
In follow-up tests conditional cooperation was observed, but the authors noted a qualitative symmetry:positive response to high-contributing neighbors did not outweigh negative response to low-contributingneighbors. Suri and Watts concluded that no effect like cooperative contagion seemed to spread beyondimmediate contacts (regardless of network topology).
Our new view. Are the observations from (Suri & Watts (2011)) truly incompatible with the messagethat clustered network topology benefits cooperation among conditional cooperators? Modeling the Suriand Watts experiments in our simple Shocks-of-Defection/Catastrophic-Collapse framework suggests thatthe lack of significant variation across topologies observed in (Suri & Watts (2011)) is not at odds with themessage that network clustering can positively impact cooperation.
In particular, we propose that the lack of significant variation observed across networks topologies testedin (Suri & Watts (2011)) has another very plausible explanation not considered by Suri and Watts: theirpublic-goods game induces a high percentage of initial defectors whose spatial placement (and total number)is not controlled under their experimental design, and the rules/user-interfaces of their game induce a highthreshold for cooperation. Under our modeling framework, these factors force high liklihood of catastrophiccollapse across all five topologies they test. Because cooperation has almost-completely collapsed in everytopology, point contributions are practically indistinguishable. Additionally, our model predicts that randomvariation for a fixed network topology is also substantial (undermining the possibility of well-separateddistributions).
We consider how to model the complicated public-goods game of Suri and Watts as a simple threshold-for-cooperation game in a network. Our simple framework involves 4 inputs: a network, a fraction describing
10Almost all nodes contribute 0-2 points out of 10, with 80%+ contributing 0.
14

the number of players who initially defect, a threshold for cooperation, and a sample size (how many differentinstances are measured for each topology).
• Networks: We use the five 24-node networks described explicitly in Figure 2 of (Suri & Watts (2011)).Each node has degree 5.
• Fraction of players who initially defect: Figure 6 of (Suri & Watts (2011)) shows the observeddistribution of first round point contributions. We will assume that an initial contribution half or less ofthe possible points (0-5 out of 10) will be viewed as defection by neighbors. This classifies roughly 45%of players round-1 contributions as defections. As in our computational experiments, Suri and Wattsdon’t control the spatial placement of these human defectors. Unlike in our computational experiment(where a defection shock had a fixed size), 45% now represents the probability of selecting a humanplayer who, confronted by the public-goods game of Suri and Watts, decides to start round 1 with aplay that will be interpreted as a defection. Thus, we model each player (node) as binomial randomvariable with mean 45%. We assume a shock duration of 1 time step.11
• Threshold for cooperation: Suri and Watts use a point-contribution system and aggregate playercontributions: it is not immediately clear how to choose a simple threshold-for-cooperation to modeltheir observations. We note, however, that all experiments of Suri and Watts end in what we considercatastrophic collapse of cooperation after 10 rounds. Is there a uniform threshold-for-cooperation12
that would cause this behavior given initial defection rate of 45% in the five tested networks from (Suri& Watts (2011))?
Figure 9: Fitting a Threshold-for-cooperation for catastrophic collapse across Suri and Watts topologies.The left and right panels are based on definitions of catastrophic collapse of 15% and 30% respectively.First-round defection of 45% is shown as a horizontal line.
Figure 9 depicts the size of shock required to cause catastrophic collapse as a function of the thresholdfor cooperation. Since each node has degree 5 in (Suri & Watts (2011)), the thresholds that yielddistinct spread behaviors will be {0.2, 0.4, 0.6, 0.8, 1}. All five topologies from (Suri & Watts (2011))are tested. The left and right panels are based on definitions of catastrophic collapse of 15% and 30%respectively.
11Immediately after round-1 play, we assume that individuals proceed as conditional cooperators.12It is entirely plausible that thresholds are heterogeneous over the population of players, however we are curious whether
even a very-simple uniform-threshold model can capture the all-networks-collapse outcome observed by Suri & Watts (2011).
15

We interpret our catastrophic collapse definitions from the previous section in terms of the small 24-node networks of Suri and Watts. When catastrophic collapse is defined as at most 15% cooperation(corresponding to the left panel of Figure 9), at most 3 nodes of 24 will be contributing more than 6points each at the end of 10 rounds. In the 24-node networks from (Suri & Watts (2011)) nodes arearranged roughly in communities of 6. Thus, at a high threshold for cooperation, a 15% definition ofcollapse does not register collapse in practice until 0 nodes of 24 are cooperating. When catastrophiccollapse is defined as 30% (corresponding to the right panel of Figure 9), at most 7 nodes (roughly one6-node community) will contribute more than 6 points each at the end of the game. In Figure 9, whilesome separation of topologies is observed when “catastrophic collapse” is defined as effectively-zerocooperation, there is almost no separation of topologies (regardless of threshold) when “catastrophiccollapse” allows for at least one 6-node cluster to cooperate. Under the 30% definition, a first-rounddefection level of 45% is more than sufficient to consistently cause catastrophic collapse for all topologieswhen the threshold for cooperation is 0.8 or above. Thus, we choose to model the experiments of Suriand Watts using a threshold for cooperation of 0.8 (4 of 5 neighbors must collaborate for a node tochoose cooperation).
• Sample Size: Suri and Watts give explicitly the number of realizations tested for each networktopology (Cliques: 4, Paired Cliques: 3, Cycle Cliques: 8, Small World: 4, Random Regular: 4).
Given this simple model (threshold-for-cooperation of 4/5, initial defection rate with mean 45%), weestimate the probability of catastrophic collapse to cooperation of 30% or less for each of the networks testedin (Suri & Watts (2011)). Running our model 200 times, we also compute 2-sample-standard-deviation con-fidence intervals (approximately 95%-confidence intervals) on the number of cooperating players predictedat the end of the game:
Network Topology Estimated Probability of 2 Std. Dev.- confidence interval forInitial Defection Rate of 45% Final Cooperation ≤ 0.30 number of final cooperators (of 24)Cliques 89.5% 4.3 (+/− 9.2)Paired Cliques 91.5% 4.1 (+/− 8.7)Cycle Cliques 94.0% 1.7 (+/− 7.1)Small World 99.5% 0.2 (+/− 3.6)Random Regular 99.5% 0.1 (+/− 3.4)
As noted in the table above, our model predicts that at a 45% rate of initial defections, catastrophiccollapse of cooperation is, by far, the most likely outcome for every network topology tested by Suri andWatts. This behavior is driven by two key features:
• Conditional cooperators who apply a high threshold for cooperation (4/5 in our simulation).
• A high fraction of round-1 defectors (mean 45% in our simulation) whose spatial placement is notcontrolled.
Further, our model produces confidence intervals for the final number of cooperators that overlap extensively.Because all topologies are pushed to states of catastrophic collapse of cooperation, levels of cooperation arenaturally almost impossible to distinguish.
Thus, referring to the experiment replication Suri and Watts conduct for each topology,13 our simplemodel estimates the probability that Suri and Watts observe catastrophic collapse in every replication forevery topology they test (assuming these are independent) to be roughly 28.8%.
13Cliques: 4, Paired Cliques: 3, Cycle Cliques: 8, Small World: 4, Random Regular: 4. Notably, (Suri & Watts (2011))describes increasing the number of replications for Cycle Cliques topology due to an early sample deemed to be non-representative(the initial number of defectors was low, leading to much higher contributions throughout the 10-round game). Dynamicallyadjusting sample replication to damp rare events is statistically problematic.
16

Both the high threshold for cooperation applied by players and the 45% fraction of round-1 defectors canbe understood as resulting from the specific reward structure and player-facing presentation of the public-goods game in (Suri & Watts (2011)). If a similar networked experiment were conducted for a public-goodsgame that naturally induced a lower percentage of initial defectors, or a lower threshold for cooperation,significant variation between topologies might very well be observed.
For example, our model predicts that even under the high threshold for cooperation of 4/5 that playersappear to apply in response to the game in (Suri & Watts (2011)), if the initial fraction of plays viewed asdefections could be reduced to 20%, then a substantial difference could emerge between the tested topologiesin terms of the likelihood of catastrophic collapse: Cliques: 11%, Paired Cliques: 11.5%, Cycle Cliques:21.0%, Small World: 64.5%, Random Regular: 72.0%. In human experiments, this might be exploredby masking or inflating the true round-1 behavior of neighboring human players (as in the non-networkedhuman experiments in (Rand et al. (2015))), or by redesigning the reward structure or presentation of thepublic-goods game.
5 Results: Heterogeneous Moody Conditional Cooperation
Our computational experiments in the previous sections investigate societies of uniform conditional coop-erators (that is, we have assumed that the threshold applied by players, h, is uniform across the popula-tion14). Thus, to explore the space of decision rules, in Figures 3 - 7 we considered all possibilities for h in{0.5, 0.6, 0.7, 0.8, 0.9}, and we noted a strong contrast with lowest values of h (Figure 8).
Since the Moody Conditional Cooperation (MCC) Model has a more complex input (two thresholds perindividual), and heterogeneity of player decision rules is a key finding of Grujic et al. (2010), it is now lessobvious how we might systematically explore the parameter space of decision rules. In particular, even if asmall number of player types are specified (fixing a hcv and a hdv for each such type), a very large numberof distributions over player types of could be investigated. Thus, as in many computational studies, ourinvestigation must necessarily be limited. We hope our work here will motivate subsequent studies.
We conduct experiments for two suites of distributions over moody conditional cooperator player types:
Player Type hcv hdvBase Type 0.6 0.9Generous Type 0.1 0.4Stingy Type 0.8 1.1
As a foundation, we consider a society in which 100% of individuals are moody conditional cooperatorsof the Base Type. Then we apply two treatments
• Distribution Suite 1: Adding Generous Moody Conditional Cooperators. For each k ∈{0, 20, 40, 60, 80, 100}, k% of individuals of the Base Type are replaced with Generous Type individuals.
• Distribution Suite 2: Adding Stingy Moody Conditional Cooperators. For each k ∈{0, 20, 40, 60, 80, 100}, k% of individuals of the Base Type are replaced with Stingy Type individu-als.
In this way we obtain a total of 11 distributions, each over two types of conditional cooperators. The k = 0case gives a reference distribution common to both distribution suites. Within each suite, the distributionis adjusted gradually so that the behavior under different distributions will hopefully yield an interpret-ableresult. In all cases, the spatial placement of the types of players is randomized, e.g. for the k = 20 case inDistribution Suite 1, exactly 0.2 ∗ |V | individuals of the Generous Type are distributed uniformly at randomamong the |V | nodes of G, and the remaining nodes are designated as Base Type.
14Of course, basic conditional cooperation could also be investigated when player thresholds are non-uniform.
17
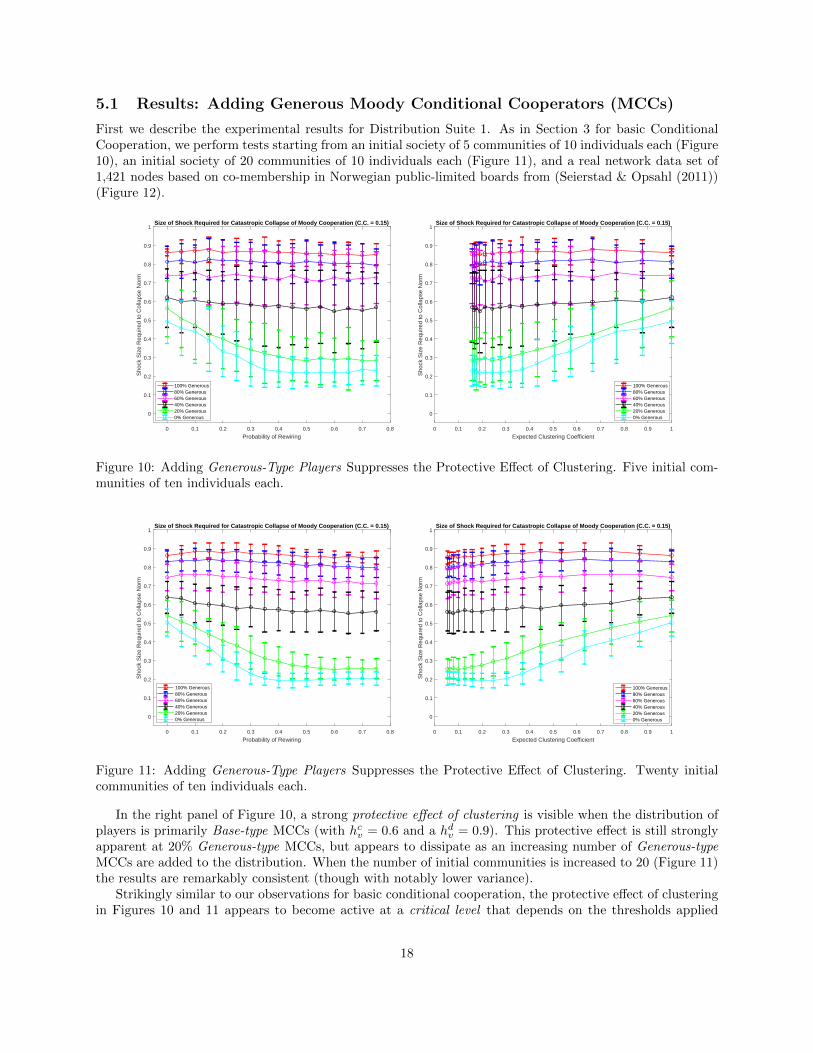
5.1 Results: Adding Generous Moody Conditional Cooperators (MCCs)
First we describe the experimental results for Distribution Suite 1. As in Section 3 for basic ConditionalCooperation, we perform tests starting from an initial society of 5 communities of 10 individuals each (Figure10), an initial society of 20 communities of 10 individuals each (Figure 11), and a real network data set of1,421 nodes based on co-membership in Norwegian public-limited boards from (Seierstad & Opsahl (2011))(Figure 12).
0 0.1 0.2 0.3 0.4 0.5 0.6 0.7 0.8
Probability of Rewiring
0
0.1
0.2
0.3
0.4
0.5
0.6
0.7
0.8
0.9
1
Sho
ck S
ize
Req
uire
d to
Col
laps
e N
orm
Size of Shock Required for Catastropic Collapse of Moody Cooperation (C.C. = 0.15)
100% Generous80% Generous60% Generous40% Generous20% Generous0% Generous
0 0.1 0.2 0.3 0.4 0.5 0.6 0.7 0.8 0.9 1
Expected Clustering Coefficient
0
0.1
0.2
0.3
0.4
0.5
0.6
0.7
0.8
0.9
1
Sho
ck S
ize
Req
uire
d to
Col
laps
e N
orm
Size of Shock Required for Catastropic Collapse of Moody Cooperation (C.C. = 0.15)
100% Generous80% Generous60% Generous40% Generous20% Generous0% Generous
Figure 10: Adding Generous-Type Players Suppresses the Protective Effect of Clustering. Five initial com-munities of ten individuals each.
0 0.1 0.2 0.3 0.4 0.5 0.6 0.7 0.8
Probability of Rewiring
0
0.1
0.2
0.3
0.4
0.5
0.6
0.7
0.8
0.9
1
Sho
ck S
ize
Req
uire
d to
Col
laps
e N
orm
Size of Shock Required for Catastropic Collapse of Moody Cooperation (C.C. = 0.15)
100% Generous80% Generous60% Generous40% Generous20% Generous0% Generous
0 0.1 0.2 0.3 0.4 0.5 0.6 0.7 0.8 0.9 1
Expected Clustering Coefficient
0
0.1
0.2
0.3
0.4
0.5
0.6
0.7
0.8
0.9
1
Sho
ck S
ize
Req
uire
d to
Col
laps
e N
orm
Size of Shock Required for Catastropic Collapse of Moody Cooperation (C.C. = 0.15)
100% Generous80% Generous60% Generous40% Generous20% Generous0% Generous
Figure 11: Adding Generous-Type Players Suppresses the Protective Effect of Clustering. Twenty initialcommunities of ten individuals each.
In the right panel of Figure 10, a strong protective effect of clustering is visible when the distribution ofplayers is primarily Base-type MCCs (with hcv = 0.6 and a hdv = 0.9). This protective effect is still stronglyapparent at 20% Generous-type MCCs, but appears to dissipate as an increasing number of Generous-typeMCCs are added to the distribution. When the number of initial communities is increased to 20 (Figure 11)the results are remarkably consistent (though with notably lower variance).
Strikingly similar to our observations for basic conditional cooperation, the protective effect of clusteringin Figures 10 and 11 appears to become active at a critical level that depends on the thresholds applied
18

0 0.1 0.2 0.3 0.4 0.5 0.6 0.7 0.8
Probability of Rewiring
0
0.1
0.2
0.3
0.4
0.5
0.6
0.7
0.8
0.9
1
Sho
ck S
ize
Req
uire
d to
Col
laps
e N
orm
Size of Shock Required for Catastropic Collapse of Moody Cooperation (C.C. = 0.15)
100% Generous80% Generous60% Generous40% Generous20% Generous0% Generous
0 0.1 0.2 0.3 0.4 0.5 0.6 0.7 0.8 0.9 1
Expected Clustering Coefficient
0
0.1
0.2
0.3
0.4
0.5
0.6
0.7
0.8
0.9
1
Sho
ck S
ize
Req
uire
d to
Col
laps
e N
orm
Size of Shock Required for Catastropic Collapse of Moody Cooperation (C.C. = 0.15)
100% Generous80% Generous60% Generous40% Generous20% Generous0% Generous
Figure 12: Adding Generous-Type Players Suppresses the Protective Effect of Clustering. Norwegian Co-board-membership Network (1,421 nodes).
by individuals. Namely, when more individuals apply higher cooperative and defective thresholds (aka,more MCCs are of the Base-type, rather than the Generous-type) this critical level appears to increase.Qualitatively, when more players respond as if the cost of cooperation is high, the protective effect of clusteringbecomes active at a higher critical level of clustering coefficient.
In the large real-network data set (Figure 12) again we observe a strong protective effect of clustering whenthe distribution of MCCs is entirely composed of Base-type MCCs, but in contrast with our small syntheticnetworks (in Figures 10 and 11), this effect has already become quite shallow by the time 20% Generous-typeMCCs are added. In the Appendix we include an additional figure which shows that when Generous-typeMCCs are added more gradually (5% at a time, rather than 20% at a time), many heterogeneous distributionsover Base- and Generous-type MCCs do exhibit a protective effect of clustering.
5.2 Results: Adding Stingy Moody Conditional Cooperators (MCCs)
Next, we consider our experimental results for Distribution Suite 2. Note that the 0%-Generous distributionfrom Suite 1 and the 0%-Stingy distribution from Suite 2 are identical (all Base-type MCCs), so Figures 10and 13 have a common reference distribution, Figures 11 and 14 have a common reference distribution, etc.
As Stingy-type MCCs are added to the distribution we obtain a series of heterogeneous player distributionsthat exhibit a very strong protective effect of clustering. As the player distribution becomes increasinglydominated by Stingy-type MCCs, in line with our previous observations, the critical level at which theprotective effect of clustering becomes active shifts to the right (increases). For example, in the right-handpanel of Figure 14, at 40%-Stingy-type MCCs the protective effect of clustering is first apparent aroundclustering coefficient 0.5.
Across Figures 13 - 15 we also note that the magnitude of shock required to cause catastrophic collapseof cooperation is quite low. For example, in the right-hand panel of Figure 14, when even 20% of individualsare Stingy-type MCCs, if 30% of players initially defect, catastrophic collapse is predicted except at the veryhighest clustering coefficients (above 0.7).
Finally, we note that Figures 13 - 15 seem to indicate that the impact of adding Stingy-type MCCs isquite nonlinear: adding 60% Stingy-type MCCs gives cooperation-collapse behavior that approaches the casewhen every single Base-type MCC is replaced by a Stingy-type MCC. At higher percentages of Stingy-typeMCCs, the critical level of clustering required to activate a protective effect of clustering appears to be nearly0.5 for our smaller synthetic networks (Figures 13 and 14).
In our computational experiments, we parameterized our Base-, Generous- and Stingy-type MCCs to makean initial exploration of behavior over the hetrogenous MCC parameter space. As in our interpretation of the
19

0 0.1 0.2 0.3 0.4 0.5 0.6 0.7 0.8
Probability of Rewiring
0
0.1
0.2
0.3
0.4
0.5
0.6
0.7
0.8
0.9
1
Sho
ck S
ize
Req
uire
d to
Col
laps
e N
orm
Size of Shock Required for Catastropic Collapse of Moody Cooperation (C.C. = 0.15)
0% Stingy20% Stingy40% Stingy60% Stingy80% Stingy100% Stingy
0 0.1 0.2 0.3 0.4 0.5 0.6 0.7 0.8 0.9 1
Expected Clustering Coefficient
0
0.1
0.2
0.3
0.4
0.5
0.6
0.7
0.8
0.9
1
Sho
ck S
ize
Req
uire
d to
Col
laps
e N
orm
Size of Shock Required for Catastropic Collapse of Moody Cooperation (C.C. = 0.15)
0% Stingy20% Stingy40% Stingy60% Stingy80% Stingy100% Stingy
Figure 13: Adding Stingy Players Exposes the Protective Effect of Clustering, and Modest Shocks CauseCatastrophic Collapse of Cooperation. The 0%-Stingy experiment in this figure coincides with the 0%-Generous experiment in Figure 10. Five initial communities of ten individuals each.
0 0.1 0.2 0.3 0.4 0.5 0.6 0.7 0.8
Probability of Rewiring
0
0.1
0.2
0.3
0.4
0.5
0.6
0.7
0.8
0.9
1
Sho
ck S
ize
Req
uire
d to
Col
laps
e N
orm
Size of Shock Required for Catastropic Collapse of Moody Cooperation (C.C. = 0.15)
0% Stingy20% Stingy40% Stingy60% Stingy80% Stingy100% Stingy
0 0.1 0.2 0.3 0.4 0.5 0.6 0.7 0.8 0.9 1
Expected Clustering Coefficient
0
0.1
0.2
0.3
0.4
0.5
0.6
0.7
0.8
0.9
1
Sho
ck S
ize
Req
uire
d to
Col
laps
e N
orm
Size of Shock Required for Catastropic Collapse of Moody Cooperation (C.C. = 0.15)
0% Stingy20% Stingy40% Stingy60% Stingy80% Stingy100% Stingy
Figure 14: Adding Stingy Players Exposes the Protective Effect of Clustering, and Modest Shocks CauseCatastrophic Collapse of Cooperation. The 0%-Stingy experiment in this figure coincides with the 0%-Generous experiment in Figure 11. Twenty initial communities of ten individuals each.
collapse of cooperation observed by Suri and Watts, we believe that the parameter values of decision rulesapplied by a population of players are a function of the presentation and reward structure of a networkedgame (this is also explicitly suggested for MCC by Grujic et al. (2014)). For Heterogeneous MCCs theseparameters are the slopes and intercepts of plots like those depicted in Figure 1.
In particular, our framework suggests that human experiments in which
• Many players respond very generously despite the defection behavior of their neighbors
• Many players are very stingy and the clustering coefficients of networks explored are low15
• The percentage of round-1 defectors is large (relative to thresholds applied by players)
15We suspect that in more-complex shock scenarios, e.g. a series of on-going randomly distributed shocks that might describepersistent exploratory exploitation behavior, initial community size should also be modest, as in our computational experimentsand the human experiments of Horita et al. (2017) in complete 4-node graphs.
20

0 0.1 0.2 0.3 0.4 0.5 0.6 0.7 0.8
Probability of Rewiring
0
0.1
0.2
0.3
0.4
0.5
0.6
0.7
0.8
0.9
1
Sho
ck S
ize
Req
uire
d to
Col
laps
e N
orm
Size of Shock Required for Catastropic Collapse of Moody Cooperation (C.C. = 0.15)
0% Stingy20% Stingy40% Stingy60% Stingy80% Stingy100% Stingy
0 0.1 0.2 0.3 0.4 0.5 0.6 0.7 0.8 0.9 1
Expected Clustering Coefficient
0
0.1
0.2
0.3
0.4
0.5
0.6
0.7
0.8
0.9
1
Sho
ck S
ize
Req
uire
d to
Col
laps
e N
orm
Size of Shock Required for Catastropic Collapse of Moody Cooperation (C.C. = 0.15)
0% Stingy20% Stingy40% Stingy60% Stingy80% Stingy100% Stingy
Figure 15: Adding Stingy Players Exposes the Protective Effect of Clustering, and Modest Shocks CauseCatastrophic Collapse of Cooperation. The 0%-Stingy experiment in this figure coincides with the 0%-Generous experiment in Figure 12. Norwegian Co-board-membership Network (1,421 nodes).
cannot hope to detect a cooperation-promoting impact of network topology. Simply, such tests are beingconducted in the wrong portion of the parameter space.
A Framework to Interpret Human Experiments for MCC. Some prominent human studies focusedon Moody Conditional Cooperation (MCC) are cited to argue that network topology doesn’t impact rates ofcooperation. We mention several such studies that are completely consistent with our framework.
Our observations may be useful in understanding the collapse of cooperation observed in studies likeGrujic et al. (2010) where a full 24-40% of players were classified as either pure defectors or mostly defectors(their Table 2). Such players behave similarly to our Stingy-type MCCs (if not even more stingily). Further,Grujic et al. (2010) document round-1 defection rates as high as 44-68% (their Figure 1) and investigateonly a degree-8 lattice (ego nodes with “Moore Neighborhoods”) with clustering coefficient 0.43. That is,Grujic et al. (2010) test in a portion of the Hetrogeneous MCC parameter space with a sizable population ofstingy players, a large initial shock size, and low clustering coefficient (not obviously above the critical level ofclustering we observe is required). Based on our Hetrogeneous MCC results, we would be extremely surprisedif their experimental design resulted in something different than catastrophic collapse of cooperation. Indeed,they document cooperation collapse to roughly 22% (experiment 2), similar to an unstructured controltreatment.
Gracia-Lazaro et al. (2012) announced emphatically that network topology is irrelevant for cooperation,titling their paper, “Heterogeneous networks do not promote cooperation when humans play a Prisoner’sDilemma.” They drew this conclusion after testing only two different networks: one network with clusteringcoefficient 0 (a degree-4 lattice with periodic boundary conditions) and one network with clustering coefficientwe estimate is at most at most 0.4 (a scale-free network with many long degree-2 paths). Gracia-Lazaroet al. (2012) observe similar collapse of cooperation in both networks.16
On the contrary, our results suggest that the observations from Gracia-Lazaro et al. (2012) are compu-tationally predictable based on the parameters they observe for player response to their Prisoner’s Dilemma
16Gracia-Lazaro et al. (2012) claim that the scale-free collapse should be particularly striking: they cite prior predictions thatscale-free network topologies should promote cooperation. However, those prior predictions appear to be based on replicatordynamics (e.g. Santos & Pacheco (2005)), a decision rule often studied in the physics literature that was already stronglydiscredited for repeated PD by Grujic et al. (2010). As our experimental results show, even adjusting the parameter values of adecision rule may impact whether a particular style of network is predicted to be cooperation promoting, e.g. our Figure 8. Thatis, we don’t believe that the scale-free network chosen in Grujic et al. (2010) constituted testing in a particularly-promising partof the space of networks given that players choose Moody Conditional Cooperation (and not replicator dynamics) in responseto their PD game.
21

Game. Of course, our evidence is from networks constructed by randomly rewiring dense local communitiesand not the precise networks tested in Grujic et al. (2010). Still, we must point out that Gracia-Lazaro et al.(2012) document a sizable 35-40% shock of round-1 defections (their Figure 2), and large populations of very-stingy players (roughly 40% based on the right-hand intercepts of panels A and B of their Figure 3). Basedon the right-hand panels of our Figures 14 and 15, we would be strongly surprised if, with this combinationof parameters for shock size, stingy fraction of the population, and clustering coefficient, Gracia-Lazaro et al.(2012) had observed something different than cooperation collapse in both networks they tested. Simply, ourframework suggests that the empirical findings of Gracia-Lazaro et al. (2012) are very-plausibly compatiblewith the existence of a strong protective effect of clustering in other portions of the parameter space fornetworked Heterogeneous MCC.
In contrast, the Moody Conditional Cooperation human study of Horita et al. (2017) conducted all testsin groups of 4 (like the leftmost panel of our Figure 2 where the clustering coefficient is 1). Importantly,while levels of cooperation decreased over time, Horita et al. (2017) observed statistically higher rates ofcooperation (for Prisoner’s Dilemma) and more generous contributions (for a Public Goods Game) thanunder a mixed control condition for almost 20 consecutive rounds. Our computational framework suggeststhat there is no mystery here: Horita et al. (2017) conducted their tests in a portion of the HetrogeneousMCC parameter space (highly-clustered networks) where our framework leads to a reasonable expectationthat topology could positively impact cooperation.
Thus, we again suggest that experimenters interested in testing whether variation in network topologycan impact levels of cooperation in human networked game play should engage in an advance stage ofexperimental design that measures and adjusts the game presentation and reward structure. Otherwise, lackof detection of an effect of network topology may be the computationally-predictable outcome of a particularexperimental design, but nevertheless such an observation may be misinterpreted as a general message aboutthe impotence of network structure to benefit levels of cooperation under a wider class of related games.
We close this section with a high-level comment. As in Subsection 3.3, our results for MCC DistributionSuite 1 appear to suggest that a search for a network-topology impact will be fruitless when many playersbehave as if the cost of cooperation is very low (or, symmetrically, as if the personal benefits they realizefrom acting as a cooperator, regardless of neighbor behavior, are very high). A subtle point here is thatthe monetary payoffs in many human game-play studies are usually quite modest: players may have quitevariable perceptions of the value of these small financial rewards. Further, it seems plausible that someegoistic benefits a player accrues from feeling that they have behaved cooperatively (and thus are a “niceperson,” etc) can vary considerably. That is, suppose that highly-heterogeneous decision rules are trulyunavoidable in existing-style laboratory experiments. If the uniformly-random spatial distribution of asizable number of Generous-type players is truly unavoidable despite more strategic experimental design(and the effect of this is that network topology is irrelevant in all laboratory studies of existing styles), itseems essential to clarify whether the breadth of the distribution of decision rules observed in laboratorysettings, including the “significant fraction of stubborn defectors and cooperators” (Grujic et al. (2010)), istruly indicative of breadth of human responses to higher-stakes cooperation vs. defection dilemmas outsideof the laboratory. Namely, is the volume of the “tails” of pure cooperators and pure defectors that arespatially placed at random throughout a structured society really as large as it appears in relatively low-stakes laboratory games? Our study suggests that the “fatness” of such tails may reflect critically on whetherthe clustering ubiquitously observed in real social networks can be interpreted as utility-providing to societiesthat exhibit such clustered structure.
6 Conclusion
We propose a new view on how clustered social-network structure can benefit a society. While previousmodels focused on outbreaks of cooperation in an initially uncooperative network, both the prevalence of manylarge cooperatively-functioning human organizations and the frequent empirical observation that cooperationmay spontaneously arise and stabilize in small dense communities lead us to consider an initial state wherecooperation is widespread. Societies are at an advantage when they are able to maintain a basic level of
22

cooperation despite occasional occurrences of pure defectors, transient experimentation with exploitationstrategies, or large-scale hardships that may cause normally-cooperative players to defect for some period.We formalize this notion as avoiding catastrophic collapse of cooperation.
When individuals are conditional cooperators or moody conditional cooperators, a societal structurethat retains a substantial “stable cooperative core” may accelerate regrowth of widespread cooperation aftera cascade of defections. From a modeling perspective, if a stable cooperative core survives, the recoveryof widespread mutually-beneficial cooperative norms need not rely as closely on rare coincidental acts ofpersonal altruism. From a behavioral perspective, cooperation within a stable core may spill over to newgroups of contacts (Cason et al. (2012); Fowler & Christakis (2010)), or cooperative groups may slowly growby including new members (Rand et al. (2015)). This “surviving foundation of cooperation” would appeareven more advantageous under dynamic-network models where individuals can sever ties with defectors (onsome time-scale). In contrast, a societal structure in which cooperation is driven to zero by milder shocksmay be slower to regrow widespread cooperative norms, and thus experience a lower stream of benefits overtime.
We observe computationally that as clustering decreases (as local links are randomly rewired), progres-sively smaller shocks of defection are sufficient to force the network into catastrophic collapse. The shocksize required to force catastrophic collapse appears to depend in a surprisingly-smooth almost-linear manneron the clustering coefficient, and this was observed even in a sizable real-data example. We also observe thatwhen players apply higher thresholds for cooperation (under basic Conditional Cooperation), or a sizablepercentage of players are Stingy (under Moody Conditional Cooperation) this protective effect of clusteringdoes not become active until an increasing critical value of clustering coefficient is reached. Additionally, theprotective effect of clustering is suppressed when players behave as if the cost of cooperation is very low (un-der basic Conditional Cooperation, when players apply very low thresholds, and under Moody ConditionalCooperation when a sizable population of players are Generous).
Though our model gives a very coarse description of the networked public-goods game of Suri and Watts,17
we show that their apparently-counter-intuitive observations are compatible with our model. Lack of sig-nificant variation due to topology in their experiments can be understood as a function of the particularparameters of the public-goods game they designed. Because players respond to the public-goods game in(Suri & Watts (2011)) with such a high level of defection in the first round, and demand such a high per-centage of their neighbors to cooperate, our model predicts that catastrophic collapse is close-to-unavoidableregardless of topology. Thus, final levels of cooperative play are predicted to be very difficult to distinguishamong topologies (as Suri and Watts found empirically).
Our computational observation that a critical level of clustering must be reached before a protectiveeffect of clustering becomes active may also lend insight about why human experiments like Grujic et al.(2010) and Gracia-Lazaro et al. (2012) that search for contrast in long-term cooperation rates between a fewlow-clustering networks detect no impact of network topology.
We note that models like ours suggest how experimenters in the social sciences might refine networkedpublic-goods games prior to running wide-scale experiments. The round-1 behavior of human players, andhow various point contributions are interpreted by neighbors, could be probed with artificial opponents inan experimental-design phase, avoiding large experiments that are unlikely to yield significant variation.
Last we comment on some limitations of the present study that we hope may motivate future work.While our choice of a uniformly-distributed defection shock in a static network is useful in interpreting theoutcome of laboratory experiments in which the spatial placement of players is random and spatial structureis constant and forced by the experimenter, a richer attempt to describe the evolution of cooperation inclustered society could consider
• Network structures that can evolve on some time-scale: players might be allowed to periodically makeor break links in response to defections of current neighbors, and possibly in response to informationabout cooperative behavior of near contacts.
17For example, we completely ignore the fine-scale distribution of points, and have no expectation that time steps in ourmodel correspond meaningfully to the 10 rounds played by the human subjects.
23

• Spatially-concentrated shocks of defection: our argument about temporary perturbations in cost-benefitcalculations due to a large economic event (depression or famine) seem likely to exhibit some spatialstructure. For example, an economic downturn may disproportionately impact low-income people, whomay disproportionately be linked to other low-income people.
• An on-going “rain” of spontaneous random defection behaviors in the midst of a widely-cooperativesociety to model exploration/reward-probing behavior. Such a model seems strongly motivated byempirical observations of strategy exploration Traulsen et al. (2010).
These possible additional model features each suggest some interesting directions, though particularlyin the first two cases, we expect that observations may be subtly influenced by interactions between theparticular choice of how to capture the new model feature and the initial network structure. For example,a spatially-concentrated shock that is a star (an ego node and each of his neighbors) may lead to a differentset of observations about the role of clustering than a spatially-concentrated shock that is a short randomwalk. Our caution here is informed by the network seeding literature: in some forms of networks quitenaive strategies can seed large cascades while in other forms of networks the same strategy may have littleeffect. A responsible study of spatially-concentrated shocks would need to investigate a variety of methodsfor producing spatial concentration, and as such we leave this intriguing direction to future work.
Also, to focus on the effects of varying network structure, in this work we have ignored another keyfinding in the behavioral literature: the strong role of reputation and longer-term history of play in shapingdecision rules applied by individuals (Weber (2006)), and how this may aid robustness of cooperative playin the presence of short-term defections that are perceived as non-malicious (Rand et al. (2015)). Thiscombination of features may also lead to a strong model-based case that societies interested in retainingcooperation are well-served by maintaining short ties (for various models of reputation formation amongneighbors).
References
Axelrod, R., & Hamilton, W.D. (1981). The evolution of cooperation. Science, 1390–1396.
Cason, T.N., Savikhin, A.C., & Sheremeta, R.M. (2012). Behavioral spillovers in coordination games.European economic review, 56(2), 233 – 245.
Centola, D., & Macy, M. (2007). Complex contagions and the weakness of long ties. American journal ofsociology, 113(3), 702–734.
Fortunato, S. (2010). Community detection in graphs. Physics reports, 486(3-5), 75 – 174.
Fowler, J.H., & Christakis, N. A. (2010). Cooperative behavior cascades in human social networks. Pnas,107(12), 5334–5338.
Garcia, J.A., & Vega-Redondo, F. (2015). Social cohesion and the evolution of altruism. Games and economicbehavior, 92(July), 74–105.
Glance, N.S., & Huberman, B.A. (1993). The outbreak of cooperation. The journal of mathematical sociology,17(4), 281–302.
Gracia-Lazaro, C., Ferrer, A., Ruiz, G., Tarancon, A., Cuesta, J. A., Sanchez, A., & Moreno, Y. (2012).Heterogeneous networks do not promote cooperation when humans play a prisoner’s dilemma. Proceedingsof the national academy of sciences, 109(32), 12922–12926.
Granovetter, M. (1978). Threshold models of collective behavior. The american journal of sociology, 83(6),1420–1443.
Granovetter, M.S. (1973). The Strength of Weak Ties. The american journal of sociology, 78(6), 1360–1380.
24

Grujic, J., Gracia-Lazaro, C., Milinski, M., Semmann, D., Traulsen, A., Cuesta, J. A., Moreno, Y., &Sanchez, A. (2014). A comparative analysis of spatial Prisoner’s Dilemma experiments: Conditionalcooperation and payoff irrelevance. Scientific reports, 4(Apr.), 4615.
Grujic, J., Fosco, C., Araujo, L., Cuesta, J.A., & Sanchez, A. (2010). Social experiments in the mesoscale:Humans playing a spatial prisoner’s dilemma. Plos one, 5(11), 1–9.
Horita, Y., Takezawa, M., Inukai, K., Kita, T., & Masuda, N. (2017). Reinforcement learning accounts formoody conditional cooperation behavior: experimental results. Scientific reports, 7.
Knez, M., & Camerer, C. (2000). Increasing cooperation in prisoner’s dilemmas by establishing a precedentof efficiency in coordination games. Organizational behavior and human decision processes, 82(2), 194 –216.
Leskovec, J., Lang, K.J., & Mahoney, M. (2010). Empirical comparison of algorithms for network communitydetection. Pages 631–640 of: Proceedings of the 19th international conference on world wide web. WWW’10. New York, NY, USA: ACM.
Nowak, M. (2006). Five rules for the evolution of cooperation. Science, 314(5805), 1560–1563.
Nowak, M.A., Bonhoeffer, S., & May, R.M. (1994). Spatial games and the maintenance of cooperation.91(11), 4877–4881.
Rand, David G., Nowak, Martin A., Fowler, James H., & Christakis, Nicholas A. (2014). Static networkstructure can stabilize human cooperation. Proceedings of the national academy of sciences, 111(48),17093–17098.
Rand, D.G., Fudenberg, D., & Dreber, A. (2015). It’s the thought that counts: The role of intentions innoisy repeated games. Scholarly articles. Harvard University Department of Economics.
Roca, Carlos P., Cuesta, Jose A., & Sanchez, Angel. (2009). Evolutionary game theory: Temporal andspatial effects beyond replicator dynamics. Phys. life rev., 6(4), 208 – 249.
Santos, F, & Pacheco, J. (2005). Scale-free networks provide a unifying framework for the emergence ofcooperation. Phys rev lett, Jan.
Seierstad, C., & Opsahl, T. (2011). For the few not the many? the effects of affirmative action on presence,prominence, and social capital of women directors in norway. Scandinavian journal of management, 27(1),44–54.
Suri, S., & Watts, D.J. (2011). Cooperation and contagion in web-based, networked public goods experiments.Plos one, 6(3), e16836.
Traulsen, A., Semmann, D., Sommerfeld, R.D., Krambeck, H., & Milinski, M. (2010). Human strategyupdating in evolutionary games. Proceedings of the national academy of sciences, 107(7), 2962–2966.
van Huyck, J., Battalio, R., & Beil, R. (1990). Tacit coordination games, strategic uncertainty, and coordi-nation failure. American economic review, 80(1), 234–48.
Watts, D. J., & Strogatz, S. H. (1998). Collective dynamics of’small-world’networks. Nature, 393(6684),409–10.
Watts, D.J. (1999). Small worlds: The dynamics of networks between order and randomness. Princeton, NJ,USA: Princeton University Press.
Weber, R.A. (2006). Managing growth to achieve efficient coordination in large groups. American economicreview, 96(1), 114–126.
25

7 Appendix
7.1 Adjusting Shock Duration:Basic Conditional-Cooperation Model
0 0.1 0.2 0.3 0.4 0.5 0.6 0.7 0.8 0.9 1
Expected Clustering Coefficient
0
0.1
0.2
0.3
0.4
0.5
0.6
0.7
0.8
Sho
ck S
ize
Req
uire
d to
Col
laps
e N
orm
Size of Shock Required for Catastropic Collapse (Shock Duration = 2)
Threshold 0.5Threshold 0.6Threshold 0.7Threshold 0.8Threshold 0.9
0 0.1 0.2 0.3 0.4 0.5 0.6 0.7 0.8 0.9 1
Expected Clustering Coefficient
0
0.1
0.2
0.3
0.4
0.5
0.6
0.7
0.8
Sho
ck S
ize
Req
uire
d to
Col
laps
e N
orm
Size of Shock Required for Catastropic Collapse (Shock Duration = 4)
Threshold 0.5Threshold 0.6Threshold 0.7Threshold 0.8Threshold 0.9
0 0.1 0.2 0.3 0.4 0.5 0.6 0.7 0.8 0.9 1
Expected Clustering Coefficient
0
0.1
0.2
0.3
0.4
0.5
0.6
0.7
0.8
Sho
ck S
ize
Req
uire
d to
Col
laps
e N
orm
Size of Shock Required for Catastropic Collapse (Shock Duration = 6)
Threshold 0.5Threshold 0.6Threshold 0.7Threshold 0.8Threshold 0.9
Figure 16: Catastrophic Collapse Behavior is Similar for Alternate Shock Duration. From left to right:duration d = 2, duration d = 4, duration d = 6. Five initial communities of 10 individuals each (total societyof 50 nodes).
0 0.1 0.2 0.3 0.4 0.5 0.6 0.7 0.8 0.9 1
Expected Clustering Coefficient
0
0.1
0.2
0.3
0.4
0.5
0.6
0.7
0.8
Sho
ck S
ize
Req
uire
d to
Col
laps
e N
orm
Size of Shock Required for Catastropic Collapse (Shock Duration = 2)
Threshold 0.5Threshold 0.6Threshold 0.7Threshold 0.8Threshold 0.9
0 0.1 0.2 0.3 0.4 0.5 0.6 0.7 0.8 0.9 1
Expected Clustering Coefficient
0
0.1
0.2
0.3
0.4
0.5
0.6
0.7
0.8
Sho
ck S
ize
Req
uire
d to
Col
laps
e N
orm
Size of Shock Required for Catastropic Collapse (Shock Duration = 4)
Threshold 0.5Threshold 0.6Threshold 0.7Threshold 0.8Threshold 0.9
0 0.1 0.2 0.3 0.4 0.5 0.6 0.7 0.8 0.9 1
Expected Clustering Coefficient
0
0.1
0.2
0.3
0.4
0.5
0.6
0.7
0.8
Sho
ck S
ize
Req
uire
d to
Col
laps
e N
orm
Size of Shock Required for Catastropic Collapse (Shock Duration = 6)
Threshold 0.5Threshold 0.6Threshold 0.7Threshold 0.8Threshold 0.9
Figure 17: Catastrophic Collapse Behavior is Similar for Alternate Shock Duration. From left to right:duration d = 2, duration d = 4, duration d = 6. Twenty initial communities of 10 individuals each (totalsociety of 50 nodes).
7.2 Rewired Dense Communities of Stochastic Size:Basic Conditional-Cooperation Model
Figures 3, 4, and 5 are remarkably consistent despite a large difference in the relative size of a small communityand the total society. In both previous cases, however, small community size is uniform. To verify that ourresults are not simply an artifact of our choice that each small initial community has the same size, we makeseveral measurements when the sizes of the small communities in the initial society are chosen at randomfrom a normal distribution.
Figures 18 - 20 depict the same computational experiment when the the initial small community sizesare chosen from a normal distribution, as noted in the caption of each figure. These figures are all based ona definition of catastrophic collapse of 15%. The figures shown are quite typical of realizations we obtainedwhen repeatedly realizing initial societies from the distributions described. We find these results to beremarkably consistent with those for uniform community sizes given in the main body of the paper.
26

Figure 18: Ability to Withstand Defection Shocks vs. Rewiring (left) and Clustering Coefficient (right).Initial communities of mean size 10, standard deviation 5 (total society of 50 nodes).
Figure 19: Ability to Withstand Defection Shocks vs. Rewiring (left) and Clustering Coefficient (right).Initial communities of mean size 10, standard deviation 5 (total society of 200 nodes).
Figure 20: Ability to Withstand Defection Shocks vs. Rewiring (left) and Clustering Coefficient (right).Initial communities of mean size 20, standard deviation 5 (total society of 200 nodes).
27

7.3 Analogous Figures for “Catastrophic Collapse” at 30%:Basic Conditional Cooperation
Figures 21 and 22 are alternative versions of Figures 3 and 4, where the definition of catastrophic collapseis convergence to cooperation rate of 30% or less. Preserving the vertical axes from the earlier figuresshows that the magnitude of the shock required to reach catastrophic collapse to 30% is somewhat lower forhighly-clustered graphs (compared with collapse to 15%), though almost the same for graphs that have beensubstantially rewired.
Figure 21: High Clustering Increases Ability to Withstand Defection Shocks. Five initial communities of tenindividuals each.
Figure 23 below is an alternative versions of Figure 5 where the definition of catastrophic collapse isconvergence to cooperation rate of 30% or less.
Figures 24 - 26 are alternative versions of Figures 18 - 20 where the definition of catastrophic collapse isconvergence to cooperation rate of 30% or less.
28

Figure 22: High Clustering Increases Ability to Withstand Defection Shock. Five initial communities of tenindividuals each.
Figure 23: Ability to Withstand Defection Shocks vs. Rewiring (left) and Clustering Coefficient (right).Twenty initial communities of ten individuals each (total society of 200 nodes).
7.4 Adding Generous MCCs more gradually:Heterogeneous Moody Conditional Cooperation
29
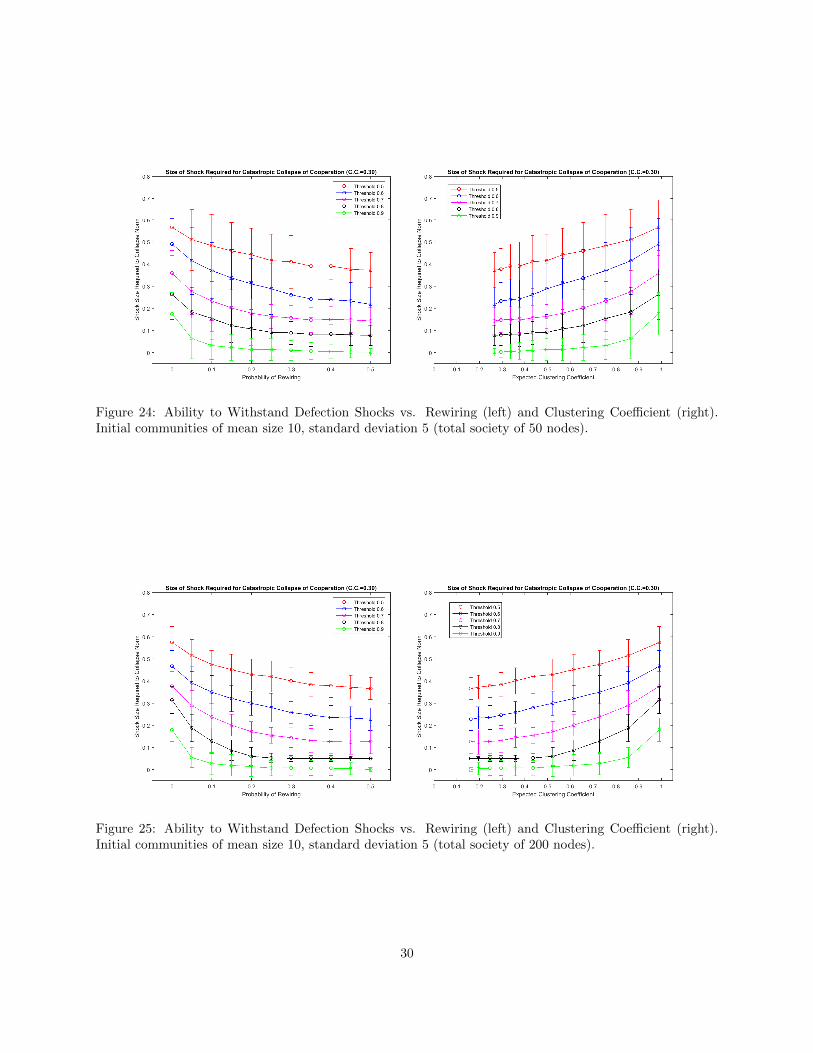
Figure 24: Ability to Withstand Defection Shocks vs. Rewiring (left) and Clustering Coefficient (right).Initial communities of mean size 10, standard deviation 5 (total society of 50 nodes).
Figure 25: Ability to Withstand Defection Shocks vs. Rewiring (left) and Clustering Coefficient (right).Initial communities of mean size 10, standard deviation 5 (total society of 200 nodes).
30

Figure 26: Ability to Withstand Defection Shocks vs. Rewiring (left) and Clustering Coefficient (right).Initial communities of mean size 20, standard deviation 5 (total society of 200 nodes).
Figure 27: Ability to Withstand Defection Shocks vs. Rewiring (left) and Clustering Coefficient (right).Norwegian Co-board-membership Network (1,421 nodes).
31

0 0.1 0.2 0.3 0.4 0.5 0.6 0.7 0.8
Probability of Rewiring
0
0.1
0.2
0.3
0.4
0.5
0.6
0.7
0.8
0.9
1
Sho
ck S
ize
Req
uire
d to
Col
laps
e N
orm
Size of Shock Required for Catastropic Collapse of Moody Cooperation (C.C. = 0.15)
0% Generous5% Generous10% Generous15% Generous20% Generous25% Generous
0 0.1 0.2 0.3 0.4 0.5 0.6 0.7 0.8 0.9 1
Expected Clustering Coefficient
0
0.1
0.2
0.3
0.4
0.5
0.6
0.7
0.8
0.9
1
Sho
ck S
ize
Req
uire
d to
Col
laps
e N
orm
Size of Shock Required for Catastropic Collapse of Moody Cooperation (C.C. = 0.15)
0% Generous5% Generous10% Generous15% Generous20% Generous25% Generous
Figure 28: Adding Generous-Type Players Supresses the Protective Effect of Clustering. This figure examinesthe same experiment as Figure 11 but at increased resolution as generous players are added at 5% perdistribution shown. For comparison, the 0%-Generous case and 20%-Generous case here are identical tothose from Figure 11. Norwegian Co-board-membership Network (1,421 nodes).
32