clsa asean forum 2011 deepak sarup, cfo - siam ... trade finance, corporate finance and corporate...
TRANSCRIPT

INVESTOR PRESENTATION
CLSA ASEAN FORUM 2011
Deepak Sarup, CFO10th February 2011

Investor Relations | CLSA ASEAN Forum | February 2011
I. Review of Results – 2010
II. Future Positioning
III. 2011 Targets
2
AGENDA
IMPORTANT DISCLAIMER:
Information contained in this document has been prepared from several sources and the Bank cannot confirm, in all cases, the accuracy and completeness of such data, particularly where sourced from outside the Bank. In addition, any forward looking statements are subject to change as a result of market conditions and the final result may be different to that indicated. The Bank makes no representation or warranty of any type whatsoever on the accuracy or completion of the information contained herein.
Pages
3-15
17-27
29

Investor Relations | CLSA ASEAN Forum | February 2011
Profitability
ROE
ROA
NIMs
Loan Growth
Total Loans (yoy)
Wholesale
SME
Retail
Cost and Income
Non-NII Growth (yoy)
Fee income Growth (yoy)
Cost to Income
NPLs (gross)
Branches/ATMs
Capital Adequacy Ratio
1/ Depends on the interest rate environment2/ Stripping out non-recurring. If non-recurring items are included, non-NII growth would be 7.7% in 2009 and 20.6% in 2010, while cost to income ratio would be 51.5% in 2009 and 50.0% in 2010.
1/
2/
2/
ND = Not disclosed
2009 Actual 2010 Target 2010 Actual
2010 Results (Highlights):
• High loan growth of 12.6% yoy was the tangible outcome of the Bank’s market-share growth strategies adopted in early 2010
• Non-NII growth exceeded target driven by solid fee income growth of 19.4% yoy
• Cost to Income ratio lower than target, at 50%
• NPL ratio substantially lower than last year’s and the 2010 target
2010 PERFORMANCE VS. TARGETS Targets and Results
3
On track to target or higher
16.4%
1.7%
3.63%
12.6%
11.0%
14.4%
15.6%
17.7%
19.4%
50.5%
3.25%
1,019/8,006
15.5%
16%+
1.8%
3.5-3.8%
7-10%
8-11%
10-13%
6-10%
17%
15%+
51%
3.90%
1,040/7,700
ND
15.5%
1.6%
3.4%
2.5%
9.4%
-7.0%
3.7%
10.4%
10.9%
50.6%
4.41%
987/7,129
16.5%
2/
2/

Investor Relations | CLSA ASEAN Forum | February 20114
Solid 2010 results with ROE of 16.4% and ROA of 1.7%
High loan growth of 12.6% yoy and improving asset quality
Robust fee income growth of 19.4% yoy
World class level of customer and employee engagement
Market leading positions in key product areas
Improved productivity
Solid capital base
1
KEY ACHIEVEMENTS IN 2010 Achievements
Page
5
6-9
10
11
12
13
14
2
3
4
5
6
7

Investor Relations | CLSA ASEAN Forum | February 20115
Solid ResultsTHE SOLID INCREASE IN NET PROFIT WAS DRIVEN BY MARKET SHARE GROWTH IN ALL SEGMENTS
Net profit increased 16.6% yoy in 2010 and 26.3% yoy in 4Q10
+16.6% yoyNet Profit(Baht Billion)
Core Operating Profit(Baht Billion)
ROE (%)
ROA (%)
Robust profitability with highest ROE and ROA among the big Thai banks
+21.4% yoy
Investor Relations | CLSA ASEAN Forum | February 2011
HIGH LOAN GROWTH ACROSS ALL SEGMENTS
6
1/ Figures were restated to reflect the transfer of SME loans to Corporate Banking Group and Retail Banking Group in 1Q10
5% 4%
3%
37%
21%
38%
19%
39%
19%
Loan Growth (yoy)
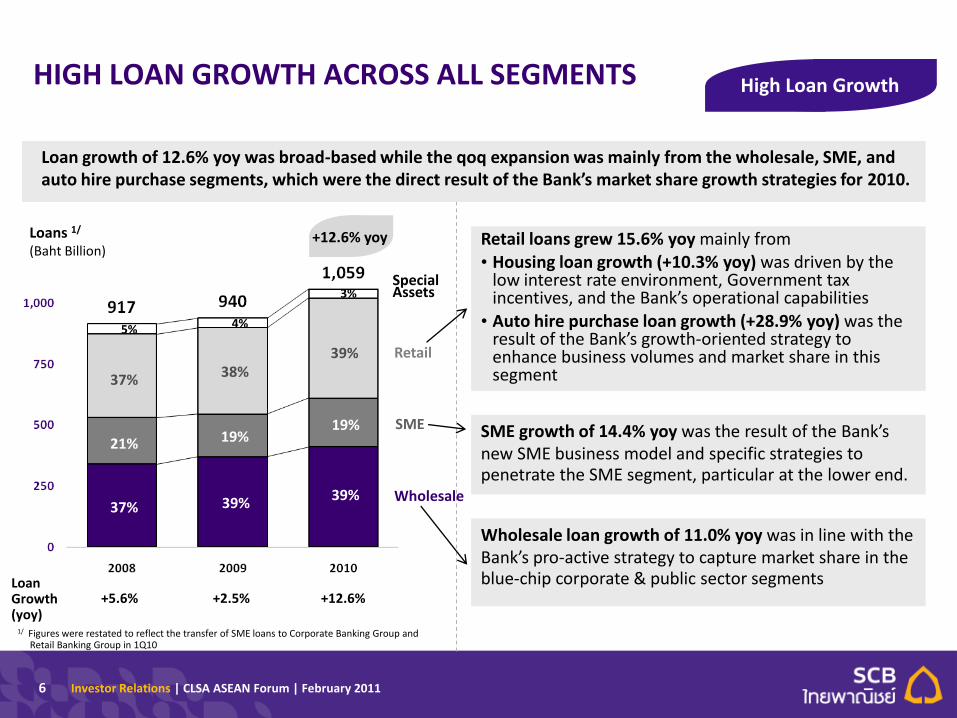
Loan growth of 12.6% yoy was broad-based while the qoq expansion was mainly from the wholesale, SME, and auto hire purchase segments, which were the direct result of the Bank’s market share growth strategies for 2010.
High Loan Growth
Retail loans grew 15.6% yoy mainly from• Housing loan growth (+10.3% yoy) was driven by the
low interest rate environment, Government tax incentives, and the Bank’s operational capabilities
• Auto hire purchase loan growth (+28.9% yoy) was the result of the Bank’s growth-oriented strategy to enhance business volumes and market share in this segment
Wholesale loan growth of 11.0% yoy was in line with the Bank’s pro-active strategy to capture market share in the blue-chip corporate & public sector segments
SME growth of 14.4% yoy was the result of the Bank’s new SME business model and specific strategies to penetrate the SME segment, particular at the lower end.
Loans 1/
(Baht Billion)
Wholesale
SME
Retail
Special Assets
+12.6% yoy
37% 39% 39%
+5.6% +2.5% +12.6%

Investor Relations | CLSA ASEAN Forum | February 20117
96.9%
93.3%
Loan to Deposit
* BE is included in deposits as they are essentially akin to uninsured deposits
Loan to Deposit + BE *
Loan to Deposit
As the Bank was successful in growing its deposit base through both special deposit campaigns and effective leverage of its strong retail franchise, the LDR was reduced to a comfortable level.
LOAN-TO-DEPOSIT RATIO NOW AT A COMFORTABLE LEVEL

Investor Relations | CLSA ASEAN Forum | February 2011
IMPROVING NII FROM LOAN GROWTH AND BETTER SPREAD
8
Higher NIM
NII Growth (yoy)
The growth in NII yoy was the result of strong loan growth and higher yield compared to 2009.
Net Interest Income(Baht Billion)
Cost of Funds
NIMYield on Earning Assets
NIM excluding Dividend from Vayupak
Yield on Earning Assets, Cost, and NIM
Yield on Loan
Wholesale 4.1% 4.0% 3.9% 4.1% 3.9%
SME 5.2% 5.2% 5.1% 5.1% 5.1%
Retail 6.1% 6.0% 5.8% 5.8% 5.8%
+6.0% yoy
+13.2% -5.2% +6.0%

Investor Relations | CLSA ASEAN Forum | February 2011
IMPROVED ASSET QUALITY HAS LED TO HIGHER RESERVE COVERAGE AND LOWER CREDIT COSTS
NPLs fell to 3.25%, the lowest level in over a decade, due to debt restructuring, NPL sales, and the Bank’s pre-emptive strategies to prevent new NPL formation. The improvement in asset quality was broad-based.
Reserve coverage exceeded 100% for the second quarter in a row, partly as a result of the economic recovery and partly from the strength of the Bank’s credit underwriting practices and risk management framework.
Gross NPLs(Baht Billion)
% NPL
% NPL by Segment
Loan Loss Reserve(Baht Billion)
% LLR/NPL
Improving Asset Quality
1/ Annualized provisions as a % of average loans
Credit Cost 1/
(bps)
9
56 60 47Wholesale 5.5% 3.6% 3.1%
SME 7.3% 8.7% 7.0%
Retail 4.3% 3.9% 2.4%
Investor Relations | CLSA ASEAN Forum | February 2011
ROBUST GROWTH IN FEE INCOME
10
Fee and Service Income Breakdown
Outer Ring : 2010Inner Ring : 2009
Bank Cards
Loan Related Fee
GMTS 1/
Others 2/
Mutual Funds Bancassurance
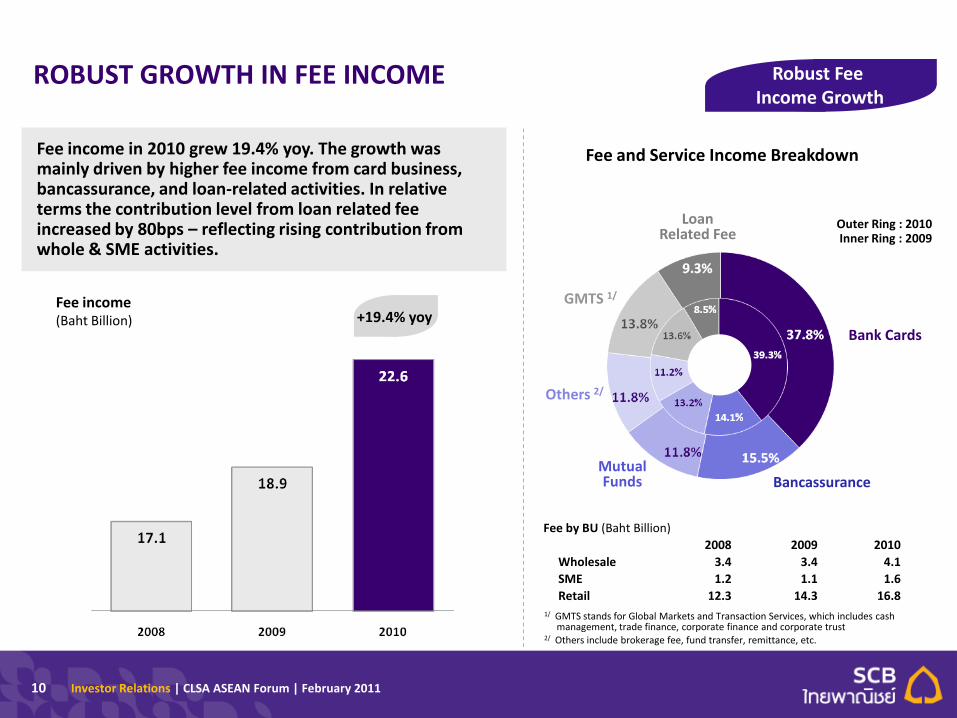
Fee income in 2010 grew 19.4% yoy. The growth was mainly driven by higher fee income from card business, bancassurance, and loan-related activities. In relative terms the contribution level from loan related fee increased by 80bps – reflecting rising contribution from whole & SME activities.
1/ GMTS stands for Global Markets and Transaction Services, which includes cash management, trade finance, corporate finance and corporate trust
2/ Others include brokerage fee, fund transfer, remittance, etc.
Robust Fee Income Growth
Fee income(Baht Billion) +19.4% yoy
Fee by BU (Baht Billion)
2008 2009 2010
Wholesale 3.4 3.4 4.1
SME 1.2 1.1 1.6
Retail 12.3 14.3 16.8
Investor Relations | CLSA ASEAN Forum | February 2011
WORLD CLASS LEVELS OF CUSTOMER AND EMPLOYEE ENGAGEMENT PROVIDE A STRONG AND CONTINUED COMPETITIVE EDGE
11
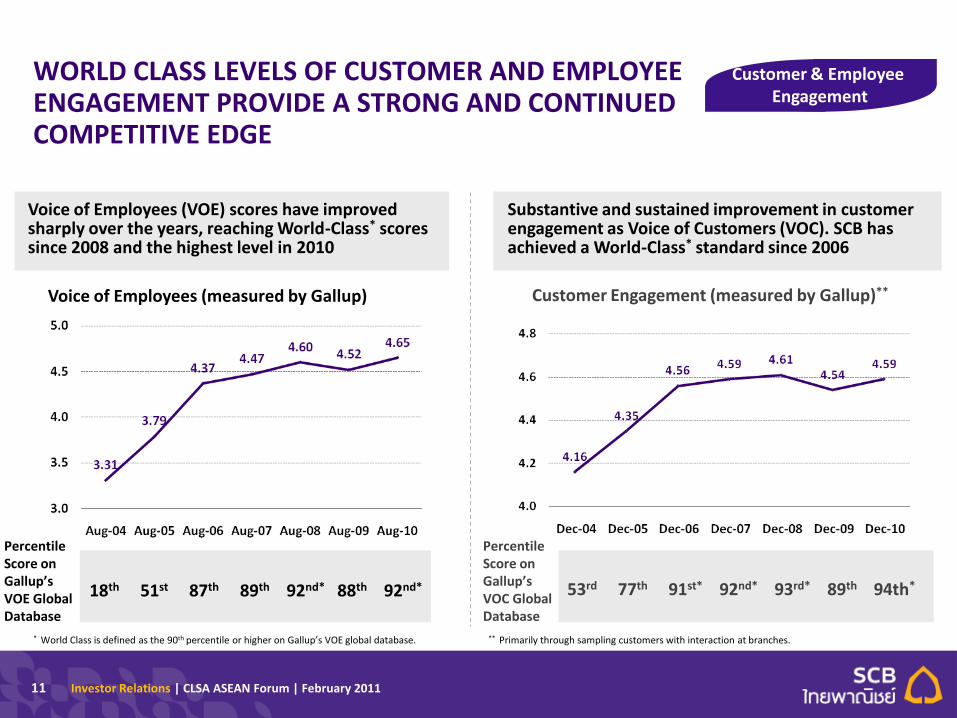
Voice of Employees (VOE) scores have improved sharply over the years, reaching World-Class* scores since 2008 and the highest level in 2010
Customer & Employee Engagement
Voice of Employees (measured by Gallup)
18th 51st 87th 89th 92nd* 88th 92nd*
Customer Engagement (measured by Gallup)**
53rd 77th 91st* 92nd* 93rd* 89th 94th*
* World Class is defined as the 90th percentile or higher on Gallup’s VOE global database.
Substantive and sustained improvement in customer engagement as Voice of Customers (VOC). SCB has achieved a World-Class* standard since 2006
Percentile Score on Gallup’s VOE Global Database
Percentile Score on Gallup’s VOC Global Database
** Primarily through sampling customers with interaction at branches.

Investor Relations | CLSA ASEAN Forum | February 2011
4/ As of Nov-105/ Total life premiums which include individual life & credit life (new premium & renewals)
RETAIL BANKING - KEY PRODUCTS
12
Housing Loans 2/
(Baht Billion)
1/ Market share for mortgage portfolio comprised of housing loans and consumer loans2/ Classified by product, including NPLs
Total Bancassurance Premiums 5/
(Baht Billion)
Mortgage Lending: Maintained dominance with approximately 29% market share 1/ among commercial banks
Bancassurance: #1 with 25% market share 4/
Credit Card Spending(Baht Billion)
Mutual Fund Assets under Management (AUM)(Baht Billion)
Credit Card: #1 in terms of total card spending with 16.5% market share 3/
Mutual Funds: #2 with 25% market share
3/ As of Nov-10
Leading Positions in Retail Products
+11.4% yoy +12.3% yoy
+27.4% yoy +13.5% yoy

Investor Relations | CLSA ASEAN Forum | February 2011
2010 COST-TO-INCOME REMAINED BELOW FULL-YEAR TARGET
13
Operating Expense(Baht Billion)
1/ Including non-recurring items, if non-recurring items are excluded, cost-to-income ratio would be 50.6% in 2009 and 50.5% in 2010.
% Cost-to-Income Ratio 1/
Operating expenses rose 8.6% yoy reflecting seasonal costs in the last quarter. Nevertheless, given strong total income, cost to income ratio fell to 50.0% from the 51.5% in 2009.
Improved Productivity
+8.6% yoy

Investor Relations | CLSA ASEAN Forum | February 201114
STRONG CAPITAL BASE TO SUPPORT GROWTH AND EMERGING REGULATORY REQUIREMENTS
Capital Adequacy RatioBasel II - Standardized Approach
Tier I
Tier II
Solid Capital Base
15.5%15.2%16.5%
Should the 2H10 net profit be taken into consideration, CAR would have been 16.7%, while Tier I would have been 12.8%.

Investor Relations | CLSA ASEAN Forum | February 2011
SCB RETAINS A STRONG MARKET POSITION AMONGST THE BIG THAI BANKS
2010 ROE 2010 ROA
Strongest Profitability with Highest ROE and ROA
Capital Adequacy Ratio
Solid CAR (as at Dec 31, 2010)
# of Branches # of ATMs
Largest Branch & ATM Networks (as at Dec 31 ,2010)
Market Capitalization(Baht Billion)
Highest Market Cap (as at Dec 31, 2010)
15
Competitive Positioning

Investor Relations | CLSA ASEAN Forum | February 2011
I. Review of Results – 2010
II. Future Positioning
III. 2011 Targets
16
AGENDA
Pages
3-15
17-27
29

Investor Relations | CLSA ASEAN Forum | February 2011
Comment and outlookKey drivers
* %YOY except for policy rate (% per annum) and exchange rate (THB/USD).** Based on information from commercial banks financial reports, as of December 2010
Source: SCB EIC analysis
Expect Thai GDP growth of 4.0-5.0% in 2011 on back of global economic slowdownGDP growth
Expect hikes to be front-loaded and paused by THB appreciation
Policy rate(end period)
Expect average crude oil price (WTI) of around USD 93 /bbl in 2011, rising 18%YOY, compared to 27%YOY in 2010. Inflation to accelerate on back of rising prices of palm oil and food
Headline inflation
2010
7.5-8.0
Estimates (%)*
3.3
2.00
THB/USD(end period)30.1
Expect THB to appreciate around 5% on back of USD weakening, especially against major Asian currencies
17
4.0-5.0
3.5
3.25
28.5
2011
MacroMACRO TRENDS FORECAST FOR 2011
Expect growth of 5-6% in 2011 due to policy rate hike
Deposit growth (sector-wide)
11.5**
5**Expect milder growth as compared to loan growth mainly on back of decreasing current account surplus
5.0 - 6.0
2.0 - 3.0
Loan growth(sector-wide)

Investor Relations | CLSA ASEAN Forum | February 2011
LONG-TERM POSITIONING
SUPPORTED BY:
A dominant brand - 1st Thai Bank (established in 1906) Large and growing customer base (11 million customers) Largest distribution network (1,019 branches & 8,006
ATMs*) Commitment of major shareholders Full franchise licenses (Securities, Asset Management,
Life and Non-Life Insurance)
STRATEGIC THRUST: To be the PREMIER UNIVERSAL BANK in Thailand through adopting a strong focus on key markets or segments and by rapidly responding to evolving customer needs, better leveraging SCB franchise strengths, and utilizing the implemented market leading infrastructure and systems.
The Bank of Choice
To be the Premier
Universal Bank in Thailand
Vision
Mission
* As at 30 December 2010
Positioning
18

Investor Relations | CLSA ASEAN Forum | February 2011
Banking Sector Loan Growth
Market-share growth strategy in three areas (i.e. Wholesale, Auto Loans, and SME) will be key drivers of the bank’s growth in the near future
Lending Outlook
19
Loan Growth (% yoy)
SCB Loan Growth
The Bank adopted a cautious stance in lending since early 2008, beginning with the U.S. subprime crisis and the financial turmoil in late 2008
10-12%
5-6%
SCB LOAN GROWTH HAS TENDED TO BE WELL AHEAD OF THE MARKET, EXCEPT DURING THE RECENT GLOBAL CRISIS WHEN THE BANK ADOPTED A MORE CAUTIOUS STANCE

Investor Relations | CLSA ASEAN Forum | February 2011
% Non-NII to Total Revenue
24%25%
30%
10%
20%
30%
2009 2010 Medium to Long Term
% Fee income contribution from Wholesale and SME as a % of total fee income
Given the Bank’s strong focus to increase its fee income, the Bank has a medium-to-long term objective of non-interest income accounting for more than 40% of total income and the aggregate fee income contribution from Wholesale Banking and Business Banking (SME) to increase from the current level to above 30% of fee income
Fee OutlookSTRONG FOCUS ON NON-NII SHOULD YIELD BETTER RESULTS
20

Investor Relations | CLSA ASEAN Forum | February 2011
KEY ‘DELTA GROWTH’ DRIVERS OVER THE NEXT 3 YEARS
Major current initiatives to obtain market share growth, over and above business as usual:
1) WHOLESALE - Expansion of market share, particularly in terms of fee income from the blue-chip and the public sector enterprises segment
2) SME - Gain momentum from new SME business model, centered around gaining market share in small and medium scale businesses
3) AUTO LOANS - Expansion of market share in the auto hire-purchase segment and aim to be the #1 originator within 2-3 years
Key Growth Segments
21
Investor Relations | CLSA ASEAN Forum | February 2011
KEY GROWTH DRIVERS OVER THE NEXT 3 YEARS
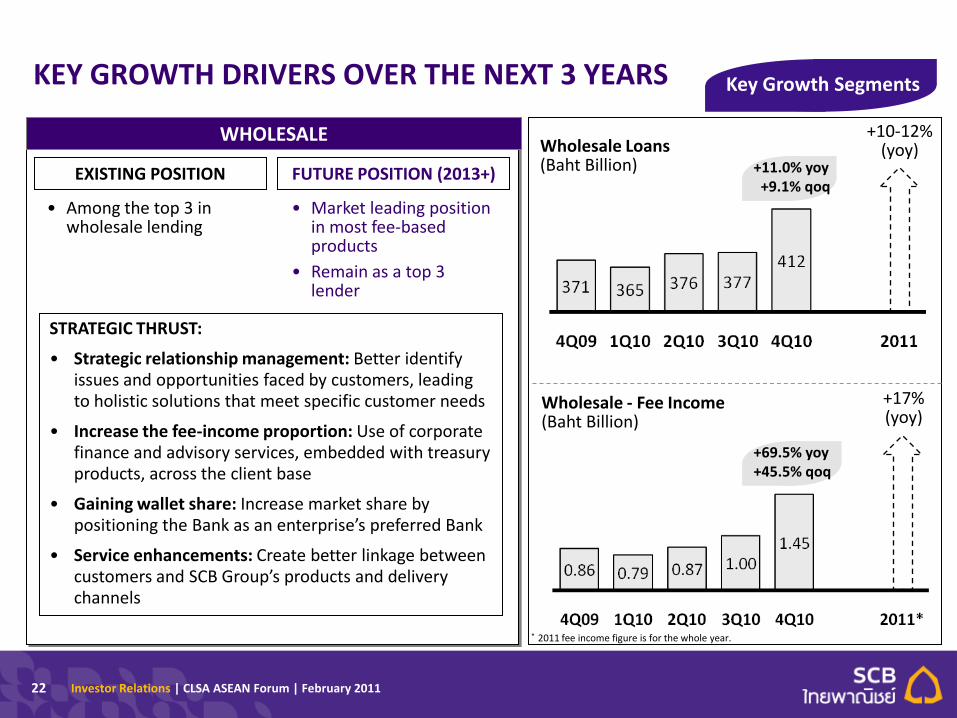
STRATEGIC THRUST:
• Strategic relationship management: Better identify issues and opportunities faced by customers, leading to holistic solutions that meet specific customer needs
• Increase the fee-income proportion: Use of corporate finance and advisory services, embedded with treasury products, across the client base
• Gaining wallet share: Increase market share by positioning the Bank as an enterprise’s preferred Bank
• Service enhancements: Create better linkage between customers and SCB Group’s products and delivery channels
WHOLESALE
EXISTING POSITION FUTURE POSITION (2013+)
• Among the top 3 in wholesale lending
• Market leading position in most fee-based products
• Remain as a top 3 lender
Wholesale Loans(Baht Billion)
Wholesale - Fee Income(Baht Billion)
+10-12%(yoy)
+17%(yoy)
Key Growth Segments
+11.0% yoy+9.1% qoq
+69.5% yoy+45.5% qoq
* 2011 fee income figure is for the whole year.
22

Investor Relations | CLSA ASEAN Forum | February 2011
KEY GROWTH DRIVERS OVER THE NEXT 3 YEARS
STRATEGIC THRUST:
• SCB’s SME Brand: Strengthen the “SCB SME” brand by anchoring marketing activities around core SME products
• Footprint: Expand nationwide footprint through establishing Business Relationship Centers in new areas
• Products: Introduce new products to expand the customer base and generate higher margins. Grow fee-based income, by offering product packages and solutions
SME
EXISTING POSITION FUTURE POSITION (2013+)
• Ranked #6 in the market with Bt 183bn loans1/
• Ranked #3 in the market
• Increase the SME loan volume by about Bt 150 bn over the next three years, with substantial uplift in fee income
SME Loans(Baht Billion)
SME - Fee Income(Baht Billion)
+20%(yoy)
+30%(yoy)
1/ Outstanding at end 2010 will be around Baht 150 billion after the last tranche of commercial loans (Bt 40bn) is transferred to commercial (wholesale bank)
+14.4% yoy+9.0% qoq
+70.2% yoy+19.0% qoq
* 2011 fee income figure is for the whole year.
23
Key Growth Segments

Investor Relations | CLSA ASEAN Forum | February 2011
KEY GROWTH DRIVERS OVER THE NEXT 3 YEARS
STRATEGIC THRUST:
• Strengthen relationships with existing dealers: Using key account management programs
• Footprint: Develop relationships with new dealers
• Distribution network: Leverage the Bank’s comprehensive retail banking platform to introduce new products such as “My Car, My Cash”
AUTO LOANS
EXISTING POSITION FUTURE POSITION (2013+)
• Ranked #1 in Mortgage, Credit Cards, Bancassurance
• Maintain existing #1 position in key products
• #1 in terms of loan origination for Auto loans
SCB-Auto Loans (Baht Billion)
SCB-Monthly Booking of New Auto Loan Contracts(Units x 1,000)
+25%(yoy)
2010
+50%(yoy)
+28.9% yoy+8.8% qoq
24
Key Growth Segments

Investor Relations | CLSA ASEAN Forum | February 2011
SHARPER, MORE AGILE WHOLESALE BANKING GROUP TO RESPOND TO SCALE AND COMPLEXITY CHALLENGES
WHOLESALE BANKING GROUP
Corporate Banking(60+ groups, 7 industries)
Commercial Banking(2,000+ groups, 8 industries)
Corporate Finance
Capital Markets
Market Sales & Trading
Global Transaction
ServicesLoans
Co
vera
ge
Pro
du
cts
Reorganization
25
Investor Relations | CLSA ASEAN Forum | February 2011
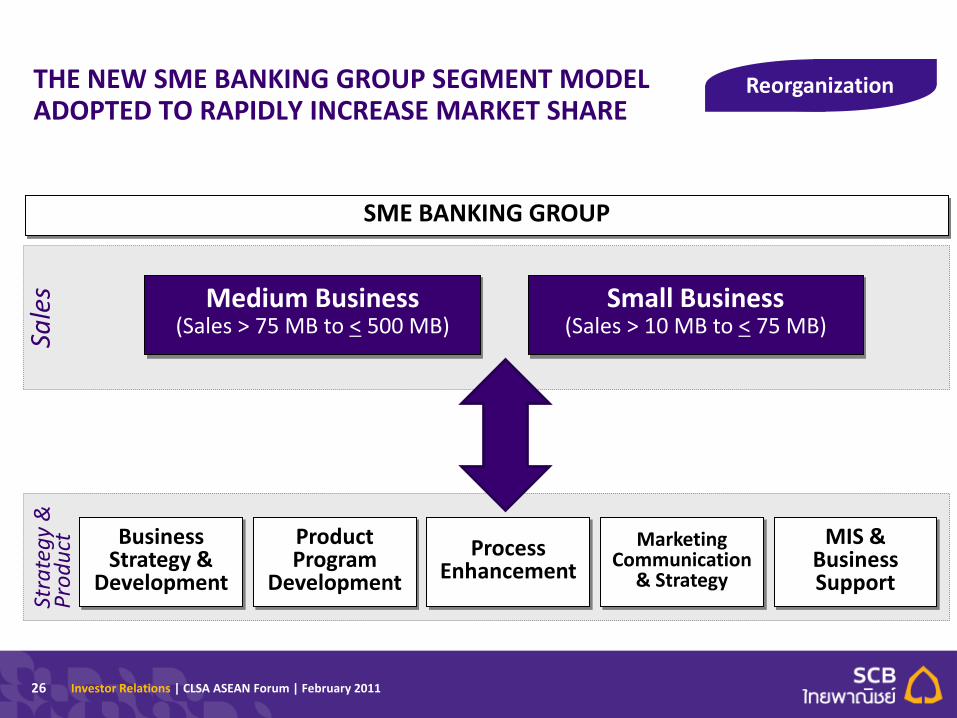
THE NEW SME BANKING GROUP SEGMENT MODEL ADOPTED TO RAPIDLY INCREASE MARKET SHARE
SME BANKING GROUP
Medium Business(Sales > 75 MB to < 500 MB)
Small Business(Sales > 10 MB to < 75 MB)
Business Strategy &
Development
Product Program
Development
Process Enhancement
Marketing Communication
& Strategy
MIS & Business Support
Sale
sSt
rate
gy
&
Pro
du
ct
26
Reorganization

Investor Relations | CLSA ASEAN Forum | February 2011
Wealth Management
Lines of Business
Lending Lines of Business
Shared Channelsfor Origination
& Servicing
• Deposit
• Asset Management
• Bancassurance
• Private Banking
• Mortgage
• Auto Finance
• Credit Card
• S/SME
Branch
E-Channels
AN INVIGORATED RETAIL BANKING GROUP POSITIONED TO GROW OUT FROM ITS CORE AND CAPITALIZE ON EMERGING OPPORTUNITIES
Direct Sales
Customer Segment
Management
& Retail Marketing
IndependentCredit
Risk Function
27
Reorganization

Investor Relations | CLSA ASEAN Forum | February 2011
I. Review of Results – 2010
II. Future Positioning
III. 2011 Targets
28
AGENDA
Pages
3-15
17-27
29

Investor Relations | CLSA ASEAN Forum | February 2011
2011 ASPIRATIONS
29
Targets and Results
2009 Actual 2010 Target 2010 Actual
Profitability
ROE
ROA
NIMs
Loan Growth
Total Loans (yoy)
Cost and Income
Non-NII Growth (yoy)
Fee income Growth (yoy)
Cost to Income
NPLs (gross)
Branches/ATMs
Capital Adequacy Ratio
15.5%
1.6%
3.4%
2.5%
10.4%
10.9%
50.6%
4.41%
987/7,129
16.5%
16%+
1.8%
3.5-3.8%
7-10%
17%
15%+
51%
3.90%
1,040/7,700
ND
16.4%
1.7%
3.63%
12.6%
17.7%
19.4%
50.5%
3.25%
1,019/8,006
15.5%
1/
2/
2/
2011 Target
16-18%
1.8-2.0%
3.6%+
10-12%
ND
15%+
50%
2.9%
1,050+/9,250+
ND
1/
On track to target or higher ND = Not disclosed
1/ Depends on the interest rate environment2/ Stripping out non-recurring. If non-recurring items are included, non-NII growth would be 7.7% in 2009 and 20.6% in 2010, while cost to income ratio would be 51.5% in 2009 and 50.0% in 2010.
2/
2/