clothing and export diversification: still a route to...
TRANSCRIPT

1
Clothing and Export Diversification: Still a Route to Growth for Low Income Countries?
Paul Brenton and Mombert Hoppe1
International Trade Department The World Bank MSN MC2-201
1818 H Street St. NW Washington DC 20433
Tel: (202) 473-4255, Fax: (202) 522-7551 E-mail: [email protected], [email protected]
1 We are grateful to Bobbie Mircheva for excellent research assistance.

2
1. Introduction Diversification into export categories with greater value added than traditional agricultural
exports remains a major objective for many low income developing countries. The clothing
sector was at the forefront of export diversification for many countries that have now achieved
middle or high income status. For the low income countries of today, is clothing a sector that
provides an opportunity for export diversification and the first steps to greater manufactured
exports? On the one hand, the clothing sector remains labor intensive, technology is relatively
simple, start-up costs are comparatively small, and scale economies are not important. All of
these factors favour production in locations where labour costs are low.
On the other hand, there are some important changes in the nature of the global market for
clothing that may condition the role that the sector can play in development relative to previous
episodes of industrialization. Paramount amongst these are the rise of buyer-driven value
chains, the shift towards just-in-time delivery and lean retailing methods and the emergence of
the very large developing countries, China and India, as key clothing suppliers. It is argued that
these changes have led to higher barriers to new entrants and to reduce the margins for clothing
exporters that in turn have been used in the past to fuel investment in other more
technologically advanced activities.
At the same time trade policy continues to shape global trade patterns. On the one hand, tariff
barriers in rich countries remain high and trade preferences can potentially provide a window of
opportunity for low income countries to develop export capacities. On the other hand, many
low income countries tax heavily imports of the inputs that the clothing sector depends upon
and adverse business climates substantially increase costs and effectively push low income
countries further away from global markets.
This paper considers some of the key issues that are relevant in assessing whether the clothing
sector can continue to be a driver of development and the first steps away from sole reliance on
agricultural products towards high-valued added activities. Our focus is on Africa and the issue
of whether the clothing sector can be a driver of trade growth and development and, if so, what
are the necessary conditions in Africa and in the importing countries that will facilitate such an
outcome.

3
The paper then proceeds to an empirical analysis of the determinants of trade flows of clothing
products into the US and EU markets, the main sources of demand for clothing products in the
global economy. We augment a standard gravity-type model to include key features of the
contemporary global clothing market: the concern of large buyers with country specific
governance issues that affect risk and reputation; the importance of high quality infrastructure,
the difficulties for exporters caused when high import tariffs into their domestic market raise
the cost of intermediate inputs.
2. Clothing: a key sector for diversification and growth
The clothing and footwear sectors have been the key sectors in which many countries have
taken the first steps on the path to industrialization. Historically, these sectors together with
textiles played a major role in the initial development of the UK, the US, Germany and Japan
and have been paramount in successive waves of industralisation in Asia encompassing
countries such as Hong Kong, Singapore, Taiwan, South Korea and Malaysia and more
recently China, Indonesia, Sri Lanka, Thailand and Vietnam.
The clothing sector has been a major example where developing countries have been able to
significantly increase and diversify exports with positive effects on incomes, employment and
poverty. Kabeer and Mahmoud (2004) suggest that the production of garments for export in
Bangladesh has generated 1.6 million “new” jobs most of which were captured by women.
Many of these workers tend to be migrants from poorer areas. These authors also find that
wage levels for garment workers were double that of other workers involved in non-tradable
activities.2
The key reasons why the clothing sector has played such as important role in economic
development are: (i) the sector absorbed large numbers of unskilled labour, typically drawing
them from rural agricultural households to urban locations (ii) despite relatively low start-up
investment costs, expansion of the sector provided a base upon which to build capital for more
technologically demanding activities in other sectors (iii) growth of the sector allowed imports
2 There is however, some evidence to suggest that workers in this sector are vulnerable to changing employment contracts and the increasing casualization of work (see Nadvi (2004)).

4
of more advanced technologies to be financed through exports (and by substituting for
imports).3 There seems to be no reason why the sector cannot fulfill these roles for the poorest
countries today. However, as we shall discuss later there are a number of important changes in
the global market for clothing products that condition the way that low income countries can
pursue initial industrialization through the clothing sector. Before turning to these issues, we
will show how the clothing sector has been of key importance to poor countries that have
generated strong growth over the past 30 years enabling them to graduate from the group of
low income countries.
Figure 1 shows the performance of countries that had a per capita income of below USD 500
(in real dollars of 2000) in 1975 and distinguishes between (a) those that had graduated out of
this group by 2004 and those that had not and (b) those countries that have strongly increased
(by a factor of 10 or more) their nominal exports in dollar terms from 1975 to 2004 and those
with slower growth. The first group of columns in the figure shows that for all of the groups of
countries the initial average share of clothing and footwear in exports was low, less than 3% in
those countries that graduated and negligible in those that did not. The next group of columns
shows that the export share of clothing and footwear in 2004 had soared to 30% in countries
that graduated but was only around 8% in the countries that remained in the low income group.
Similarly, for countries with rapidly expanding exports, clothing and footwear accounted for
more than a quarter of exports in 2004. On the other hand, for countries with slow export
growth the clothing and footwear sector was much less important, accounting for less than 5%
of exports in 2004.
The final group of columns in Figure 1 shows the contribution of clothing and footwear to
overall export growth. For graduating countries and countries with fast export growth the
clothing and footwear sectors accounted for more than 20 percent of export growth whereas for
non-graduating countries and countries with slow export growth, clothing and footwear
contributed less than 10% of export growth. Hence, the clothing and footwear sectors have
been key drivers of exports and growth that have enabled a number of countries to exit the
group of lowest income countries. Can the clothing sector continue to be a driver of export
3 Palpacuer et al (2005)

5
growth and diversification for the poorest countries and can the movement of resources into the
sector be a trigger for economic growth and industrialization as it has been in other countries in
the past? The answer to these questions is not straightforward since trade restrictions and trade
preferences continue to be important in shaping global exports of these products. In addition,
there have been important changes in the way the global industry is organized, especially on the
demand side that now condition the climate in which firms in developing countries compete on
the world market. It is to these issues that we now turn.
Figure 1
Clothing and Footwear have been important industries for growing countries
0
5
10
15
20
25
30
35
CLFW share in 1975 CLFW share in 2004 CLFW share in export growth
per
cen
t
fast growers
slow growers
graduated
non-graduated
Source: WDI, COMTRADE, own calculationsSample comprises countries that had a per capita income of below USD 500 in 1975. “Graduated” are those whose per capita income exceeded USD 500 in 2004 (per capita income expressed in constant dollars of 2000). Fast growers are countries that have increased their exports more than tenfold from 1075-2004 (in nominal terms).CLFW (clothing and footwear) share in export growth is calculated as the increase in clothing and footwear exports divided by the total increase in exports (1975-2004)
3. Key issues framing the role of clothing in development
3.1 The impact of removal of quotas against China and India
The climate in which low income countries can drive development from a base created by the
clothing sector is now framed by the presence of extremely large supplying countries in the
global market. In the past, developing countries’ expanding clothing exports did not have to
6
fully contend with the supply capacities of India and China. These countries have now been
freed from the constraints previously imposed by quotas applied in rich country markets. Many
have speculated about the likely impact of these reforms, predicting that markets would become
swamped by Chinese products, with adverse implications for other developing country
producers that export to the developed countries. The following brief analysis of changes in
clothing trade after the removal of quotas suggests that these doom-laden predictions were over
done and that a more nuanced picture is emerging in which some countries are increasing their
exports to the EU and the US at the same time as exports from China have surged.
Overall clothing imports into the US have surged over the past few years. Figure 2 shows how
individual developing country suppliers have fared within the context of overall growing
import demand by presenting the change in the value of US clothing imports between 2004 (the
last year before remaining quotas were removed) and 2006 for the largest suppliers (exceeding
USD 100 million). The figure suggests a wide degree of diversity across exporting countries in
sales to the US over the past two years, with no obvious regional pattern. Some countries in
Asia have experienced declines, such as Malaysia, while other countries, such as Indonesia,
Cambodia and Bangladesh, have managed to substantially increase exports even in the face of
more intense competition from China. Similarly, some exporters in Latin America have seen
exports fall while others such as Nicaragua and Haiti have seen significant increases. Clothing
exports of Sub-Saharan exporters have fallen strongly during both time periods driven by
declines in South Africa, Mauritius and Madagascar.

7
Figure 2: US clothing imports after the end of the ATC, percentage change 2004-2006
IndonesiaCambodia
China, HK, MacaoNicaraguaBangladesh
EgyptPakistan
IndiaHaiti
JordanVietnam
PeruPhilippines
TotalSri Lanka
ThailandMalaysiaKenya
HondurasCosta Rica
ColombiaGuatemala
LesothoEl Salvador
MexicoBrazil
Dominican RepSwaziland
MadagascarTurkey
MauritiusNepal
MongoliaSouth Africa
-100.00% -80.00% -60.00% -40.00% -20.00% 0.00% 20.00% 40.00% 60.00%
Source USITC
The European market differs from the US market in key regards. First, it is much less
homogeneous, due to differences in size, tastes, language, marketing and so on. Second, overall
imports of clothing products has increased more strongly than in the US over the last two years.
Again, Figure 3 suggests substantial differences across countries in exports of clothing to the
EU with no clear pattern of those who have been adversely affected by increased competition
from China. Some countries have performed much better in the EU market than they have in
the US, for example Madagascar.

8
Figure 3: EU25 clothing imports after the end of the ATC, percentage change 2004-2006*
China, HK, MacaoVietnam
MadagascarIndia
MoldovaPeru
BangladeshSri Lanka
TotalAlbania
EgyptMalaysiaMexico
Bosnia and Herz.CambodiaIndonesiaTurkey
LaoThailand
PakistanMoroccoTunisia
UkraineMauritius
CroatiaBelarusSyria
BrazilPhilippines
SloveniaMyanmar
South Africa
-100% -80% -60% -40% -20% 0% 20% 40% 60% 80%
Source: COMEXT, values for 2006 are estimated based on data for first 11 month and historical ratio (yearly imports/imports first 11 months)
Chinas4 exports of clothing to the global market have nearly doubled since 2002 from USD 54
billion to USD 93 billion in 2005. Exports to the EU and the US5 account for more than half of
this increase, while all other regions have imported more Chinese garments. Exports of clothing
to other industrial countries in East Asia have increased by 30 percent and these markets are
now similar in importance to the US and the EU. While clothing exports have grown strongly,
China has increased its imports of raw materials and textiles from 18.6 to 23.8 USD billion
over the same time period. Imports from the EU (+USD 0.7b) and the US (+USD 1.7b) and
Sub-Saharan Africa (+USD 0.6b) have increased in particular. China imports cotton that is not
carded and not combed almost exclusively from Sub-Saharan Africa with Burkina Faso, Benin,
Mali, and Côte d’Ivoire accounting for 66 percent of these imports. It appears, however, that
4 It appears very likely, that large amounts of goods have historically been transshipped between China, Macao and Hong Kong in order to pass around existing quotas. For this section our definition of China hence groups those three territories together and only takes exports towards the outside into account. Figures are based on data reported by China to COMTRADE. 5 While COMTRADE, for HS61-63, reports exports of China + Hong Kong + Macao of USD 13.7b (24.6b) in 2002 (2005), USITC reports imports of USD 13.8b (25.5b) from these three countries.

9
China is only importing a small share of its cotton consumption. According to the US Bureau
of Industry and Security, China produced 25.5 million bales of the 30.4 million they used in
2003/04.6
In general, as the global demand for Chinese manufactured products increases, dollar-
denominated wages in China will tend to increase, in response to higher wage demands from
Chinese workers (especially if the rural and urban labor markets remain partially segmented)
and from the inevitable additional upward pressure on the yuan. There is evidence that this
process is already underway. In 2004, real wages in China were 2.11 times the level of 1989,
and the rate of wage increase accelerated in 2004–2005, especially in the coastal regions
(Yusuf, Nabeshima, and Perkins 2006). In 2005 alone, according to the People’s Bank of
China, average wages for Chinese workers rose by 14.8 percent (China Daily, “Worker
Shortage Drives Salary Rise,” May 27, 2006). Thus China’s development should not keep the
poorest countries from being able to export low-skill-intensive products, as long as these
countries can manage to create and sustain a business climate that supports investment and
trade.7
Figure 4: Average wages in China have increased stronger than in other countries
30
80
130
180
230
1995 1996 1997 1998 1999 2000 2001 2002 2003 2004 2005
China
South Africa
Philippines
Mexico
India
Sources: China Statistical Yearbook 2005, People’s Bank of China, ILO (Philippines, South Africa), IBGE (Brazil), Banco de Mexico, Ministry of Statistics and Programme Implementation (India); exchange rates from IMF IFS. Wages are average wages for China, the Philippines, and South Africa, average private sector wages in Brazil, and manufacturing wages for India and Mexico. 1998-2000 wages for the Philippines have been estimated using observed wages from 2001 and projecting them backwards using GDP per capita growth rates.
Internationally comparable average wage rates, indexed, 1998=100
6 http://www.bis.doc.gov/news/2004/03AnnualRept/AppH_6.htm 7 This paragraph is based on Global Economic Prospects 2007

10
Hence, despite rapidly increasing exports from China to the main markets in developed
countries, there appears to remain opportunities for other developing country exporters to
continue and indeed expand exports of clothing. Wages in coastal China are rising and other
developing countries with lower wages will be able to compete if productivity levels are
sufficient, high non-factory floor costs, such as security, governance can be reduced and
necessary infrastructure is in place. In addition, as we shall discuss below, demand for clothing
is increasingly being defined by global buyers who are wary of the risks of concentrating their
demand on suppliers in a small number of countries. At the same time the nature of consumer
demand is changing offering increasing opportunities for supplying niches in the overall
market. A small share of a niche in the EU or US can still entail substantial exports for small
developing countries.
3.2 Trade Policy for the Clothing Sector Remains a Key Issue
Even after the removal of quotas under the ATC, the global clothing (and textile) market
remains heavily distorted. Distortions can be found both in rich countries markets for finished
goods as well as in those developing countries that produce apparel products. Tariffs on
clothing products in many developing countries are high, often being greater than 20 per cent.
This creates a bias against exports and tolerates the survival of inefficient firms. As a result,
resources remain in low productivity firms and the potential growth of high productivity export
oriented firms is suppressed. In addition, with the splitting up of the production chain for
clothing and footwear, producers of final goods need to import a wide range of intermediary
inputs. In many developing countries these inputs are subject to high import duties, increasing
the costs of production and undermining the competitiveness of actual and potential exporters
of final products. Table 1a shows the price premium that producers in many countries pay on
their inputs due to high tariffs that create a wedge between domestic and world prices. Even
though drawback systems often exist, they are often poorly implemented, have very long
reimbursement cycles and are costly for firms to adhere to.
In addition to import duties on intermediate inputs, long delays for customs clearance and
complex import and export procedures put a further cost burden on firms seeking to compete
with firms that operate in more friendly environments. Table 1b shows the time that is needed
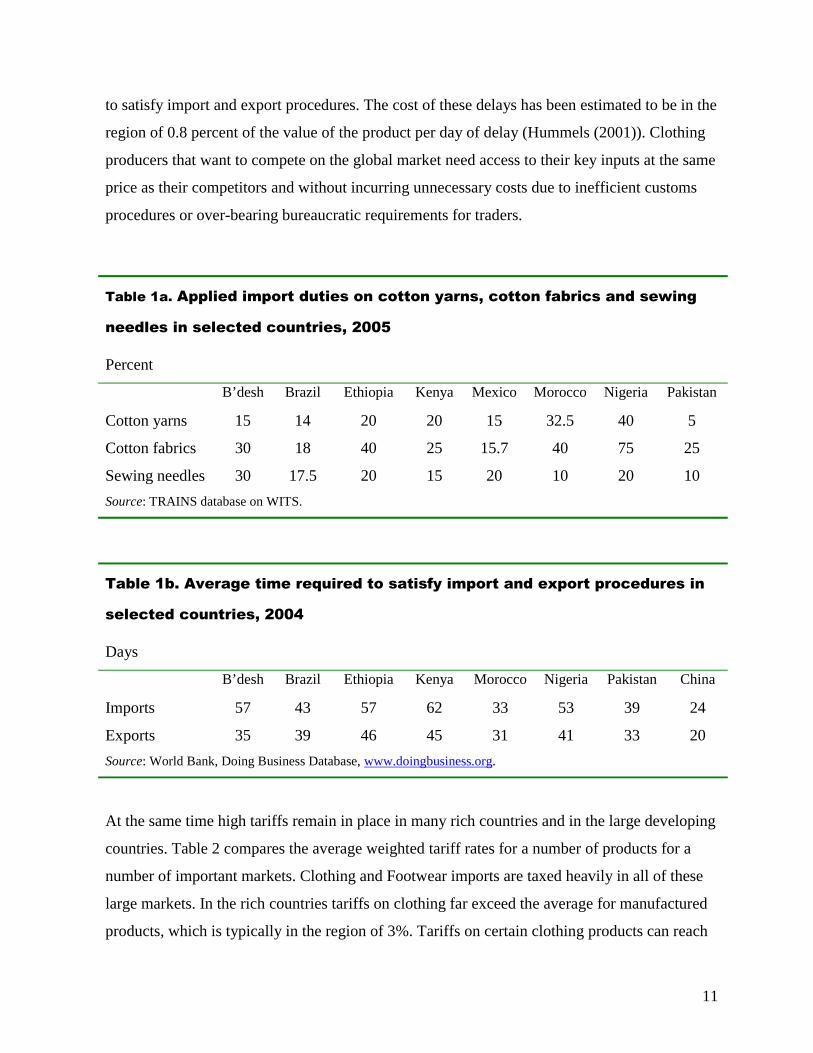
11
to satisfy import and export procedures. The cost of these delays has been estimated to be in the
region of 0.8 percent of the value of the product per day of delay (Hummels (2001)). Clothing
producers that want to compete on the global market need access to their key inputs at the same
price as their competitors and without incurring unnecessary costs due to inefficient customs
procedures or over-bearing bureaucratic requirements for traders.
At the same time high tariffs remain in place in many rich countries and in the large developing
countries. Table 2 compares the average weighted tariff rates for a number of products for a
number of important markets. Clothing and Footwear imports are taxed heavily in all of these
large markets. In the rich countries tariffs on clothing far exceed the average for manufactured
products, which is typically in the region of 3%. Tariffs on certain clothing products can reach
Table 1a. Applied import duties on cotton yarns, cotton fabrics and sewing
needles in selected countries, 2005
Percent
B’desh Brazil Ethiopia Kenya Mexico Morocco Nigeria Pakistan
Cotton yarns 15 14 20 20 15 32.5 40 5
Cotton fabrics 30 18 40 25 15.7 40 75 25
Sewing needles 30 17.5 20 15 20 10 20 10
Source: TRAINS database on WITS.
Table 1b. Average time required to satisfy import and export procedures in
selected countries, 2004
Days
B’desh Brazil Ethiopia Kenya Morocco Nigeria Pakistan China
Imports 57 43 57 62 33 53 39 24
Exports 35 39 46 45 31 41 33 20
Source: World Bank, Doing Business Database, www.doingbusiness.org.

12
as much as 12% in the EU and more than 20% in the US. Markets in the fast growing
developing countries remain closed to poorer countries with average tariffs in excess of 20%.
Total imports of clothing products by Brazil were only about one percent of US clothing
imports in 2004.
The EU, US and Japan offer preferential access to many low income countries, such that these
margins of preference could have substantial impact of competitiveness. However, the rules of
origin that are applied under these schemes are crucial. Figure 5 shows that prior to the end of
the ATC, exports of apparel from African least developed countries (LDCs) to the EU
stagnated despite preferences, whilst exports to the US under AGOA grew very strongly.
Exports of apparel from African LDCs to the EU and US were almost equal in 2000, but the
value of exports to the US in 2004 was almost four times greater than the value of exports to
the EU.
Table 2. Applied average MFN tariffs on clothing/footwear and other products in
selected countries, 2005
Percent
EU USAa Japana China Indiac Mexicoa Brazil South Africab
Manufacturing
(other than
CLFW)
3.1 3.1 2.6 8.6 27.8 13.8 10.7 5.9
Clothing and
Footwear
11.0 10.8 9.9 15.9 30.0 34.5 19.9 20.8
# of lines with
specific tariffs in
HS61-64
0/517 0/782 25/760 0/423 115/323 0/488 0/337 303/434
Source: WTO IDB database on WITS
a=2004, b=2003, c=2002,
simple averages calculated for those lines that do not carry specific duties or mixed duties (only in the case of the
US, the simple average of all ad-valorem duties (disregarding lines with ad-valorem and specific duties) raises
protection to 11.7 percent))

13
Figure 5: Non-restrictive rules of origin strongly stimulated US imports of apparel from African LDCs; but EU imports stagnated in the face of strict rules
0
100
200
300
400
500
600
700
800
900
1996 1997 1998 1999 2000 2001 2002 2003 2004 2005 2006
US Imports of apparel from African LDCs
EU Imports of apparel from African LDCs
Source: USITC and Eurostat
The key factor explaining why exports to the US grew much faster than to the EU is the rules
of origin. EU rules stipulate production from yarn. This entails that a double transformation
process must take place in the beneficiary with the yarn being woven into fabric and then the
fabric cut and made-up into apparel. These rules prohibit the use of imported fabric, although
cumulation provisions allow for the use of inputs produced in other ACP countries. To obtain
preferences, apparel producers must use local, EU or ACP fabrics. They may not use fabrics
from the main fabric-producing countries in Asia and still qualify for EU preferences—a
binding restriction, since few countries in Africa have competitive fabric industries. The EU
rules do not allow producers in African LDCs the flexibility they currently have under AGOA
to source fabrics globally. It is worth remembering that the EU has granted preferences to
African countries for apparel subject to these strict rules of origin for more than 20 years under
the Lome and then Cotonou agreements. However, these strict rules have done little to
encourage the development of an efficient fabric industry in Africa, the main justification for

14
their imposition,8 and are likely to have severely constrained the impact of preferences in
stimulating the clothing industry.9
The third country fabric rule of AGOA has recently been extended until 2013, although the
uncertainty over its extension in 2006 may have contributed to some of the fall in African
LDC’s exports to the US in that year. Thus, African countries will have effective preferential
access to the US market during this period to provide a spur to the development of an efficient
clothing sector. The EPA negotiations that the EU is holding with the ACP countries offer an
opportunity for the negotiation of less restrictive and more development friendly rules of origin
for all products, including clothing. Such an outcome would make EU preferences more
effective in stimulating exports from Africa.
Developing countries and especially least developed countries, face much higher trade-related
costs than other countries in getting their products onto international markets. Sometimes these
reflect institutional problems within the countries themselves, such as inefficient and corrupt
customs, which require a domestic policy response. However, they also reflect the severely
weak infrastructure of many countries that is crucial to support trade activities (in particular
transport, telecommunications, energy) and the lack of access of firms in these countries to
standard trade facilitating measures such as insurance and trade finance. Many developing
countries also possess little capacity within government and the private sector to identify key
trade barriers, to define a broadly supported trade strategy and to motivate the cross
government action that is needed to alleviate such barriers. All developing countries in Africa
face enormous problems in providing necessary infrastructure and a supportive policy
environment for trade.
The argument for trade preferences is that they can provide a temporary mechanism whereby
the margin of preferences allows firms in developing countries to offset these higher costs and
establish an export presence and ultimately global competitiveness in industries and activities
in which the country has a comparative advantage. It is important that the window is temporary 8 See Brenton (2006) for a discussion of why restrictive rules of origin are inappropriate as a development tool and are more likely to reflect protectionist interests in the preference granting country. 9 See Brenton and Ozden (2005) for a more detailed analysis of the impact of the EBA and AGOA on apparel exports from African LDCs and the role of the rules of origin.

15
so that inefficient, high-cost industries with entrenched lobbies do not constrain flexibility and
adjustment. Multilateral trade liberalization contributes by ensuring that preferences have a
short “half-life” and in limiting the long-term trade diverting impact of preferences on other
countries (which typically will be other developing countries). However, it is crucial that the
key factors that raise the costs of trading in developing countries are addressed as otherwise
sustainable and competitive activities will not be created. This applies to countries that benefit
from preferences as well as those that do not.
Labour costs in Kenya are relatively low compared to key competitors. Information on labour
cost per shirt produced suggests that costs in Kenya ($0.18) are below those of China ($0.29)
and comparable with those of India ($0.17). However, the World Bank’s Investment Climate
Assessment for Kenya highlights how competitiveness is undermined by high indirect costs,
with the main barriers being corruption, crime and infrastructure. The key infrastructure
barriers are poor transport, the high cost and unreliability of power services and costly and poor
quality fixed-line telephone services. These costs undermine the advantages that Kenya
possesses in terms of low cost, relatively well-educated labor; they depress productivity and
constrain investment. Eifert et al (2005) conclude that for Kenya “a long history of
entrepreneurship is reflected in strong potential factory-floor productivity, but high costs and
losses impede competitiveness”. The key implication of the poor business environment is lower
returns to labour in production which depresses labour demand and real wages.
Whilst these non-reciprocal trade preferences for low income countries may be an important
aspect of competitiveness, they are granted in a context in which many other suppliers have
preferential access to the key developed country markets. NAFTA has had a profound impact
on the nature of sourcing in North America whilst in Europe trade agreements with the
Mediterranean countries and Turkey and more recently Eastern Europe have had an important
impact on the structure of EU clothing imports. These regional trade agreements have tended to
coincide with a shift in demand in rich countries towards time sensitive products and a desire
by buyers in those markets to move to lean retailing strategies both of which put a premium on
proximity. We return to this issue below after we look at the growing importance of buyer-

16
supplier relationships in the global market for clothing products and how this affects the
prospects for clothing being a driver of development in today’s low income countries.
Export Processing Zones (EPZs) have played an important role in export diversification
towards clothing in many developing countries. By creating a framework for export oriented
firms that corrects for many of the usual administrative, infrastructure-related, and utility-
supply problems investors face, exports of clothing have surged in EPZs of many countries. In
Madagascar’s EPZ, for example, 124 of 180 operating firms were textile companies and the
share of manufactures in exports (nearly completely clothing) grew from next to nothing to
nearly 50% of total exports in 2001 (Cling et al., 2005). EPZs in other countries have also seen
large investments and strong export performance in clothing over the last decades [e.g. in
Bangladesh or Mauritius]. An interesting issue is whether this role of EPZs remains relevant in
a global market dominated by buyer driven value chains – an issue to which we now turn.
3.3 The rise of global buyers
A key issue of relevance to discussion of the development role of the clothing sector in the
modern global economy is the evolving relationship between buyers in developed country
markets and suppliers in developing countries. A large literature has emerged on the rise of
global value chains.10 These chains initially emerged in the clothing sector in the 1950s and
1960s as buyers in developed countries contracted out production to low-wage developing
countries. Over the past 4 decades these chains have matured and the sourcing networks have
spread over a large number of countries. Some have argued that the mature global chains of
today restrict the opportunities that the clothing sector offers developing countries for
diversification and growth (Palpacuer et al (2005)).
Often suppliers are not producers themselves but they have outsourced their production to other
companies and act as intermediaries between retailers and producers. Some can also own their
production facilities. Retailers can also own their production facilities or source directly from
producers. In the apparel market, large “trading houses” function as intermediaries between
retailers and producers. They obtain orders from final goods retailers, pass them on to a number
10 See, for example, Gereffi (1994)

17
of smaller producers and collect production from different sources. They often own factories
and take the ultimate decisions of where to invest, bounded by retailers’ demands regarding
price, time to market, corporate responsibility, labour laws and so on.
Analysis of the clothing and footwear sectors has stressed this rise of ‘buyer-driven’ chains
where retailers and brand name marketers entirely outsource production. Buyers, it is argued,
re-engineer the division of labour within the chain so as to capture a higher share of the income
generated. This is achieved by shifting a succession of typically low-profit activities and
functions to suppliers within the chain. In the clothing sector the buyers increasingly require
suppliers to take responsibility for fabric and input sourcing11, design services, supplier-
managed inventory, production flexibility, regular visits to retailer, product development and to
provide invoicing on a 90 day basis.
This has two implications for our discussion of the development role of the clothing sector.
First, it suggests that barriers to entry to firms seeking to become exporters on the global
market maybe higher than in the past. Firms will only be able to sustain clothing exports within
these global chains if, in addition to the basic manufacturing function, they can provide the
range of services activities that the buyers increasingly demand. This is likely to put greater
emphasis on local infrastructure services that support low cost and fast telecommunications and
transport services as well as on the human capital requirements of these additional activities.
In addition, it has been argued that, since ‘core’suppliers are now expected to provide an
increasing variety of services, there will be significant transaction costs to the buyer if they
were to shift suppliers. It is suggested therefore that buyers will now be less footloose in their
relations to suppliers and therefore there will be fewer opportunities for new suppliers. These
changes add up to increasing requirements on suppliers for financial and human resources to
meet the increasing demands of global buyers. Second, the reorganization of the chain and the
dominance of the buyers has reduced the margins that clothing production can generate and
provide funds for investment into higher value-added activities. On the other hand, where firms
11 although it appears that some buyers provide a preferred list of inputs suppliers that must be used – this is important in the context of the rules of origin in preferential trade agreements, since if these input suppliers are not located in a country from which inputs can be cumulated then preferential access will not be granted

18
can provide these functions, there may be important spin-offs from learning and upgrading in
the clothing sector that assist the development of other sectors in terms of logistics and supply
base management that will facilitate investment into activities in other global chains.
There are two distinct decisions that influence sourcing patterns. First, large retailers make a
general assessment of countries, including or excluding them as sourcing locations based
mainly on political and economic risk considerations. In addition countries are increasingly
being assessed with regard to a range of regulatory and governance issues in response to
increased consumer and NGO attention to labour standards and corporate responsibility.
Second, firms within countries are assessed on the basis of issues such as production costs,
managerial capacities, lead times, quality and flexibility in production and availability of
supporting services. There are differences in sourcing practices across markets and between
buyers of different size. Whilst buyers in large homogeneous markets are demanding more of
suppliers in developing countries this is not the same for smaller firms in small countries. For
example, Palpacuer et al (2005) find important differences between the sourcing practices of
clothing buyers in the UK, France and Scandinavia. Our empirical analysis below will attempt
to capture how are these changes in the nature of clothing chains and the role of global buyers
have become reflected in the pattern of global clothing trade.
3.4 The shift to just-in-time
Other authors (Abernethy et al (1999)) have drawn attention to the increasing importance of
time. Weil (2006) points towards the importance of “lean retailing” and describes some of the
effects this has on the competitive position of different countries. He concludes that clothing
products can be categorized either as fashion goods (such as women’s dresses and seasonal
products that follow a one-time order and where stocks usually not replenished afterwards) and
standard goods (such as men’s jeans and t-shirts). Lean retailing is of particular importance for
the latter category as with the automation of managing inventory, the costs of holding inventory
have been passed on to suppliers that are situated upstream in the supply chain. This demands
short lead times for (varying amounts of) replenishment and gives a proximity advantage to
certain suppliers.

19
For fashion goods, however, traditional cost factors determine the sourcing decisions and the
market is characterized more by price competition. Evans and Harrigan (2003) discuss how the
demand for timely delivery has shifted the sourcing of US imports to nearby countries. Thus
low income countries that are not proximate to the main importing countries will find it
difficult to penetrate the part of the global market that is driven by lean retailing and the need
for timely delivery, especially so if customs procedures are long and cumbersome, ports are
inefficient and costs and telecommunications expensive and unreliable.
3.5 Import saturation in rich countries limits margins
In past episodes of industrialization driven by the clothing sector, profits and learning from
expansion of the sector paved the way for entrepreneurs to invest in new and higher value-
added activities. There are two factors that it has been suggested may undermine this evolution
for today’s low income countries. First, demand in rich country markets is growing more
slowly and, second, these markets are now import saturated. Thus, expansion of exports to
these markets will have to be driven by substitution away from other developing country
suppliers providing less scope for the more significant margins that occurred in the past when
imports from Asian countries were substituted for higher cost domestic production. However,
these assertions are not entirely supported by the data.
Consumer expenditure on clothing and footwear has increased by 46 percent in EURO-terms
for the countries of the EURO-zone between 1990 and 2004 (Euromonitor, European
Marketing Data and Statistics 2006). Spending per capita amounted on average to a little less
than 1100 USD in 2004, varying widely between countries. Of a total of EUR 272 billion that
was spent on clothing and footwear in the EURO-zone in 2004, EUR 45 billion were imported
from countries other than the EU25, this represents an import penetration of non-EU countries
of just 16.5 percent.12 This indicates that the clothing market is growing strongly, in particular
due to rising incomes in Greece, Portugal, Ireland, and Spain, but also in the Netherlands and
Italy, and that there is ample room for increasing exports to the EU as import penetration
remains low.
12 This percentage most probably understates the true share of imported garments in final consumption as the “brand” value will most likely not be included in the import value.

20
Per capita spending on “apparel and services”13 in the US, has remained rather constant over
the last years. It fell by nearly 12 percent from 2000 to 2003 but increased by 10.7 percent in
the following year, leaving the per capita spending on apparel and services slightly below its
level in 2000 (Consumer expenditure in 2004, US Bureau of Labor Statistics), changes in
spending differ by category. This means that the share of annual expenditures spent on apparel
and services has decreased from 4.9 percent in 2000 to 4.2 percent in 2004. This share has been
5.7 percent in 1990.
4. The empirical analysis
We now turn an empirical analysis of the factors that determine the global pattern of sourcing
of apparel products. Ideally, we would estimate demand and supply equations in both importing
countries and exporters. Unfortunately, data on prices are unavailable (unit values can be used
but they are only a proxy) and it is very difficult to match data on domestic output with that on
trade. As a consequence, we follow the majority of empirical studies of trade flows and utilise
the gravity model, the mercilessly flogged workhorse of empirical international trade studies. In
the standard gravity approach, exports from one country to another is pulled by the economic
mass of the importer and constrained by the friction arising from the costs of trading that is
captured by distance. In our application, we model separately the allocation across supplying
countries of US and then EU import demand, the two major importing markets in the global
economy, a comprehensive set of detailed clothing product categories.
We supplement a standard gravity model approach of the determinants of bilateral trade flows
by including factors that reflect that clothing trade flows are now largely determined by the
investment and allocation decisions of large international investors and buyers. These factors
include the quality of governance and stability in the country, infrastructure, and the level of
tariffs in the exporting country to capture the cost of importing intermediate inputs. Producers
of clothing in countries with high import tariffs will have to pay above world prices for their
key inputs and therefore will be less able to compete on world markets.
13 This category includes jewelry, watches, and drycleaning.

21
One implication of the attention to country characteristics is that buyers may not source from
individual countries if certain thresholds regarding risk, governance, distance and economic
size are not met. In fact there are a large number of zero entries in our data set of EU and US
bilateral imports for a comprehensive set of detailed clothing product categories. Ignoring these
zeros and simply estimating a gravity equation for the observed trade flows would suffer from
selection bias.
To capture these features of global clothing trade we use a two-stage modeling approach in
which we first estimate an equation of the probability that country i exports product k to the US
(EU). In a second stage we then estimate a regression of the magnitude of the observed trade
flows. Our approach follows that of more recent applications of the gravity model to bilateral
trade flows such as Francois and Manchin (2007) and Helpman et al (2007). In the first stage
we estimate the following probit regression that explains whether exports to the overseas
market occur at all:
1) 1,,3,2,1,, ')( uXINFTPWGIEP tititititki ++++= γβββ
Where )(EP is a dummy variable that takes the value of 1 if US (EU) imports from a given
country in a given product category are positive, and 0 when no imports are observed. The
explanatory variables are an aggregate indicator for the quality of governance tiWGI , of
country i in year t , a variable describing the overall trade regime in the exporting country
tiTP , , an index for the quality of infrastructure INF , a dummy variables for African countries,
a dummy for English-speaking AGOA beneficiaries, and a dummy for trade relationships
between African countries and the EU. These variables supplement the standard gravity
variables in tiX , : log of per capita income, log of per capita income squared, to allow for a
non-linear impact of income per capita on trade, log of population, log of distance, log of
distance squared and a measure of the share of resources in total exports to reflect that resource
rich countries are less likely to have a comparative advantage in manufactured products.

22
The second stage of the model estimates a log-linear equation explaining the magnitude of the
observed trade flows. The variables included are the same as those used to explain the
propensity to export although we control for differences in total demand for each HS4 category
in the EU and the US.
2) 2,4,3,2,10,, ' uXTotDemandINFTPWGIIMP tititititki ++++++= γβββββ
Variable description and data sources
We use US and EU imports of clothing products classified in at the heading level (4 digit) of
HS-chapters 61-63. Trade data are obtained from the USITC website and the EU COMEXT
database. Data on the quality of governance are obtained from the Worldwide Governance
Indicators (2006). As the six indicators contained in that dataset are highly correlated, including
them separately inevitably leads to problems of multicollinearity. Following Francois and
Manchin (2007) we use principal component analysis and retain one vector which accounts for
80% of the total observed variance. All elements of the vector are positive, making
interpretation of the vector’s coefficient in the regression simple. An increase in any of the
measured dimensions of government quality increases our aggregate measure and hence the
effect on the propensity to export a given apparel product to a given market is qualitatively
similar for all the contained indicators. In general, the quality of governance is better in
countries with higher per capita income. In order to isolate the relative quality of governance
(per capita income is an explanatory variable in our gravity model), we regress this vector of
governance on the log of per capita income and include the residuals as an independent variable
in the regression.
We also use principal component analysis for indicators of infrastructure availability (main
telephone lines, internet users per 1000 inhabitants, road density (relative to both inhabitants
and country size)) to deal with the collinearity of the individual variables. The retained vector is
again regressed on the log of per capita income and residuals are then used in the regression
equation. We use the simple average of import tariffs to measure import protection in exporting
countries, with the data being obtained from WITS. Data on per capita income and population
as well as on the quality of infrastructure (in which extrapolation had to be used for a number

23
of countries to achieve a complete dataset) were taken from the World Development Indicators
Database, while data on distance to the market (weighted by population within the exporting
country) and internal distance within countries came from datasets of CEPII. The dataset
comprises 124 exporting countries and here we report results for the year 2004 but have
estimated using a panel of 1996, 1998, 2000, 2002, 2003, 2004, and 2005 and obtained very
similar results.
Model results
We start by estimating the first stage on data for the US, where imports of clothing under
AGOA have been particularly dynamic over the last 5 years (see Table 3). The coefficients on
the standard gravity variables carry the expected signs and are strongly significant in all
specifications of the model. Distance to the US has a negative but weakening effect, while per
capita income has a positive but decreasing effect on the propensity to export to the US. Large
countries (in terms of population) are more likely to export a given product to the US while
countries rich in resources and which therefore will not have a comparative advantage in
manufactured products such as clothing, are less likely to export to the US.
Moving onto the estimates of the coefficients on the other variables included to explain the
propensity to export we find a positive impact of the relative quality of governance. This is
strongly significant and robust across the different specifications of the model.14 The level of
tariff protection against imports in the domestic economy of the exporter has a statistically
significant and negative effect on the propensity to export apparel goods to the US, although
there is some variation in the degree of significance across all the different specifications.
Finally, the coefficient of the infrastructure index is positive and significant in the first
specification of the model, but is not robust across the other specifications, when an Africa
dummy is included. This suggests that much of the explanatory power in the infrastructure
variable comes from the observations for Africa.15
14 In addition to our approach of using principal components, we also include each of the government indicators independently on the right hand side (and dropping our combined indicator of governance). Each of the six indicators had a positive and statistically significant coefficient (which differed only slightly for each of the six indicators). Comparing the resulting coefficients on each of the six indicators, it appears that the propensity to export is most sensitive to the rule of law, government effectiveness, and control of corruption. 15 Other studies, such as Francois and Manchin (2007) and Habiyaremye and Ziesemer (2006) find a strong impact of infrastructure on aggregate exports. We are concerned whether the data we have available for measuring

24
Table 3: Propensity to export clothing products at 4digit level (US 2004 dataset) I II III IV V VI
Quality of governance 0.07 0.09 0.05 0.05 0.05 0.05 [0.016]** [0.016]** [0.014]** [0.013]** [0.013]** [0.013]**
Distance -6.81 -7.75 -6.32 -4.83 -5.78 -3.92 [1.931]** [1.877]** [1.534]** [1.563]** [1.596]** [1.631]*
Distance^2 0.38 0.44 0.36 0.27 0.33 0.23 [0.110]** [0.107]** [0.088]** [0.089]** [0.091]** [0.092]*
Per capita income 1.01 0.68 0.61 0.53 0.58 0.48 [0.237]** [0.240]** [0.231]** [0.232]* [0.229]* [0.226]*
Per capita income^2 -0.06 -0.04 -0.03 -0.03 -0.03 -0.02
[0.016]** [0.016]* [0.016]+ [0.016] [0.016]+ [0.016]
Population size 0.20 0.19 0.20 0.20 0.20 0.19 [0.015]** [0.016]** [0.014]** [0.014]** [0.014]** [0.013]**
Average import tariffs -0.12 -0.09 -0.11 -0.12 -0.11 -0.11 [0.048]* [0.048]+ [0.044]* [0.044]** [0.044]* [0.043]*
Infrastructure measure5 0.04 0.02 -0.01 -0.01 -0.01 -0.01 [0.019]* [0.017] [0.019] [0.018] [0.019] [0.019]
Resource share in exports -0.51 -0.52 -0.51 -0.52 [0.102]** [0.099]** [0.101]** [0.097]**
Africa-dummy -0.28 -0.25 -0.33 -0.28 -0.32 [0.069]** [0.061]** [0.056]** [0.060]** [0.056]**
AGOA_apparel 0.09 [0.072]
AGOA 0.18 0.17 [0.069]** [0.068]*
Other US preferences 0.17
[0.065]**
Observations 5412 5412 5412 5412 5412 5412 Robust standard errors in brackets + significant at 10%; * significant at 5%; ** significant at 1%
note: AGOA is a dummy variable that takes a value of 1 if the exporter is an English-speaking AGOA beneficiary and the observation considers exports to the US, it takes 0 otherwise. AGOA_apperel is similar but only marks those relationships that fall under the special apparel provisions
African countries have a consistently lower propensity to export than other countries as
indicated by the negative and significant coefficient on an Africa dummy that is robust across
the different specification (we also re-estimated the model including a range of other regional
dummies but in contrary to the other dummies, the Africa dummy remains consistently
infrastructure (number of main telephone lines, internet users per 1000 inhabitants, and road density) are the most appropriate for exports of clothing.

25
negative and significant). A dummy for English-speaking AGOA beneficiaries is statistically
significant suggesting that AGOA has partially mitigated the lower propensity of African
countries to export apparel products to the US, although the positive effect of AGOA cannot
fully compensate. Finally, a dummy variable for other countries (Caribbean and those with
whom the US has signed an FTA) that have preferential access to the US is positive and
significant.
These results demonstrate, in addition to economic size, wealth, natural resource base and
distance, the importance of the quality of governance, the nature of domestic trade policy and
access to US preferences in influencing the propensity of a country to export clothing to the
US. Further, the analysis suggests that, even after allowing for these additional governance and
trade policy factors that are important in explaining the sourcing decisions of large buyers,
African countries are less likely than other countries to export apparel products to the US.
Chisik (2003) has shown how a poor country-of-origin reputation can be self-fulfilling and
determine the average quality of a country’s exports as well as the types of products in which it
specializes. Countries may be unable to exploit normal comparative advantages due to a lack of
reputation and domestic firms will underinvest in raising their own quality. Chisik suggests that
subsidies to R&D or human capital accumulation at the national level lower the costs of firms
in raising quality and do not require firm specific knowledge or payments that limit the
effectiveness of policies such as export licences or quality stamps. Our analysis suggests there
may be a problem of reputation for Africa as a whole. This means that firms in particular
African countries may not only be constrained in raising quality and reputation by their own
domestic policies and national reputation but might additionally be encumbered by the
reputation of Africa as a whole.
Estimation results for the EU as an importer are similar but show some significant differences
with regard to the size of the coefficients (see Table 4). The coefficients on the gravity
variables have the expected signs and are statistically significant. The governance indicator
remains positive and strongly significant. The coefficient on the simple average tariff of the
exporting country, however, is not significant, while resource rich countries have a

26
significantly lower probability of exporting to the EU. The coefficient for the Africa dummy is
negative and statistically significant but only at 10 percent level once the resource share is
included. Again, the infrastructure variable does not have a significant impact on the propensity
to export to the EU once the Africa dummy and the resource intensity are included
Table 4: Propensity to export clothing products at 4digit level (EU 2004 dataset) I II III P(E)i,j,k P(E)i,j,k P(E)i,j,k Quality of governance 0.06 0.07 0.04
[0.016]** [0.016]** [0.015]** Distance -5.21 -4.46 -3.14
[1.567]** [1.568]** [1.362]* Distance^2 0.30 0.26 0.18
[0.093]** [0.093]** [0.081]*
Per capita income 0.88 0.71 0.65 [0.233]** [0.241]** [0.268]*
Per capita income^2 -0.05 -0.04 -0.03 [0.017]** [0.017]* [0.019]+
Population size 0.21 0.20 0.21 [0.016]** [0.017]** [0.015]**
Average import tariffs -0.02 0.01 0.01
[0.059] [0.061] [0.056]
Infrastructure measure5
0.07 0.04 0.01
[0.027]* [0.027]+ [0.028] Africa-dummy -0.16 -0.13
[0.077]* [0.069]+
Resource share in exports
-0.46
[0.085]** Observations 5104 5104 5104 Robust standard errors in brackets + significant at 10%; * significant at 5%; ** significant at 1%
We estimated the model separately for the EU and the US due to the apparent idiosyncracies of
these two markets. Nevertheless, we investigated a pooled datasets that confirmed the broad
results discussed above. We obtained significant estimates of the expected sign on the standard
gravity variables of income, distance and size. The quality of governance is a positive and
significant determinant of the probability of exporting clothing to these key markets. The
simple average tariff has a negative sign but the impact is not robust across different

27
specifications of the model. Similarly, for the infrastructure variable there is little evidence of a
strong and robust impact on the propensity to export.
The dummy for African exports is strongly significant and negative under all specifications of
the model. The coefficients on separate dummy variables for trade relationships between
African and European countries and between English speaking African AGOA beneficiary
countries and the US are both positive and statistically significant. However, an overall bias
against importing from Africa remains as the negative coefficient of the Africa-dummy is
larger than both the coefficient on the EU dummy and the AGOA-related coefficient. The
negative impact on the propensity to export to the EU of being an African country is less than
that for the US.
Results for the second-stage model
We now turn to the second stage of our regression, which seeks to explain the magnitude of the
trade flows that are observed (see Table 5). Quality of governance has a positive and significant
influence on the volume of trade but in the case of the EU the impact is not as strongly
significant as when determining the probability of exporting. Distance has a negative but
decreasing effect while population size has a positive but decreasing effect on the volume of
trade. Larger countries in terms of population tend to export grater amounts of clothing. The
size of overall imports for the particular product has a significant impact and a roughly unitary
elasticity and resource intensive countries very strongly tend to export less clothing products.
Again better infrastructure does not contribute to explaining the magnitude of clothing exports
to the US or EU. The coefficient for the tariff protection in the exporting country is not
statistically significant in the case of the US but is positive and mildly significant for the EU.
The Africa dummy is statistically significant and negative, such that even those exporters that
manage to export to the US will tend to export less than the model would suggest after
controlling for the level of income per capita, population, distance and resource intensity.
Again, AGOA helps to offset this tendency but cannot overcome it.
Thus, the results from the second stage of our model which seeks to explain the amount of
exports of clothing from those countries that actually export to the US stresses the importance

28
of governance not just for influencing the decisions of buyers of where to source but also how
much to source from different countries. Lack of infrastructure does not appear to be a
constraint on countries increasing the amount of exports of clothing to the EU and the US.
Finally, exporters in Africa appear to face particular challenges in increasing the amount of
their exports of clothing beyond that of other countries.
Table 5: Second stage regression (US and EU datasets for 2004) US-model EU-model imports imports
Quality of governance 0.39 0.42 [0.135]** [0.202]*
Distance -104.67 -25.30 [10.852]** [10.568]*
Distance^2 5.96 1.44 [0.624]** [0.641]*
Per capita income 8.29 4.68 [1.986]** [2.939]
Per capita income^2 -0.56 -0.31 [0.140]** [0.207]
Population size 0.87 1.13 [0.111]** [0.146]**
Average import tariffs -0.32 0.90 [0.218] [0.518]+
Resource share -2.18 -3.52 [0.820]** [1.050]**
Infrastructure measure5 -0.12 0.15 [0.142] [0.249]
Total imports 1.16 0.99 [0.050]** [0.057]**
AGOA-dummy 1.21 [0.571]*
Africa-dummy -3.38 -1.77 [0.563]** [0.739]*
Constant 403.33 64.85 [49.498]** [43.887]
Observations 2659 2631 R-squared 0.55 0.51 Robust p values in brackets + significant at 10%; * significant at 5%; ** significant at 1%
Conclusions
The clothing sector still provides an opportunity for export diversification and the expansion of
manufactured exports for low-wage countries. This is so even though China and India have
been unfettered from quotas in the main consuming markets in the world economy. There are

29
substantial export possibilities for countries that can effectively exploit their labour cost
advantages and which can fill emerging niches. At the same time, the global market for
clothing continues to change with an increasing role for large buyers and for speed and
flexibility in delivering products to the market.
Our empirical analysis of exports of clothing to the EU and the US suggests that in the modern
market, where global buyers are seeking to minimize both economic and reputational risks,
issues concerning governance are a significant determinant of the probability that exports of
clothing will take place and, if they do, of their magnitude. This implies that assistance to
clothing firms will only have a limited impact on exports in countries that have poor
governance. On the other hand, it suggests that countries that improve their governance will
reap not only the direct benefits of such actions but will also increase the propensity for local
clothing firms to export to the EU and the US and the potential size of those exports.
Secondly, our empirical evidence does not provide strong evidence that quality of infrastructure
is a strong determinant of the propensity to export clothing products. Hence, clothing may be a
product into which countries can diversify without the large scale investments in infrastructure
that may be required to export other more transport intensive products. This is however, a very
tentative conclusion since we are concerned that our infrastructure variable adequately reflects
the key infrastructure services required to export clothing products, in particular, because our
measure does not include information on the cost and reliability of electricity supply, an
important input in the manufacturing of clothing, nor on telecommunication costs, which are
increasingly important for effective access to overseas markets.
Finally, we find a strong bias against sourcing clothing products from Africa, beyond that
which can be explained by governance and country characteristics such as income, size and
distance from the market. Trade preferences appear to offset but not to overcome this problem
for African countries. This suggests that potential exporters of clothing in Africa face particular
problems in exporting clothing products to the main markets in the EU and the US and that
some form of concerted action in necessary to reduce the negative image of sourcing from
Africa and to encourage firms in Africa to invest in higher quality.

30
References
Abernethy, F., J. Dunlop, J. Hammond, and D. Weil, 1999. “A stitch in time: Lean Retailing
and the Transformation of Manufacturing, Oxford University Press, New York.
Chisik, Richard, 2003. „Export industry policy and reputational comparative advantage”,
Journal of International Economics Vol.59 No. 2, pp.423-451.
Cling, J.-P., M. Razafindrakoto, and F. Roubaud, 2005. “Export Processing Zones in
Madagascar: A Success Story under Thread?” World Development 33: 785-803.
Eifert, Ben, A. Gelb, and V. Ramachandran, 2005. „Business Environment and Comparative
Advantage in Africa: Evidence from the Investment Climate Data”, The World Bank.
Carolyn Evans & James Harrigan, 2003. "Distance, time, and specialization," International
Finance Discussion Papers 766, Board of Governors of the Federal Reserve System
(U.S.).
Francois, Joseph & Manchin, Miriam, 2007. "Institutions, infrastructure, and trade," Policy
Research Working Paper Series 4152, The World Bank.
Habiyaremye, Alexis and Thomas Ziesemer, 2006. “Absorptive Capacity and Export
Diversification in Sub-Saharan African Countries”, Working Paper, UNU-MERIT,
Maastricht
Helpman, Elhanan, M. Melitz, and Y. Rubinstein, 2007. "Estimating Trade Flows: Trading
Partners and Trading Volumes" NBER Working Paper No. 12927.
Hummels, David, 2001. “Time as a Trade Barrier,” Purdue University, mimeo.
Kabeer, N., and S. Mahmud. 2004. “Globalisation, Gender, and Poverty: Bangladeshi Women
Workers in Export and Local Markets.” Journal of International Development 16.
Palpacuer, Florence, P. Gibbon, and L. Thomsen, 2005. New Challenges for Developing
Country Suppliers in global Clothing Chains: A comparative European Perspective,
World Development Vol.33.No.3, pp.409-430.
Weil, David, 2006. Lean Retailing and Supply Chain Restructuring: Implications for Private
and Public Governance, Princeton Institute for International and Regional Studies,
Princeton University.
Worldwide Governance Indicators, 2006. World Bank, Washington, DC.
Yusuf, Shahid, Kaoru Nabeshima and Dwight Perkins. 2006. “China and India Reshape Global
Industrial Geography”, in L. Alan Winters and Shahid Yusuf (eds) Dancing with

31
Giants: China, India, and the Global Economy, World Bank and the Institute of Policy
Studies, Washington and Singapore.