closed brayton cycle power converter - nasa€¦ · the closed brayton cycle power was selected to...
TRANSCRIPT

Robert L. Fuller Barber-Nichols Inc., Arvada, Colorado
Closed Brayton Cycle Power Conversion Unit for Fission Surface Power Phase I Final Report
NASA/CR—2010-215673
June 2010
https://ntrs.nasa.gov/search.jsp?R=20100026654 2020-06-23T08:21:07+00:00Z

NASA STI Program . . . in Profi le
Since its founding, NASA has been dedicated to the advancement of aeronautics and space science. The NASA Scientifi c and Technical Information (STI) program plays a key part in helping NASA maintain this important role.
The NASA STI Program operates under the auspices of the Agency Chief Information Offi cer. It collects, organizes, provides for archiving, and disseminates NASA’s STI. The NASA STI program provides access to the NASA Aeronautics and Space Database and its public interface, the NASA Technical Reports Server, thus providing one of the largest collections of aeronautical and space science STI in the world. Results are published in both non-NASA channels and by NASA in the NASA STI Report Series, which includes the following report types: • TECHNICAL PUBLICATION. Reports of
completed research or a major signifi cant phase of research that present the results of NASA programs and include extensive data or theoretical analysis. Includes compilations of signifi cant scientifi c and technical data and information deemed to be of continuing reference value. NASA counterpart of peer-reviewed formal professional papers but has less stringent limitations on manuscript length and extent of graphic presentations.
• TECHNICAL MEMORANDUM. Scientifi c
and technical fi ndings that are preliminary or of specialized interest, e.g., quick release reports, working papers, and bibliographies that contain minimal annotation. Does not contain extensive analysis.
• CONTRACTOR REPORT. Scientifi c and
technical fi ndings by NASA-sponsored contractors and grantees.
• CONFERENCE PUBLICATION. Collected papers from scientifi c and technical conferences, symposia, seminars, or other meetings sponsored or cosponsored by NASA.
• SPECIAL PUBLICATION. Scientifi c,
technical, or historical information from NASA programs, projects, and missions, often concerned with subjects having substantial public interest.
• TECHNICAL TRANSLATION. English-
language translations of foreign scientifi c and technical material pertinent to NASA’s mission.
Specialized services also include creating custom thesauri, building customized databases, organizing and publishing research results.
For more information about the NASA STI program, see the following:
• Access the NASA STI program home page at http://www.sti.nasa.gov
• E-mail your question via the Internet to help@
sti.nasa.gov • Fax your question to the NASA STI Help Desk
at 443–757–5803 • Telephone the NASA STI Help Desk at 443–757–5802 • Write to:
NASA Center for AeroSpace Information (CASI) 7115 Standard Drive Hanover, MD 21076–1320
Robert L. Fuller Barber-Nichols Inc., Arvada, Colorado
Closed Brayton Cycle Power Conversion Unit for Fission Surface Power Phase I Final Report
NASA/CR—2010-215673
June 2010
National Aeronautics andSpace Administration
Glenn Research CenterCleveland, Ohio 44135
Prepared under Contract NNC08CA64C

Acknowledgments
The author would like to acknowledge the support of the NASA Glenn Research Center.
Available from
NASA Center for Aerospace Information7115 Standard DriveHanover, MD 21076–1320
National Technical Information Service5301 Shawnee Road
Alexandria, VA 22312
Available electronically at http://gltrs.grc.nasa.gov
Trade names and trademarks are used in this report for identifi cation only. Their usage does not constitute an offi cial endorsement, either expressed or implied, by the National Aeronautics and
Space Administration.
Level of Review: This material has been technically reviewed by expert reviewer(s).
This report contains preliminary fi ndings, subject to revision as analysis proceeds.

Table of Contents 1. SUMMARY AND INTRODUCTION......................................................................... 1
1.1 Summary..................................................................................................................... 1 1.2 Introduction ................................................................................................................ 2
2. FLUID AND SYSTEM TRADE STUDY ................................................................... 3 2.1 Fluid Study ................................................................................................................. 3 2.2 System Trade Study.................................................................................................. 15
3. HEAT EXCHANGER DESIGN................................................................................ 17 3.1 Recuperator Design .................................................................................................. 17 3.2 Water/Gas Plate Fin Cooler...................................................................................... 20 3.3 NaK Heater Design................................................................................................... 23
3.3.1 Shell and Tube NaK Heater Design.................................................................... 23 3.3.2 Plate/Fin NaK Heater .......................................................................................... 25
4. CYCLE AND PERFORMANCE ANALYSIS ......................................................... 25 4.1 Nominal Temperature Difference............................................................................. 25 4.2 High Temperature Difference................................................................................... 27 4.3 Low Temperature Difference ................................................................................... 27 4.4 Off-Design Performance .......................................................................................... 27
5. COMPRESSOR DESIGN.......................................................................................... 31 6. TURBINE DESIGN.................................................................................................... 34 7. ALTERNATOR DESIGN.......................................................................................... 37 8. TURBINE ALTERNATOR COMPRESSOR (TAC) DESIGN ............................. 39
8.1 Overall Layout Section View ................................................................................... 39 8.2 Foil Bearings ............................................................................................................ 42 8.3 Cooling Flow............................................................................................................ 44 8.4 Rotor Dynamic Assessment ..................................................................................... 46
9. POWER CONTROLLER.......................................................................................... 47 9.1 Power Controller Packaging..................................................................................... 47 9.2 Power Controller Schematic and Simulation ........................................................... 49
10. POWER CONVERTER........................................................................................... 53 10.1 Power Converter with Shell/Tube NaK Heater ...................................................... 54 10.2 Power Converter with Plate/Fin NaK Heater ......................................................... 57
11. CONTROL CONSOLE AND DATA ACQUISITION, AND FILL SYSTEM... 61 11.1 Control Console and Data Acquisition................................................................... 61 11.2 Fill System.............................................................................................................. 63
12. SUMMARY ............................................................................................................... 63
NASA/CR—2010-215673 iii

Table of Figures Figure 1: Cycle Diagram in Graphical Format Example (English Units Version)..... 4 Figure 2: Cycle Spreadsheet Input Screen Example (English Units Version) ............ 5 Figure 3: Cycle Efficiency vs Compressor Exit Pressure for Various Gases .............. 7 Figure 4: Gas Cooler Design Spreadsheet ...................................................................... 8 Figure 5: Recuperator Design Sheet ............................................................................... 9 Figure 6: NaK Heater Design Sheet (Shell and Tube)................................................. 10 Figure 7: Heat Exchanger Volume vs. Compressor Exit Pressure at Various
Temperature Ratios ............................................................................................ 11 Figure 8: Optimum Shaft Speed versus Compressor Exit Pressure for Various
Gases at low, average, and high temperature ratios........................................ 12 Figure 9: Turbine Wheel Diameter for various gases versus Compressor Exit
Pressure for low, average, and high temperature ratios. ................................ 12 Figure 10: Compressor Wheel Diameter for various gases versus Compressor Exit
Pressure for low, average, and high temperature ratios. ................................ 13 Figure 11: Cycle Efficiency vs. Compressor Exit Pressure for CO2, N2, Ar, and
HeXe at 6 kW, 12 kW, and 24 kW..................................................................... 14 Figure 12: Heat Exchanger Volume vs. Compressor Exit Pressure for CO2, N2, Ar,
and HeXe at 6 kW, 12 kW, and 24 kW. ............................................................ 14 Figure 13: Cycle Efficiency vs. Pressure ratio and Heat Exchanger Volume ........... 16 Figure 14: Cycle Efficiency vs. Recuperator Effectiveness and Specific Weight for 6
kW, 12 kW, and 24 kW Converters .................................................................. 16 Figure 15: Cycle Efficiency vs. NaK Flow Rate and Heat Exchanger Volume......... 17 Figure 16: Fin Type/Pitch versus Recuperator Effectiveness..................................... 18 Figure 17: Fin Type/Pitch versus Pressure Drop......................................................... 18 Figure 18: Recuperator Performance ........................................................................... 19 Figure 19: Overall Recuperator Size............................................................................. 20 Figure 20: Water to CO2 Gas Cooler Dimensional Data............................................ 21 Figure 21: Water to CO2 Gas Cooler Data Sheet........................................................ 22 Figure 22: Water to CO2 Gas Cooler Performance Data ........................................... 23 Figure 23: Heat Exchanger Specification Sheet for NaK to CO2 Gas....................... 24 Figure 24: Thermodynamic Cycle State Points for Nominal Design Condition ....... 26 Figure 25: High Temperature Difference Performance Analysis .............................. 28 Figure 26: Low Temperature Difference Converter Performance ............................ 29 Figure 27: Cycle Power Output versus Shaft Speed for Specified Temperature
Differences ........................................................................................................... 30 Figure 28: Off Design Performance Pressures versus Shaft Speed............................ 30 Figure 29: Front View Compressor and Vane Island Diffuser................................... 31 Figure 30: Compressor Performance Map with Thrust Calculations ....................... 32 Figure 31: Compressor Wheel Stress Analysis at 10% Over-speed........................... 33 Figure 32: Compressor Wheel Campbell Diagram ..................................................... 33 Figure 33: Turbine Exit View with Nozzles, Shroud Removed.................................. 34 Figure 34: Turbine Performance and Thrust Map ..................................................... 35 Figure 35: Turbine Stress Analysis ............................................................................... 36 Figure 36: Turbine Wheel Interference Diagram........................................................ 36 Figure 37: Permanent Magnet Section of Rotor .......................................................... 37
NASA/CR—2010-215673 iv
Figure 38: Alternator Performance Map ..................................................................... 38 Figure 39: Insulation Life vs. Operating Temperature............................................... 38 Figure 40: Overall TAC Layout .................................................................................... 39 Figure 41: TAC Turbine End Close Up........................................................................ 40 Figure 42: TAC Compressor End Close Up................................................................. 41 Figure 43: Combined Turbine and Compressor Axial Thrust Map.......................... 41 Figure 44: Foil Bearing Experimental Hardware........................................................ 43 Figure 45: Foil Bearing Power vs. Speed (Power is from DC Supply)....................... 43 Figure 46: Water Cooling Passages............................................................................... 44 Figure 47: Predicted Cavity Pressures at Operating Speed........................................ 45 Figure 48: Power Loss and Gas Cooling Flow Passages ............................................. 45 Figure 49: Cooling Mass Flows, Temperatures, Heat Loss ........................................ 46 Figure 50: Un-dampened Critical Speed Map ............................................................. 47 Figure 51: Power Controller (Isometric View) ............................................................ 48 Figure 52: Component Locations for Power Controller (Top View) ......................... 48 Figure 53: Top Level Control Schematic...................................................................... 49 Figure 54: Motor/Generator Controller Simulation Circuit ...................................... 49 Figure 55: Boost/Buck Converter Controller Simulation Circuit.............................. 50 Figure 56: Motoring Mode Simulation ......................................................................... 50 Figure 57: Generating Mode Simulation ...................................................................... 51 Figure 58: Boost Mode Simulation................................................................................ 52 Figure 59: Buck Mode Simulation................................................................................. 53 Figure 60: Power Converter with Shell/Tube NaK Exchanger .................................. 54 Figure 61: Power Converter for Shell/Tube, Three Views ......................................... 55 Figure 62: Static Thermal Conditions for Shell/Tube Power Converter System ..... 56 Figure 63: Shell Tube Stress Regions............................................................................ 56 Figure 64: Piping Interface Loads on TAC .................................................................. 57 Figure 65: Power Converter with Plate/Fin NaK Heater............................................ 58 Figure 66: Power Converter Three View with Plate/Fin NaK Heat Exchanger....... 58 Figure 67: Plate/Fin Power Converter Thermal Analysis........................................... 59 Figure 68: Plate/Fin Power Converter Stress Results ................................................. 60 Figure 69: Plate/Fin Power Converter TAC Resultant Stress Results ...................... 60 Figure 70: Insulation Analysis ....................................................................................... 61 Figure 71: Control Console Screen Example ............................................................... 62 Figure 72: Strip Chart Recording Example ................................................................. 62 Figure 73: Fill System Diagram and Equipment List.................................................. 63 Table of Tables Table 1: Compressor Design Table ............................................................................... 31 Table 2: Turbine Design Dimensions ............................................................................ 34 Table 3: Magnet Stress Values....................................................................................... 37 Table 4: TAC Weight Breakdown................................................................................. 42
NASA/CR—2010-215673 v


1. Summary and Introduction 1.1 Summary A Closed Brayton Cycle power conversion system has been developed to support the NASA fission surface power program. The goal is to provide electricity from a small nuclear reactor heat source for surface power production for lunar and Mars environments. The selected media for a heat source is NaK 78 with water as a cooling source. The Closed Brayton Cycle power was selected to be 12 kWe output from the generator terminals. A heat source NaK temperature of 850 K +/-25 K was selected. The cold source water was selected at 375 K +/-25 K. A vacuum radiation environment of 200 K is specified for environmental operation. The prioritized goals for the power conversion system are contained in the NASA specification as follows:
• Close relevance to future flight designs, including the potential for 8 year service life
• Credible development path and maturation approach exist to achieve TRL 6 by FY 2012 with a reasonable cost
• Low development cost and risk • Design extensible to Mars (materials and design strategies compatible with mars
environment) • High thermal-to-electric efficiency • Minimum complexity • Low mass and volume
The major components of the system are the power converter, the power controller, and the top level data acquisition and control unit. The power converter with associated sensors resides in the vacuum radiation environment. The power controller and data acquisition system reside in an ambient laboratory environment. Signals and power are supplied across the pressure boundary electrically with hermetic connectors installed on the vacuum vessel. System level analyses were performed on working fluids, cycle design parameters, heater and cooling temperatures, and heat exchanger options that best meet the needs of the power converter specification. The goal is to provide a cost effective system that has high thermal-to-electric efficiency in a compact, lightweight package. A system level trade study was performed to optimize these competing factors in order to specify the various system components. The power converter is a rotating turbine-alternator-compressor (TAC), NaK heater, gas-to-gas recuperator, and gas-to-water cooler.
NASA/CR—2010-215673 1

The TAC consists of a centrifugal compressor, a two-pole permanent magnet alternator, and a radial in-flow turbine on a single shaft. The rotor is supported by gas foil journal and thrust bearings. The gas foils are coated to allow numerous startup and shutdown operations. Labyrinth seals are utilized to limit turbine and compressor leakage into the generator cavity. The foil bearings are cooled by a combination of the labyrinth leakage flow from the compressor and also a secondary pumped loop that utilizes compressor inlet gas. The test unit would utilize o-rings and metallic c-seals for laboratory testing and be fully welded for the space-based version. The generator is cooled by the pumped secondary flow loop and also liquid cooling with a water jacket. The NaK heater is a plate-fin type heat exchanger with NaK 78 heating the CO2 gas on the Brayton loop. The recuperator is a CO2/CO2 gas heat exchanger which preheats the gas from the compressor exit by utilizing waste heat from the turbine exit. The preheated compressor air enters the NaK heater to increase the gas energy content prior to entering the turbine. The CO2 to water cooler is used to expel the residual heat from the recuperator to cool the compressor inlet gas. The water is pumped to radiation cooler panels that expel the heat to the atmosphere. The system is piped and insulated with multi-layer insulation (MLI) to minimize heat loss. The power controller utilizes a full-bridge interface to the alternator to allow motoring for startup and active rectification for power production. A buck/boost converter is utilized for conversion from the specified alternator output of 400 VAC to 120 VDC. The controller is liquid cooled and packaged in a 19-inch rack mount chassis. Design decisions that resulted from the trade studies:
• Working fluid, carbon dioxide • Maximum working pressure 689.5 kPa • Pressure ratio 2:1 • Generator Efficiency 98% • Recuperator Effectiveness 90% • Turbine Efficiency 87% • Compressor Efficiency 84% • Shaft Speed 65 krpm
1.2 Introduction The closed Brayton power converter was developed to support National Aeronautics and Space Administration goals of generating electricity using a nuclear heat source. While the use of closed Brayton cycle technology for space power is not new, the system proposed herein reflects modern technological improvements to satisfy a new specification and power goal. The system is packaged to be as compact is practical while insuring material stress limitations are not exceeded due to gravity, pressure, and thermal loading and cycling.
NASA/CR—2010-215673 2
Closed Brayton cycle machinery has the ability to provide high reliability, good efficiency, and can operate for long periods as self-contained power sources for moon or Mars based missions. Development of the power conversion system focused on a compact system with a rotating turbine-alternator-compressor (TAC) power production. The TAC can operate in a 0 to 2 g environment in a variety of attitudes from horizontal to vertical and therefore could be used for not only terrestrial power, but space based power as well. The power conversion system development includes analysis that simulates full power as well as partially power operation. The power controller for the TAC can provide rotating machine control during load steps and also operates as a state machine for startup, shutdown, normal operation, and fault handling modes.
2. Fluid and System Trade Study
2.1 Fluid Study A study was performed to identify the best working fluid for use in the closed Brayton cycle power converter. The fluid selection was limited to those fluids known to be stable and remain a gas at working temperatures of 200 K to 875 K. Good thermodynamic and transport properties enable efficiency aerodynamic performance for the turbine and compressor as well as a direct impact on heat exchanger size and weight. Additionally, due to the long life, material compatibility is important. A non-reactive, inert gas is beneficial for material selection criteria. The fluids considered for this study were carbon dioxide, argon, nitrogen, and helium/xenon mixture. Helium was not considered due the low molecular weight causing extreme turbomachinery design challenges. For this trade study, a simple recuperated Brayton cycle was used. The recuperator effectiveness is directly tied to the size of the recuperator heat exchanger and also dictates the optimum pressure ratio for a specific working fluid. A spreadsheet was utilized to perform the cycle analysis for the trade study. The spreadsheet is linked to Refprop (National Institute of Standards and Technology Property Database) to calculate the thermal and transport properties automatically. Figure 1 shows the cycle in graphical form and the cycle input sheet is shown in Figure 2. This is an example only and is not the final cycle design.
NASA/CR—2010-215673 3

Figure 1: Cycle Diagram in Graphical Format Example (English Units Version)
Flui
d:Sh
aft P
ower
:16
.06
B/s
ecC
ycle
Effi
cien
cy:
Alte
rnat
or W
inda
ge:
0.17
B/s
ecPe
rcen
t of C
ycle
Car
not:
Bea
ring
Loss
es:
0.83
B/s
ecSy
stem
Effi
cien
cy:
Cor
e Lo
sses
:0.
30B
/sec
Perc
ent o
f Sys
tem
Car
not:
170
F19
4F
Con
vert
er L
osse
s:0.
738
B/s
ec15
0.0
psi
149.
5ps
iN
et P
ower
Out
:14
.79
kW0.
02lb
m/s
0.02
lbm
/s
1115
F17
0F
21.8
psi
150.
0ps
i2.
83lb
m/s
Wat
er J
acke
t0.
49lb
m/s
1060
F10
60F
190
F19
0F
99.0
psi
99.0
psi
48.0
psi
47.6
psi
1.18
lbm
/s1.
18lb
m/s
1.19
lbm
/s1.
19lb
m/s
NaK
e=78
.8%
e=86
.1%
e=98
.0%
e=84
.2%
e=90
.3%
Wat
erH
eatin
gQ
=67
.9B/
sPR
=2.
07N
=65
694
RPM
PR=
2.07
Q=
50.8
B/s
Coo
ling
Loop
Loop
853
F91
5F
311
F37
7F
99.2
psi
47.9
psi
99.4
psi
47.6
psi
1.18
lbm
/s1.
18lb
m/s
1.19
lbm
/s1.
19lb
m/s
1000
F27
2F
21.7
psi
149.
9ps
i2.
83lb
m/s
0.49
lbm
/s
269
F19
0F
47.9
psi
48.4
psi
0.01
2lb
m/s
0.01
2lb
m/s
853
F31
1F
99.3
psi
99.4
psi
1.18
lbm
/s1.
18lb
m/s
e=90
.0%
Q=
164.
1B/
s
915
F37
7F
47.9
psi
47.7
psi
1.19
lbm
/s1.
19lb
m/s
Com
pres
sor
Coo
ler
Rec
uper
ator
CO
2
Hea
ter
Alte
rnat
or
21.7
%38
.0%
20.6
%34
.4%
Turb
ine
NASA/CR—2010-215673 4

Figure 2: Cycle Spreadsheet Input Screen Example (English Units Version)
Tem
pera
ture
Pre
ssur
eD
ensi
tyEn
thal
pyEn
tropy
Cyc
leG
ener
ator
FPs
ialb
m/ft
^3B
/lbm
B/ft-
FFl
uid
CO
2ge
n ef
ficie
ncy
98.0
0%Tu
rbin
e In
1060
.000
98.9
560.
267
463.
162
0.82
1U
nits
Engl
ish
conv
effi
cien
cy95
.00%
Turb
ine
Out
915.
227
47.8
900.
143
422.
771
0.82
6ne
t tur
bine
pow
er16
.061
B/se
cC
ycle
Effi
cien
cy21
.73%
win
dage
loss
0.17
1B/
sec
Rec
up H
ot In
914.
722
47.8
790.
143
422.
632
0.82
6Sy
stem
Effi
cien
cy20
.64%
bear
ing
loss
0.83
3B/
sec
Rec
up H
ot O
ut37
7.14
447
.720
0.23
528
3.58
50.
698
Cyc
le C
arno
t57
.23%
core
loss
0.30
1B/
sec
Syst
em C
arno
t60
.00%
conv
erte
r los
s0.
738
B/se
cC
oole
r In
377.
140
47.6
370.
234
283.
585
0.69
8Pe
rcen
t Cyc
le C
arno
t37
.97%
gen
pow
er14
.756
B/se
cC
oole
r Out
190.
294
47.6
040.
303
240.
850
0.64
1Pe
rcen
t Sys
tem
Car
not
34.4
0%ge
n po
wer
15.5
65kW
conv
pow
er14
.018
B/se
cC
omp
In19
0.33
048
.032
0.30
624
0.85
00.
640
delta
P h
ot0.
524
psi
conv
pow
er14
.787
kWC
omp
Out
311.
291
99.4
050.
534
267.
457
0.64
5de
lta P
col
d0.
283
psi
full
pow
er12
kWpe
rcen
t pow
er12
3.23
%R
ecup
Col
d In
311.
289
99.3
720.
534
267.
457
0.64
5R
ecup
Col
d O
ut85
3.47
599
.306
0.31
040
5.60
90.
780
Turb
ine
Flui
d M
ass
Hea
ter I
n85
3.47
499
.227
0.31
040
5.60
90.
780
spee
d65
694
rpm
Pipe
20.
007
lbm
Hea
ter O
ut10
60.0
0099
.032
0.26
746
3.16
20.
821
mdo
t1.
180
lbm
/sec
Pipe
30.
053
lbm
pres
sure
ratio
2.06
6Pi
pe 4
0.09
6lb
mef
ficie
ncy
86.0
7%Pi
pe 5
0.07
7lb
mH
eate
r In
1115
.330
21.8
0045
.978
pow
er47
.661
B/se
cPi
pe 6
0.11
3lb
mH
eate
r Out
1000
.000
21.6
5646
.978
Pipe
10.
060
lbm
Hea
ter
0.29
7lb
mC
oole
r In
170.
330
150.
000
60.8
14C
ompr
esso
rC
oole
r0.
026
lbm
Coo
ler O
ut27
2.10
014
9.94
658
.203
spee
d65
694
rpm
Rec
uper
ator
-Hot
0.24
0lb
mm
dot
1.18
7649
7lb
m/s
ecR
ecup
erat
or-C
old
0.53
0lb
mJa
cket
In17
0.33
015
0.00
060
.814
pres
sure
ratio
2.07
0H
ot S
ide
0.65
8lb
mJa
cket
Out
193.
867
149.
500
60.2
92ef
ficie
ncy
84.2
3%C
old
Side
0.84
2lb
mpo
wer
31.6
00B/
sec
Tota
l1.
500
lbm
Des
ign
Poin
t1.
482
lbm
Pres
sure
Bal
ance
0.50
0ps
idM
ass
Bal
ance
0.01
8lb
m
Hea
ter
Coo
ler
Rec
uper
ator
Jack
etFl
uid
NaK
Flui
dW
ater
Hea
t Tra
nsfe
r16
4.07
6B/
s F
luid
Wat
erm
dot
2.83
3lb
m/s
mdo
t0.
494
lbm
/sLM
TD63
.523
Fm
dot
0.02
lbm
/sec
Hea
t Tra
nsfe
r67
.913
B/s
Hea
t Tra
nsfe
r50
.754
B/s
Pre
ssur
e D
rop
- Hot
0.15
9ps
iD
elta
P0.
5ps
ia
LMTD
55.3
30F
LMTD
60.2
30F
Pres
sure
Dro
p - C
old
0.06
6ps
ihe
at tr
ansf
er0.
472
B/se
cPr
essu
re D
rop
0.19
5ps
iPr
essu
re D
rop
0.03
3ps
ief
fect
iven
ess
90.0
0%ef
fect
iven
ess
78.8
5%ef
fect
iven
ess
90.3
5%ef
ficie
ncy
90.0
0%ef
ficie
ncy
90.7
5%Pi
pe L
osse
sPi
pe 2
0.01
1ps
idB
earin
gsPi
pe 3
0.08
3ps
idBe
arin
g de
lta P
0.5
psid
Pipe
40.
072
psid
Bear
ing
Lube
Per
cent
1.00
%Pi
pe 5
0.03
3ps
idBe
arin
g lu
be0.
012
lbm
/sPi
pe 6
0.07
9ps
idEn
thal
py O
ut25
8.38
9B/
lbm
Pipe
10.
076
psid
NASA/CR—2010-215673 5

Several caveats were placed on the fluid design trade study. All fluids were treated equally with fixed expected turbomachinery efficiency, recuperator effectiveness, generator efficiency, converter efficiency, and bearing losses. Windage losses were calculated as part of the analysis since it was easy to perform with this calculation imbedded in the worksheet and the variable windage that is inherent in gas selection. The operating pressure was optimized for each fluid using an Excel based routine. This was done for all the working fluids under consideration for the three temperature ratios. The high temperature ratio is the highest NaK temperature and the lowest cooling water temperature. This results in the highest power output condition. The medium temperature ratio is the nominal NaK and cooling water temperature. This is the design point and per the specification should obtain 12 kWe of power from the generator. The low temperature ratio is the lowest NaK temperature coupled with the highest cooling water temperature. The recuperator effectiveness was set high with the knowledge that the actual recuperator sizing trade study would happen after the working fluid selection was performed. Therefore the overall cycle efficiency was optimistic relative to size/volume constraints placed in the specification after the project was initiated. An initial survey of candidate operating gases was done to ascertain cycle efficiency and maximum operating pressure. The cycle spreadsheet used an internal optimization routing to find the maximum efficiency and operating pressure for a fixed recuperator effectiveness and temperature ratio. The gases considered were nitrogen, carbon dioxide, argon, and HeXe mixture. The data are shown in Figure 3. It is clear that the HeXe mixture allows the highest cycle efficiency. The optimum system operating pressure is similar for all gases except carbon dioxide, which is lower. The lower operating pressure should yield lighter pressure containment structure and therefore the power per unit weight for the system operating on carbon dioxide may be higher.
NASA/CR—2010-215673 6

Cycle Efficiency vs. Compressor Exit Pressure (12kW)
22
24
26
28
30
32
34
36
500 750 1,000 1,250 1,500 1,750 2,000 2,250 2,500 2,750 3,000 3,250 3,500
Compressor Exit Pressure (kPa)
Cycle Efficiency (%
)
CO2high
CO2avg
CO2low
N2high
N2avg
N2low
Arhigh
Aravg
Arlow
HeXehigh
HeXeavg
HeXelow
Figure 3: Cycle Efficiency vs Compressor Exit Pressure for Various Gases The results of the fluid study at 12 kWe point to an obvious fluid choice, based on efficiency alone, of HeXe mixture. However given the cost of the HeXe fluid, it would probably be necessary to initially design the system for Argon use to test the TAC components due to the similar molecular weight of Argon and HeXe mixture. The heat exchangers would need to be larger to accommodate the Argon properties and therefore the test relevance to future flight needs would be compromised. Certainly the cost of Xenon may violate the need for a reasonable cost program. With HeXe not a practical option for the goals of this program, Argon and Carbon Dioxide would be the next logical choices based on cycle efficiency alone. Given that Carbon Dioxide would operate at a lower system pressure it was concluded that carbon dioxide would be a better choice than either Argon or Nitrogen based on cycle efficiency and operating pressure, neglecting system level trade parameters such as heat exchanger size, turbine size, compressor size, operating speed, system weight, and other parameters. An additional interest in fluid selection is the size and therefore the weight of the heat exchangers. The analysis was done utilizing the same spreadsheet that was formulated to yield an estimated size and weight for the heater, recuperator, and gas cooler. Figure 4 shows the gas cooler design sheet that was used for the analysis. Figure 5 shows the recuperator design sheet, and Figure 6 the gas cooler design sheet.
NASA/CR—2010-215673 7

Temperature Pressure Density Enthalpy Entropy Viscosity PrandtlThermal
ConductivitySpecific
Heat Units EnglishF Psia lbm/ft^3 B/lbm B/ft*F lbm/ft*s - B/hr*ft*F B/lbm*F
Shell Side In 215.000 100.000 59.770 183.542 0.317 0.000186 1.718 0.393 1.008 Reset Loops (0 then 1)Shell Side Out 227.706 98.600 59.442 196.357 0.336 0.000173 1.599 0.394 1.010 Shell 1Shell Average 221.353 99.300 59.606 189.949 0.326 0.000180 1.659 0.394 1.009 Tube 1
Tube Side In 395.494 39.486 0.190 288.050 0.712 0.000015 0.731 0.018 0.239Tube Side Out 225.000 39.474 0.238 248.655 0.661 0.000013 0.744 0.014 0.222Tube Average 310.247 39.480 0.214 268.353 0.686 0.000014 0.737 0.016 0.231
Tube Side Shell Side UnitsFluid CO2 Water Heat Transfer 44.851 B/s
Mass Flow Rate 1.139 3.500 lbm/sPinch 1 167.787 F
Velocity In 21.837 ft/s Pinch 2 10.000 FVelocity Out 17.429 ft/s LMTD 55.95076673 F
Average Velocity 19.38562181 0.977337065 ft/s UA (LMTD) 0.801615719 B/s*FReynolds Number 9200 7849 - (10,000) UA (design) 0.829434947 B/s*F
Viscosity Ratio 1.032291085 - efficiency 94.67% -Heat Capacity 0.262812721 3.530762691 B/s*F effectiveness 94.46% -
Nusselt Number 31.12 61.02 -Convection Coefficient 15.88 991.71 B/hr*ft^2*F Tube Thermal Conductivity 100 B/hr*ft*F Aluminum alloy
wt kgPressure Drop Initial Estimate Shell Internal Diameter 8.000 in 7.7 shell 20.26704
delta P/P in 0.03% 1.40% Tube Length 64.000 in 61.9 tubes 94.03908delta P 0.012 1.400 psi Baffles 10 - 10 total 114.3061 51.95733
Resulting Pressure 39.486 98.600 psia Tube Internal Diameter 0.374 inTube Wall Thickness 0.032 in
Pressure Drop Final Estimate Clearance 0.100 inRoughness 0.000005 ft Percent usable cross-section 90%
Friction Factor 0.032 0.0024 - / ft^2/in^2 Tube Outside Diameter 0.438 inMajor Pressure Drop 0.047 0.6228 psi Tube Pitch 0.538 in (Triangle Pitch)Minor Pressure Drop 0.013 psi Pitch Area 0.050 in^2
delta P/P in 0.15% 0.62% Number of Tubes 360Resulting Pressure 39.53 99.37721861 psia Tube Flow Area 39.549 in^2
Baffle Space 5.818 inShell Cross Flow Area 8.652 in^2
Shell Hydraulic Diameter 0.291 inRe > 10,000 Update f from Fig 29, Kern Tube Heat Transfer Area 27070.978 in^2
Shell Heat Transfer Area 31703.445 in^2
Volume 3485.073 in^32.017 ft^3
Figure 4: Gas Cooler Design Spreadsheet The gas cooler design sheet utilizes a tube shell heat exchanger calculation. The eventual heat exchanger technology chosen is plate/fin, but for a fluid trade study, the defining metric is the relative size for the various gases and therefore the tube/shell calculation is valid and is more widely represented in literature and therefore more reliable from the analysis perspective.
NASA/CR—2010-215673 8

Temperature Pressure Density Enthalpy Entropy Viscosity PrandtlThermal
ConductivitySpecific
Heat Units EnglishF Psia lbm/ft^3 B/lbm B/lbm*F lbm/ft*s - B/hr*ft*F B/lbm*F
Hot Side In 929.421 39.584 0.117 426.727 0.837170628 0.000023 0.724 0.032 0.277 Reset Loops (0 then 1)Hot Side Out 395.494 39.486 0.190 288.050 0.712024156 0.000015 0.731 0.018 0.239 Hot 1
Hot Side Average 662.457 39.535 0.153 357.389 0.775 0.000 0.727 0.025 0.258 Cold 1
Cold Side In 335.494 75.000 0.389 273.429 0.665449319 0.000014 0.736 0.017 0.235Cold Side Out 871.796 74.873 0.231 410.720 0.796617567 0.000022 0.724 0.030 0.274
Cold Side Average 603.645 74.936 0.310 342.074 0.731 0.000 0.730 0.023 0.254
Hot Side Cold Side Units 442.208
Fluid CO2 CO2 Q 157.8838719 B/s 157.8839Mass Flow Rate 1.1385 1.15 lbm/s
Pinch Hot 57.625 FInlet Velocity 12.55266473 3.805549785 ft/s Pinch Cold 60 FExit Velocity 7.726347251 6.425215413 ft/s LMTD 58.80429358 F
Reynolds Number 564 601 - (600) UA (LMTD) 2.684903811 B/s*FUA (Heat Exchanger) 3.024949401 B/s*F
Pressure Drop Initial Estimatedelta P/P in 0.25% 0.17% efficiency 90.72% -
delta P 0.099 0.128 psi effectiveness 90.30% -Resulting Pressure 39.584 74.873 psia
Fin Thermal Conductivity 12.3 12.3 B/hr*ft*F Stainless SteelVelocity Term 5.0194E-05 8.11264E-06 - Plate Thermal Conductivity 12.3 B/hr*ft*F
Entrance Effect 1.979364037 1.979364037 -Flow Acceleration Effect -0.768970985 1.376760666 - Table 9.3 (Kays & London)
Core Friction Effect 45.24729031 74.58383663 - Surface Designation 17.8-3/8W 17.8-3/8WExit Effect 0.492020162 1.349630519 - Plate Spacing 0.0345 0.0345 ftDelta P/P1 0.23% 0.06% - Hydraulic Diameter 0.00696 0.00696 ft
Pressure Drop 0.09 0.05 psi Fin Thickness 0.006 0.006 inResulting Pressure 39.58 74.95 psia Area/Volume Ratio 514 514 ft^2/ft^3
Fin Area Ratio 0.892 0.892 -Nusselt Number 8.0 8.6 -
Convection Coefficient 28.7 28.8 B/hr*ft^2*F Frontal Area 2 2 ft^2 1.9m 96.5 96.8 ? Flow Length 1.4 1.4 ft 1.3
Fin Efficiency 0.559 0.558 - Layers 1 1Fin Effectiveness 0.607 0.606 - Plates per layer 10 10
Width 0.796140493 0.796140493 ftPlate thickness 0.063 in
Volume 2.8 ft^3Heat Transfer Area to Volume 223.0566038 223.0566038 ft^2/ft^3
Heat Transfer Area 624.5584906 624.5584906 ft^2Free to Frontal Area Ratio 0.388118491 0.388118491 -
Free Flow Area 0.776236981 0.776236981 ft^2
Table 10.6 (Kays & London)St*Pr^2/3 0.0158 0.0158 - Update for Reynolds Number
Friction Factor 0.0738 0.0738 -
Figure 5.4 (Kays & London)Entrance Loss Coefficient 1.13 1.13 - Adjust for Reynolds Number and Free to Fron
Exit Loss Coefficient 0.05 0.05 -
8000 lb Weight 89.70553592 kg75 ft^3
106.6666667 lb/ft^364.075382829.125174 kg/ft^3
Figure 5: Recuperator Design Sheet The recuperator design is a plate fin type that utilizes correlations from “Compact Heat Exchangers”, W.M. Kays and A.L. London, ISBN-10: 1575240602. The method utilized includes the proper heat transfer parameters, but does not include any structural analysis regarding the pressure containment boundary. Therefore the analysis is useful for relative size and weight from gas to gas, but not necessarily accurate in an absolute sense.
NASA/CR—2010-215673 9

Temperature Pressure Density Enthalpy Entropy Viscosity PrandtlThermal
ConductivitySpecific
Heat Units EnglishF Psia lbm/ft^3 B/lbm B/ft*F lbm/ft*s - B/hr*ft*F B/lbm*F
Shell Side In 1070.000 20.000 46.371 0.000118 0.006 15.057 0.208 Reset Loops (0 then 1)Shell Side Out 987.835 18.952 47.084 0.000125 0.006 15.152 0.208 Shell 1Shell Average 1028.917 19.476 46.727 0.000122 0.006 15.105 0.208 Tube 1
Tube Side In 871.796 74.873 0.231 410.720 0.797 0.000022 0.724 0.030 0.274Tube Side Out 1060.000 74.753 0.202 463.230 0.834 0.000025 0.723 0.035 0.284Tube Average 965.898 74.813 0.216 436.975 0.815 0.000023 0.724 0.032 0.279
Tube Side Shell Side UnitsFluid CO2 NaK Heat Transfer 59.783 B/s
Mass Flow Rate 1.139 3.500 lbm/sPinch 1 116.038 F
Velocity In 30.103 ft/s Pinch 2 10.000 FVelocity Out 34.431 ft/s LMTD 43.25740042 F
Average Velocity 32.12174774 1.579635275 ft/s UA (LMTD) 1.382020938 B/s*FReynolds Number 9250 14875 - (10,000) UA (design) 1.45124174 B/s*F
Viscosity Ratio 0.996948943 -Heat Capacity 0.317478429 0.727495432 B/s*F effectiveness 94.95% -
Nusselt Number 30.09 12.87 -Convection Coefficient 31.35 7939.34 B/hr*ft^2*F Tube Thermal Conductivity 12.3 B/hr*ft*F Stainless steel
Pressure Drop Initial Estimate Shell Internal Diameter 6.600 in 6.6delta P/P in 0.16% 5.24% Tube Length 95.000 in 90.5
delta P 0.120 1.048 psi Baffles 15 - 15Resulting Pressure 74.753 18.952 psia Tube Internal Diameter 0.374 in
Tube Wall Thickness 0.063 inPressure Drop Final Estimate Clearance 0.100 in
Roughness 0.000005 ft Percent usable cross-section 90%Friction Factor 0.032 0.0024 - / ft^2/in^2 Tube Outside Diameter 0.500 in
Major Pressure Drop 0.195091 1.6385 psi Tube Pitch 0.600 in (Triangle Pitch)Minor Pressure Drop 0.037066 psi Pitch Area 0.058
delta P/P in 0.31% 8.19% Number of Tubes 197 inResulting Pressure 74.64 18.36152981 psia Tube Flow Area 21.642 in^2
Baffle Space 5.938 inShell Cross Flow Area 6.531 in^2
Shell Hydraulic Diameter 0.294 inRe > 10,000 Update f from Fig 29, Kern Tube Heat Transfer Area 21989.295 in^2
Shell Heat Transfer Area 29397.453 in^2
Volume 3400.667 in^31.968 ft^3
Figure 6: NaK Heater Design Sheet (Shell and Tube) The results of this study, as seen in Figure 7, indicates that the HeXe heat exchanger sizing is the smallest. This is due to the excellent transport properties of the mixture. Since this gas mixture does not suit the cost of this program, the next choice is Carbon Dioxide. The Carbon Dioxide heat exchangers will be approximately 50% larger, but due to the lower pressure requirement, the anticipated weight will not scale with the same percentage. Clearly the Argon and Nitrogen heat exchangers are quite a bit larger and therefore Argon and Nitrogen are inferior relative to system weight and size. The data is presented at the low, medium, and high temperature ratios.
NASA/CR—2010-215673 10

Figure 7: Heat Exchanger Volume vs. Compressor Exit Pressure at Various Temperature Ratios Other figures of merit are the compressor and turbine efficiency. At the 12 kWe power range, the compressor and turbine wheel diameters become relatively small. This results in larger clearance losses due to practical machining tolerances and wheel clearances. Secondarily is the operating speed, slower speeds would mean heavier and larger equipment, but higher speeds may mean higher windage, bearings, and generator core losses. The shaft speed for the various gases and compressor exit pressures are shown in Figure 8. The turbine wheel diameter for various gases and operating pressures are shown in Figure 9. The compressor wheel diameters for various gases and operating pressures are shown in Figure 10. It is clear that Carbon Dioxide yields a higher shaft speed with similar turbine and compressor wheels sizes. With anticipated turbine and compressor efficiencies the same regardless of operating gas, then Carbon Dioxide would yield a much smaller alternator and therefore a much lower weight and volume TAC.
NASA/CR—2010-215673 11

Figure 8: Optimum Shaft Speed versus Compressor Exit Pressure for Various Gases at low, average, and high temperature ratios.
Figure 9: Turbine Wheel Diameter for various gases versus Compressor Exit Pressure for low, average, and high temperature ratios.
NASA/CR—2010-215673 12

Figure 10: Compressor Wheel Diameter for various gases versus Compressor Exit Pressure for low, average, and high temperature ratios. Additional analysis was performed for 6 kW, 12 kW, and 24 kW power converters. The Brayton cycle TAC has significant challenges to produce efficient power at lower power levels. This is primarily due to the small turbine and compressor wheel sizes and associated clearance losses. This lowers the overall efficiency for rotating machinery of this type. The anticipated cycle efficiencies with a larger 98% effective recuperator for various gases are seen in Figure 11. The heat exchanger volume is also presented for the 6 kW, 12 kW, and 24 kW power levels for CO2, N2, Ar, and HeXe mixture, Figure 12. The heat exchanger sizes generally scale in a linear fashion with power level. Larger power levels could anticipate slightly lower weight per kW thermal transfer due to efficiency in pressure boundary construction.
NASA/CR—2010-215673 13

Figure 11: Cycle Efficiency vs. Compressor Exit Pressure for CO2, N2, Ar, and HeXe at 6 kW, 12 kW, and 24 kW.
Figure 12: Heat Exchanger Volume vs. Compressor Exit Pressure for CO2, N2, Ar, and HeXe at 6 kW, 12 kW, and 24 kW.
NASA/CR—2010-215673 14

Summary of Fluid Trade Study Information: • Helium Xenon Mix
– Best Efficiency – Lowest Heat Exchanger Volume – Low Weight – Most Expensive Fluid
• Argon – Comparable Efficiency to CO2 – High Heat Exchanger Volume – High Weight – Reasonable Working Fluid Cost
• Carbon Dioxide – Good Efficiency – Moderate Heat Exchanger Volume – Low Weight (Lower Pressure and Smaller turbo-generator) – Least Expensive Fluid – Available on Mars at Low Pressure
The helium xenon system would provide the most efficient power conversion system, but on a kW/kg or kW/m^3 evaluation, it is not as clear for a 12 kWe power system. The TAC generator on HeXe would be approximately twice the size and roughly twice the weight primarily due to the lower shaft speed and larger alternator size. Secondarily the higher optimum operating pressure would lead to heavier pressure boundary containment. The prohibitive cost of the Xenon at approximately $1 US per gram (2008 price) does not fit the program goals as stated by NASA The CO2 system is slightly heavier, but given the higher speed alternator, and relatively small heat exchanger sizes, it a good match for the program goals. It was selected primarily due to the advantageous cost of the working fluid
2.2 System Trade Study The system trade study is used to identify the sensitivity of the various system components and parameters. The heat exchangers comprise the majority of the overall system volume and weight. The goal is to optimize the cycle efficiency relative to system specific weight and specific volume. Figure 13 identifies the influence of pressure ratio and heat exchanger volume on the overall cycle efficiency. It can be seen that a cycle efficiency reduction of 0.5-1% can reduce the heat exchanger size by 10-20% near the optimum point. This is an important consideration for a flight weight system. Figure 14 identifies the influence of recuperator effectiveness versus the overall cycle efficiency. Overlaid on this figure is the specific weight of the heat exchanger relative to recuperator effectiveness. An inflection point is obvious for the considered power levels of 6 kW, 12 kW, and 24 kW. For the 12 kW system, the inflection point is between 88-90% effectiveness. Larger recuperator effectiveness values can easily increase the heat exchanger weights by 50%.
NASA/CR—2010-215673 15

Figure 13: Cycle Efficiency vs. Pressure ratio and Heat Exchanger Volume
Cycle Eff v Rec % and Sp Wt
87.0
88.0
89.0
90.0
91.0
92.0
93.0
94.0
95.0
96.0
97.0
98.0
15 17 19 21 23 25 27
Cycle Efficiency %
Rec
uper
ator
Effe
ctiv
ines
s %
0.0
10.0
20.0
30.0
40.0
50.0
60.0
Spec
ific
Wei
ght k
g/kW
Specific Weight 12kWe
RecuperatorEffectiveness12 kWe Only
Specific Weight 24We
Specific Weight 6kWe
Figure 14: Cycle Efficiency vs. Recuperator Effectiveness and Specific Weight for 6 kW, 12 kW, and 24 kW Converters
NASA/CR—2010-215673 16

Another sizing consideration is relative to the NaK to CO2 heat exchanger. NaK flow rate was not initially provided in the specification and was varied from 1.5 to 3.5 kg/s for the analysis to evaluate sensitivity. It is important to keep the CO2 temperature as close to the NaK temperature as possible without increasing the heat exchanger volume to an unacceptably large size. Figure 15 shows the effect of NaK Flow on cycle efficiency and NaK heater volume with a 5 deg K approach temperature.
Cycle Eff v NaK Flow v HX Volume12 kWe
0
0.5
1
1.5
2
2.5
3
3.5
4
19.2 19.3 19.4 19.5 19.6 19.7 19.8 19.9 20 20.1 20.2 20.3
Cycle Efficiency %
NaK
Flo
w lb
/sec
0
0.05
0.1
0.15
0.2
0.25
0.3
0.35
0.4
HX
Volu
me
m^3
Cycle Eff v NaK FlowCycle Eff v HX Volume
Figure 15: Cycle Efficiency vs. NaK Flow Rate and Heat Exchanger Volume The system trade study identifies the important parameters regarding the effect of heat exchanger sizes and flow rates on cycle efficiency. At this point heat exchanger vendors were contacted regarding refining the designs relative to performance and fabrication.
3. Heat Exchanger Design
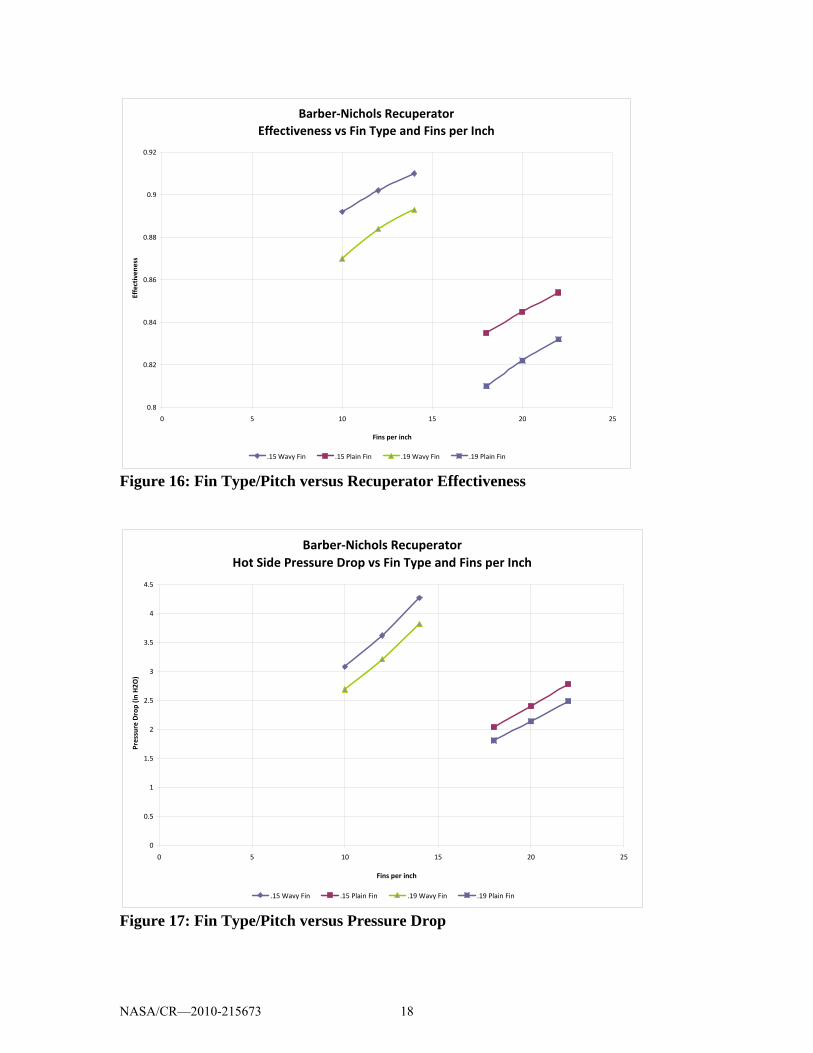
3.1 Recuperator Design The recuperator is used to preheat the compressor exit gas prior to entering the NaK to gas heater. It utilizes the residual heat from the turbine exit gas. Niagara Thermal Products was contacted regarding the refinement of the recuperator design and ultimately provide a manufacturing quotation regarding this heat exchanger. The initial task was to confirm the Barber-Nichols recuperator design relative to performance, size, weight, and pressure drop estimates. Niagara Thermal Products identified several fin types that were tooled and available for use with this heat exchanger. The fin types offer different pressure drop and effectiveness options that are presented in Figure 16 and Figure 17.
NASA/CR—2010-215673 17
Barber‐Nichols RecuperatorEffectiveness vs Fin Type and Fins per Inch
0.8
0.82
0.84
0.86
0.88
0.9
0.92
0 5 10 15 20 25
Fins per inch
Effectiven
ess
.15 Wavy Fin .15 Plain Fin .19 Wavy Fin .19 Plain Fin
Figure 16: Fin Type/Pitch versus Recuperator Effectiveness
Barber‐Nichols RecuperatorHot Side Pressure Drop vs Fin Type and Fins per Inch
0
0.5
1
1.5
2
2.5
3
3.5
4
4.5
0 5 10 15 20 25
Fins per inch
Pressure Drop (in
H2O
)
.15 Wavy Fin .15 Plain Fin .19 Wavy Fin .19 Plain Fin
Figure 17: Fin Type/Pitch versus Pressure Drop
NASA/CR—2010-215673 18

An effectiveness of 89-90% is required for high cycle efficiency so the choice is between the .19 wavy fin and the .15 plain fin. The .19 wavy fin was chosen based on lower pressure drop. After fin selection, the recuperator design was finalized and the performance chart was constructed as seen in Figure 18.
CO2 RecuperatorHot Side In @ 909.0°FCold Side In @ 355.2°F
0.5
0.55
0.6
0.65
0.7
0.75
0.8
0.85
0.9
0.95
1
0 0.2 0.4 0.6 0.8 1 1.2 1.4
CO2 Flow Rate lb/sec
Effectiven
ess
0.000
0.020
0.040
0.060
0.080
0.100
0.120
0.140
0.160
0.180
0.200
Pressure Drop psid
Effectiveness Pressure Drop Cold Side Pressure Drop Hot Side
Figure 18: Recuperator Performance The recuperator is a brazed construction with welded tank heads and manifolds. A preliminary design was provided by the manufacturer that indicated the approximate size and weight of the heat exchanger. Since the raised face flanges are not necessary in the final design, they were eliminated and the tank heads were modified to lower the estimated weight. The overall recuperator size is shown in Figure 19.
NASA/CR—2010-215673 19

Figure 19: Overall Recuperator Size
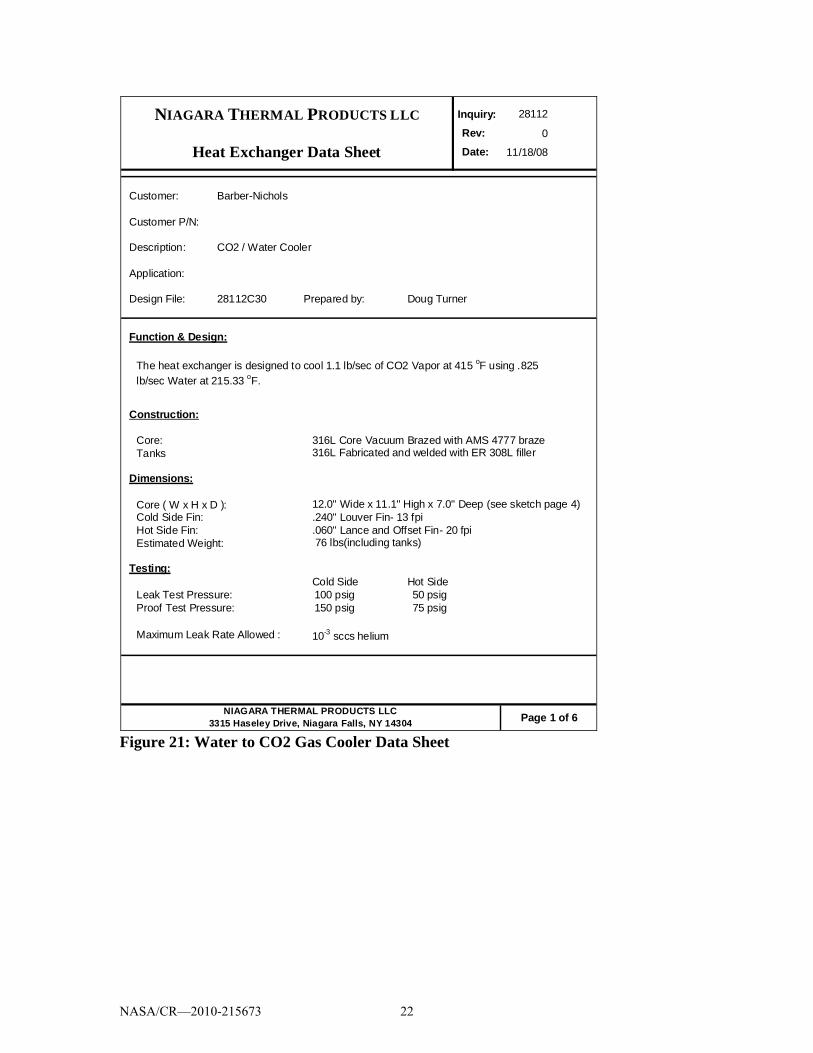
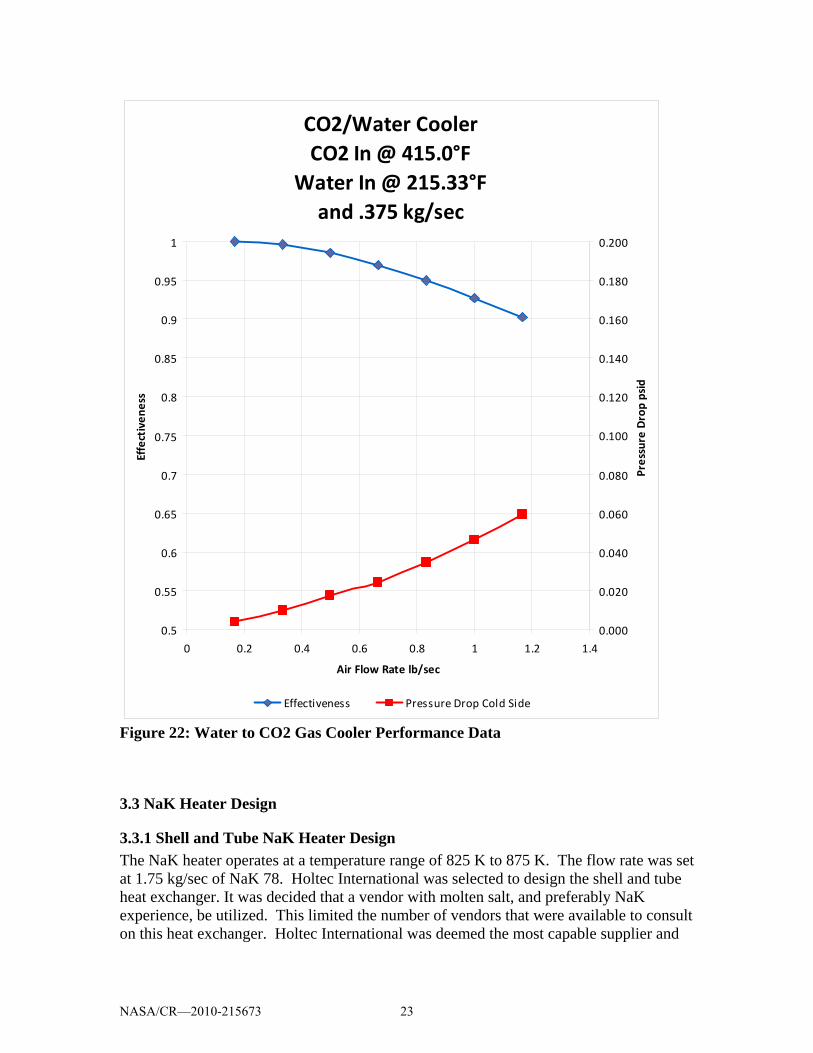
3.2 Water/Gas Plate Fin Cooler Niagara Thermal Products generated a compact water-to-CO2 gas cooler design. The heat exchanger is a plate/fin type much like the recuperator. The construction material is 316L stainless steel with AMS 4777 braze filler. The overall design is shown as given by the supplier in Figure 20. The ASME flanges will not be used and the weight is subtracted for those to come to a lower weight estimate. The supplier data sheet is shown in Figure 21 and the off design performance is shown in Figure 22.
NASA/CR—2010-215673 20

Figure 20: Water to CO2 Gas Cooler Dimensional Data
NASA/CR—2010-215673 21
Inquiry: 28112
Rev: 0
Date: 11/18/08
Customer:
Customer P/N:
Description:
Application:
Design File: 28112C30 Prepared by:
Function & Design:
Construction:
Core:Tanks
Dimensions:
Core ( W x H x D ):Cold Side Fin:Hot Side Fin: Estimated Weight:
Testing:Cold Side Hot Side
Leak Test Pressure: 100 psig 50 psigProof Test Pressure: 150 psig 75 psig
Maximum Leak Rate Allowed : 10-3 sccs helium
.240" Louver Fin- 13 fpi
.060" Lance and Offset Fin- 20 fpi 76 lbs(including tanks)
Doug Turner
316L Core Vacuum Brazed with AMS 4777 braze316L Fabricated and welded with ER 308L filler
12.0" Wide x 11.1" High x 7.0" Deep (see sketch page 4)
NIAGARA THERMAL PRODUCTS LLC
The heat exchanger is designed to cool 1.1 lb/sec of CO2 Vapor at 415 oF using .825 lb/sec Water at 215.33 oF.
Page 1 of 6NIAGARA THERMAL PRODUCTS LLC3315 Haseley Drive, Niagara Falls, NY 14304
Heat Exchanger Data Sheet
Barber-Nichols
CO2 / Water Cooler
Figure 21: Water to CO2 Gas Cooler Data Sheet
NASA/CR—2010-215673 22
CO2/Water CoolerCO2 In @ 415.0°F
Water In @ 215.33°Fand .375 kg/sec
0.5
0.55
0.6
0.65
0.7
0.75
0.8
0.85
0.9
0.95
1
0 0.2 0.4 0.6 0.8 1 1.2 1.4
Air Flow Rate lb/sec
Effectiven
ess
0.000
0.020
0.040
0.060
0.080
0.100
0.120
0.140
0.160
0.180
0.200
Pressure Drop psid
Effectiveness Pressure Drop Cold Side
Figure 22: Water to CO2 Gas Cooler Performance Data
3.3 NaK Heater Design
3.3.1 Shell and Tube NaK Heater Design The NaK heater operates at a temperature range of 825 K to 875 K. The flow rate was set at 1.75 kg/sec of NaK 78. Holtec International was selected to design the shell and tube heat exchanger. It was decided that a vendor with molten salt, and preferably NaK experience, be utilized. This limited the number of vendors that were available to consult on this heat exchanger. Holtec International was deemed the most capable supplier and
NASA/CR—2010-215673 23

capable of only shell/tube type designs. Several iterations were done to trade pressure drop and heat exchanger size. The final shell/tube design sheet is shown in Figure 23.
Figure 23: Heat Exchanger Specification Sheet for NaK to CO2 Gas The primary material of construction is 316 stainless steel. It contains the NaK on the shell side and the CO2 on the tube side. The heat exchanger is approximately 0.3 m diameter x 1.2 m long. The tube bundle contains 676 x 6mm tubes with a wall thickness 0.45mm. This heat exchanger was deemed to be too heavy and not flight worthy. A search of an alternative vendor for a plate fin heat exchanger with NaK experience was not successful.
NASA/CR—2010-215673 24

Niagara Thermal Products was capable of providing the heat exchanger, but had no experience in handling NaK.
3.3.2 Plate/Fin NaK Heater Researching literature provided a basis for past molten salt heat exchanger designs for space applications. A previous NASA program for the SNAP reactor (1970’s vintage) provided valuable information regarding proposed heat exchanger design types and material compatibility. A liquid metal design manual, “SNAP Technology Handbook”, G.F. Burdi, NAA-SR-86 17, VOLUME I, REACTOR TECHNOLOGY, SNAP REACTORS, SNAP PROGRAM, TID-4500 (29th Ed.) M-3679 (34th Ed.) was utilized to provide material data and ultimately to design a plate fin heat exchanger that is much lighter weight than the shell/tube design. Essentially, the thermal transfer of the NaK heater and the gas cooler are approximately equal. With the gas cooler design was used as a basis for scaling the NaK heater with a slight change in the braze material from AMS 4777 to AMS 4778 to remove the iron in the braze filler. All other parameters for pressure drop, thermal transfer showed this heat exchanger exceeded the specifications for the NaK heater. This drops the weight of the heat exchanger to below 30 kg and reduces the size to approximately 0.3m x 0.2m x 0.3m.
4. Cycle and Performance Analysis After sizing the heat exchangers, an estimate of turbine and compressor performance can be made from a thermodynamic cycle simulation of the complete converter. Typically the cycle design will change slightly once the turbine and compressor performance is estimated. This design cycle also must include turbine and compressor stress estimates. This design cycle utilizes many areas of expertise from aerodynamics to stress to thermodynamics. Once the turbine and compressor designs are finalized, off performance maps are generated and implemented into the cycle design. The cycle design spreadsheet can then be used to estimate the performance for on and off design conditions. The cycle spreadsheet calculates all state point data and displays losses and efficiencies for major components. The spreadsheet also calculates cycle efficiency as well as system efficiency. Cycle efficiency is defined as operating gas side efficiency. System efficiency includes the NaK and water side energy. The efficiency relative to Carnot is also provided.
4.1 Nominal Temperature Difference The nominal temperature difference is specified at 850 K NaK inlet temperature to the heat exchanger at a 1.75 kg/sec flow rate (Figure 24). The water temperature for the nominal case is 375 K with a .8 lb/sec flow rate. The heat exchangers are designed for the nominal condition as is the turbomachinery. The spreadsheet is linked to both the heat exchanger and turbomachinery dynamically. This allows off design calculations to be performed in a relatively quick manner. It also balances the mass and pressure against
NASA/CR—2010-215673 25
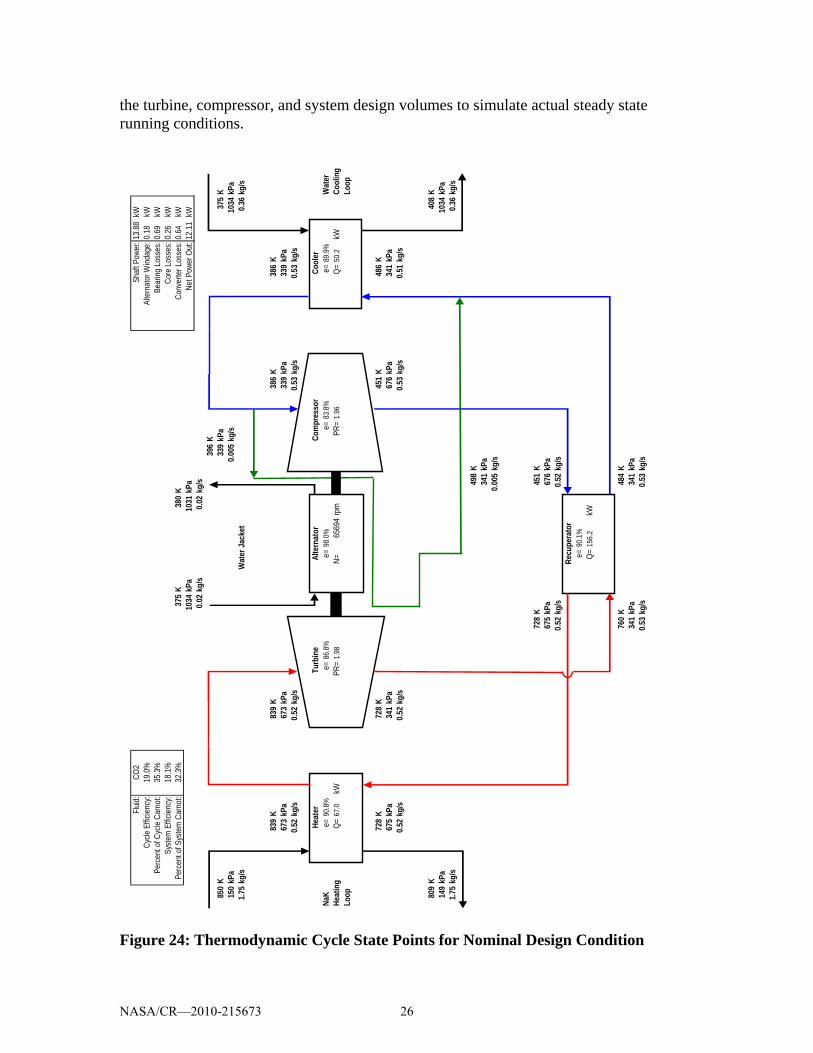
the turbine, compressor, and system design volumes to simulate actual steady state running conditions.
Figure 24: Thermodynamic Cycle State Points for Nominal Design Condition
Fluid
:Sh
aft P
ower
:13.
88kW
Cycle
Effi
cienc
y:Al
tern
ator
Wind
age:
0.18
kWPe
rcen
t of C
ycle
Carn
ot:
Bear
ing L
osse
s:0.
69kW
Syste
m E
fficie
ncy:
Core
Los
ses:
0.26
kWPe
rcen
t of S
yste
m C
arno
t:37
5K
380
KCo
nver
ter L
osse
s:0.
64kW
1034
kPa
1031
kPa
Net P
ower
Out
:12.
11kW
0.02
kg/s
0.02
kg/s
396
K85
0K
339
kPa
375
K15
0kP
a0.
005
kg/s
1034
kPa
1.75
kg/s
Wat
er Ja
cket
0.36
kg/s
839
K83
9K
386
K38
6K
673
kPa
673
kPa
339
kPa
339
kPa
0.52
kg/s
0.52
kg/s
0.53
kg/s
0.53
kg/s
NaK
e=90
.8%
e=86
.8%
e=98
.0%
e=83
.8%
e=89
.9%
Wat
erHe
atin
gQ=
67.0
kWPR
=1.
98N=
6569
4rp
mPR
=1.
96Q=
50.2
kWCo
olin
gLo
opLo
op
728
K72
8K
451
K48
6K
675
kPa
341
kPa
676
kPa
341
kPa
0.52
kg/s
0.52
kg/s
0.53
kg/s
0.51
kg/s
809
K40
8K
149
kPa
1034
kPa
1.75
kg/s
0.36
kg/s
498
K34
1kP
a0.
005
kg/s
728
K45
1K
675
kPa
676
kPa
0.52
kg/s
0.52
kg/s
e=90
.1%
Q=15
6.2
kW
760
K48
4K
341
kPa
341
kPa
0.53
kg/s
0.53
kg/s
Com
pres
sor
Cool
er
Recu
pera
tor
CO2
Heat
erAl
tern
ator
19.0
%35
.3%
18.1
%32
.3%
Turb
ine
NASA/CR—2010-215673 26

The nominal condition operation results in a predicted system efficiency of 18.1%, with a cycle efficiency of 19.0%.
4.2 High Temperature Difference The high temperature difference is specified at 875 K NaK inlet temperature to the heat exchanger at a 1.75 kg/sec flow rate. The water temperature for the nominal case is 325 K with a .375 kg/sec flow rate. The heat exchangers are designed for the nominal condition, as is the TAC, however the goal is to predict the performance of the power conversion system with the excess available heat. Again, the spreadsheet method is utilized so that the TAC and heat exchanger off-design characteristics can be met as a system with the proper heat and mass balance. Figure 25 shows the state points of the high temperature difference analysis. The high temperature difference analysis results in a maximum power of 16.24 kWe from the power converter. The system efficiency is calculated at 21.4% and a cycle efficiency of 22.5%.
4.3 Low Temperature Difference The low temperature difference is specified at 825 K NaK inlet temperature to the heat exchanger at a 1.75 kg/sec flow rate. The water temperature for the nominal case is 375 K with a .375 kg/sec flow rate. The heat exchangers are designed for the nominal condition, as is the TAC, however the goal is to predict the performance of the power conversion system with the minimum available heat. Again, the spreadsheet method is utilized so that the TAC and heat exchanger off-design characteristics can be met as a system with the proper heat and mass balance. Figure 26 shows the state points of the low temperature difference analysis. The high temperature difference analysis results in a maximum power of 9.55 kWe from the power converter. The system efficiency is calculated at 16% and a cycle efficiency of 16.8%.
4.4 Off-Design Performance The spreadsheet can also predict performance over a range of speeds. This analysis is useful to predict the initial charge pressure for the system and also the startup characteristics. The analysis also predicts the power produced as a function of TAC shaft speed. This allows the operator to select a speed and heat amount for operating off-design. The other control strategy is to operate the TAC at maximum speed and raise and lower the heat amount to effect part-load operation. The maximum power produces versus shaft speed is presented in Figure 27. The analysis is done for the low, medium, and high temperature ratios. The startup power and pressure conditions are presented in Figure 28.
NASA/CR—2010-215673 27

Figure 25: High Temperature Difference Performance Analysis
NASA/CR—2010-215673 28

Figure 26: Low Temperature Difference Converter Performance
NASA/CR—2010-215673 29

Off Design Performance Estimate
0
5
10
15
20
25
0 10000 20000 30000 40000 50000 60000 70000 80000
Shaft Speed (RPM)
Cyc
le N
et P
ower
Out
(kW
e)
High Temp RatioNominal Temp RatioLow Temp RatioNominal SpeedNominal Power
14.3%
18.4%
21.8%
System Efficiency noted for each temperature ratio at nominal speed
Figure 27: Cycle Power Output versus Shaft Speed for Specified Temperature Differences
Off Design Performance Estimate
0
100
200
300
400
500
600
0 10000 20000 30000 40000 50000 60000 70000 80000
Shaft Speed (RPM)
Com
pres
sor I
nlet
Pre
ssur
e (k
Pa)
0
1
2
3
4
5
6
Com
pres
sor P
ress
ure
Ratio
High Temp RatioNominal Temp RatioLow Temp RatioHigh Temp RatioNominal Temp RatioLow Temp Ratio
Figure 28: Off Design Performance Pressures versus Shaft Speed
NASA/CR—2010-215673 30

5. Compressor Design A centrifugal compressor is selected for high efficiency and a compact design. The centrifugal compressor operates as a single stage with a set of diffuser vanes to maximize pressure recovery and efficiency. The final design is shown in Table 1. A compressor intake side view with the shroud removed is shown in Figure 29. Parameter Design Value Vaned-Island Diffuser [# vanes] 22 Impeller w/ Splitter Blades 7+7 Diameter Impeller-Exit mm 84. 78 Diameter-eye mm 37.11 Diameter-hub mm 9.75 Impeller Exit Blade Height mm 4 Exit Blade Angle [deg-from tang] 45 Impeller Clearance mm .203 Table 1: Compressor Design Table
Figure 29: Front View Compressor and Vane Island Diffuser The compressor was optimized for maximum efficiency by reducing operating clearances and specifying a high degree of surface finish on the compressor wheel and flow passages. The compressor wheel is manufactured from Inconel 718, enabling thin blade sections for increased performance.
NASA/CR—2010-215673 31
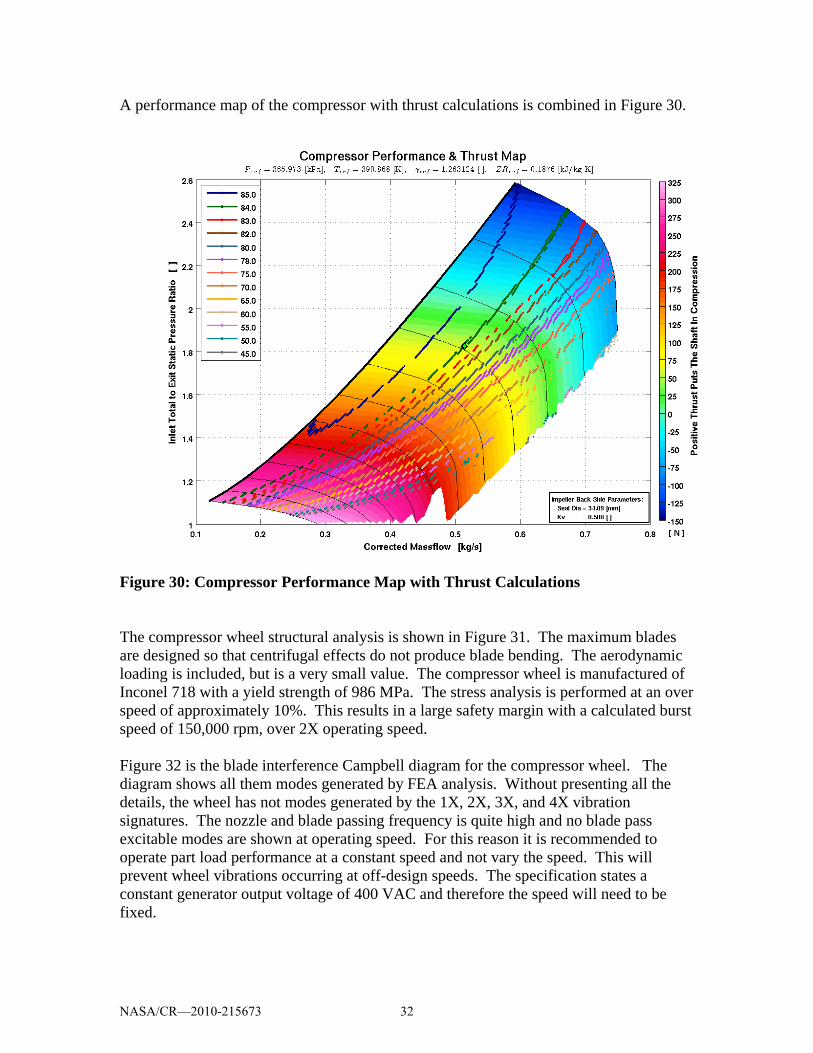
A performance map of the compressor with thrust calculations is combined in Figure 30.
Figure 30: Compressor Performance Map with Thrust Calculations The compressor wheel structural analysis is shown in Figure 31. The maximum blades are designed so that centrifugal effects do not produce blade bending. The aerodynamic loading is included, but is a very small value. The compressor wheel is manufactured of Inconel 718 with a yield strength of 986 MPa. The stress analysis is performed at an over speed of approximately 10%. This results in a large safety margin with a calculated burst speed of 150,000 rpm, over 2X operating speed. Figure 32 is the blade interference Campbell diagram for the compressor wheel. The diagram shows all them modes generated by FEA analysis. Without presenting all the details, the wheel has not modes generated by the 1X, 2X, 3X, and 4X vibration signatures. The nozzle and blade passing frequency is quite high and no blade pass excitable modes are shown at operating speed. For this reason it is recommended to operate part load performance at a constant speed and not vary the speed. This will prevent wheel vibrations occurring at off-design speeds. The specification states a constant generator output voltage of 400 VAC and therefore the speed will need to be fixed.
NASA/CR—2010-215673 32

igure 31: Compressor Wheel Stress Analysis at 10% Over-speed
igure 32: Compressor Wheel Campbell Diagram
F
F
0
5000
10000
15000
20000
25000
30000
35000
0 10000 20000 30000 40000 50000 60000 70000
Speed (RPM)
Freq
uenc
y (H
z)
± 20% of Operating Speed
1/R2/R3/R
6/R
22/R
4/R
Rotating - Compressor Wheel Structural Analysis
276 MPa
Stress(Pa) • Inconel 718 at 449.8 K
– Ultimate Strength = 1179 MPa
a
6 MPa
30
a
29
ge tangential stress = 207 MPa
– Yield Strength = 986 MP
• 10 % overspeed: 72,000 RPM
• Max Net Section Stress = 27
– Ultimate SF = 4.
– Yield SF = 3.58
• Max Local Stress = 358 MP
– Ultimate SF = 3.
– Yield SF = 2.75
• Burst Speed = 150,000 rpm
– Avera
Max Local Stress: 358 MPa
Max Net-Section Stress:
NASA/CR—2010-215673 33

6. Turbine Design The turbine wheel is a radial inflow type. It utilizes nozzles to direct the flow at the
ptimum angle for high efficiency. The design dimensions and details are shown in front view with shroud r in Figure 33.
Design Value
oTable 2. The emoved is shown Parameter # Nozzles 13 # Blades 11 Diameter Turbine Inlet mm 89.6 Diameter Turbine Exit mm 61.1 Diameter Turbine Hub mm 23.2 Turbine Inlet Blade Height mm 18.92 Impeller Clearance mm .203 Table 2: Turbine Design Dimensions
igure 33: Turbine Exit View with Nozzles, Shroud Removed
F
NASA/CR—2010-215673 34

igure 34: Turbine Performance and Thrust Map
n
n compressor wheel thrust to
eutralize the thrust load on the rotor support system.
x, 3x, and 4x modes are not excited, or is the blade pass modes at the operating speed.
F The turbine performance indicates an efficiency of slightly higher than 87% (Figure 34). The turbine and compressor are on the same shaft and a compromise must be reached ooverall performance. Slightly higher turbine efficiency could be reached at a different operating speed, but not enough to warrant two individual shafts. The thrust map is aimportant consideration and ideally is balanced with then The turbine wheel is made from Inconel 718 with yield strength at temperature of 931 MPa. This provides a 2:1 margin on burst speed. The analysis was performed at 10% over speed. The details of the stress analysis are shown in Figure 35. The interference Campbell diagram is shown in Figure 36. The 1x, 2n
NASA/CR—2010-215673 35

Rotating - Turbine Wheel Structural Analysis
Figure 35: Turbine Stress Analysis
• Inconel 718 at 810.9 K
– Ultimate Strength = 1117 MPa
– Yield Strength = 931 MPa
• 10 % over-speed: 72,000 RPM
• Max Net Section Stress = 207 MPa
– Ultimate SF = 5.4
– Yield SF = 4.5
• Max Local Stress = 400 MPa
– Ultimate SF = 2.70
– Yield SF = 2.25
• Burst Speed = 160,000 rpm
– Average tangential stress = 173 MPa
400 MPa
400 MPa
Stress(Pa)
0
5000
10000
15000
20000
25000
0 10000 20000 30000 40000 50000 60000 70000
RPM
Freq
(Hz)
1/
2/R
3/R
4/R
6/R
13/
± 20% of Operating Speed
Figure 36: Turbine Wheel Interference Diagram
NASA/CR—2010-215673 36

7. Alternator Design The alternator is a permanent magnet design. It is a two pole (one pole pair) design using Samarium Cobalt magnets material shown in Figure 37. The magnets are cylindrical with a hollow center to provide a passage for a tie bolt. The magnets are kept in compression over the entire speed range by shrink fitting an Inconel 718 sleeve over the rotor structure. The magnet stresses are listed in Table 3. The stress analysis includes startup conditions at 200 K at results in 450 K at operating temperature.
Permanent Magnet Section
Figure 37: Permanent Magnet Section of Rotor TANGENTIAL
STRESS
CYLINDER TOTAL TOTAL Due to Due to Due to NAME Cold Hot Press. - Cold Press. - Hot Speed Mpa Mpa Mpa Mpa Mpa INNER-ID -46.9193 -107.3 -133.3473 -193.728448 86.428 INNER-OD -45.9428 -82.962 -79.2773646 -115.175041 33.3346 OUTER-ID 414.493 540.559 278.4071578 404.473031 136.086 OUTER-OD 329.916 431.498 224.3372224 325.919624 105.578 Inner SmCo -550 Crush Outer Inconel 718
986 Yield
Table 3: Magnet Stress Values
NASA/CR—2010-215673 37
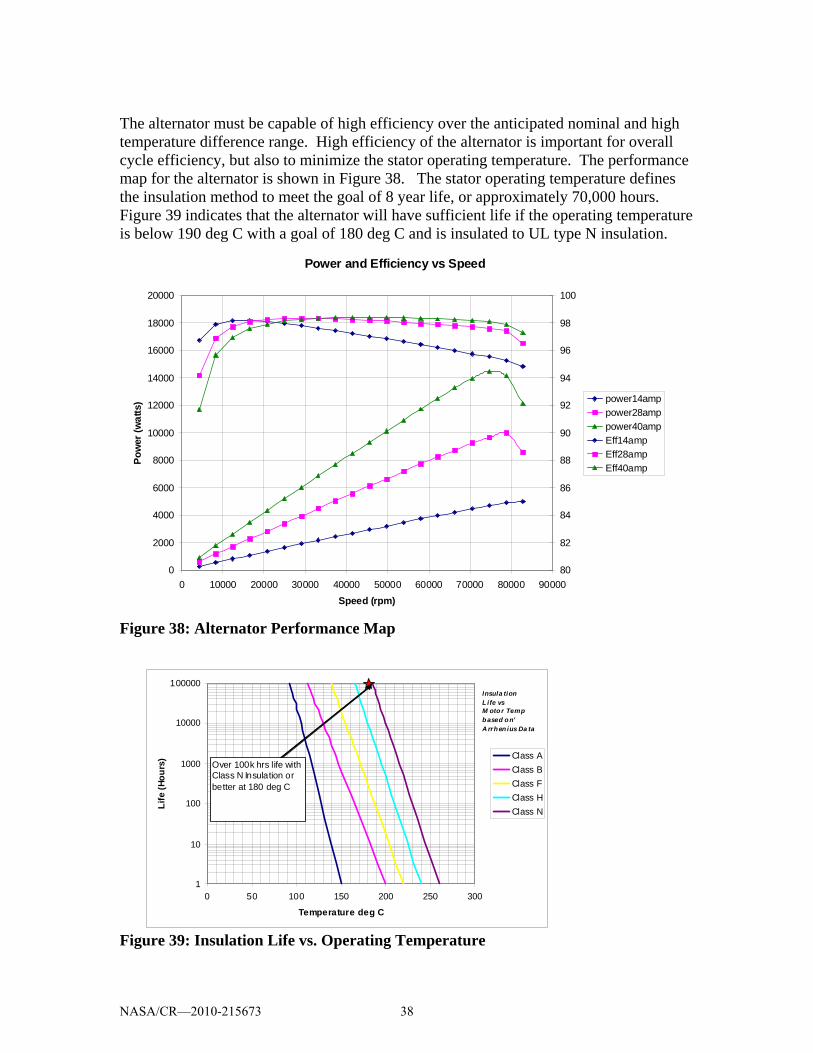
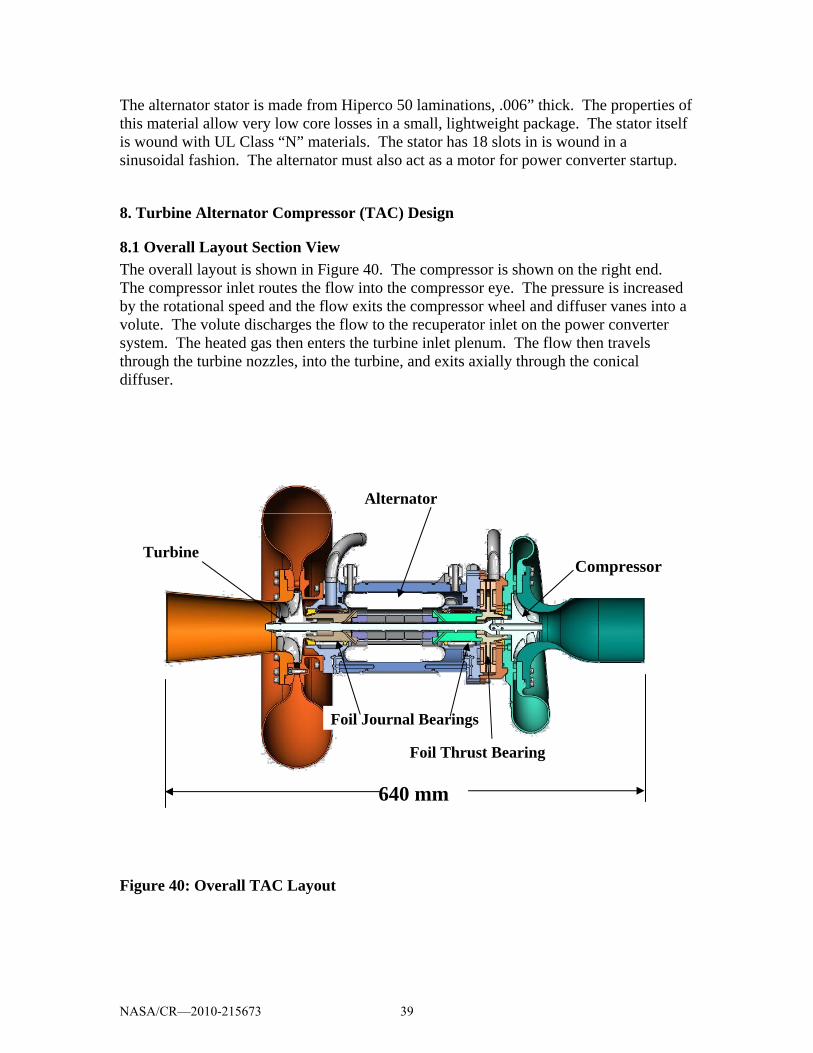
The alternator must be capable of high efficiency over the anticipated nominal and high temperature difference range. High efficiency of the alternator is important for overall cycle efficiency, but also to minimize the stator operating temperature. The performance map for the alternator is shown in Figure 38. The stator operating temperature defines the insulation method to meet the goal of 8 year life, or approximately 70,000 hours. Figure 39 indicates that the alternator will have sufficient life if the operating temperature is below 190 deg C with a goal of 180 deg C and is insulated to UL type N insulation.
Power and Efficiency vs Speed
0
2000
4000
6000
8000
10000
12000
14000
16000
18000
20000
0 10000 20000 30000 40000 50000 60000 70000 80000 90000Speed (rpm)
Pow
er (w
atts
)
80
82
84
86
88
90
92
94
96
98
100
power14amppower28amppower40ampEff14ampEff28ampEff40amp
Figure 38: Alternator Performance Map
1
10
100
1000
10000
100000
0 50 100 150 200 250 300
Temperature deg C
Life
(Hou
rs) Class A
Class BClass FClass HClass N
Over 100k hrs life with Class N Insulation or better at 180 deg C
Insula tionL ife vsM oto r Tempb ased o n'A rrh en ius Da ta
Figure 39: Insulation Life vs. Operating Temperature
NASA/CR—2010-215673 38
The alternator stator is made from Hiperco 50 laminations, .006” thick. The properties of this material allow very low core losses in a small, lightweight package. The stator itself is wound with UL Class “N” materials. The stator has 18 slots in is wound in a sinusoidal fashion. The alternator must also act as a motor for power converter startup.
8. Turbine Alternator Compressor (TAC) Design
8.1 Overall Layout Section View The overall layout is shown in Figure 40. The compressor is shown on the right end. The compressor inlet routes the flow into the compressor eye. The pressure is increased by the rotational speed and the flow exits the compressor wheel and diffuser vanes into a volute. The volute discharges the flow to the recuperator inlet on the power converter system. The heated gas then enters the turbine inlet plenum. The flow then travels through the turbine nozzles, into the turbine, and exits axially through the conical diffuser.
640 mm
Turbine Compressor
Alternator
Foil Journal Bearings
Foil Thrust Bearing
Figure 40: Overall TAC Layout
NASA/CR—2010-215673 39
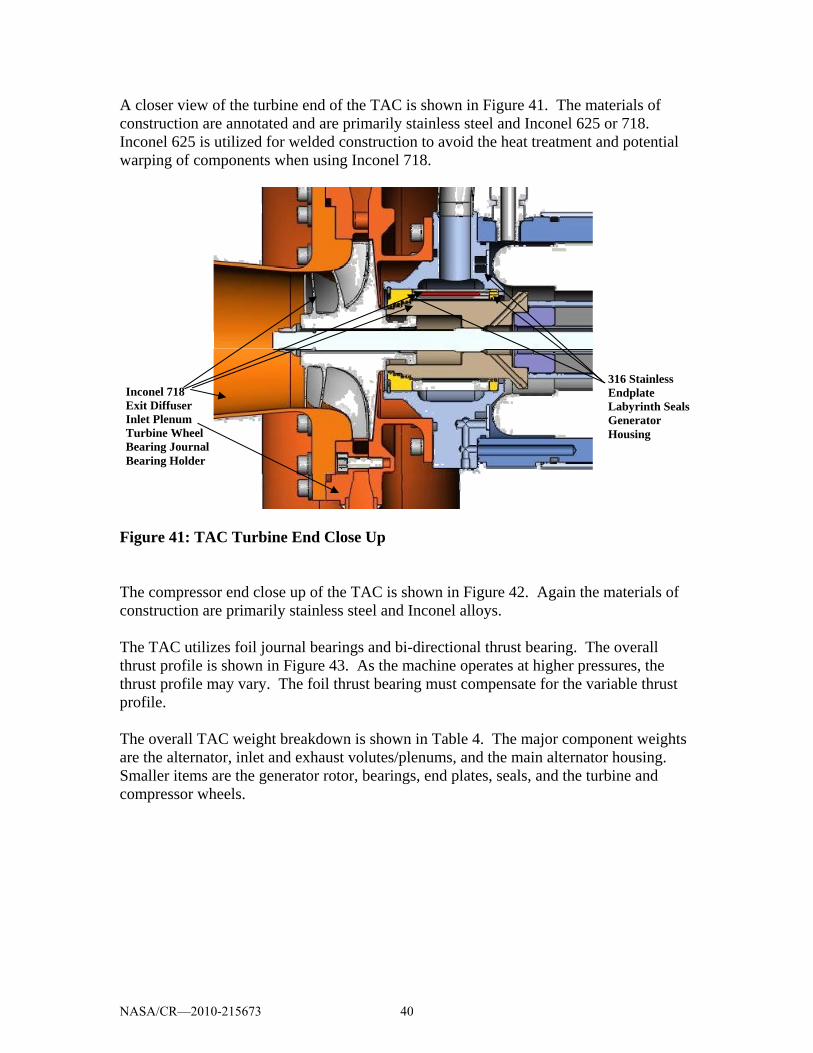
A closer view of the turbine end of the TAC is shown in Figure 41. The materials of construction are annotated and are primarily stainless steel and Inconel 625 or 718. Inconel 625 is utilized for welded construction to avoid the heat treatment and potential warping of components when using Inconel 718.
Inconel 718 Exit Diffuser Inlet Plenum Turbine Wheel Bearing Journal Bearing Holder
316 Stainless Endplate Labyrinth SealsGenerator Housing
Figure 41: TAC Turbine End Close Up The compressor end close up of the TAC is shown in Figure 42. Again the materials of construction are primarily stainless steel and Inconel alloys. The TAC utilizes foil journal bearings and bi-directional thrust bearing. The overall thrust profile is shown in Figure 43. As the machine operates at higher pressures, the thrust profile may vary. The foil thrust bearing must compensate for the variable thrust profile. The overall TAC weight breakdown is shown in Table 4. The major component weights are the alternator, inlet and exhaust volutes/plenums, and the main alternator housing. Smaller items are the generator rotor, bearings, end plates, seals, and the turbine and compressor wheels.
NASA/CR—2010-215673 40
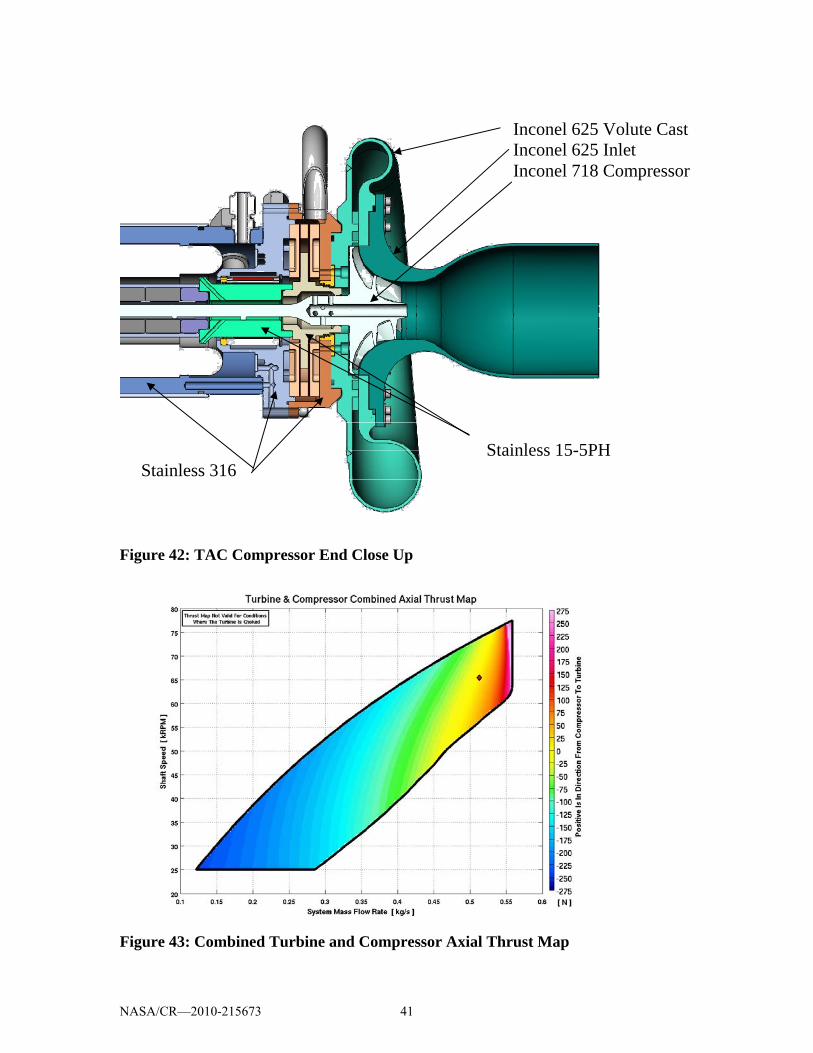
Stainless 316 Stainless 15-5PH
Inconel 625 Volute Cast Inconel 625 Inlet Inconel 718 Compressor
Figure 42: TAC Compressor End Close Up
Figure 43: Combined Turbine and Compressor Axial Thrust Map
NASA/CR—2010-215673 41

Compressor 0.5 kg
Turbine 0.46 kg Main Housing 3.45 kg
Compressor Volute 3.3 kg Alternator Stator 4.45 kg Turbine Plenum 4.85 kg Alternator Rotor/Bearings 0.919 kg Endplates/Seals 5.5 kg Guide vanes, Bolts, Piping 6.67 kg Total Weight 30.1 kg
Table 4: TAC Weight Breakdown
8.2 Foil Bearings The TAC is supported on foil bearings. It is the intent to utilize foil bearings from a Capstone C30 Microturbine. The CO2 environment for these bearings is considerably different than that of the microturbine so bearing loss and cooling data is difficult to verify. For this reason a small scale experiment was performed to quantify the foil bearing losses on air and CO2. A Capstone natural gas compressor was modified by removing the pumping elements and adding a flywheel mass. This mass simulates the weight of the TAC and should more closely approximate the bearing losses. A pressurized piston arrangement was used to load the thrust bearing. This was limited to approximately 50 N of force. A photograph of the test rig is shown in Figure 44. The test rig was operated to 30 krpm on air and 35 krpm on CO2 at 20 psi pressure. The results are shown in Figure 45. The measured power was from the DC supply feeding the controller. Efficiency estimates for the controller and the motor are approximately 85%, so the foil bearing power loss is approximately 85% of the value in the plot. The data repeated nicely and had a power law profile that was curve fit. This data was extrapolated to provide an estimated bearing loss for the TAC thermal analysis and cooling flow.
NASA/CR—2010-215673 42

88mm Thrust Bearings
3 kg Test Rotor39mm Journal Bearings
Added FlywheelMass
Figure 44: Foil Bearing Experimental Hardware
Speed vs Power50 N thrust
Air is slightly lower than CO2 y = 0.2166x2 - 1.3126x + 50.209
0
50
100
150
200
250
300
0 5 10 15 20 25 30 35 40
Speed (krpm)
Pow
er (w
atts
)
Figure 45: Foil Bearing Power vs. Speed (Power is from DC Supply)
NASA/CR—2010-215673 43
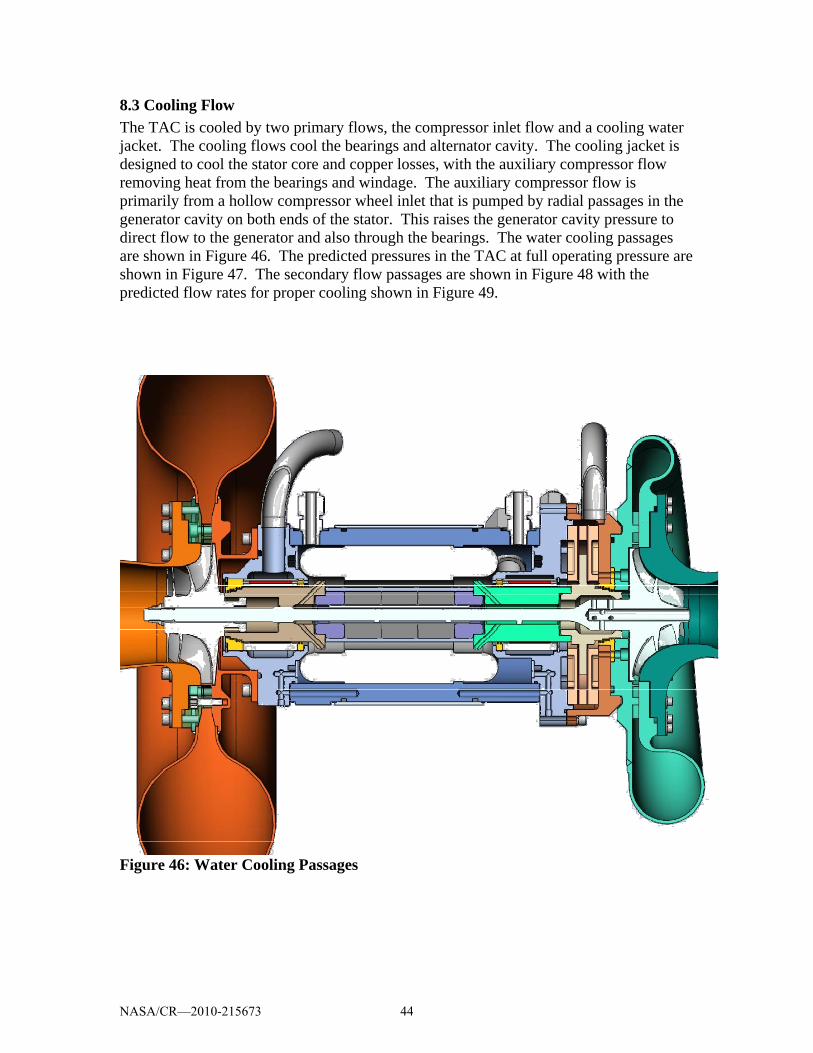
8.3 Cooling Flow The TAC is cooled by two primary flows, the compressor inlet flow and a cooling water jacket. The cooling flows cool the bearings and alternator cavity. The cooling jacket is designed to cool the stator core and copper losses, with the auxiliary compressor flow removing heat from the bearings and windage. The auxiliary compressor flow is primarily from a hollow compressor wheel inlet that is pumped by radial passages in the generator cavity on both ends of the stator. This raises the generator cavity pressure to direct flow to the generator and also through the bearings. The water cooling passages are shown in Figure 46. The predicted pressures in the TAC at full operating pressure are shown in Figure 47. The secondary flow passages are shown in Figure 48 with the predicted flow rates for proper cooling shown in Figure 49.
Figure 46: Water Cooling Passages
NASA/CR—2010-215673 44

Figure 47: Predicted Cavity Pressures at Operating Speed
P = 48 psia
P = 82 psia P = 71 psia
P = 49 psia
P = 73 psia P = 68 psia
P = 54 psia P = 50 psia
P = 50 psia
200 W 200 W 100 W 300 W
80 W 80 W
Figure 48: Power Loss and Gas Cooling Flow Passages
NASA/CR—2010-215673 45
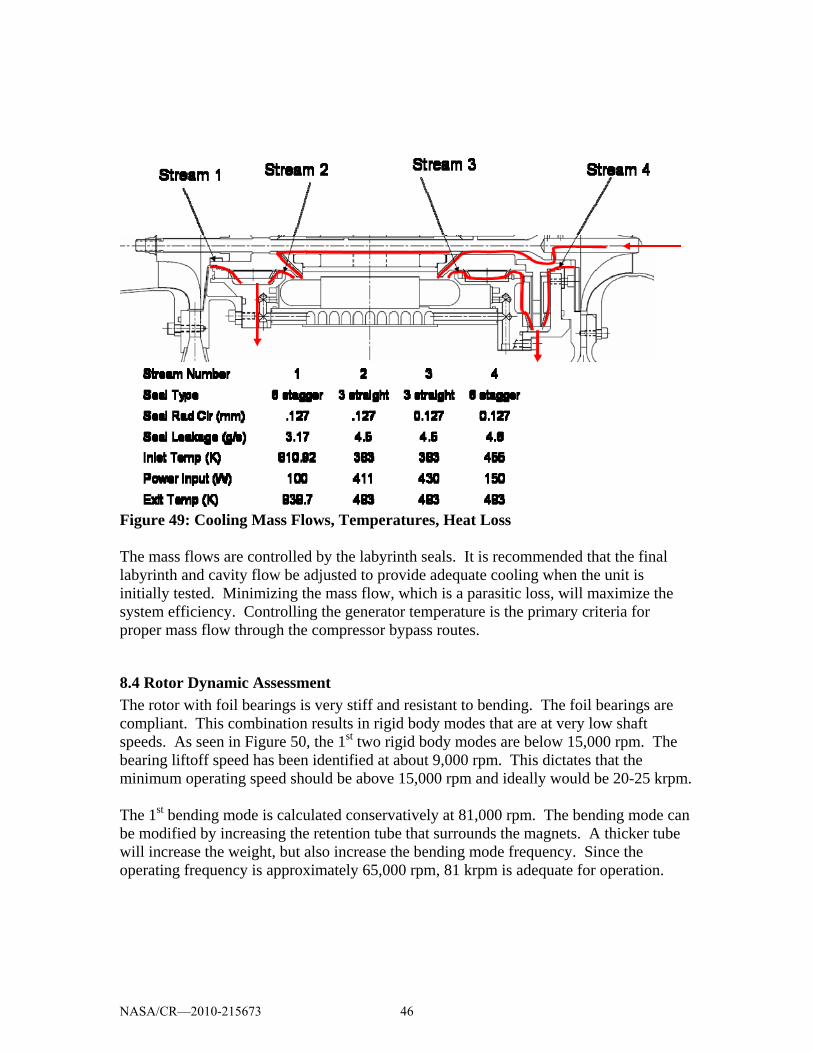
Figure 49: Cooling Mass Flows, Temperatures, Heat Loss The mass flows are controlled by the labyrinth seals. It is recommended that the final labyrinth and cavity flow be adjusted to provide adequate cooling when the unit is initially tested. Minimizing the mass flow, which is a parasitic loss, will maximize the system efficiency. Controlling the generator temperature is the primary criteria for proper mass flow through the compressor bypass routes.
8.4 Rotor Dynamic Assessment The rotor with foil bearings is very stiff and resistant to bending. The foil bearings are compliant. This combination results in rigid body modes that are at very low shaft speeds. As seen in Figure 50, the 1st two rigid body modes are below 15,000 rpm. The bearing liftoff speed has been identified at about 9,000 rpm. This dictates that the minimum operating speed should be above 15,000 rpm and ideally would be 20-25 krpm. The 1st bending mode is calculated conservatively at 81,000 rpm. The bending mode can be modified by increasing the retention tube that surrounds the magnets. A thicker tube will increase the weight, but also increase the bending mode frequency. Since the operating frequency is approximately 65,000 rpm, 81 krpm is adequate for operation.
NASA/CR—2010-215673 46

1000
10000
100000
1000. 10000. 100000. 1000000. 10000000.
Bearing Stiffness, lb/in
Crit
ical
Spe
ed, c
pm
Figure 50: Un-dampened Critical Speed Map
9. Power Controller The power controller serves several functions. It provides a boost converter function to increase the 120 VDC load supply voltage as specified by NASA to 450 VDC (selected by Barber-Nichols Inc.) to operate the generator at 400 VAC as specified by NASA. Another function is to use the alternator as a motor to start the Brayton cycle power converter. The power controller also converts any power available from the alternator by active rectification to the 450 VDC bus and the buck regulate the power to 120 VDC for the load. The power controller also has fault handling capability. It engages a set of temporary resistors in the event of shaft over speed.
9.1 Power Controller Packaging The power controller is packaged in a 19 inch rack mount. It is a 4U size and can be air or water cooled, water cooling is preferred. The control rack layout is seen in Figure 51 and Figure 52.
NASA/CR—2010-215673 47

Figure 51: Power Controller (Isometric View)
Figure 52: Component Locations for Power Controller (Top View)
Buck / Boost Half-Bridge
Buck / Boost Inductor
3 phaseInverter
DC Fuses
3 phaseFuses
LEM I feedback
X 5
Top Level Controller
Brake ChopperHalf-Bridge
NASA/CR—2010-215673 48

9.2 Power Controller Schematic and Simulation The power controller utilizes a full bridge IGBT package that contains a full-bridge three-phase drive and an auxiliary switch placed across the DC bus that is used as a brake. The top level schematic with function blocks is shown in Figure 53.
Buck / Boost IGBT Module
Low-side IGBT
operated during boost mode to deliver
energy from 120 Vdc bus to 450 Vdc bus for
motoring.
High-side IGBT operated during buck
mode to deliver energy from 760 Vdc
bus to 120 Vdc bus for generator operation.
Chopper IGBT Module
Low-side only IGBT module. Operated to
deliver excess energy from 120 Vdc bus to dump
resistor during generator mode
operation.
Three Phase IGBT Module w/ Brake
Bi-directional converter used to motor during
startup and rectify during generator mode operation.
On board Brake provides
redundant over speed protection in the event of a
Buck failure
DC+
Figure 53: Top Level Control Schematic The power converter simulation models can be broken down into the motor generator operational section and the boost converter section. The motor generator controller section is shown in Figure 54. The boost converter section is shown in Figure 55.
Figure 54: Motor/Generator Controller Simulation Circuit
32
11
Vdc
12
X5
12
1212 1212
12
12
1212
12
12
VFBA
IA 44
X2
44
4444 4444
44
44
4444
44
43
46
X4
46
4646 4646
46
46
4646
46
A B C
BHpwm CHpwm
44
VFBB
IB
46
VFBC
IC
CLpwmX6 46
35
BLpwmX3 44
ALpwmX1 12
VDCFB32
Idc
11
R41100e-3
AHpwm
12
D1
12
D2
44
D3
44
D4
46
D5
46
D6
32
30
C12000e-6
32
32
30
R21250e-3
30
30
DChi
11
11
32
R331e6
32
32
43
V16ICHswitch
VDChi
35
V20ICLswitch
35
35
32 3232 32
MABC
DC-
Brake
Input / Output Filter Inductor
Provides energy storage during
boost mode operation and
provides output filtering during
buck mode operation.
NASA/CR—2010-215673 49

VDC_hi
Figure 55: Boost/Buck Converter Controller Simulation Circuit The motor controller simulation circuit is used to identify waveforms and predict performance for the motoring and generating modes of operation. Figure 56 shows the motoring mode simulation results and waveform. Figure 57 shows generating mode simulation results and waveforms.
Figure 56: Motoring Mode Simulation
1
2
X1
2
22 22
2
2
22
2
Hipwm
2 3
I_bridge
V_bridge_fb
Lopwm
2
4
X2
2
D1
2
D2
1
I_hi_sw
V_hi_sw_fb
20
VDC_lo
4
V_lo_sw_fb
4
4
17
18
V_dc_lo
20 17
I_dc_lo
V_dc_fb_lo
6
R41100e-3
17
19
C14000e-6
8
R2125e-3
8
86
65
R331e6
5
55 5
5
55 5
I_lo_sw
22
5
55 5
3 20
L4{FilterL}
33
5
6
V_dc_hi
5
I_dc_hi
V_dc_fb_hi
18
R4500e-3
5
8
C62000e-6
19
R1025e-3
19
1918
1817
R111.2
17
1717 17
17
17
17
1717 17202020
202020
Motor Mode Simulation @ 600 Hz 5A +/- 2.5A Switch Points on Phase IGBTs I leg = 2.0 Arms, 1.55 kW In Phase-Phase Vpk = 333V 450 Vdc source on Hi DC bus
1 ia 2 vemfa
1.80m 2.20m 2.60m 3.00m 3.40mtime in seconds
-200
-100
0
100
200
vem
fa in
vol
ts
-8.00
-4.00
0
4.00
8.00
ia in
am
pere
sP
lot1
12
NASA/CR—2010-215673 50

Generator Mode Simulation @ 1050 Hz 30A +/- 5A Switch Points on Phase IGBTs I leg = 22.9 Arms, 15.85 kW out Phase-Phase Vpk = 583V 760 Vdc sink on Hi DC bus Sensorless Generator operation viable “speed-loop” winding added for redundancy
1 ia 2 vemfa 8 vswa
1.00m 1.20m 1.40m 1.60m 1.80mtime in seconds
-40.0
-20.0
0
20.0
40.0
-400
-200
0
200
400
vem
fa in
vol
ts
-40.0
-20.0
0
20.0
40.0
ia in
am
pere
sP
lot1
Figure 57: Generating Mode Simulation The buck-boost converter simulation is used to predict operating waveforms and also size components. The converter uses an inductor to store energy for the boost operation. The simulation also identifies the proper DC bus capacitor size for load step simulation. The boost mode is used at low power to motor the shaft to approximately half speed. The simulation is performed at the predicted power and speed level for cold startup operation. After the unit is motored to half speed, heat can be applied and the machine will operate from a power consumer to a power supplier. The buck simulation is performed at full power. The buck simulator takes the rectified high voltage and converts it to regulated 120 VDC low-voltage. The specification dictates 6% DC bus ripple maximum (120 +/- 6 VDC). The simulation identified the minimum bus capacitance to satisfy the specification. No load step specification was supplied, however, a larger than necessary capacitor was added to allow 50% load drop testing to be performed. Figure 58 shows the boost mode simulation while Figure 59 shows the buck mode simulation.
vsw
a in
vol
ts
128
NASA/CR—2010-215673 51

Boost Mode Simulation 12.5 +/- 7.5 Switch Points on Lo IGBT 125 Vdc source on Lo DC bus 135 ohm load on Hi DC bus @ 450 Vdc I Hi = 3.5 A, I Lo = 12.5 A 1.58 kW in, 1.56 kW out, Total loss = 1.27%
Figure 58: Boost Mode Simulation
1 i_dc_hi 2 i_dc_lo 11 vdc_hi 12 vdc_lo
1.60m 1.80m 2.00m 2.20m 2.40mtime in seconds
100
200
300
400
500
vdc_
hi in
vol
ts
-30.0
-20.0
-10.0
0
10.0
i_dc
_lo,
i_dc
_hi i
n am
pere
sP
lot1
11
1
2
vdc_
lo,
12
NASA/CR—2010-215673 52

Buck Mode Simulation 100A +/- 10A Switch Points on Hi IGBT 760 Vdc source on Hi DC bus 1.2 ohm load on low DC bus @ 120.3 Vdc I Hi = 16.6 A, I Lo = 100 A 12.55 kW in, 12.03 kW out, Total loss = 4.1%
Figure 59: Buck Mode Simulation
10. Power Converter The power converter consists of the TAC, NaK Heater, Recuperator, and a Gas Cooler. Two types of NaK heaters were assembled into a converter. A shell tube NaK heater and a plate fin NaK heater. The shell tube NaK heater power converter was larger and heavier than the plate fin exchanger. The shell tube NaK heater design was supplied by a company with molten salt heat exchanger experience, while the plate fin was design was supplied by a company without NaK experience. The plate fin NaK exchanger construction is much more compact and lightweight and was also identified and proposed during in the 1960’s and 1970’s SNAP reactor program. Regardless of the pedigree of the heat exchanger manufacturer, the design of the NaK exchanger should use the knowledge base generated from the SNAP reactor program relative to materials of construction. The performance and construction risk is regarded as less important than the risk of a structural failure and subsequent leak. From this standpoint, the fixed tube sheet exchanger with multiple tube welds is more risky than a brazed and welded plate-fin heat exchanger.
1 i_dc_hi 2 i_dc_lo 3 vdc_hi 4 vdc_lo
4.10m 4.30m 4.50m 4.70m 4.90mtime in seconds
-100
0
100
200
300
i_dc
_hi,
i_dc
_lo
in a
mpe
res
100
300
500
700
900
vdc_
hi in
vol
tsP
lot1
3
21
vdc_
lo,
4
NASA/CR—2010-215673 53
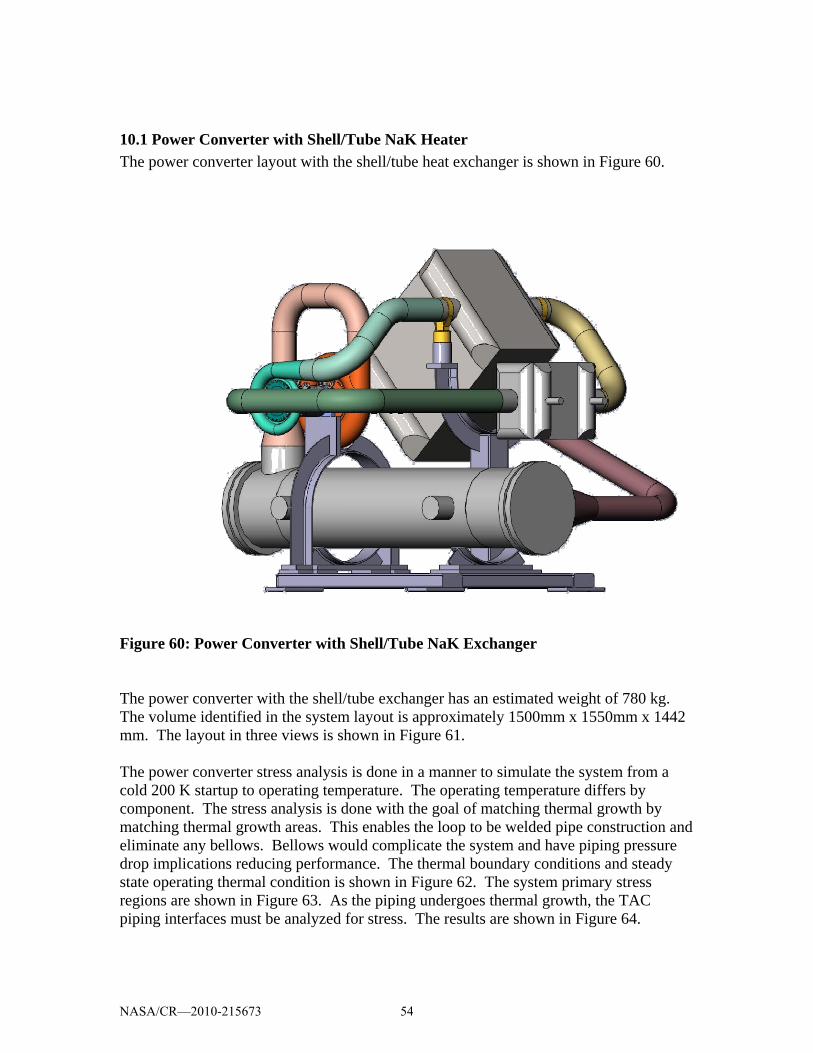
10.1 Power Converter with Shell/Tube NaK Heater The power converter layout with the shell/tube heat exchanger is shown in Figure 60.
Figure 60: Power Converter with Shell/Tube NaK Exchanger The power converter with the shell/tube exchanger has an estimated weight of 780 kg. The volume identified in the system layout is approximately 1500mm x 1550mm x 1442 mm. The layout in three views is shown in Figure 61. The power converter stress analysis is done in a manner to simulate the system from a cold 200 K startup to operating temperature. The operating temperature differs by component. The stress analysis is done with the goal of matching thermal growth by matching thermal growth areas. This enables the loop to be welded pipe construction and eliminate any bellows. Bellows would complicate the system and have piping pressure drop implications reducing performance. The thermal boundary conditions and steady state operating thermal condition is shown in Figure 62. The system primary stress regions are shown in Figure 63. As the piping undergoes thermal growth, the TAC piping interfaces must be analyzed for stress. The results are shown in Figure 64.
NASA/CR—2010-215673 54

1500mm x 1550mm Complete System LayoutTube Shell Nak Heater
1422mm height
Figure 61: Power Converter for Shell/Tube, Three Views
NASA/CR—2010-215673 55

Figure 62: Static Thermal Conditions for Shell/Tube Power Converter System
• Analyzed via steady-state thermal analysis (assumed slow thermal ramp from cold initial condition)
• Forced Convection (5887 W/m2C) applied to piping (simulates internal flow)
Convection (W/m2-C)
Static - Stress in Piping due to Weight & Thermal Growth Shell/Tube Heat Exchanger System
145 MPa
152 MPa
IN625 at 841 K:Fty = 283 MPa
• Structural Analysis (Thermal Loads + Weight) of 3D Shell Model – Materials, thicknesses,
component stiffness’ representative of full 3D model
– Max piping load = 152 MPa
(FSy = 1.86)
• Forces & Moments calculated at Turbomachinery nozzle interfaces
Figure 63: Shell Tube Stress Regions
NASA/CR—2010-215673 56

Figure 64: Piping Interface Loads on TAC
Max Stress: 159 MPa
Stress (Pa)
Turbine Housing
Turbine Inlet
IN718 at 839 K
• Su = 1089 MPa
• Sy = 910 MPa FS = 5.7
Compressor Inlet
Compressor Housing
Max Stress: (55 MPa)
IN625 at 436 K
• Su = 772 MPa
• Sy = 338 MPa FS = 6.1
10.2 Power Converter with Plate/Fin NaK Heater The power converter designed with the plate fin heat exchanger is more compact and more importantly has considerably less weight. The overall dimensions are approximately 1200mm x 1200mm x 1200mm with an overall weight estimate of 260 kg. The isometric solid model of the power converter is shown in Figure 65. A three view of the same configuration is shown in Figure 66.
NASA/CR—2010-215673 57

Recuperator
Nak Exchanger
Turbo-AlternatorCompressor
Gas Cooler
Figure 65: Power Converter with Plate/Fin NaK Heater
Complete System Layout Plate Fin NaK Exchanger~260 kg estimated weightInconel 625 for Hot and Cold Side Piping
Water In/Out
NaK In/Out
Top View
Side View Back View 1200mm tall
1200mm x1200mm top view envelope
Figure 66: Power Converter Three View with Plate/Fin NaK Heat Exchanger
NASA/CR—2010-215673 58

The thermal model is constructed in the same manner as the shell/tube heat exchanger. The boundary conditions are supplied to distribute the temperature in a manner that reflects the actual operation, Figure 67. The thermal information is used to find the thermal stresses for the power converter, Figure 68. The thermal stresses for the converter focused on the TAC result in Inconel 625 being used for the piping to avoid bellows. The TAC compressor and turbine also use Inconel to allow high stress safety factor, Figure 69.
Figure 67: Plate/Fin Power Converter Thermal Analysis
Convection (W/m2-C)
T (oC) • Analyzed via steady-state thermal analysis
(assumed slow thermal ramp from cold initial condition)
• Forced Convection (5887 W/m2C) applied to piping (simulates internal flow)
• Assumed perfectly insulated exterior
= 841 K
= 386 K
NASA/CR—2010-215673 59

• Structural Analysis (Thermal Loads + Weight) of 3D Shell Model
Figure 68: Plate/Fin Power Converter Stress Results
Figure 69: Plate/Fin Power Converter TAC Resultant Stress Results
– Materials, thicknesses, component stiffness’ representative of full 3D model
– Max piping load = 103 MPa (FS = 2.7)
– Max (Compressor Exit) Nozzle load = 207 MPa
• Forces & Moments calculated at Turbomachinery nozzle interfaces
– Applied to 3D Compressor / Turbine Models
207 MPa 41 MPa
103 MPa
41 MPa
StressIN625 at 841 K:Fty = 283 MPa (Pa)
Compressor Housing Turbine HousingStress (Pa)
In625 at 436 K
• Su = 772 MPa
• Sy = 338 MPa Max stress = 172 MPa
IN718 at 839 K
• Su = 1089 MPa
• Sy = 910 MPa Max stress = 103 MPa FSyt = 8.8 FSyt = 1.96
Stress (Pa)
Max Stress: 103 MPa
Max Stress: 172 MPa
NASA/CR—2010-215673 60

The power converter ideally is insulated for the thermal vacuum environment. The insulation considered is multi-layer insulation. A very conservative method of calculation and the results are outlined in Figure 70. It indicates that 30-50 layers of MLI would be sufficient to minimize the radiated heat loss to a low level. The analysis considers the entire surface of the hot side of the loop as a black body radiating to the environment and does not consider the benefit of the radiation effect from the cold side of the equipment.
Radiation loss from NAK HX
0
2
4
6
8
10
12
14
16
0 10 20 30 40 50
MLI layers
Pow
er L
oss
(kW
)
0
10
20
30
40
50
60
70
80
90
100
Perc
ent o
f 12
kW e
lect
rical
out
put
Heat Loss(kW)
Percent ofElectricOutput (12kW)
Assumptions:1) NAK HX is a blackbody 2) MLI Layers are blackbodies3) Each layer of MLI reflects half of its incident radiation back at the NAK HX4) 200 K Surroundings
Figure 70: Insulation Analysis
11. Control Console and Data Acquisition, and Fill System
11.1 Control Console and Data Acquisition The data control console operates the power converter and also functions as a data acquisition system. The control is set up on a programmable logic controller that is FPGA based and manufactured by National Instruments. The data control console is programmed using National Instruments LabVIEW software. The control console is programmed as a state machine. It has a startup mode, operating mode, shutdown mode, and fault handling mode. The control console has a graphical interface as shown in Figure 71. All of the pertinent pressure and temperature measurements are acquired, displayed and stored. The NaK pump and water pump could also be controlled using this as a master system controller. The control console communicates and controls the TAC power controller and monitors the health and fault status of all aspects of the power converter. Strip chart displays, both fixed and customizable are supplied, Figure 72.
NASA/CR—2010-215673 61

Figure 71: Control Console Screen Example
Figure 72: Strip Chart Recording Example
NASA/CR—2010-215673 62

11.2 Fill System The fill system is used to control the gas fill for the Brayton system. The diagram (Figure 73) shows the major components for this system. A vacuum pump is supplied to evacuate the power converter prior to gas fill. The system is filled with a standard CO2 gas bottle. It is supplied with a regulator and valves for flexible operation, either manual evacuation and fill, or automated through the control console.
Figure 73: Fill System Diagram and Equipment List
12. Summary A set of prioritized goals were given in the specification. The design as presented is reviewed against these published goals.
• Close relevance to future flight designs, including the potential for 8 year service life
The power converter, as designed, is very similar to other existing power generation systems that have been designed by Barber-Nichols Inc. and others. The foil bearing
NASA/CR—2010-215673 63

TAC type systems have shown to have very high reliability and life in excess of 80,000 hours. • Credible development path and maturation approach exist to achieve TRL 6
by FY 2012 with a reasonable cost • Low development cost and risk
The technology is mature and can be applied to the unique specification for the power converter. The temperatures and power level have led to a very conservative design that can be achieved with an easy development path with reasonable cost. No distinct technology challenges exist that need to be developed.
• Design extensible to Mars (materials and design strategies compatible with
mars environment)
The equipment and materials used in this equipment are all stainless steel construction. The compatibility with the Mars environment should be robust.
• High thermal-to-electric efficiency
The power converter system strives to achieve over 18% thermal to electric efficiency. This is a high efficiency for a 12 kWe Brayton Cycle power converter with the specified high and low temperature range.
• Minimum complexity
The power converter complexity is low. Only a single moving part is used. The design is derived from highly reliable air-cycle type machinery used in commercial aviation.
• Low mass and volume
The system at 260 kg is within the boundaries of prior space based power systems in terms of kg/kWe. The system was designed to be compact and fit in a cube of 1.2 m size
• Close relevance to future flight designs, including the potential for 8 year
service life
The design is similar to other Brayton Cycle power conversion systems that have been proposed in the past. The 8 year life has been considered in this design and is considered low-risk.
NASA/CR—2010-215673 64
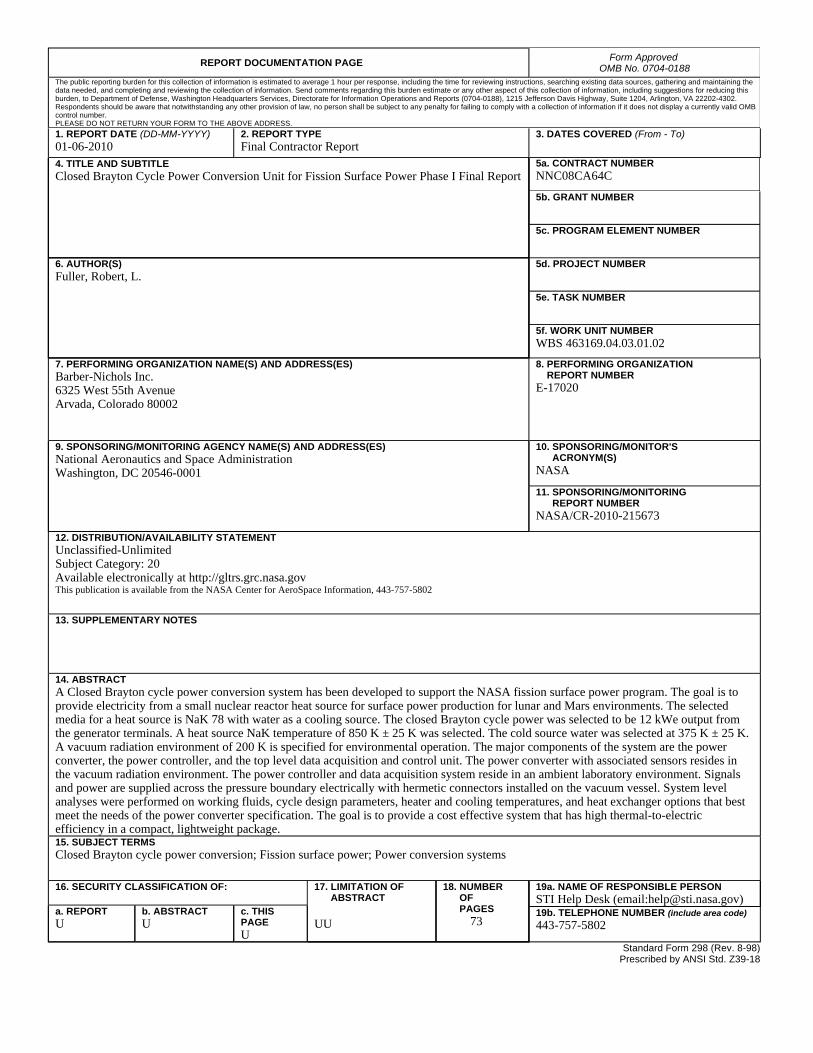
REPORT DOCUMENTATION PAGE Form Approved OMB No. 0704-0188
The public reporting burden for this collection of information is estimated to average 1 hour per response, including the time for reviewing instructions, searching existing data sources, gathering and maintaining the data needed, and completing and reviewing the collection of information. Send comments regarding this burden estimate or any other aspect of this collection of information, including suggestions for reducing this burden, to Department of Defense, Washington Headquarters Services, Directorate for Information Operations and Reports (0704-0188), 1215 Jefferson Davis Highway, Suite 1204, Arlington, VA 22202-4302. Respondents should be aware that notwithstanding any other provision of law, no person shall be subject to any penalty for failing to comply with a collection of information if it does not display a currently valid OMB control number. PLEASE DO NOT RETURN YOUR FORM TO THE ABOVE ADDRESS. 1. REPORT DATE (DD-MM-YYYY) 01-06-2010
2. REPORT TYPE Final Contractor Report
3. DATES COVERED (From - To)
4. TITLE AND SUBTITLE Closed Brayton Cycle Power Conversion Unit for Fission Surface Power Phase I Final Report
5a. CONTRACT NUMBER NNC08CA64C
5b. GRANT NUMBER
5c. PROGRAM ELEMENT NUMBER
6. AUTHOR(S) Fuller, Robert, L.
5d. PROJECT NUMBER
5e. TASK NUMBER
5f. WORK UNIT NUMBER WBS 463169.04.03.01.02
7. PERFORMING ORGANIZATION NAME(S) AND ADDRESS(ES) Barber-Nichols Inc. 6325 West 55th Avenue Arvada, Colorado 80002
8. PERFORMING ORGANIZATION REPORT NUMBER E-17020
9. SPONSORING/MONITORING AGENCY NAME(S) AND ADDRESS(ES) National Aeronautics and Space Administration Washington, DC 20546-0001
10. SPONSORING/MONITOR'S ACRONYM(S) NASA
11. SPONSORING/MONITORING REPORT NUMBER NASA/CR-2010-215673
12. DISTRIBUTION/AVAILABILITY STATEMENT Unclassified-Unlimited Subject Category: 20 Available electronically at http://gltrs.grc.nasa.gov This publication is available from the NASA Center for AeroSpace Information, 443-757-5802
13. SUPPLEMENTARY NOTES
14. ABSTRACT A Closed Brayton cycle power conversion system has been developed to support the NASA fission surface power program. The goal is to provide electricity from a small nuclear reactor heat source for surface power production for lunar and Mars environments. The selected media for a heat source is NaK 78 with water as a cooling source. The closed Brayton cycle power was selected to be 12 kWe output from the generator terminals. A heat source NaK temperature of 850 K ± 25 K was selected. The cold source water was selected at 375 K ± 25 K. A vacuum radiation environment of 200 K is specified for environmental operation. The major components of the system are the power converter, the power controller, and the top level data acquisition and control unit. The power converter with associated sensors resides in the vacuum radiation environment. The power controller and data acquisition system reside in an ambient laboratory environment. Signals and power are supplied across the pressure boundary electrically with hermetic connectors installed on the vacuum vessel. System level analyses were performed on working fluids, cycle design parameters, heater and cooling temperatures, and heat exchanger options that best meet the needs of the power converter specification. The goal is to provide a cost effective system that has high thermal-to-electric efficiency in a compact, lightweight package. 15. SUBJECT TERMS Closed Brayton cycle power conversion; Fission surface power; Power conversion systems
16. SECURITY CLASSIFICATION OF: 17. LIMITATION OF ABSTRACT UU
18. NUMBER OF PAGES
73
19a. NAME OF RESPONSIBLE PERSON STI Help Desk (email:[email protected])
a. REPORT U
b. ABSTRACT U
c. THIS PAGE U
19b. TELEPHONE NUMBER (include area code) 443-757-5802
Standard Form 298 (Rev. 8-98)Prescribed by ANSI Std. Z39-18

