clorox at the_eastern_ergonomics_conference_jun_23_2005
TRANSCRIPT

Data-Driven Proactive Office Ergonomics: Clorox Case Study
Presented to:Eastern Ergonomics Conference & Exposition
June 23, 2005
by Douglas R. Matkins, Health & Safety Manager, Clorox Technical Center, Pleasanton, CA
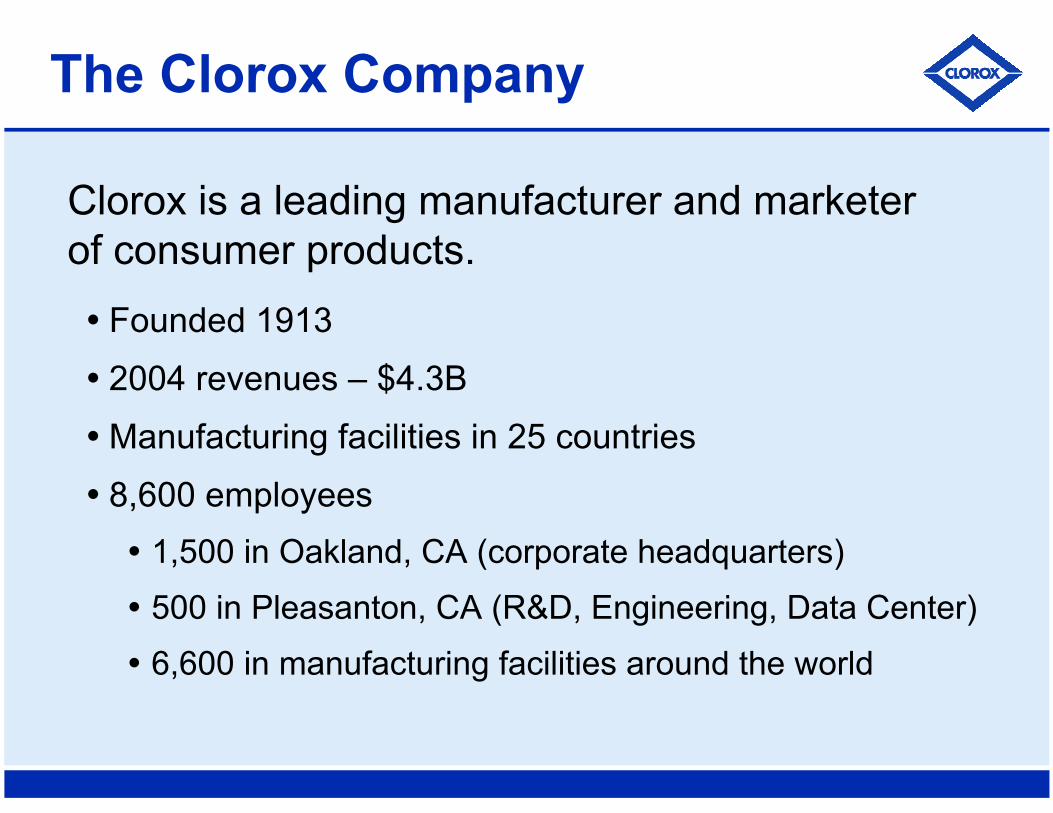
The Clorox Company
Founded 1913
2004 revenues – $4.3B
Manufacturing facilities in 25 countries
8,600 employees1,500 in Oakland, CA (corporate headquarters)
500 in Pleasanton, CA (R&D, Engineering, Data Center)
6,600 in manufacturing facilities around the world
Clorox is a leading manufacturer and marketer of consumer products.
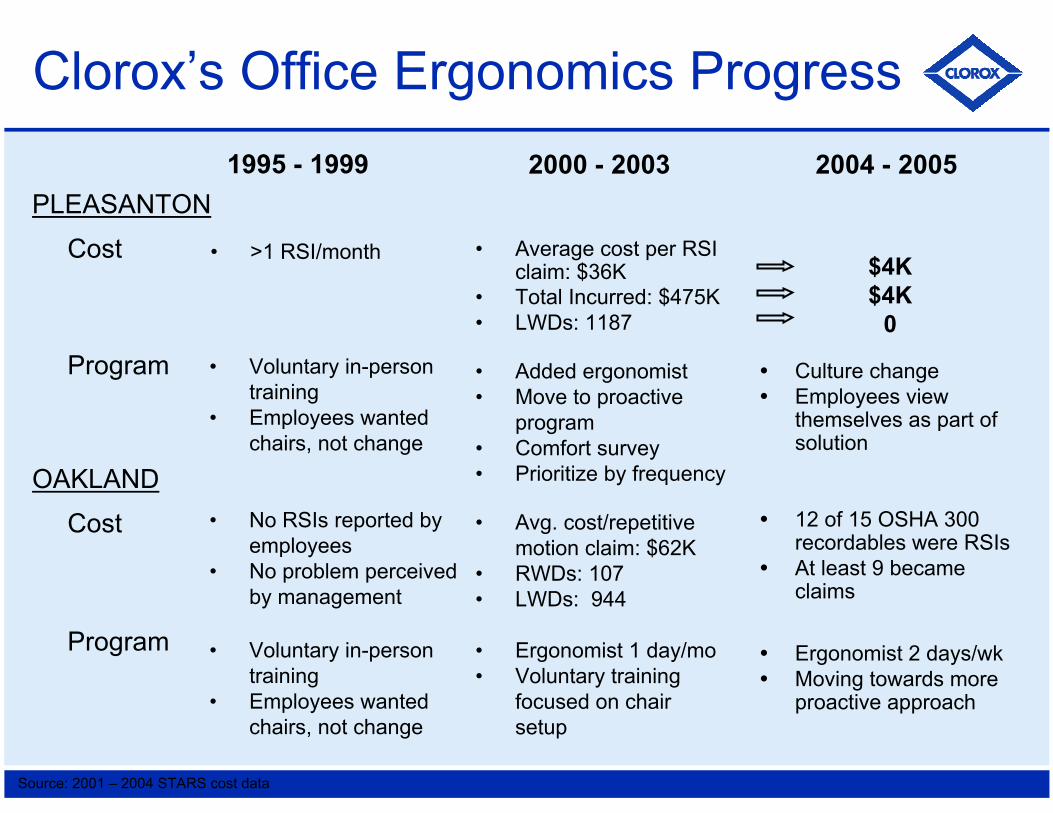
Clorox’s Office Ergonomics Progress
$4K$4K
0
Culture changeEmployees view themselves as part of solution
12 of 15 OSHA 300 recordables were RSIsAt least 9 became claims
Ergonomist 2 days/wkMoving towards more proactive approach
PLEASANTON1995 - 1999 2000 - 2003 2004 - 2005
Source: 2001 – 2004 STARS cost data
OAKLAND
Program
Cost
Cost
Program
• Average cost per RSI claim: $36K
• Total Incurred: $475K• LWDs: 1187
• Added ergonomist• Move to proactive
program• Comfort survey• Prioritize by frequency
• Avg. cost/repetitive motion claim: $62K
• RWDs: 107• LWDs: 944
• Ergonomist 1 day/mo• Voluntary training
focused on chair setup
• Voluntary in-person training
• Employees wanted chairs, not change
• No RSIs reported by employees
• No problem perceived by management
• Voluntary in-person training
• Employees wanted chairs, not change
• >1 RSI/month
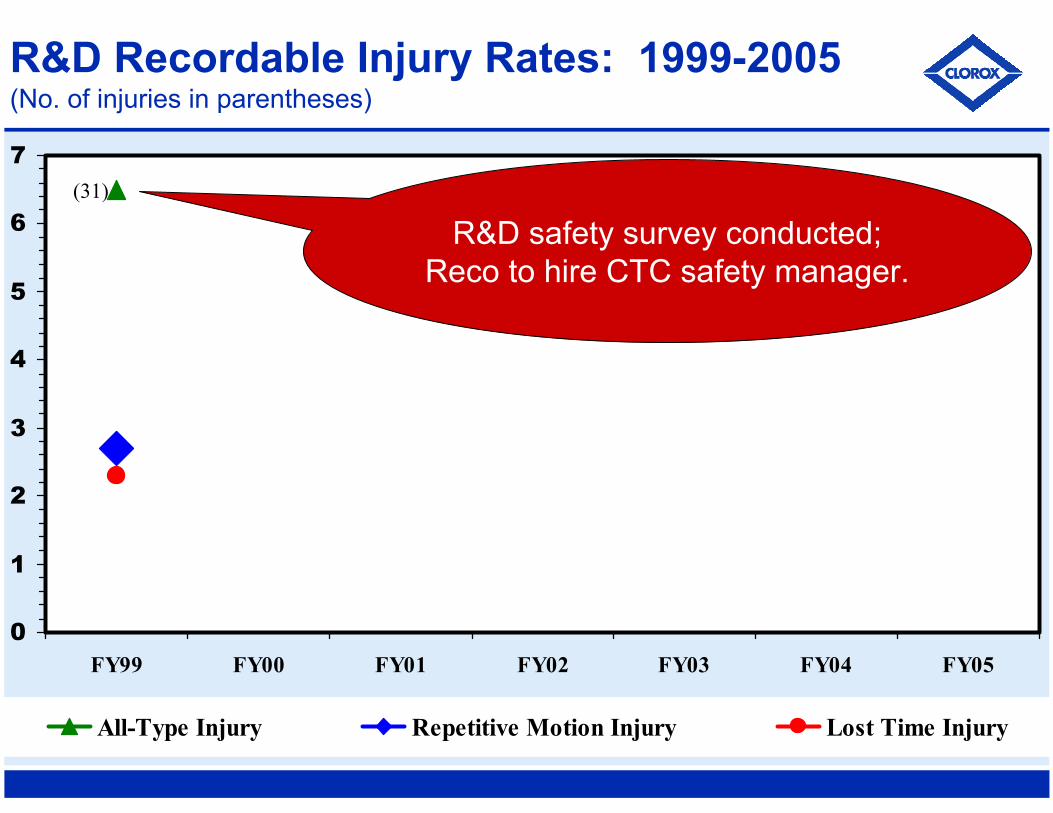
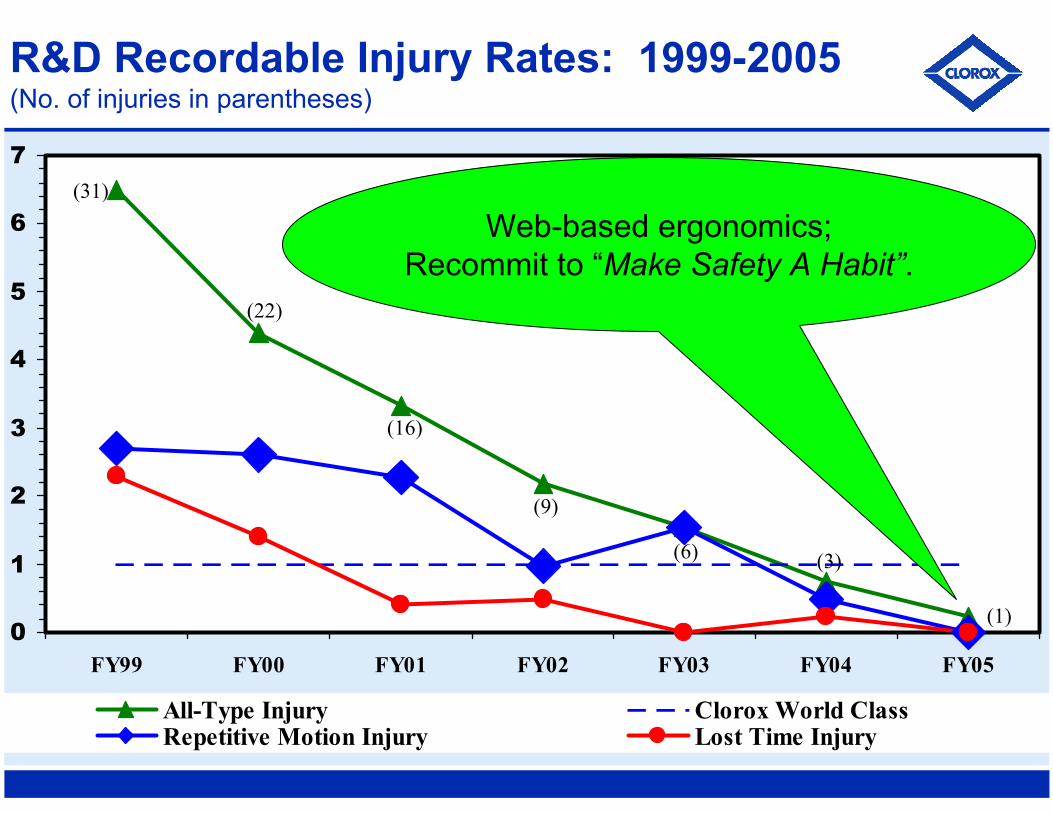
R&D Recordable Injury Rates: 1999-2005(No. of injuries in parentheses)
0
1
2
3
4
5
6
7
FY99 FY00 FY01 FY02 FY03 FY04 FY05
All-Type Injury Repetitive Motion Injury Lost Time Injury
(31)
R&D safety survey conducted;Reco to hire CTC safety manager.
0
1
2
3
4
5
6
7
FY99 FY00 FY01 FY02 FY03 FY04 FY05
All-Type Injury Industry Avg Repetitive Motion Injury Lost Time Injury
(31)
(22)
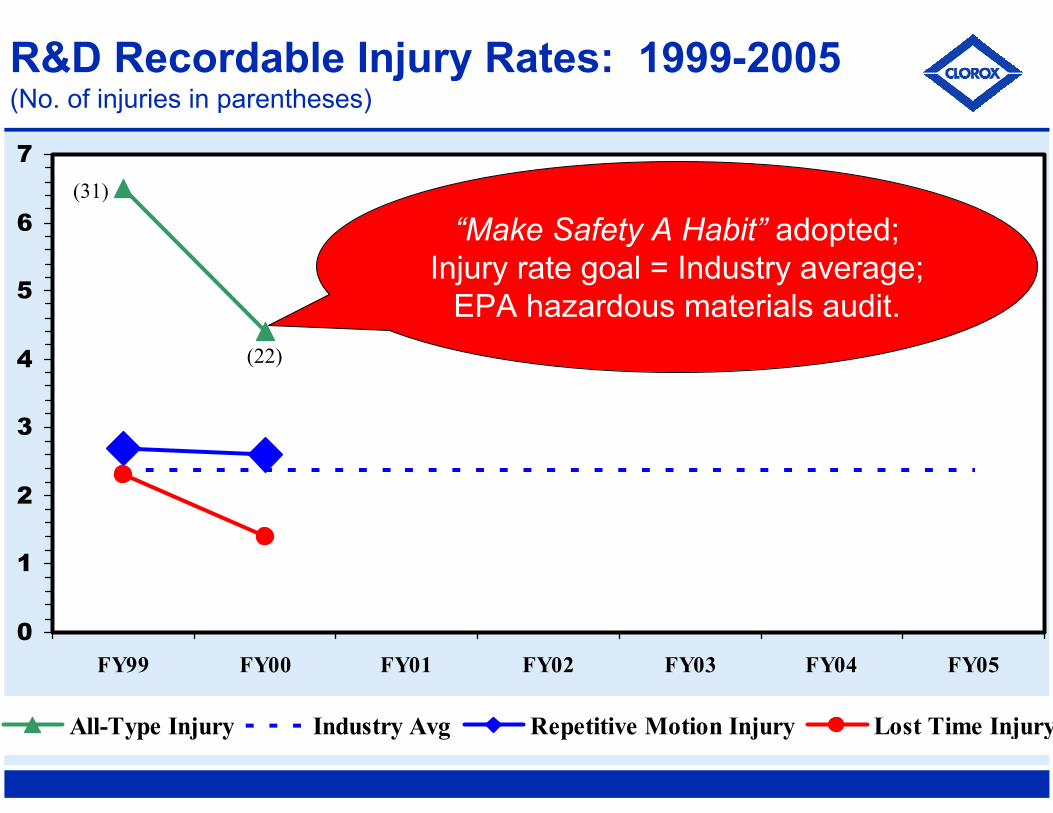
R&D Recordable Injury Rates: 1999-2005(No. of injuries in parentheses)
“Make Safety A Habit” adopted;Injury rate goal = Industry average;
EPA hazardous materials audit.
0
1
2
3
4
5
6
7
FY99 FY00 FY01 FY02 FY03 FY04 FY05
All-Type Injury Industry Avg Repetitive Motion Injury Lost Time Injury
(31)
(16)
(22)
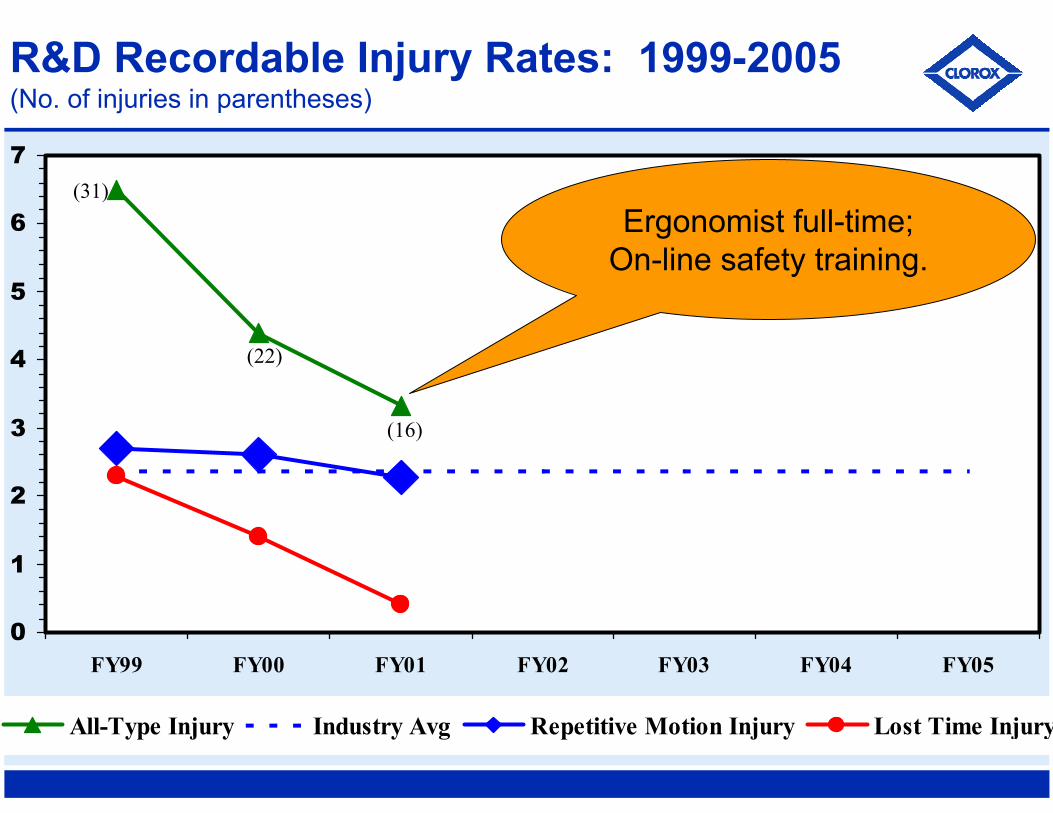
R&D Recordable Injury Rates: 1999-2005(No. of injuries in parentheses)
Ergonomist full-time;On-line safety training.
0
1
2
3
4
5
6
7
FY99 FY00 FY01 FY02 FY03 FY04 FY05
All-Type Injury Industry Avg Repetitive Motion Injury Lost Time Injury
(31)
(16)
(9)
(22)
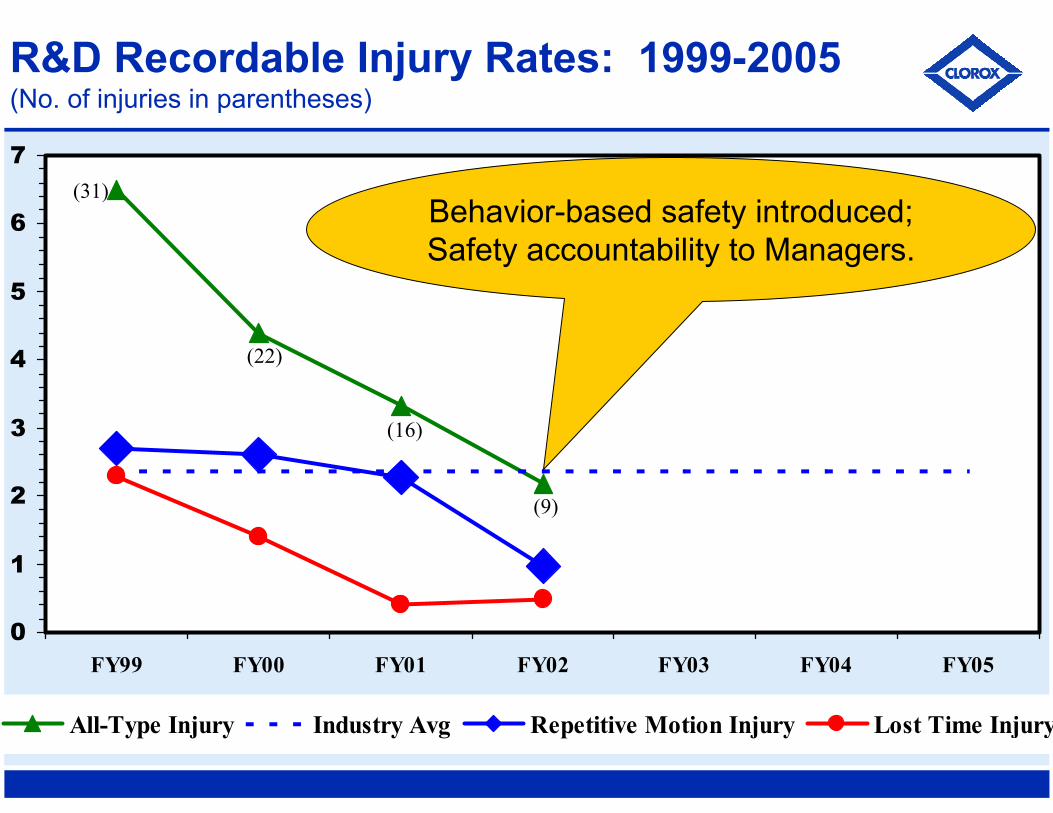
R&D Recordable Injury Rates: 1999-2005(No. of injuries in parentheses)
Behavior-based safety introduced;Safety accountability to Managers.

0
1
2
3
4
5
6
7
FY99 FY00 FY01 FY02 FY03 FY04 FY05
All-Type Injury Clorox World Class Industry BenchmarkRepetitive Motion Injury Lost Time Injury
(31)
(16)
(9)
(6)
(22)
R&D Recordable Injury Rates: 1999-2005(No. of injuries in parentheses)
Dept safety reps appointed;Injury rate goal = “World Class”.
0
1
2
3
4
5
6
7
FY99 FY00 FY01 FY02 FY03 FY04 FY05
All-Type Injury Clorox World ClassRepetitive Motion Injury Lost Time Injury
(31)
(9)
(6)(3)
(22)
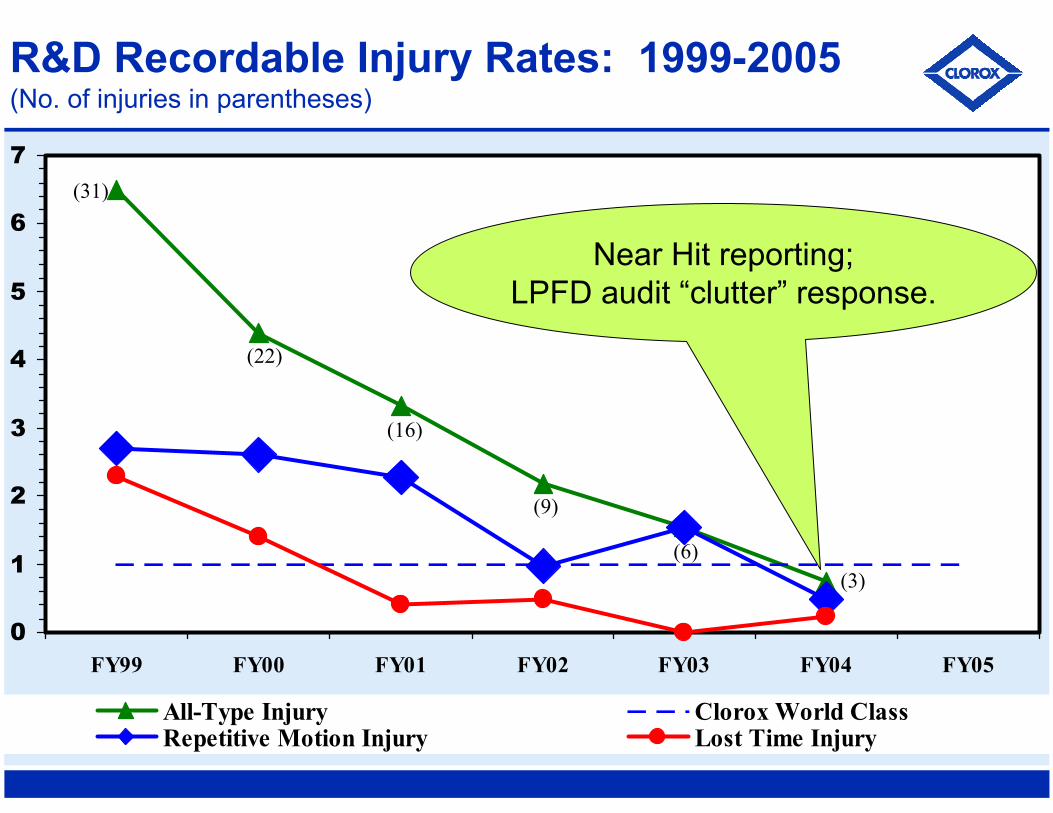
R&D Recordable Injury Rates: 1999-2005(No. of injuries in parentheses)
Near Hit reporting;LPFD audit “clutter” response.
(16)
0
1
2
3
4
5
6
7
FY99 FY00 FY01 FY02 FY03 FY04 FY05
All-Type Injury Clorox World ClassRepetitive Motion Injury Lost Time Injury
(31)
(16)
(9)
(6) (3)
(1)
(22)
R&D Recordable Injury Rates: 1999-2005(No. of injuries in parentheses)
Web-based ergonomics;Recommit to “Make Safety A Habit”.
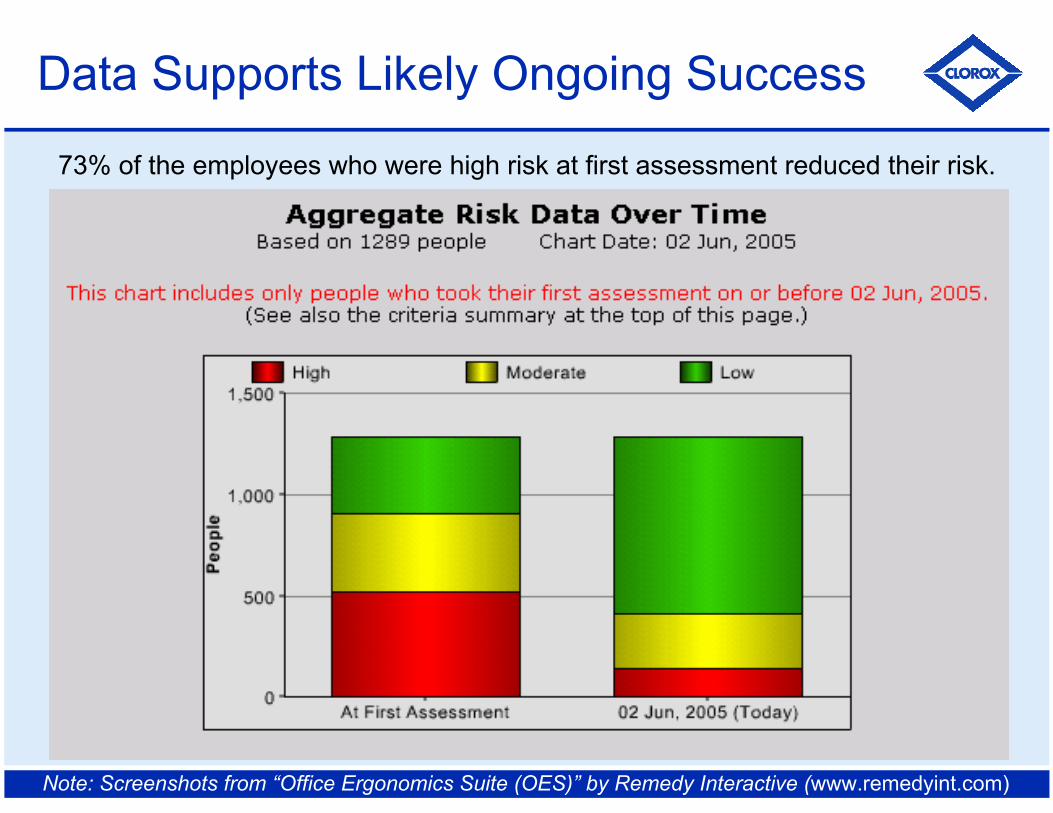
Data Supports Likely Ongoing Success
73% of the employees who were high risk at first assessment reduced their risk.
Note: Screenshots from “Office Ergonomics Suite (OES)” by Remedy Interactive (www.remedyint.com)

Learnings: 3 Critical Success Factors (CSF)
CSFs
#1 Obtain and Use Data: The Foundation• To define problem• To allocate resources• To measure progress • To obtain management buy-in (CSF)• To enable personalized follow up (CSF)
#3 Personal Feedback to Employees• To empower change
#2 Management Buy-In• From risk mgmt for budget/support• From VPs for “sponsorship”• From H&S leaders for
implementation support • From supervisors/mgrs
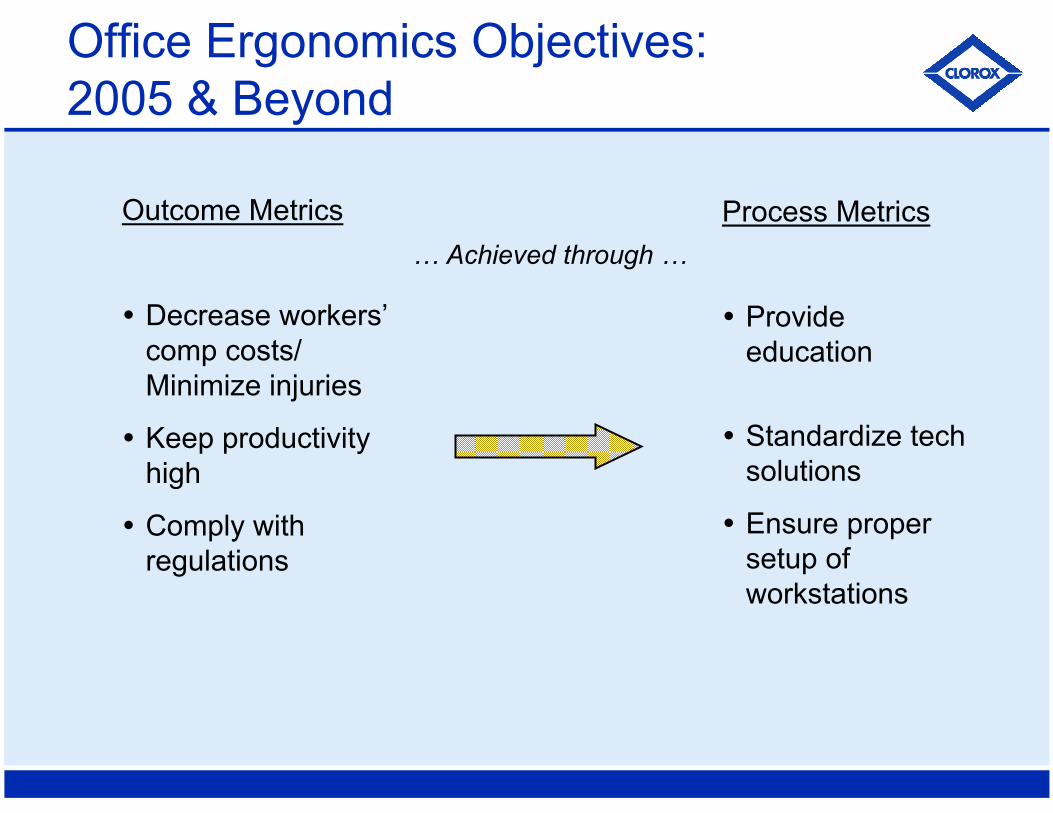
Office Ergonomics Objectives: 2005 & Beyond
Outcome Metrics
Decrease workers’comp costs/ Minimize injuries
Keep productivity high
Comply with regulations
Process Metrics
Provide education
Standardize tech solutions
Ensure proper setup of workstations
… Achieved through …
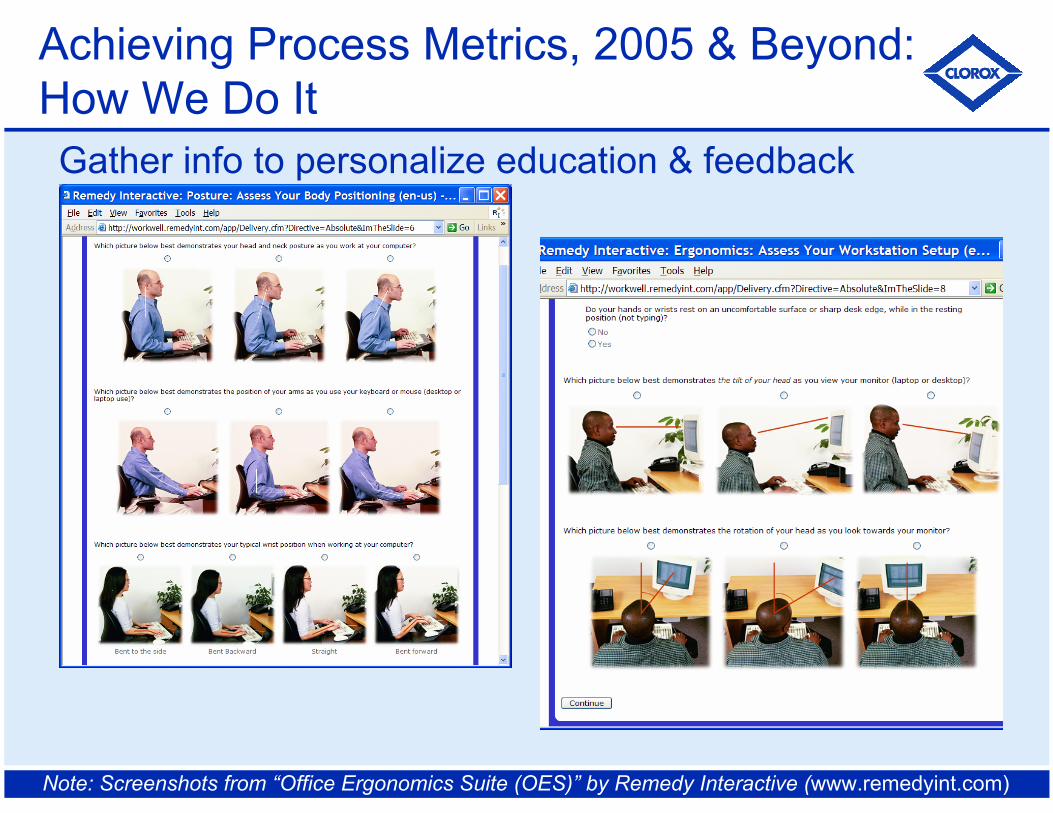
Gather info to personalize education & feedback
Achieving Process Metrics, 2005 & Beyond: How We Do It
Note: Screenshots from “Office Ergonomics Suite (OES)” by Remedy Interactive (www.remedyint.com)
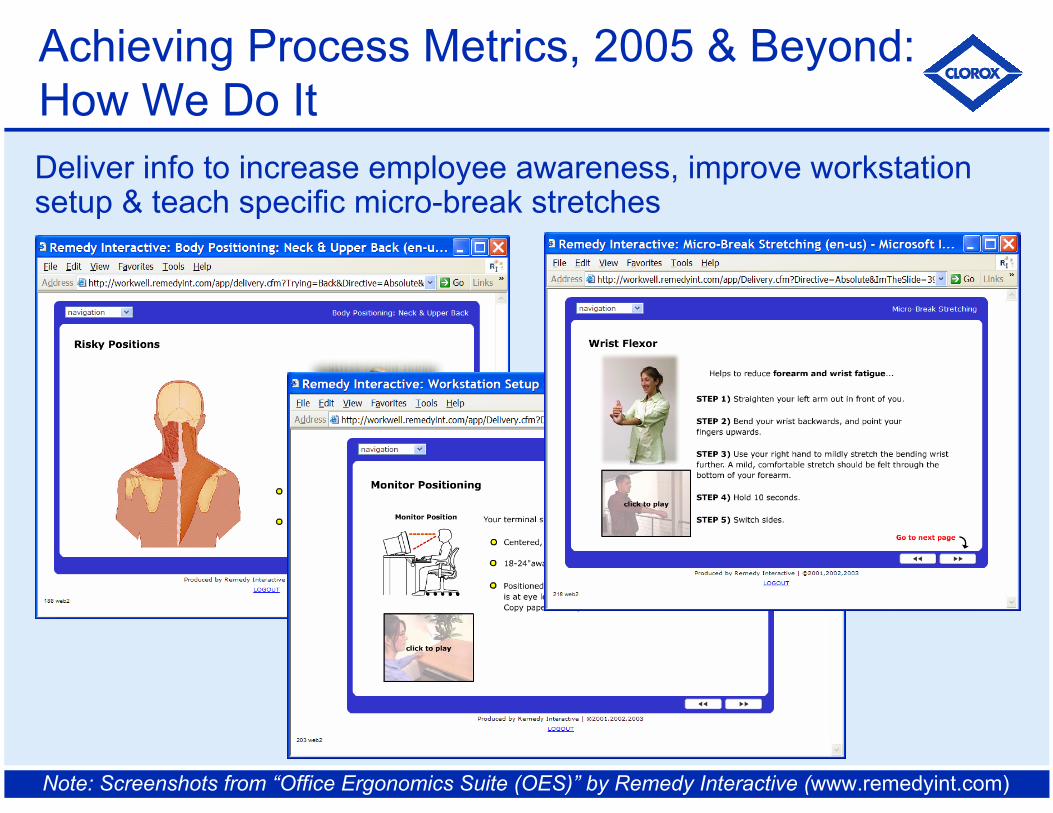
Deliver info to increase employee awareness, improve workstationsetup & teach specific micro-break stretches
Achieving Process Metrics, 2005 & Beyond: How We Do It
Note: Screenshots from “Office Ergonomics Suite (OES)” by Remedy Interactive (www.remedyint.com)
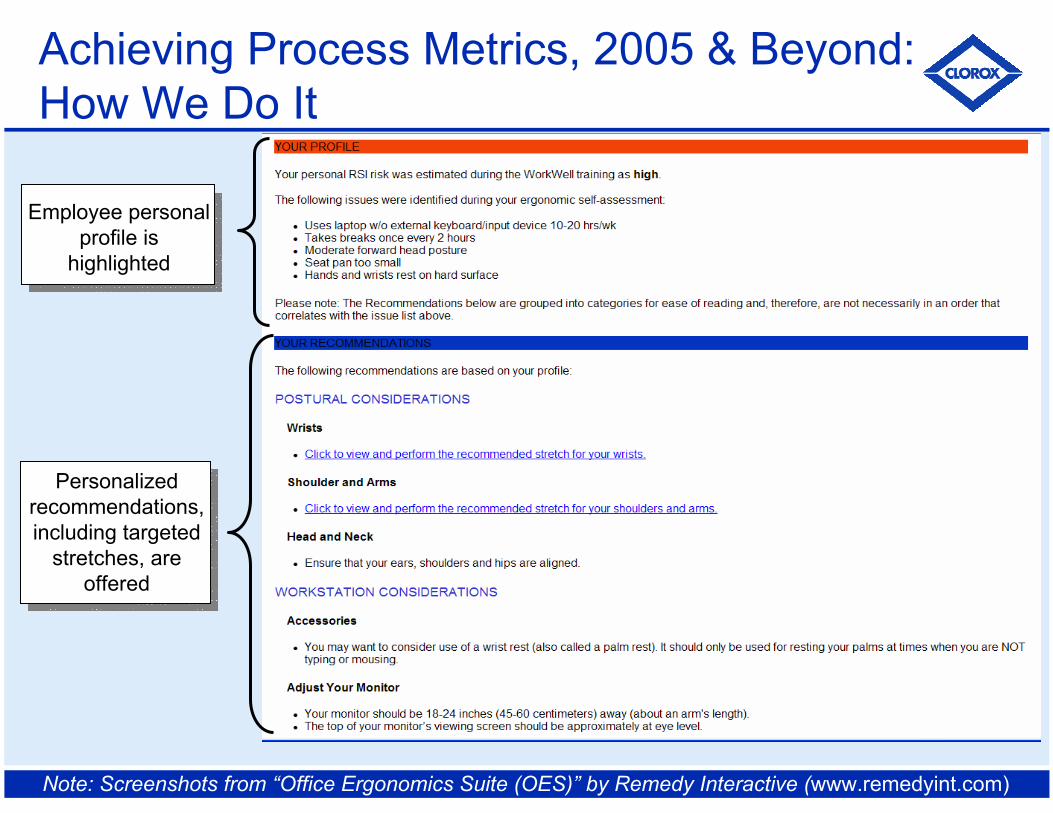
Employee personal profile is
highlighted
Personalized recommendations, including targeted
stretches, are offered
Achieving Process Metrics, 2005 & Beyond: How We Do It
Note: Screenshots from “Office Ergonomics Suite (OES)” by Remedy Interactive (www.remedyint.com)
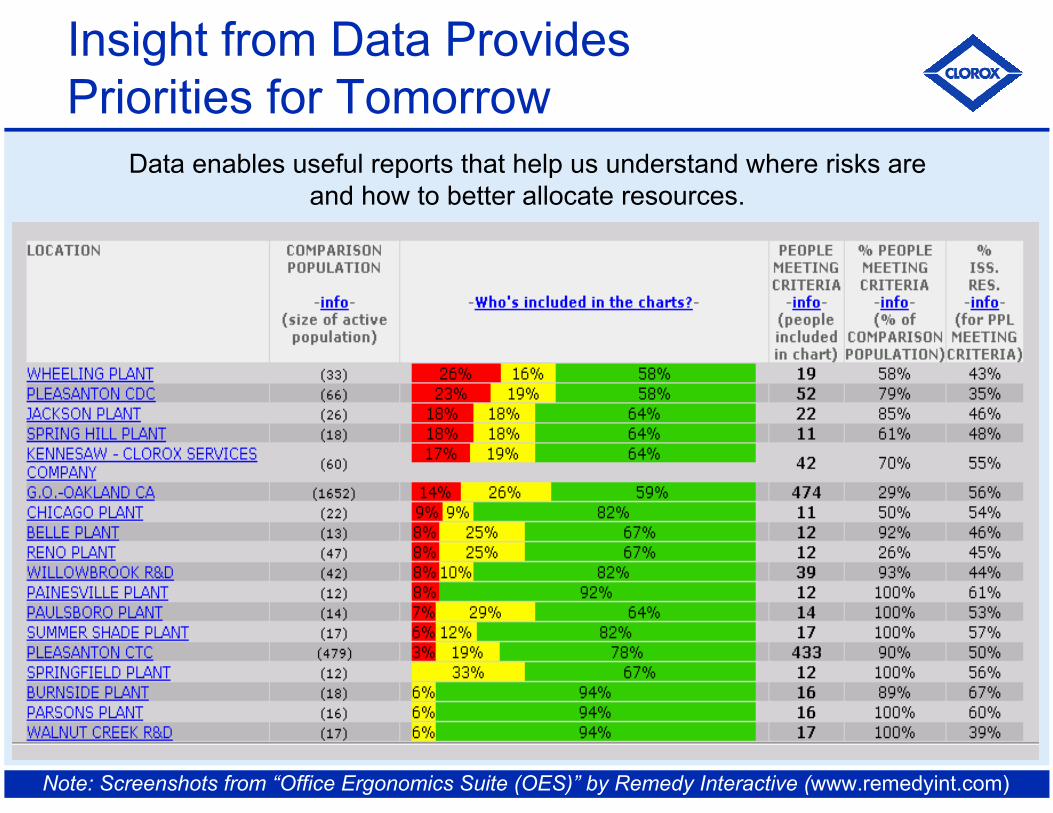
Insight from Data Provides Priorities for Tomorrow
Data enables useful reports that help us understand where risks are and how to better allocate resources.
Note: Screenshots from “Office Ergonomics Suite (OES)” by Remedy Interactive (www.remedyint.com)
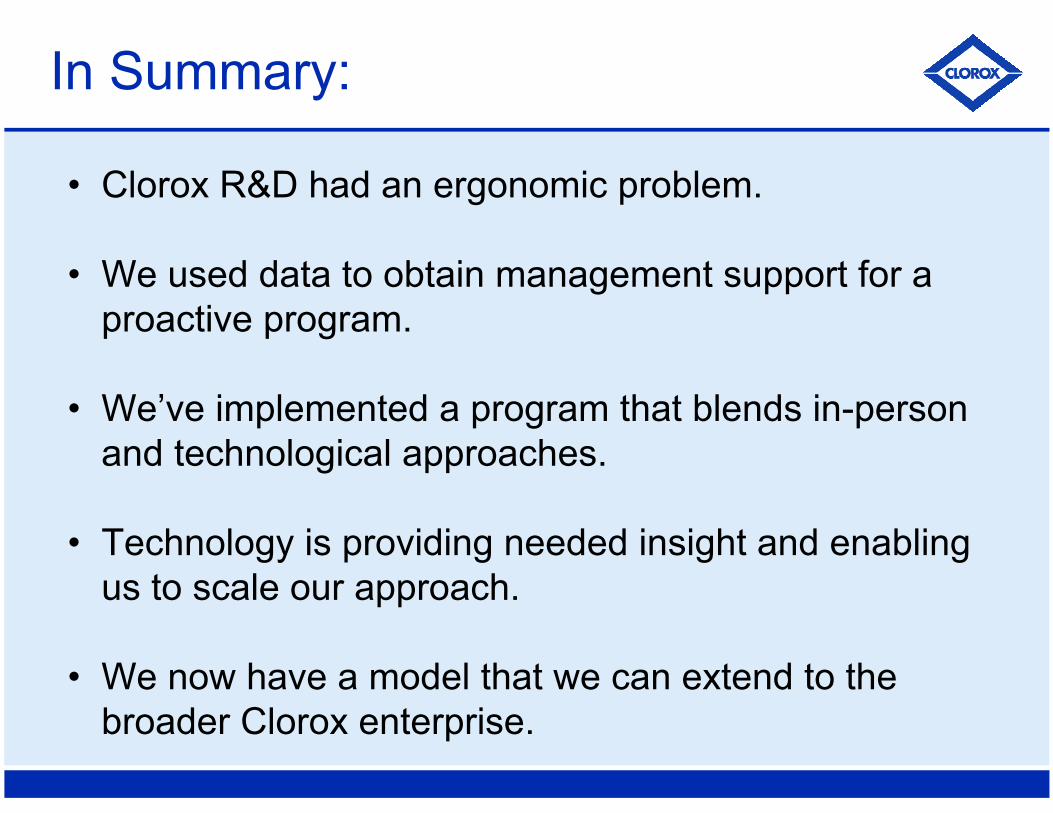
In Summary:
• Clorox R&D had an ergonomic problem.
• We used data to obtain management support for a proactive program.
• We’ve implemented a program that blends in-person and technological approaches.
• Technology is providing needed insight and enabling us to scale our approach.
• We now have a model that we can extend to the broader Clorox enterprise.