climograph: a graph that shows average precipitation and...
TRANSCRIPT

climograph: a graph that showsaverage precipitation andtemperature for a place
cals.arizona.edu
desert: land with little rainfall
Amargosa desert.jpg
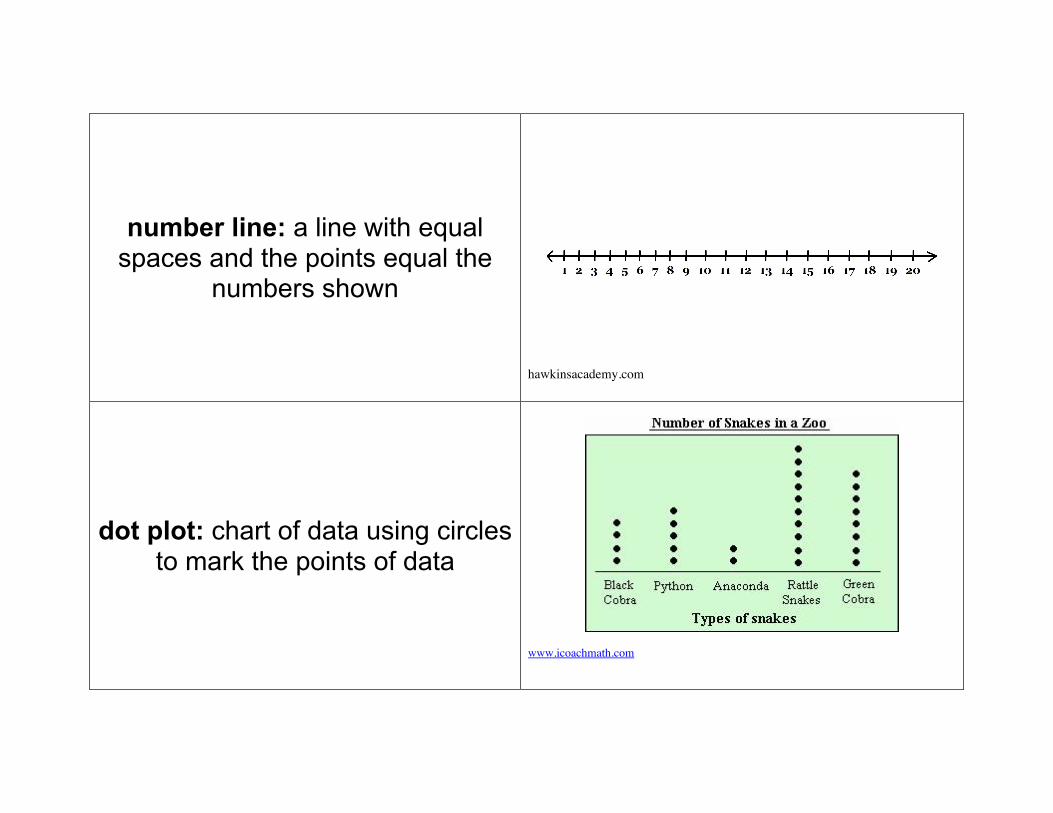
number line: a line with equalspaces and the points equal the
numbers shown
hawkinsacademy.com
dot plot: chart of data using circlesto mark the points of data
www.icoachmath.com
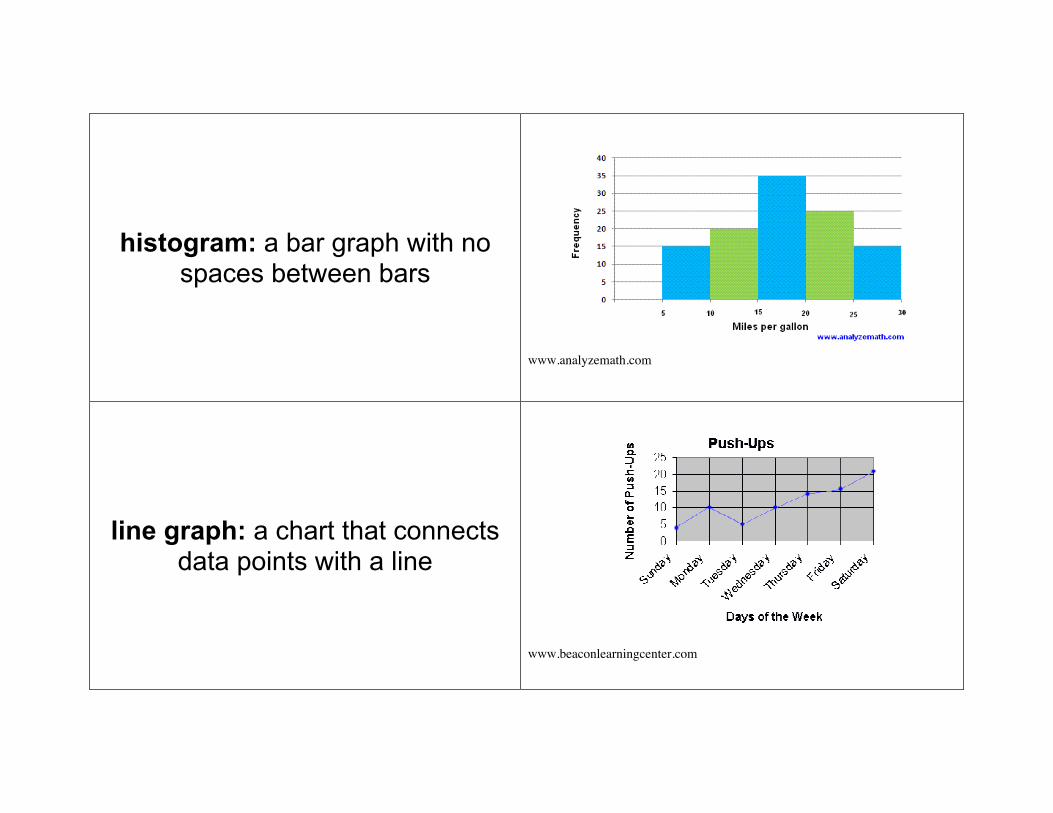
histogram: a bar graph with nospaces between bars
www.analyzemath.com
line graph: a chart that connectsdata points with a line
www.beaconlearningcenter.com
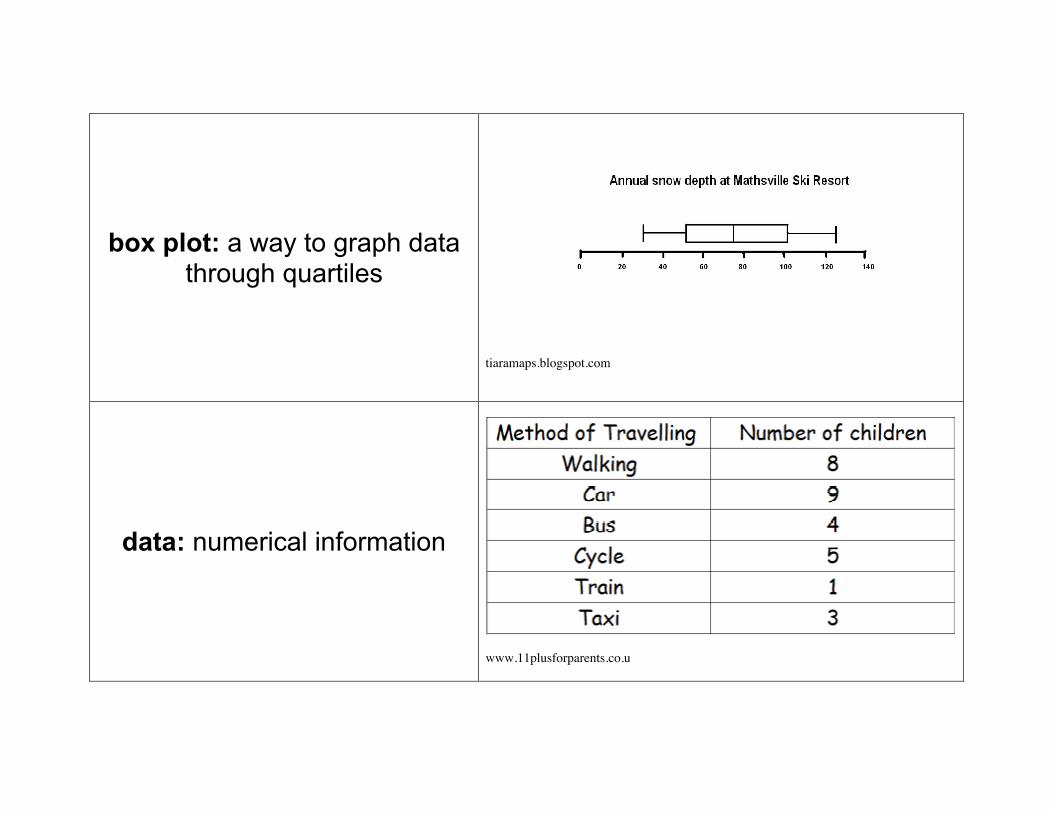
box plot: a way to graph datathrough quartiles
tiaramaps.blogspot.com
data: numerical information
www.11plusforparents.co.u