climatic cange and health
TRANSCRIPT

Climatic changes
AndHealth
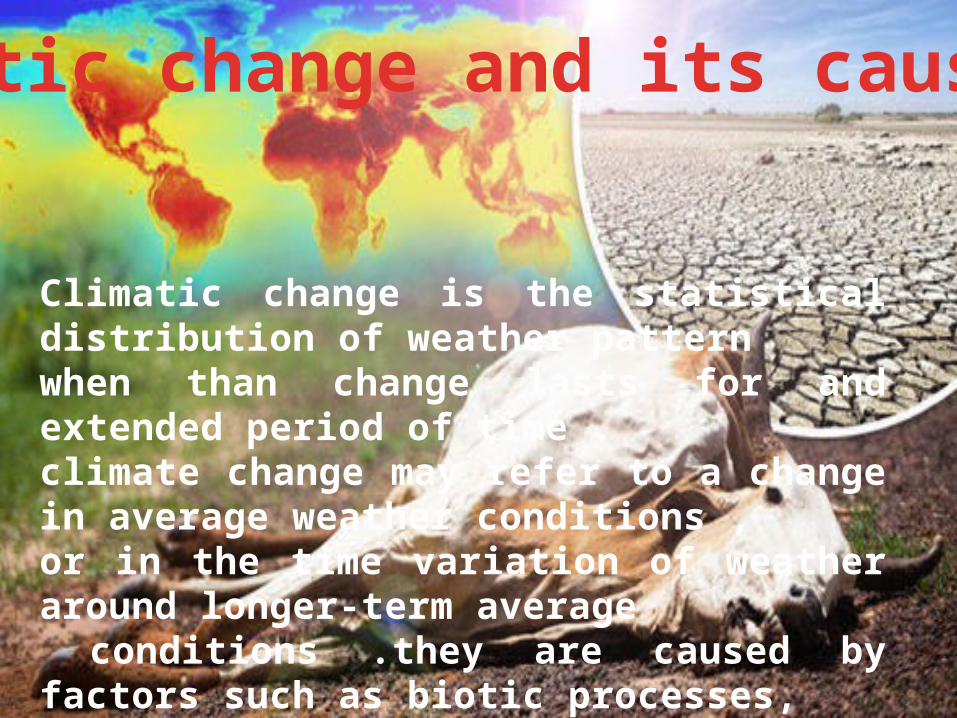
Climatic change is the statistical distribution of weather patternwhen than change lasts for and extended period of time .climate change may refer to a change in average weather conditions ,or in the time variation of weather around longer-term average conditions .they are caused by factors such as biotic processes, variations eruptions, certain human activities have also been identified as often climatic change often referred to as “global warming”.
Climatic change and its causes

Global warming and climate change are terms for the observed century-scale rise in the average temperature of the Earth's climate system and its related effects.Multiple lines of scientific evidence show that the climate system is warming. Although the increase of near-surface atmospheric temperature is the measure of global warming often reported in the popular press, most of the additional energy stored in the climate system since 1970 has gone into ocean warming. The remainder has melted ice and warmed the continents and atmosphere. Many of the observed changes since the 1950s are unprecedented over decades to millennia.The UNFCCC have adopted a range of policies designed to reduce greenhouse gas emissions and to assist in adaptation to global warming. Parties to the UNFCCC have agreed that deep cuts in emissions are required, and that future global warming should be limited to below 2.0 °C (3.6 °F) relative to the pre-industrial level.
GLOBAL WARMING

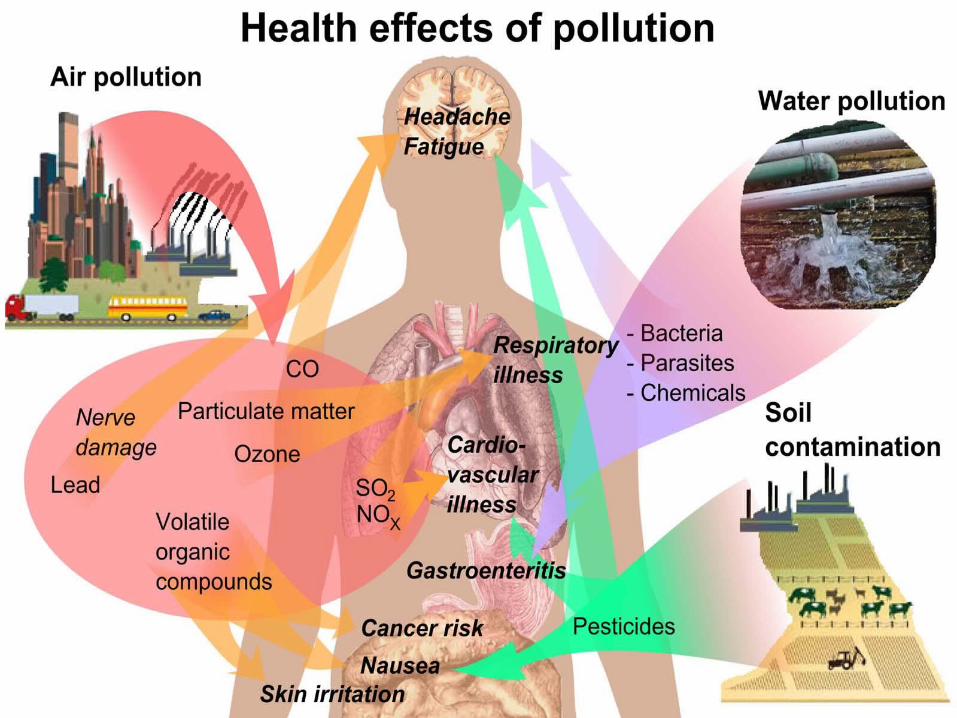
Kinds of health impacts resulting from climate change:
• Direct- result from weather extremes.• Consequences from ecological disruption.• Consequences resulting from climate-induced economic
disruption, e.g. traumatic, infectious, nutritional, psychological
• Changes in human health as a result of climate change will be indicated by alterations in geographic range and seasonality of infectious diseases.

CO2 ppm Temp
oC
1000 1100 1200 1300 1400 1500 1600 1700 1800 1900 2000
390
370
350
330
310
290
270
250
14.5
14.3
14.1
13.9
13.7
13.5
Correlation between atmospheric carbon dioxide concentration and Earth’s average surface temperature
Year
CO2concentration
Earth’s Temperature (background wobble due
to natural influences)
Graph from: Hanno, 2009

Climate Change: Health Impact Pathways
Physical systems(river flows, soil moisture, ocean temp)
Biologicalcycles, in nature … &
Ecological links/function
Economic/social impacts: infrastructure, farm/factory production, GDP growth, jobs, displacement
Human Health:• Injuries/deaths• Thermal stress
Indirect health impacts –ecologically mediated
Indirect health impacts – socially mediated
Direct impacts (extreme weather events, heatwaves, air pollutants, etc.)
• Infectious diseases• Under-nutrition• Mental stresses• Other disorders
Climate ChangeImpacts

Regions afflicted by problems due to environmental stresses: • population pressure • water shortage• climate change affecting crops • sea level rise • pre-existing hunger• armed conflict, current/recent
From UK Ministry of Defence
[May RM, 2007 Lowy Institute Lecture.Sydney]
Climate Change: Multiplier of Conflicts and Regional Tensions

Flo o d s
M a lar ia
D ia rr h oea
M a ln u tri tio n
02 04 06 08010 01 2 0 0 2 4 6 8 1 0
Deaths (thousands) DALYs (millions)
2000 2030
Deaths and DALYs attributable to Climate Change, 2000 & 2030Selected conditions in developing countries
WHO/McMichael,Campbell-Lendrum, Kovats et al, 2004
Now (2000)Future (2030)
Deaths Total Burden

Climate Change occurring faster than expected
IPCC’s Fourth Assessment Report (2007) now looks conservative [in addition to cautious review process]
Subsequent research shows increasing rates of: Global Greenhouse Gas emissions Ice melting (Arctic sea ice, Greenland/Antarctic ice-sheets, alpine glaciers)
Sea level riseAlso: Increasing saturation of carbon ‘sinks’ (land and oceans)
Estimated amount of carbon stored in permafrost = twice the atmospheric carbon
1m: half of Bangladesh rice fields2m: most of Mekong Delta

Climate Change and Health Research Tasks and Policy Foci
Human society: • Population size• Economic activity• Culture, governance
Human pressure on environment
Based on: McMichael et al., Brit med J, 2008
Adaptation: Reduce health impacts/risks
Human impacts: • Livelihoods• Social stability• Health
Health Co-benefits?
Unintended health effects
Mitigation of Climate Change: Reduce GHG
emissions
Climate - environmental changes, affecting:• Meteorological conditions• Water flows• Food yields• Physical (protective) buffers• Microbial activity• Extreme weather events
4
Risks to humans better
understood2
3Natural environmental
processes
1a-c
Need for local prevention

Photo-synthetic
activity
20o C 30o C 40o C
Food Yields: General Relationship of Temperature and
Photosynthesis
0%
100%
Example: Field & Lobell. Environmental Research Letters, 2007:
Globally averaged: +0.5oC reduces crop yields by 3-5%. So: +2oC would mean 12-20% fall in global grain production.
+2oC+2oC
Plus:• Flood
s, storms, fires
• Droughts – range, severity
• Pests• Disea
ses

Are the zones being pushed
south, by warming?
… and here?
Health Consequences?
Marked wet summer and dry winter
Wet summer and low winter rainfall
Uniform rainfall
Marked wet winter and dry summer
Low rainfallWet winter and low summer rainfall
AridWinter dominant Winter
Summer dominant Summer Uniform
Crucial for wheat-belt
Australia: Climate change, seasonal rainfall zones, farm yields, health impacts

Reducing Health Impacts of Climate Change … Health Co-Benefits as
‘bonus’Disease burden
Mitigation beginsemissions reduction (etc.)
Potential health
impact of climate
change
now 2050 2100
Health Co-Benefits (local/regional)Baseline burden
Health impact
averted by mitigationImpact
avoidance via adaptation

Model-fitted relationship of monthly Salmonellosis case counts in relation to monthly av. temperature in five
Australian cities, 1991-2001
0
10
20
30
40
50
60
70
80
90
100
9 10 11 12 13 14 15 16 17 18 19 20 21 22 23 24 25 26 27 28
Average MonthlyTemperature oC
Salm
onel
la c
ount Perth
Brisbane
Adelaide
MelbourneSydney
D’Souza et al., 2003


How to control it?• Use Fluorescent Light Bulbs• Switch Off Electric Appliances• Change Your Monitor with LCD• Don’t Leave Fridge’s door open for a Long Time• Uses of Solar Energy• Use Electric or Hybrid Car• Plant Trees At Home• Reduce Trash At Home• Save Clean Water • Avoid Lighting at Day Time • Make High Roofs• Get Your House Insulated• Reduce the Usage of Hot Water