climate variability and forecasting in the southeast u.s. david f. zierden center for...
TRANSCRIPT
Climate Variability and Forecasting in the Southeast U.S.
David F. Zierden
Center for Ocean-Atmospheric Prediction Studies
The Florida State University
Tallahassee, FL
Alabama Water Resources Conference
October 13, 2005
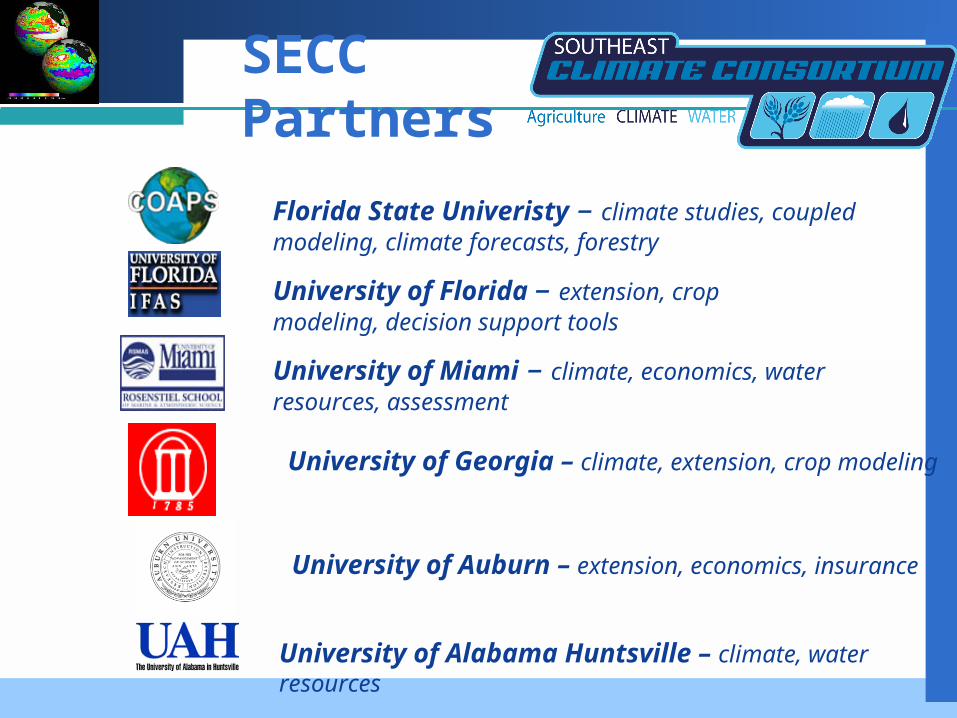
SECC Partners
Florida State Univeristy – climate studies, coupled modeling, climate forecasts, forestry
University of Florida – extension, crop modeling, decision support tools
University of Miami – climate, economics, water resources, assessment
University of Georgia – climate, extension, crop modeling
University of Auburn – extension, economics, insurance
University of Alabama Huntsville – climate, water resources
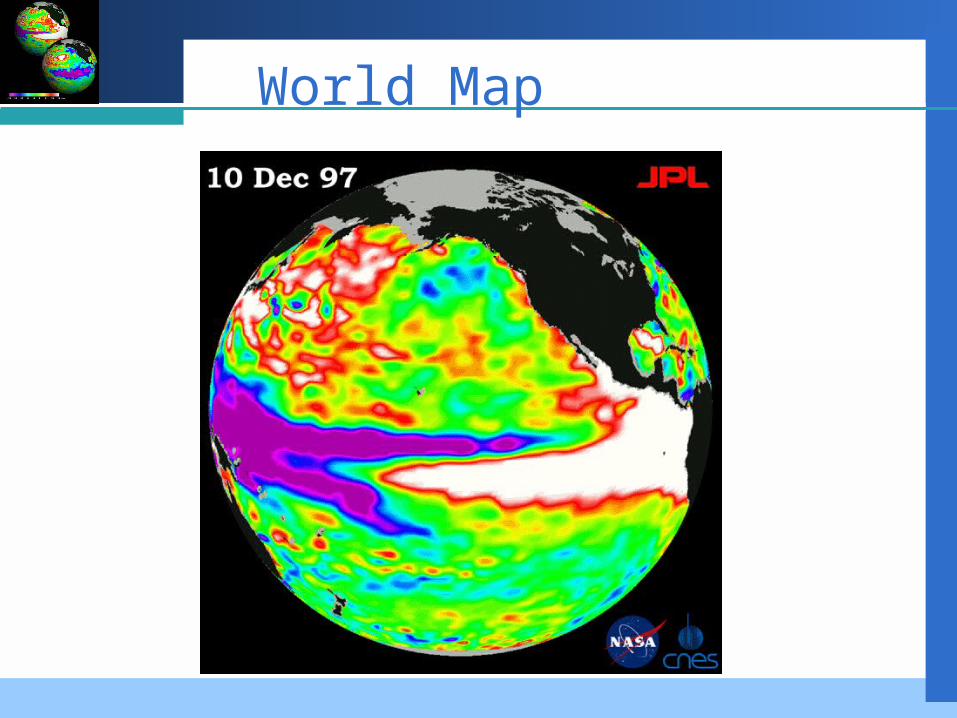
World Map
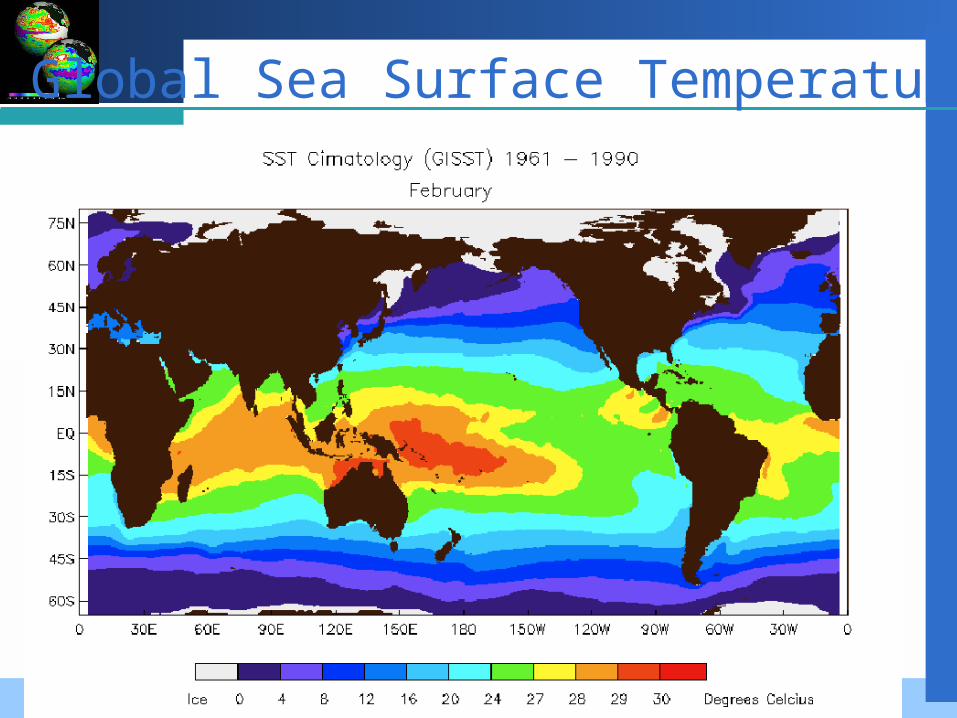
Global Sea Surface Temperatures
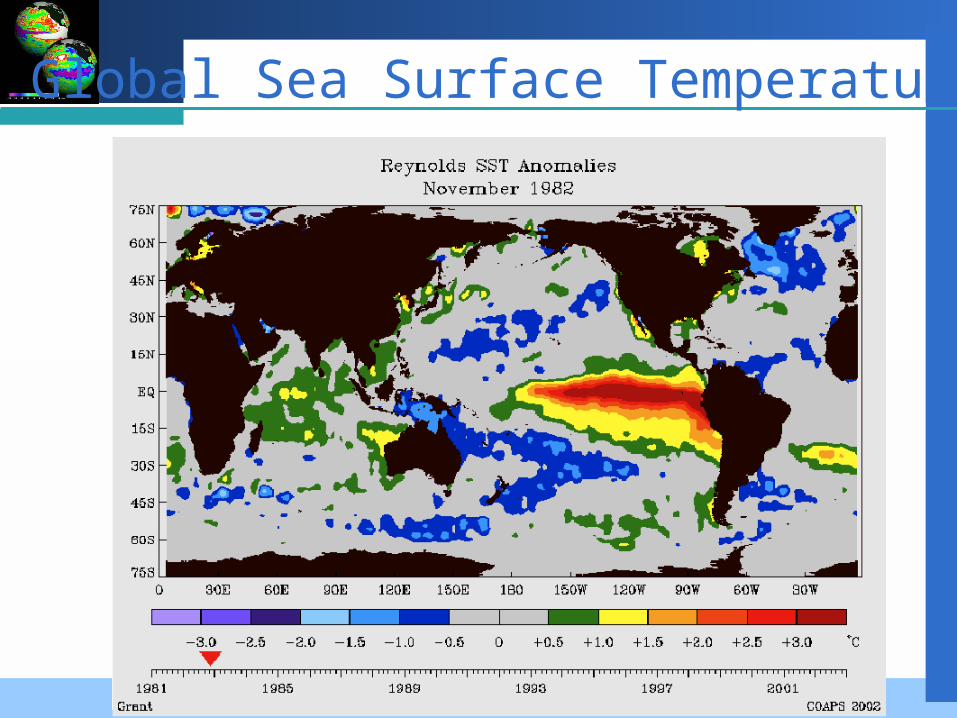
Global Sea Surface Temperatures
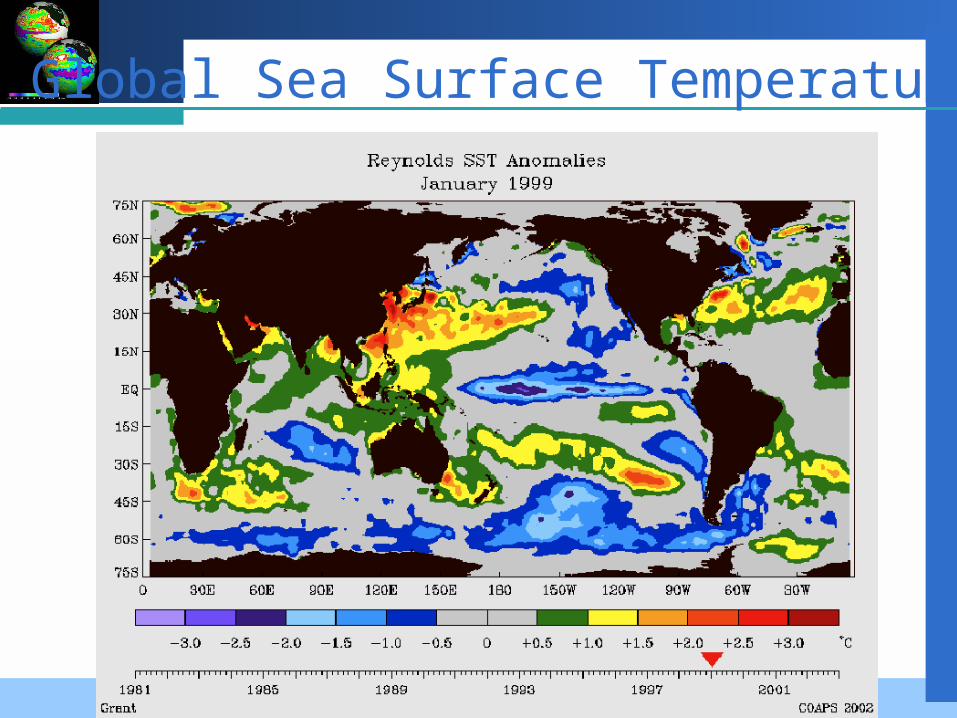
Global Sea Surface Temperatures
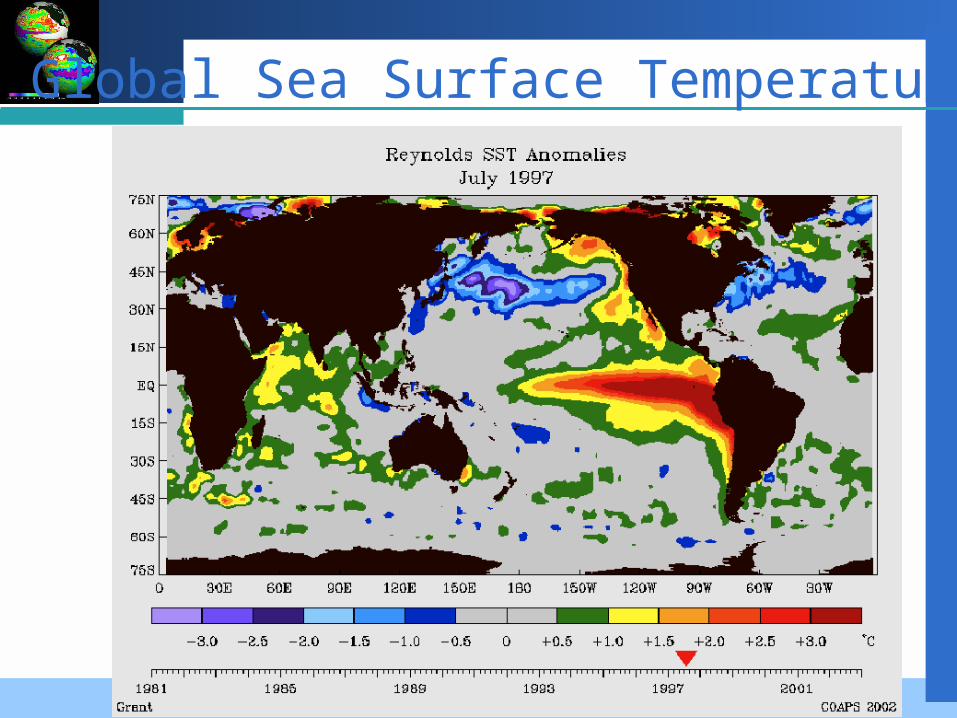
Global Sea Surface Temperatures
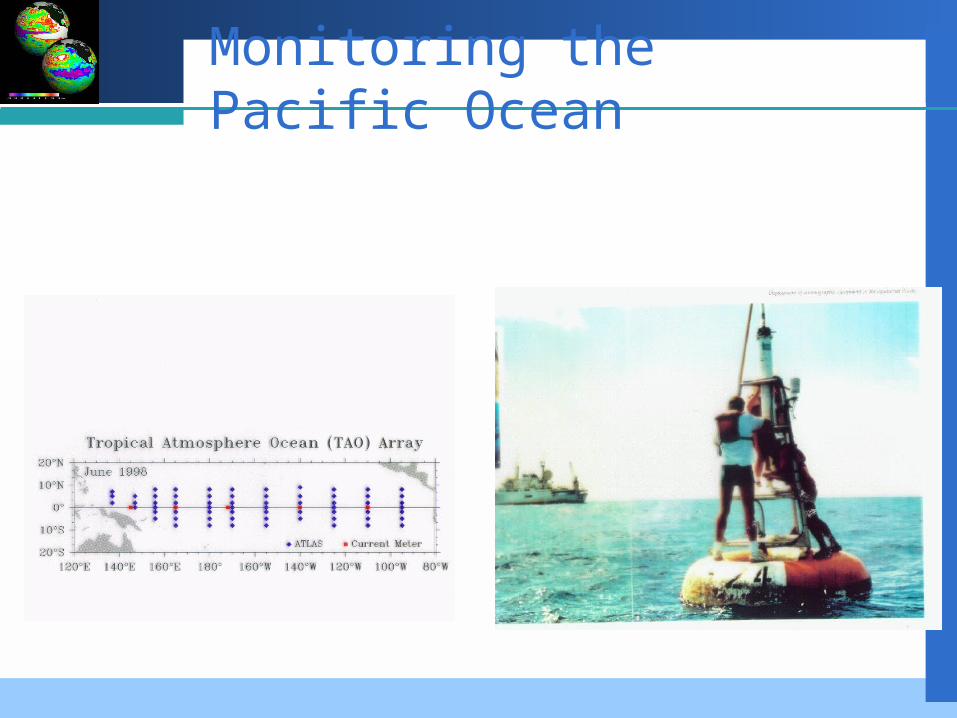
Monitoring the Pacific Ocean
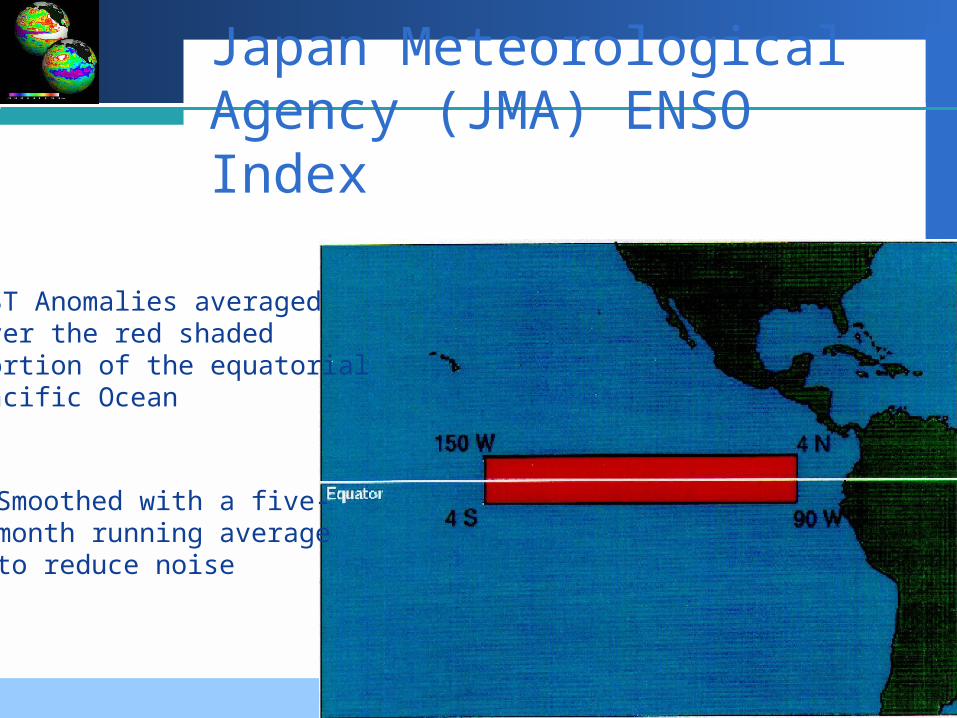
Japan Meteorological Agency (JMA) ENSO Index
SST Anomalies averagedover the red shaded portion of the equatorialPacific Ocean
Smoothed with a five-month running averageto reduce noise
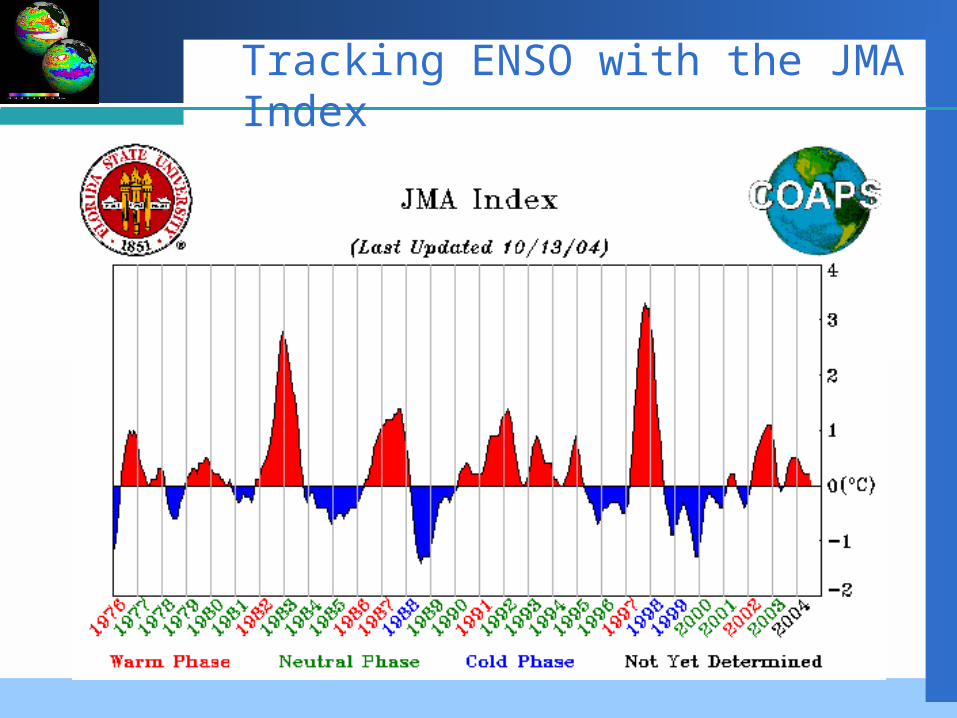
Tracking ENSO with the JMA Index
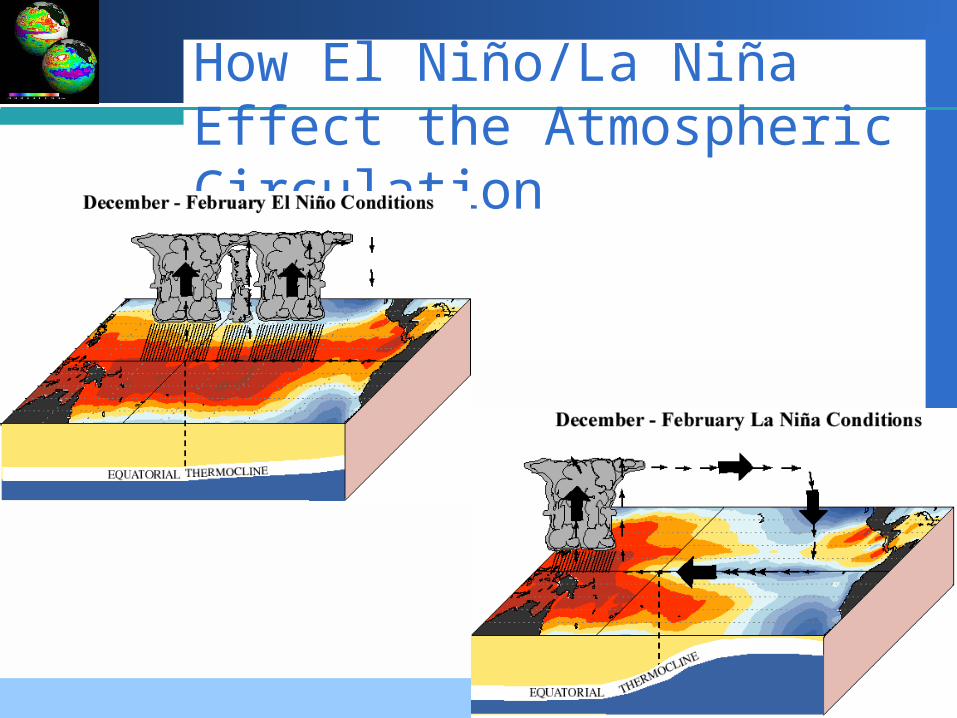
How El Niño/La Niña Effect the Atmospheric Circulation
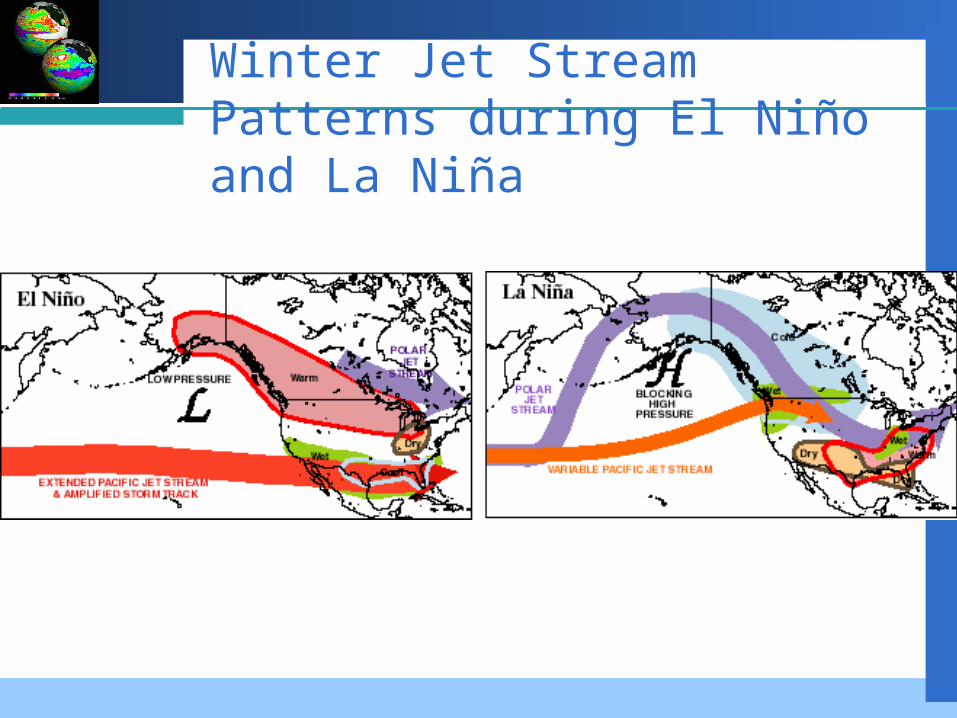
Winter Jet Stream Patterns during El Niño and La Niña
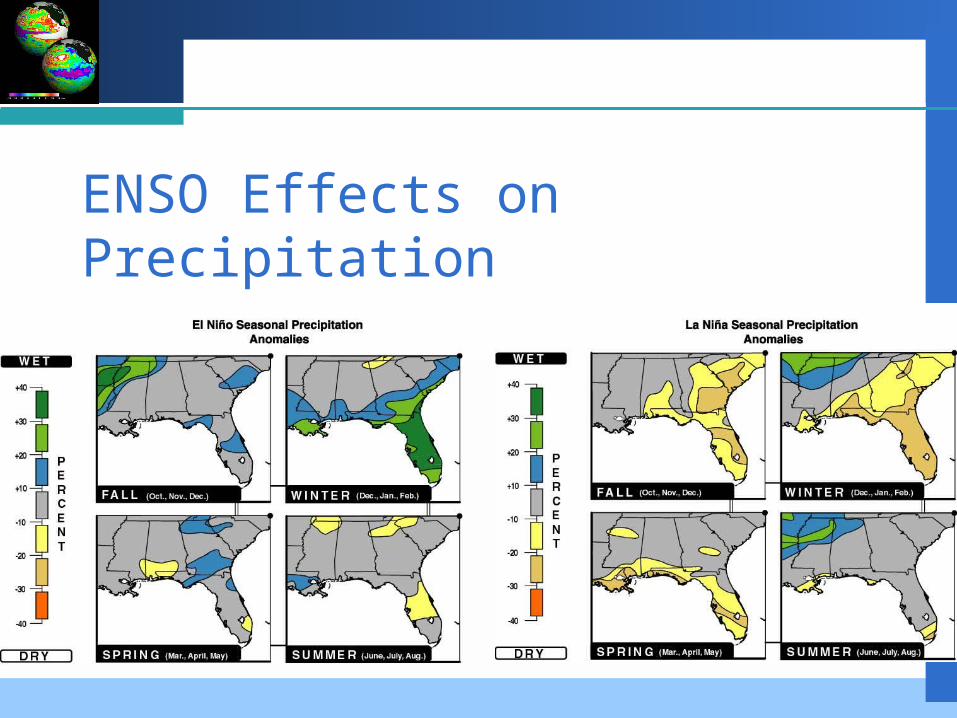
ENSO Effects on Precipitation
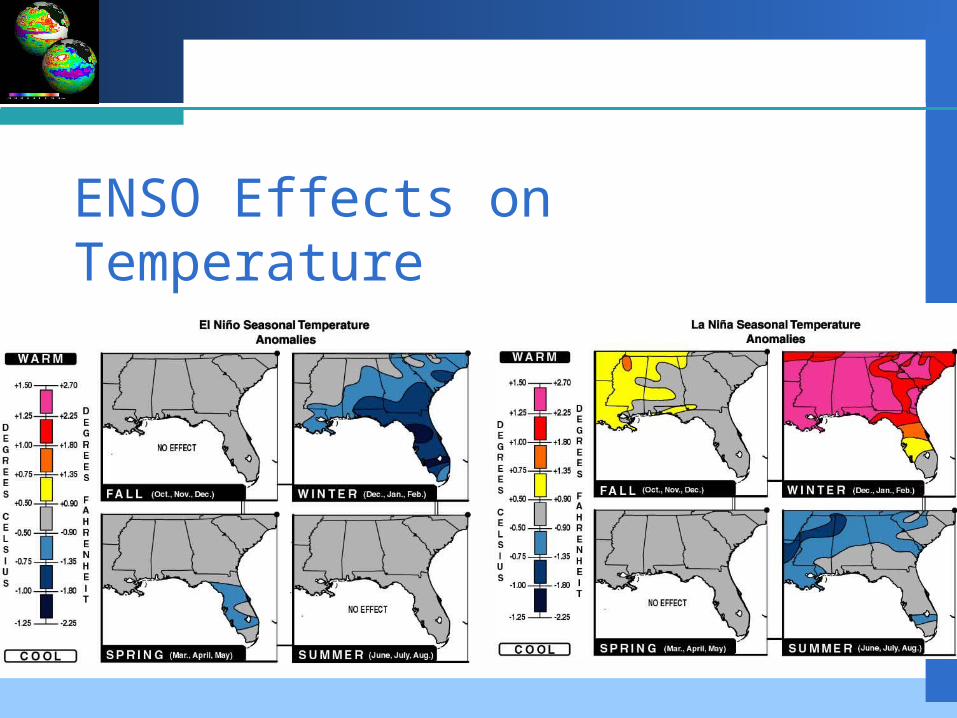
ENSO Effects on Temperature
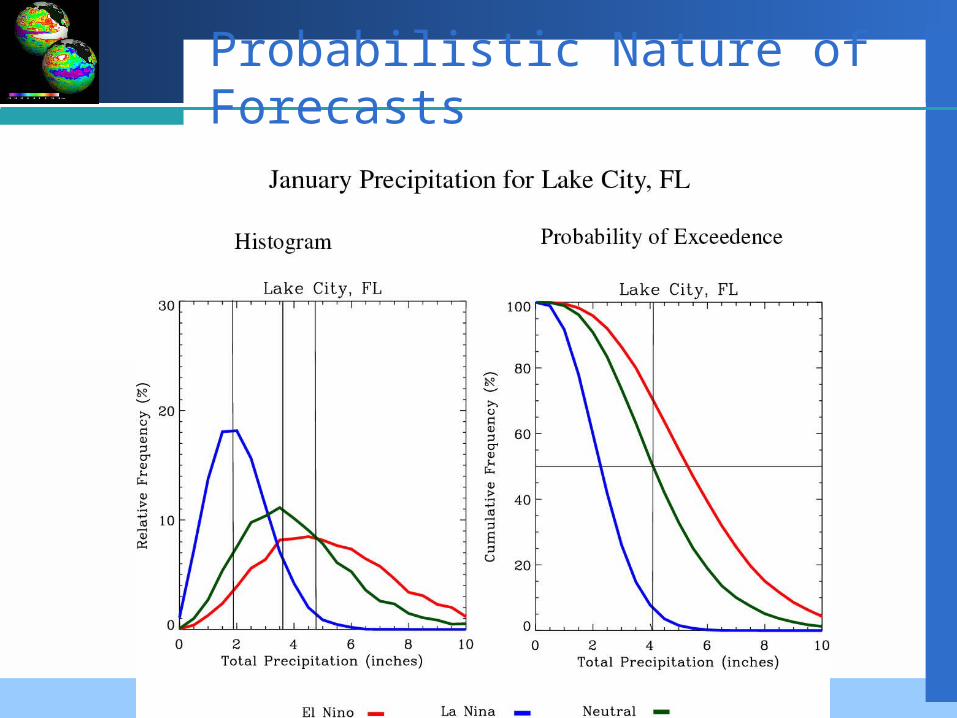
Probabilistic Nature of Forecasts
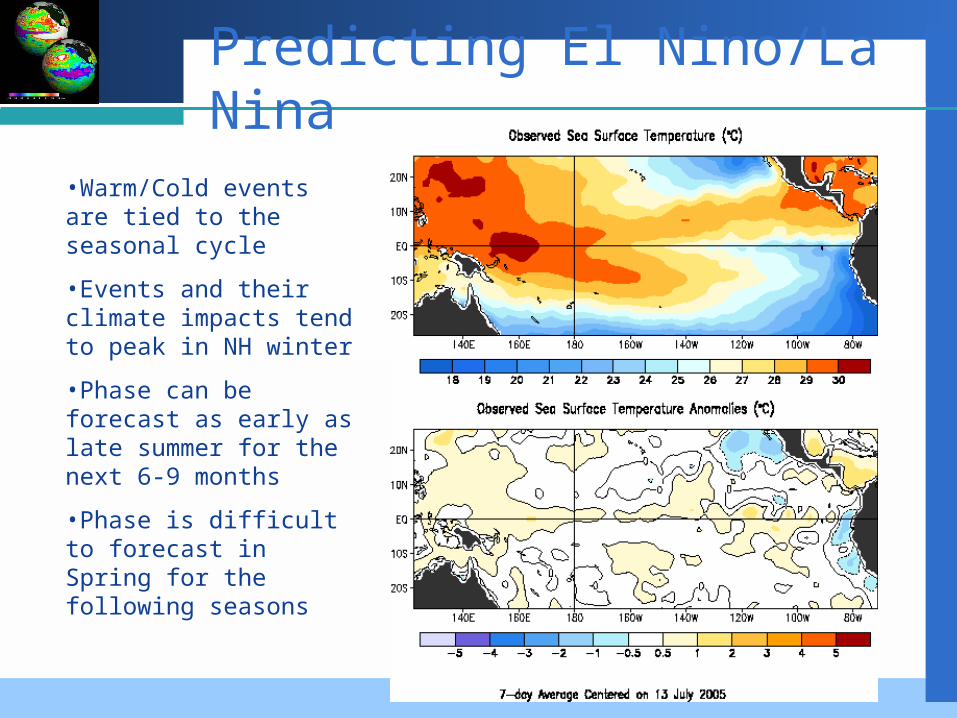
Predicting El Nino/La Nina
•Warm/Cold events are tied to the seasonal cycle
•Events and their climate impacts tend to peak in NH winter
•Phase can be forecast as early as late summer for the next 6-9 months
•Phase is difficult to forecast in Spring for the following seasons

Climate Forecast from NOAA
Temperature Precipitation
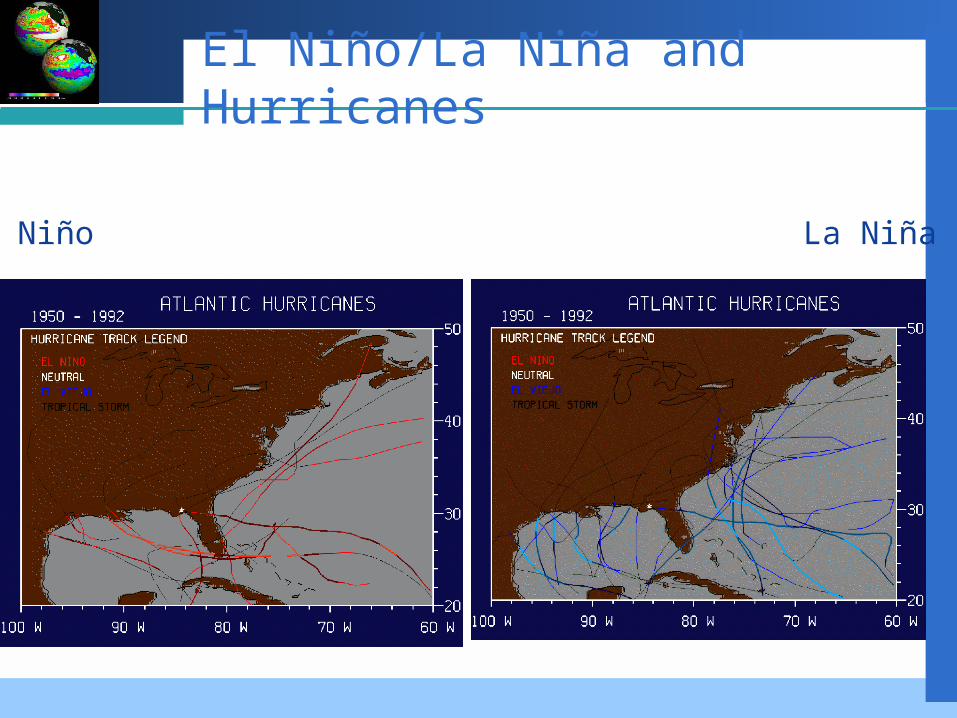
El Niño/La Niña and Hurricanes
El Niño La Niña
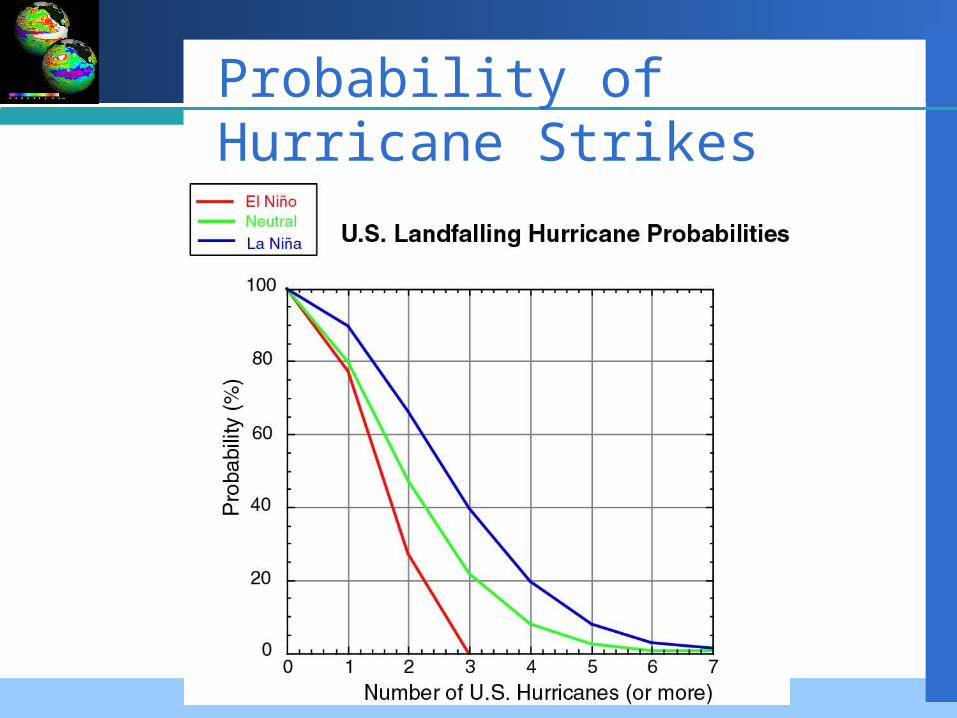
Probability of Hurricane Strikes
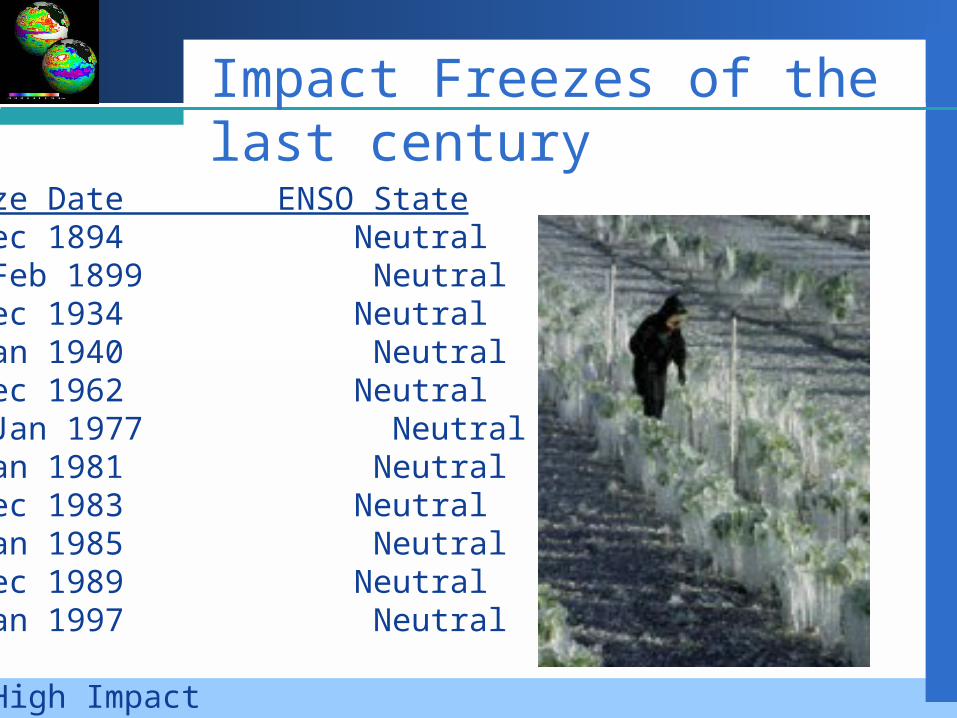
Impact Freezes of the last century
Freeze Date ENSO State *Dec 1894 Neutral Feb 1899 Neutral Dec 1934 Neutral Jan 1940 Neutral *Dec 1962 Neutral Jan 1977 Neutral Jan 1981 Neutral *Dec 1983 Neutral Jan 1985 Neutral *Dec 1989 Neutral Jan 1997 Neutral
* High Impact

ENSO and Southeast FreezeProbabilities
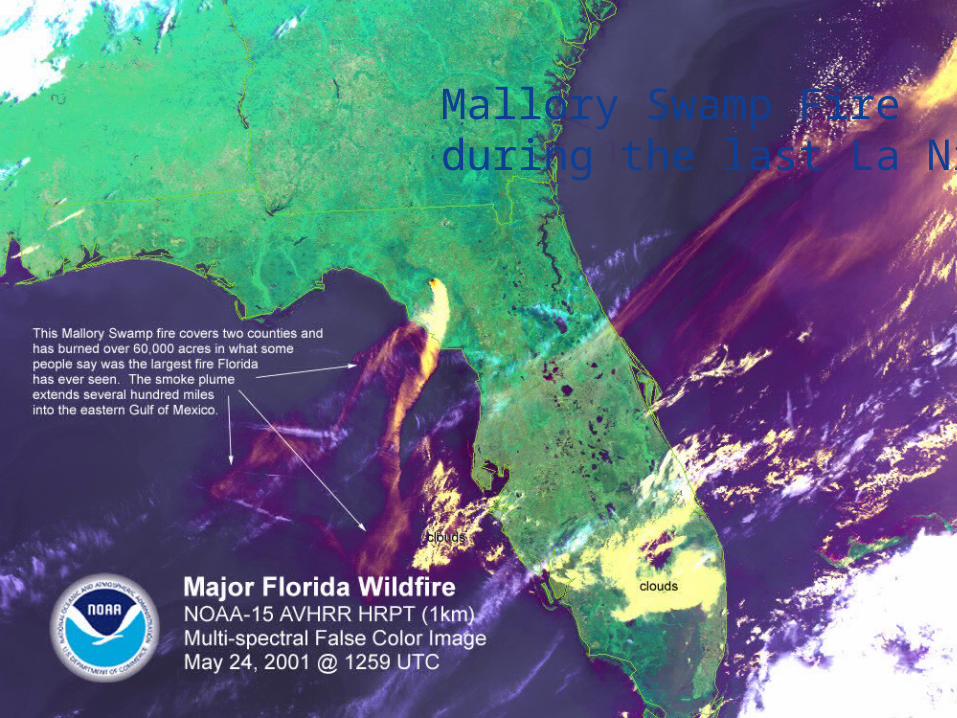
Mallory Swamp Fire during the last La Niña
ENSO and Wildfires
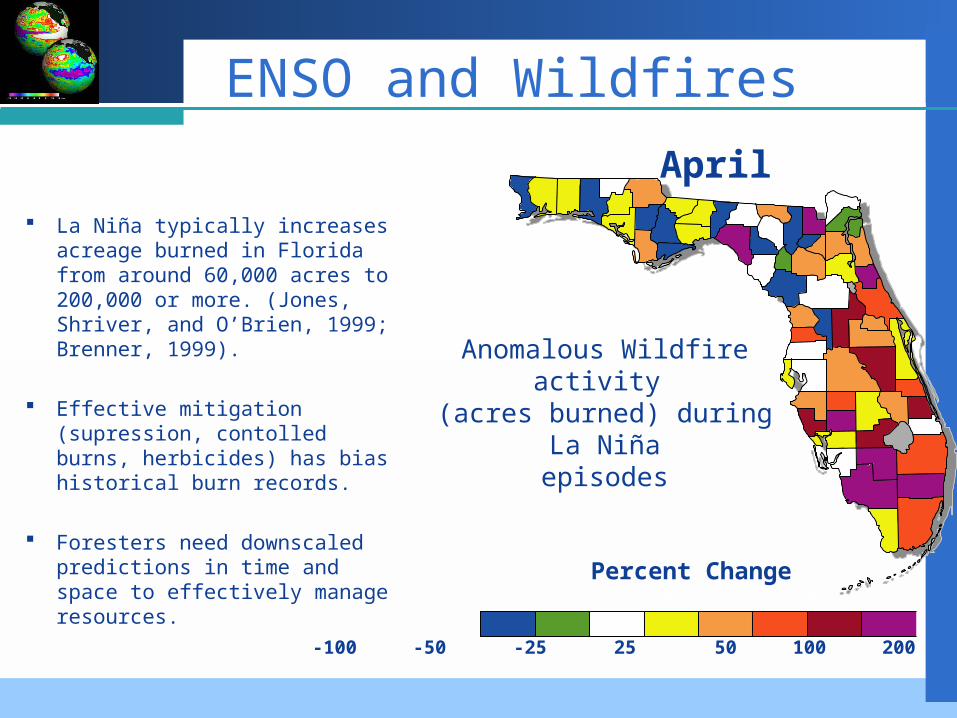
La Niña typically increases acreage burned in Florida from around 60,000 acres to 200,000 or more. (Jones, Shriver, and O’Brien, 1999; Brenner, 1999).
Effective mitigation (supression, contolled burns, herbicides) has bias historical burn records.
Foresters need downscaled predictions in time and space to effectively manage resources.
Anomalous Wildfire activity (acres burned) during La
Niñaepisodes
April
-100 -50 -25 25 50 100 200 500 1000
Percent Change
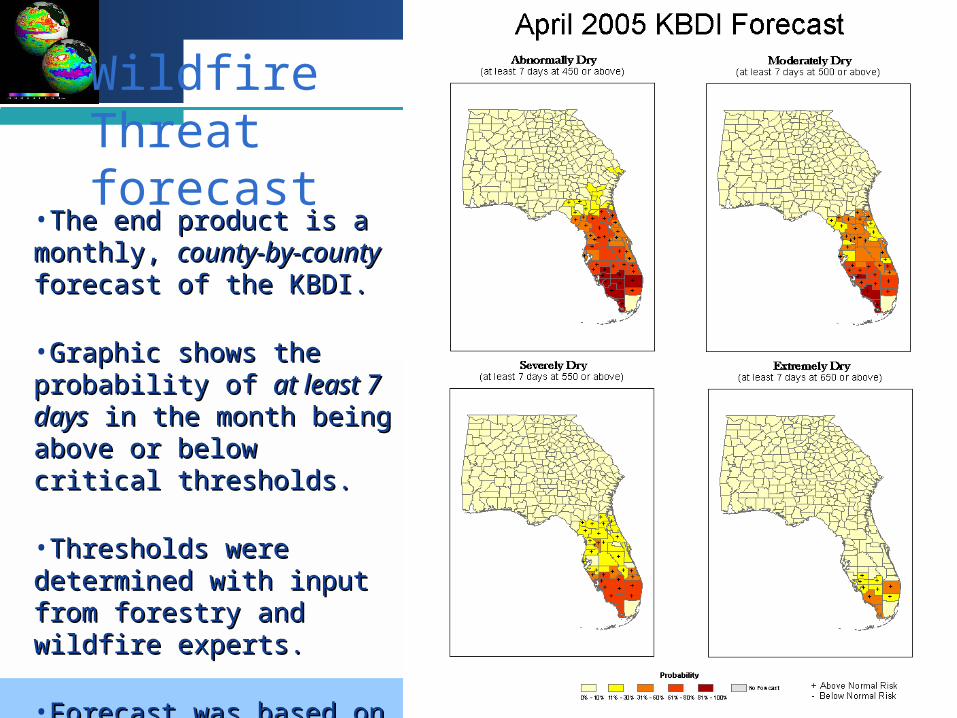
Wildfire Threat forecast
•The end product is a The end product is a monthly, monthly, county-by-county-by-countycounty forecast of the forecast of the KBDI.KBDI.
•Graphic shows the Graphic shows the probability of probability of at least 7 at least 7 daysdays in the month being in the month being above or below critical above or below critical thresholds.thresholds.
•Thresholds were Thresholds were determined with input determined with input from forestry and wildfire from forestry and wildfire experts.experts.
•Forecast was based on Forecast was based on the Neutral ENSO phase.the Neutral ENSO phase.
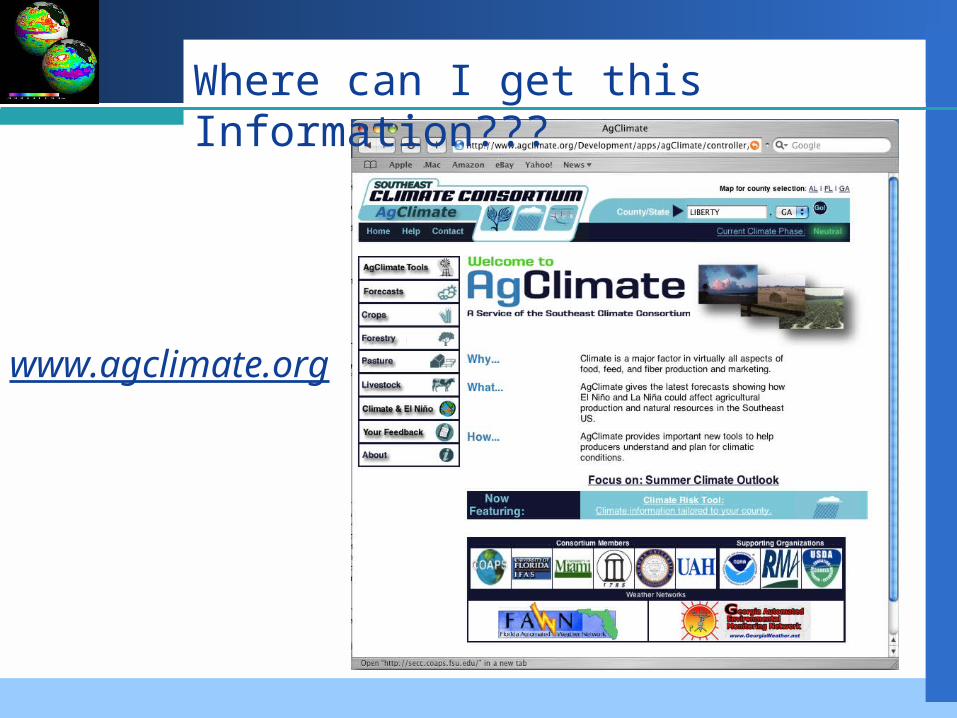
www.agclimate.org
Where can I get this Information???