summertime precipitation variability over europe …sgs02rpa/papers/zveryaev_allan_2008.pdf ·...
TRANSCRIPT
Summertime Precipitation Variability over Europe and its
Links to Atmospheric Dynamics and Evaporation
Igor I. Zveryaev and Richard P. Allan*
P.P. Shirshov Institute of Oceanology, RAS, Moscow, Russia
*Environmental Systems Science Centre, University of Reading, Reading, UK
Submitted to JGR-Atmospheres
September, 2008
Address for correspondence:
Dr. Igor I. Zveryaev, P.P. Shirshov Institute of Oceanology, RAS
36, Nakhimovsky Ave., Moscow, 117997, Russia
Telephone: 7 (495) 1247928
Telefax: 7 (495) 1245983
Email: [email protected]
1
Abstract
A gridded monthly precipitation data for 1979-2006 from the Global Precipitation
Climatology Project (GPCP) dataset are used to investigate interannual summer precipitation
variability over Europe and its links to regional atmospheric circulation and evaporation.
The first EOF mode of European precipitation, explaining 17.2-22.8% of its total variance,
is stable during summer season and is associated with the North Atlantic Oscillation (NAO). The
spatial-temporal structure of the second EOF mode is less stable and shows essential month-to-
month variations during summer season. This mode demonstrates rather strong link to the
Scandinavian teleconnection pattern.
Analysis of links between leading EOF modes of regional precipitation and evaporation has
revealed strong link between precipitation and evaporation from the European land surface, thus
indicating an important role of the local processes in summertime precipitation variability over
Europe. Weaker, but statistically significant links have been found for evaporation from the
surface of the Mediterranean and Baltic Seas. Finally, in contrast to winter no significant links
have been revealed between European precipitation and evaporation in the North Atlantic during
summer season.
2
1. Introduction
Variability of regional precipitation on the short- and long-term time scales significantly
impacts living conditions and different kinds of human activities in European region. Climate
anomalies resulting in deficient/excessive precipitation may cause serious (and even
catastrophic) socio-economic consequences. Recently, there were several examples of such
climate anomalies in different parts of Europe that resulted in significant damage to the regional
economies [e.g., Christensen and Christensen, 2003; Schär et al., 2004; Marsh and Hannaford,
2007]. Many recent regional climate extremes occurred during summer. However, compared to
winter, significantly less attention has been given to analysis of European climate variability
during summer season [e.g., Colman and Davey, 1999; Hurrell and Folland, 2002; Zveryaev,
2004]. In general, summertime climate variability in European region is not well studied and not
well understood. Moreover, predictability of the climate in mid-latitudes for the summer season
shows generally lower skills than that for the winter season [e.g., Johansson et al., 1998; Colman
and Davey, 1999; Dirmeyer et al., 2003; Koenigk and Mikolajewicz, 2008]. In particular, basing
on analysis of the North Atlantic sea surface temperature anomalies, Colman and Davey [1999]
found quite low skills of statistical predictability of European climate during summer. Therefore,
to improve prediction of regional climate and its extremes, particularly for the warm season,
further analysis of the processes driving European climate variability is necessary.
In contrast to winter, when European precipitation variability is mostly driven by the North
Atlantic Oscillation [NAO, e.g., Hurrell, 1995; Qian et al., 2000; Zveryaev, 2006], mechanisms
driving interannual variability of regional precipitation during summer are more complex and are
not well understood. In summer, when the role of atmospheric circulation in precipitation
variability is diminished, the role of the local land surface processes increases [Trenberth, 1999].
3
Some studies point to importance of the land surface processes in summer precipitation
variability [Koster and Suarez, 1995; Schär et al., 1999; Seneviratne et al., 2006], whereas other
works highlight the role of the summer atmospheric circulation [Pal et al., 2004; Koster et al.,
2004; Ogi et al., 2005]. Although the above mechanisms are not mutually exclusive, there is a
high degree of uncertainty regarding their role in summer precipitation variability in Northern
Hemisphere extra-tropics, and particularly over Europe.
Present study focuses on the analysis of the summer precipitation variability over Europe
on interannual time scale, and on the links between this variability and regimes of the
atmospheric circulation in the Atlantic-European sector. Furthermore, we investigate links
between European precipitation and evaporation from the surface of the North Atlantic Ocean,
Mediterranean and Baltic Seas, and from the European land surface. We analyze variability of
precipitation over Europe on the basis of data available from the Global Precipitation
Climatology Project (GPCP) dataset for 1979-2006 [Huffman et al., 1997; Adler et al., 2003]. In
order to get more detailed information on the summer precipitation variability and to examine
stability of the leading modes of precipitation during summer season, we performed analysis for
summer seasonal mean precipitation as well as separate analyses for each summer month. The
paper is organized as follows. The data used and analysis methods are described in section 2.
Spatial-temporal structure of the leading modes of the summer seasonal and monthly mean
precipitation variability for 1979-2006 is analyzed in section 3. Links between leading modes of
precipitation variability and atmospheric circulation and teleconnection patterns are examined in
section 4. In section 5 we explore links between regional precipitation and evaporation during
summer season. Finally, concluding remarks are presented in section 6.
4
2. Data and methods
We employed monthly mean global precipitation data (2.5° x 2.5° latitude-longitude grid)
from the Version-2 of the GPCP dataset for 1979-2006 [Huffman et al., 1997; Adler et al., 2003].
The GPCP data set represents a combination of gauge observations and satellite estimates. Input
data sets for the GPCP product include Global Precipitation Climatology Centre (GPCC) rain
gauge analyses, SSM/I rain-rate estimates, GPI, rain gauge data from the Global Historical
Climate Network (GHCN) and Climate Assessment and Monitoring System (CAMS), TOVS-
based estimates and OLR precipitation index (OPI). The GPCP data are available online at
http://www.ncdc.noaa.gov/oa/wmo/wdcamet-ncdc.html. In the present study the domain of
analysis is limited to latitudes 31.25°N-73.75°N and longitudes 13.75°W-51.25°E.
In this study we also used evaporation data from the Woods Hole Oceanographic
Institution (WHOI) data set [Yu and Weller, 2007]. In contrast to other flux products constructed
from one single data source, this data set is determined by objectively blending the data sources
from satellite and NWP model outputs while using in situ observations to assign the weights [Yu
et al., 2004; Yu and Weller, 2007]. The WHOI data set provides evaporation data (2.5° x 2.5°
latitude-longitude grid) over global oceans for 1958-2006. Detailed description of the data and
the synthesis procedure can be found in Yu and Weller [2007] and at the website
http://oaflux.whoi.edu. Since observational data over land are rather scarce, as a complementary
data source on evaporation over land surface we used data from the NCEP/NCAR Reanalysis for
1979-2006 [Kalnay et al., 1996]. These data are purely model-generated product. Thus, not
pretending to get accurate quantitative estimates of the links between land surface evaporation
and regional precipitation, we nevertheless, hope to obtain reasonable qualitative assessments of
these links within degree of uncertainty provided by the reanalysis product.
5
To assess the links between variability of European precipitation and regional atmospheric
circulation we use indices of the major teleconnection patterns that have been documented and
described by Barnston and Livezey [1987]. The patterns and indices were obtained by applying
rotated principal component analysis to standardized 500hPa height anomalies over Northern
Hemisphere. In our analysis along with links to the NAO we examine links to such
teleconnections as East Atlantic (EA) pattern, East Atlantic – West Russia (EAWR) pattern, and
Scandinavian (SCA) pattern, which can also affect European precipitation variability. Regularly
updated indices of these patterns are available from the Climate Prediction Center (CPC) website
http://www.cpc.ncep.noaa.gov/data/teledoc/telecontents.html. The data cover the period 1950 -
present. Details on the teleconnection pattern calculation procedures can be found in Barnston
and Livezey [1987] and at the CPC website. To reveal dynamical context of the leading modes in
precipitation variability, we used monthly sea level pressure data from the NCEP/NCAR
Reanalysis for 1979-2006 [Kalnay et al., 1996], having a 2.5º latitude by 2.5º longitude spatial
resolution.
We examine a spatial-temporal structure of the long-term variations of summer monthly
and seasonal mean precipitation over Europe by application of empirical orthogonal functions
(EOF) analysis based on the covariance matrix [Wilks, 1995; von Storch and Navarra, 1995].
Prior to the EOF analysis the annual cycle was removed from all grid point time series by
subtracting from each seasonal (monthly) value the respective season’s (month’s) long-term
mean. After that the time series has been linearly detrended. In order to take into account the
latitudinal distortions, obtained anomalies were weighted by the square root of cosine of latitude
to ensure that equal areas are afforded equal weight in the analysis [North et al., 1982].
6
To assess links to teleconnection patterns we use conventional correlation analysis. No lead
or lag relationships were taken into consideration for this work; our analysis was restricted to
simultaneous connections between precipitation variability over Europe and major
teleconnection patterns and SLP fields in the North Atlantic - European sector. According to the
Student’s t-test [Bendat and Piersol, 1966], the minimum significant correlation coefficients
between the time series analyzed are 0.374 for the 95% significance level. It is worth noting that
the significance level of the correlation coefficient might be reduced if the time series are
influenced by autocorrelation. More specifically, large lag-one autocorrelations reduce
significantly effective number of degrees of freedom, while influence of small autocorrelations is
weak [e.g., Bretherton et al., 1990]. We examined the potential impact of autocorrelation on the
estimation of significance of correlation coefficients, and our analysis did not reveal significant
autocorrelations in considered time series (i.e., principal components of the leading EOF modes
and teleconnection indices).
3. Leading modes of the summer precipitation variability over Europe
To reveal the leading modes of interannual variability of precipitation over Europe during
summer, we performed the EOF analysis on time series of the summer (June-July-August) mean
and (separately) June, July and August monthly mean precipitation from the GPCP data set for
the period 1979 – 2006. The motivation for the separate analyses of the monthly precipitation
time series is based on our intention to examine stability of the leading EOF modes during
summer season. We limit our analysis to consideration of the first and second EOF modes,
because each of the subsequent modes explains less than 10% of the total precipitation variance,
and because significant links between those modes of precipitation variability and regimes of
7
atmospheric circulation have not been revealed. It should be noted that in August the leading
EOF modes of precipitation are not well separated according to the North criteria [North et al.,
1982], however, we include them into our consideration for the sake of completeness of analysis.
Spatial patterns of the first two EOF modes of precipitation and time series of the corresponding
principal components (hereafter PC) are shown, respectively, in Figures 1 and 2.
The first EOF mode explains from 17.2% (in June) to 22.8% (in July) of the total variance
of precipitation. The respective spatial patterns (Figure 1a,c,e,g), characterized by a tripole-like
structure, depict three action centers. The major action center extends from the British Isles to
wide region around the Baltic Sea, and further to eastern Europe and European Russia. Two
other centers of opposite polarity a located to south (i.e. over Mediterranean region) and north
(i.e. over northern Scandinavia) off the major action center (Figure 1a,c,e,g). Structurally the
obtained patterns are very similar to that of the first EOF mode of the mean summer precipitation
from the CMAP data for 1979-2001 [Zveryaev, 2004]. We note that the structure of the EOF-1
patterns demonstrates evident persistence during summer season. In other words, structural
changes from month to month are not significant, albeit local (i.e. in action centers) changes in
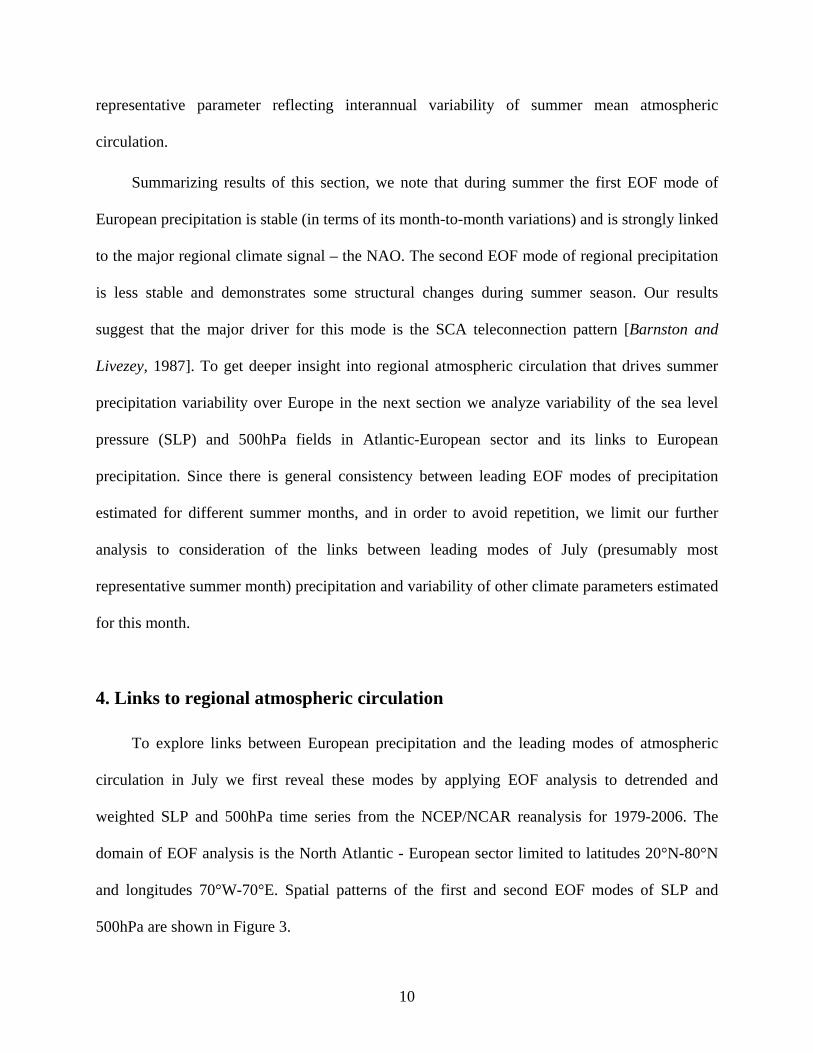
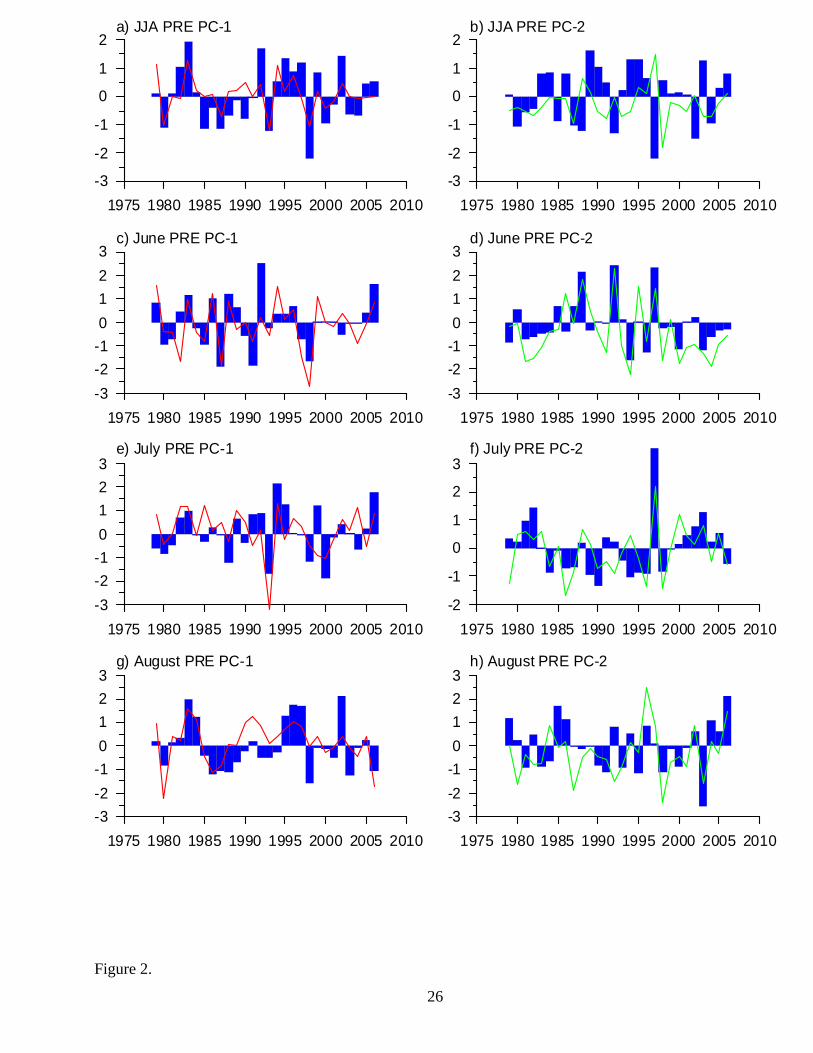
magnitudes of variability are noticeable. The PC-1 (Figure 2a,c,e,g), displaying temporal
behavior of this mode, demonstrates evident correspondence with the NAO index in all
considered months and in analysis of seasonal mean precipitation. Moreover, high correlations
between respective PCs and the NAO index (Table1) clearly indicate that during entire summer
season EOF-1 of European precipitation is associated with the NAO. It should be noted,
however, that summer NAO is essentially different (in terms of its spatial structure) from its
winter counterpart [Barnston and Livezey, 1987]. Hence, the NAO-associated summer
8
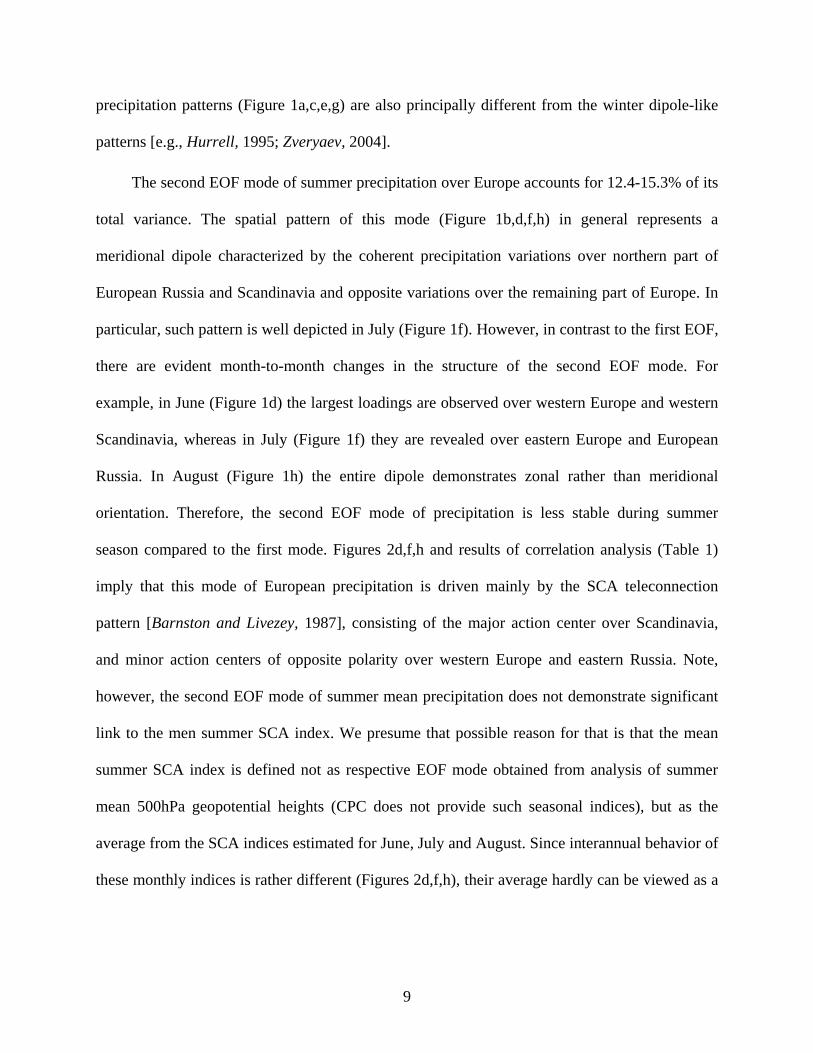
precipitation patterns (Figure 1a,c,e,g) are also principally different from the winter dipole-like
patterns [e.g., Hurrell, 1995; Zveryaev, 2004].
The second EOF mode of summer precipitation over Europe accounts for 12.4-15.3% of its
total variance. The spatial pattern of this mode (Figure 1b,d,f,h) in general represents a
meridional dipole characterized by the coherent precipitation variations over northern part of
European Russia and Scandinavia and opposite variations over the remaining part of Europe. In
particular, such pattern is well depicted in July (Figure 1f). However, in contrast to the first EOF,
there are evident month-to-month changes in the structure of the second EOF mode. For
example, in June (Figure 1d) the largest loadings are observed over western Europe and western
Scandinavia, whereas in July (Figure 1f) they are revealed over eastern Europe and European
Russia. In August (Figure 1h) the entire dipole demonstrates zonal rather than meridional
orientation. Therefore, the second EOF mode of precipitation is less stable during summer
season compared to the first mode. Figures 2d,f,h and results of correlation analysis (Table 1)
imply that this mode of European precipitation is driven mainly by the SCA teleconnection
pattern [Barnston and Livezey, 1987], consisting of the major action center over Scandinavia,
and minor action centers of opposite polarity over western Europe and eastern Russia. Note,
however, the second EOF mode of summer mean precipitation does not demonstrate significant
link to the men summer SCA index. We presume that possible reason for that is that the mean
summer SCA index is defined not as respective EOF mode obtained from analysis of summer
mean 500hPa geopotential heights (CPC does not provide such seasonal indices), but as the
average from the SCA indices estimated for June, July and August. Since interannual behavior of
these monthly indices is rather different (Figures 2d,f,h), their average hardly can be viewed as a
9
representative parameter reflecting interannual variability of summer mean atmospheric
circulation.
Summarizing results of this section, we note that during summer the first EOF mode of
European precipitation is stable (in terms of its month-to-month variations) and is strongly linked
to the major regional climate signal – the NAO. The second EOF mode of regional precipitation
is less stable and demonstrates some structural changes during summer season. Our results
suggest that the major driver for this mode is the SCA teleconnection pattern [Barnston and
Livezey, 1987]. To get deeper insight into regional atmospheric circulation that drives summer
precipitation variability over Europe in the next section we analyze variability of the sea level
pressure (SLP) and 500hPa fields in Atlantic-European sector and its links to European
precipitation. Since there is general consistency between leading EOF modes of precipitation
estimated for different summer months, and in order to avoid repetition, we limit our further
analysis to consideration of the links between leading modes of July (presumably most
representative summer month) precipitation and variability of other climate parameters estimated
for this month.
4. Links to regional atmospheric circulation
To explore links between European precipitation and the leading modes of atmospheric
circulation in July we first reveal these modes by applying EOF analysis to detrended and
weighted SLP and 500hPa time series from the NCEP/NCAR reanalysis for 1979-2006. The
domain of EOF analysis is the North Atlantic - European sector limited to latitudes 20°N-80°N
and longitudes 70°W-70°E. Spatial patterns of the first and second EOF modes of SLP and
500hPa are shown in Figure 3.
10
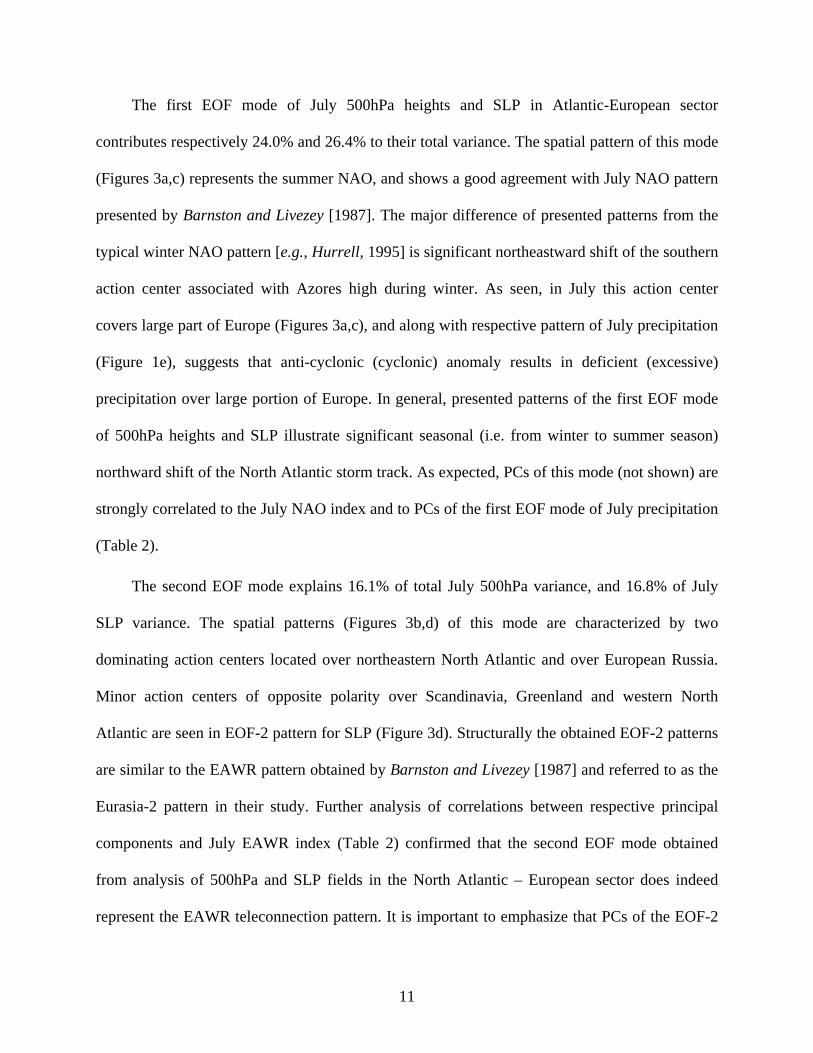
The first EOF mode of July 500hPa heights and SLP in Atlantic-European sector
contributes respectively 24.0% and 26.4% to their total variance. The spatial pattern of this mode
(Figures 3a,c) represents the summer NAO, and shows a good agreement with July NAO pattern
presented by Barnston and Livezey [1987]. The major difference of presented patterns from the
typical winter NAO pattern [e.g., Hurrell, 1995] is significant northeastward shift of the southern
action center associated with Azores high during winter. As seen, in July this action center
covers large part of Europe (Figures 3a,c), and along with respective pattern of July precipitation
(Figure 1e), suggests that anti-cyclonic (cyclonic) anomaly results in deficient (excessive)
precipitation over large portion of Europe. In general, presented patterns of the first EOF mode
of 500hPa heights and SLP illustrate significant seasonal (i.e. from winter to summer season)
northward shift of the North Atlantic storm track. As expected, PCs of this mode (not shown) are
strongly correlated to the July NAO index and to PCs of the first EOF mode of July precipitation
(Table 2).
The second EOF mode explains 16.1% of total July 500hPa variance, and 16.8% of July
SLP variance. The spatial patterns (Figures 3b,d) of this mode are characterized by two
dominating action centers located over northeastern North Atlantic and over European Russia.
Minor action centers of opposite polarity over Scandinavia, Greenland and western North
Atlantic are seen in EOF-2 pattern for SLP (Figure 3d). Structurally the obtained EOF-2 patterns
are similar to the EAWR pattern obtained by Barnston and Livezey [1987] and referred to as the
Eurasia-2 pattern in their study. Further analysis of correlations between respective principal
components and July EAWR index (Table 2) confirmed that the second EOF mode obtained
from analysis of 500hPa and SLP fields in the North Atlantic – European sector does indeed
represent the EAWR teleconnection pattern. It is important to emphasize that PCs of the EOF-2
11
of 500hPa and SLP are not correlated to the respective PCs of precipitation over Europe (Table
2). We remind that our analysis has shown (see previous chapter) that the second EOF mode of
regional precipitation is associated with the Scandinavian teleconnection, previously referred to
as the Eurasia-1 pattern in Barnston and Livezey [1987] study.
5. Links between European precipitation and regional evaporation
In this chapter we examine links between European precipitation and evaporation in four
regions that presumably can impact variability of European precipitation during warm season.
These regions are the North Atlantic Ocean, the Baltic and Mediterranean Seas, and Europe (i.e.,
European land surface). We first reveal the leading modes of evaporation in each region by
applying EOF analysis to detrended and weighted evaporation time series from the WHOI
dataset (for oceanic/marine regions) and from the NCEP/NCAR reanalysis (for European land
surface) for 1979-2006. Spatial patterns of the first and second EOF modes of evaporation for the
Baltic Sea, Mediterranean Sea and Europe are shown respectively in Figure 4, Figure 5 and
Figure 6. Further, we analyze links between leading EOF modes of evaporation in
aforementioned regions and leading modes of precipitation over Europe. Since we did not find
statistically significant links between European precipitation and evaporation in the North
Atlantic during summer, we exclude this region from our further analysis. As we mentioned in
previous chapter, the structure of the EOF-1 of SLP (Figure 3c) indicates significant northward
shift (compared to winter) of the North Atlantic storm track. This suggests that the moisture
evaporated in the North Atlantic is mostly transported to the Arctic basin rather than to Europe
(as it usually happens during winter). Therefore, the fact that we did not find significant links
between summertime European precipitation and evaporation in the North Atlantic is not so
12
surprising. Note, however, that local precipitation variability in some European regions (e.g.,
northern Scandinavia) can be influenced by the North Atlantic moisture transport.
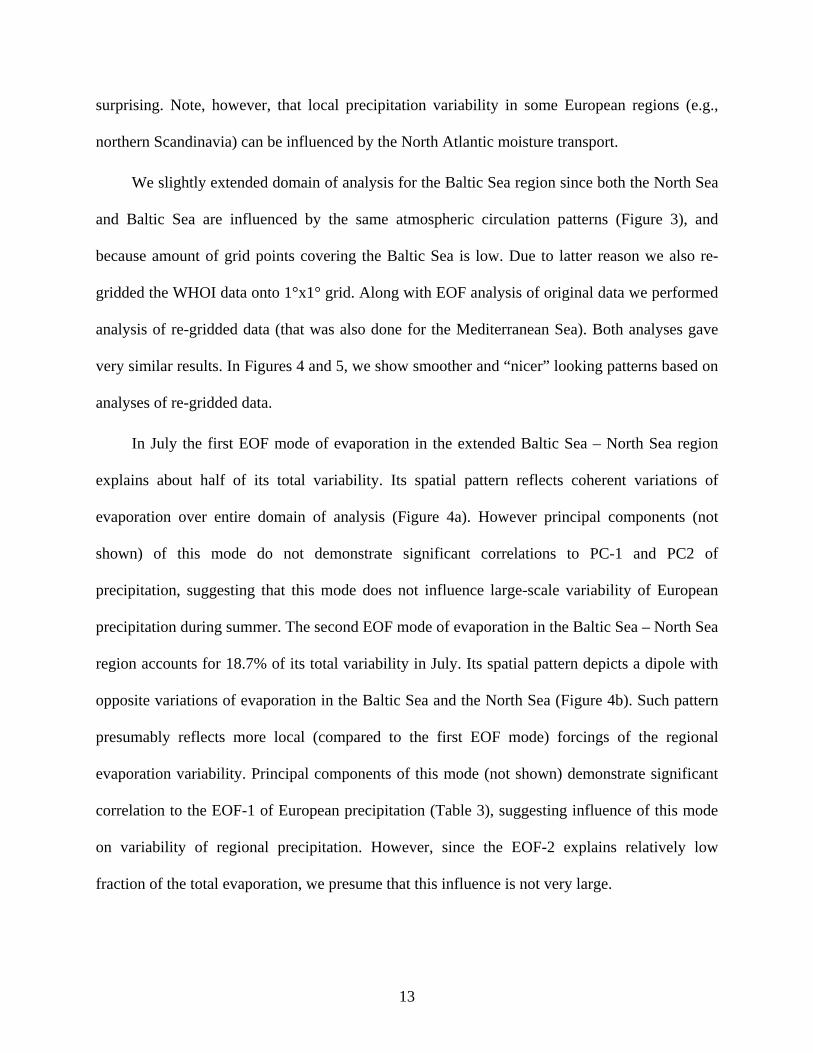
We slightly extended domain of analysis for the Baltic Sea region since both the North Sea
and Baltic Sea are influenced by the same atmospheric circulation patterns (Figure 3), and
because amount of grid points covering the Baltic Sea is low. Due to latter reason we also re-
gridded the WHOI data onto 1°x1° grid. Along with EOF analysis of original data we performed
analysis of re-gridded data (that was also done for the Mediterranean Sea). Both analyses gave
very similar results. In Figures 4 and 5, we show smoother and “nicer” looking patterns based on
analyses of re-gridded data.
In July the first EOF mode of evaporation in the extended Baltic Sea – North Sea region
explains about half of its total variability. Its spatial pattern reflects coherent variations of
evaporation over entire domain of analysis (Figure 4a). However principal components (not
shown) of this mode do not demonstrate significant correlations to PC-1 and PC2 of
precipitation, suggesting that this mode does not influence large-scale variability of European
precipitation during summer. The second EOF mode of evaporation in the Baltic Sea – North Sea
region accounts for 18.7% of its total variability in July. Its spatial pattern depicts a dipole with
opposite variations of evaporation in the Baltic Sea and the North Sea (Figure 4b). Such pattern
presumably reflects more local (compared to the first EOF mode) forcings of the regional
evaporation variability. Principal components of this mode (not shown) demonstrate significant
correlation to the EOF-1 of European precipitation (Table 3), suggesting influence of this mode
on variability of regional precipitation. However, since the EOF-2 explains relatively low
fraction of the total evaporation, we presume that this influence is not very large.
13
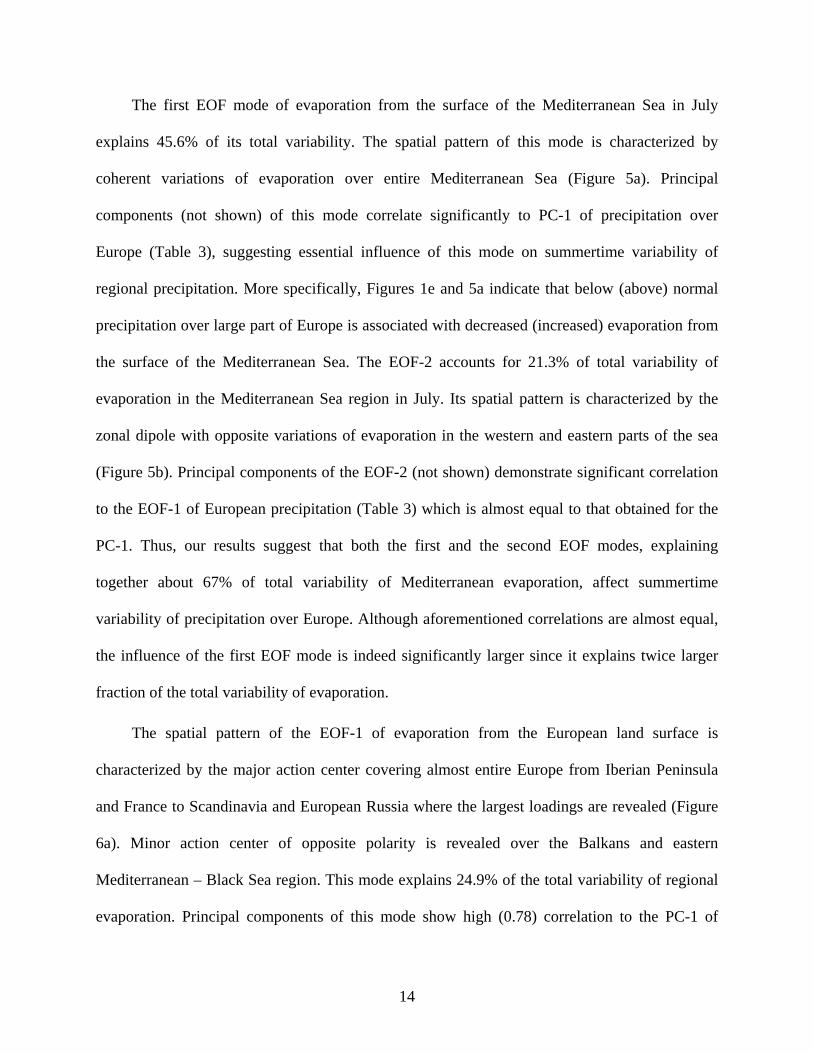
The first EOF mode of evaporation from the surface of the Mediterranean Sea in July
explains 45.6% of its total variability. The spatial pattern of this mode is characterized by
coherent variations of evaporation over entire Mediterranean Sea (Figure 5a). Principal
components (not shown) of this mode correlate significantly to PC-1 of precipitation over
Europe (Table 3), suggesting essential influence of this mode on summertime variability of
regional precipitation. More specifically, Figures 1e and 5a indicate that below (above) normal
precipitation over large part of Europe is associated with decreased (increased) evaporation from
the surface of the Mediterranean Sea. The EOF-2 accounts for 21.3% of total variability of
evaporation in the Mediterranean Sea region in July. Its spatial pattern is characterized by the
zonal dipole with opposite variations of evaporation in the western and eastern parts of the sea
(Figure 5b). Principal components of the EOF-2 (not shown) demonstrate significant correlation
to the EOF-1 of European precipitation (Table 3) which is almost equal to that obtained for the
PC-1. Thus, our results suggest that both the first and the second EOF modes, explaining
together about 67% of total variability of Mediterranean evaporation, affect summertime
variability of precipitation over Europe. Although aforementioned correlations are almost equal,
the influence of the first EOF mode is indeed significantly larger since it explains twice larger
fraction of the total variability of evaporation.
The spatial pattern of the EOF-1 of evaporation from the European land surface is
characterized by the major action center covering almost entire Europe from Iberian Peninsula
and France to Scandinavia and European Russia where the largest loadings are revealed (Figure
6a). Minor action center of opposite polarity is revealed over the Balkans and eastern
Mediterranean – Black Sea region. This mode explains 24.9% of the total variability of regional
evaporation. Principal components of this mode show high (0.78) correlation to the PC-1 of
14
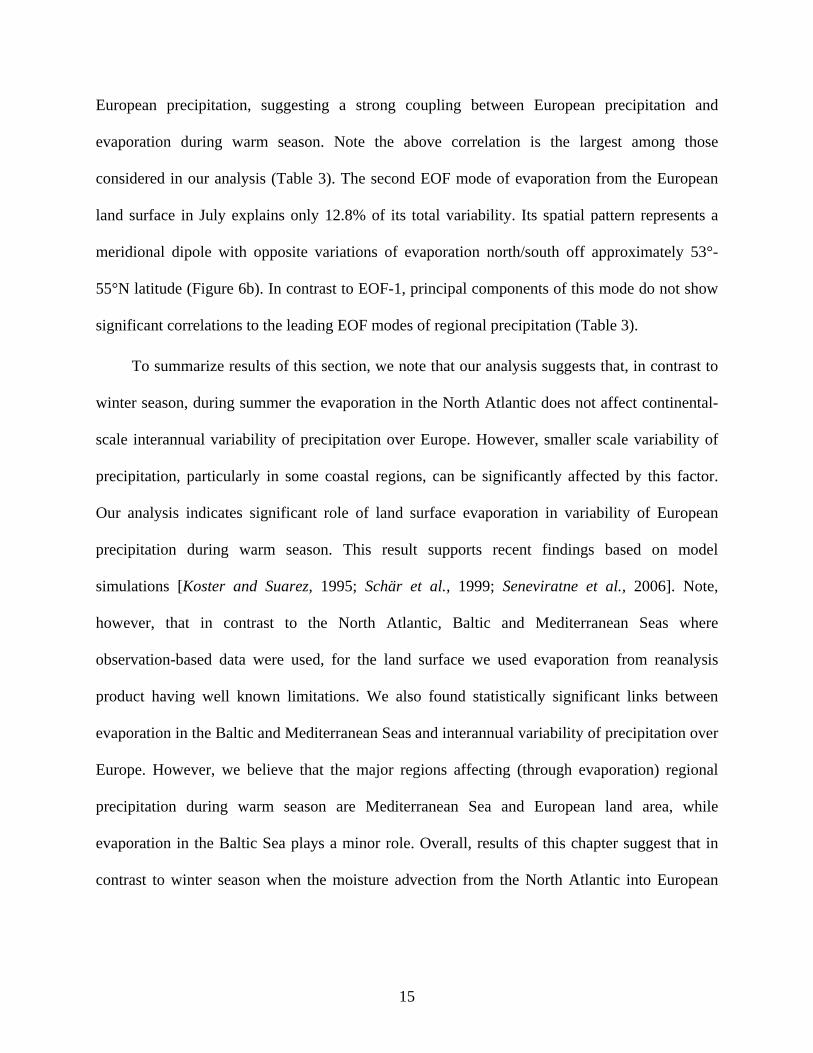
European precipitation, suggesting a strong coupling between European precipitation and
evaporation during warm season. Note the above correlation is the largest among those
considered in our analysis (Table 3). The second EOF mode of evaporation from the European
land surface in July explains only 12.8% of its total variability. Its spatial pattern represents a
meridional dipole with opposite variations of evaporation north/south off approximately 53°-
55°N latitude (Figure 6b). In contrast to EOF-1, principal components of this mode do not show
significant correlations to the leading EOF modes of regional precipitation (Table 3).
To summarize results of this section, we note that our analysis suggests that, in contrast to
winter season, during summer the evaporation in the North Atlantic does not affect continental-
scale interannual variability of precipitation over Europe. However, smaller scale variability of
precipitation, particularly in some coastal regions, can be significantly affected by this factor.
Our analysis indicates significant role of land surface evaporation in variability of European
precipitation during warm season. This result supports recent findings based on model
simulations [Koster and Suarez, 1995; Schär et al., 1999; Seneviratne et al., 2006]. Note,
however, that in contrast to the North Atlantic, Baltic and Mediterranean Seas where
observation-based data were used, for the land surface we used evaporation from reanalysis
product having well known limitations. We also found statistically significant links between
evaporation in the Baltic and Mediterranean Seas and interannual variability of precipitation over
Europe. However, we believe that the major regions affecting (through evaporation) regional
precipitation during warm season are Mediterranean Sea and European land area, while
evaporation in the Baltic Sea plays a minor role. Overall, results of this chapter suggest that in
contrast to winter season when the moisture advection from the North Atlantic into European
15
region plays a dominant role in regional precipitation variability, during boreal summer local
processes make major contribution to interannual variability of European precipitation.
6. Concluding remarks
In the present study we analyzed the leading modes of interannual variability of
summertime precipitation over Europe based on the data from the GPCP dataset for 1979-2006
[Huffman et al., 1997; Adler et al., 2003]. We also investigated relation of these modes to
regional atmospheric circulation, and their links to evaporation in the North Atlantic Ocean,
Baltic and Mediterranean Seas, as well as to evaporation from the European land surface.
It is shown that the first EOF mode of European precipitation is rather stable (in terms of its
spatial-temporal structure) during summer season, and is characterized by tripole-like pattern
with large coherent variations over wide region extending from British Isles to European Russia.
Relatively weak precipitation variations of opposite sign are revealed north and south off the
above region. This mode is associated with the NAO [e.g., Hurrell, 1995]. The second EOF
mode of summer precipitation (characterized by meridional dipole structure) is less stable, and is
linked to the Scandinavian teleconnection [Barnston and Livezey, 1987].
Analysis of links between European precipitation and evaporation has shown that, in
contrast to winter season, when regional precipitation variability mostly determined by the NAO-
driven moisture advection from the North Atlantic, summertime continental scale variability of
precipitation is not associated with evaporation in the North Atlantic. This is due to significant
northeastward shift of the North Atlantic storm track associated with the summer NAO structure
that is principally different from its winter counterpart. On the contrary, our results suggest
strong impact of the local processes, in particular land surface evaporation, on variability of
16
regional precipitation during warm season, thus, supporting recent model-based results of other
studies [e.g., Schär et al., 1999; Seneviratne et al., 2006]. However, since we used in our study
reanalysis data having well known limitations, further analysis of the role of land surface
evaporation in interannual variability of European precipitation during warm season is needed.
We also found significant links between summertime European precipitation and evaporation in
the Mediterranean Sea which also (along with land surface) can be viewed as a local (rather than
remote) source of moisture. It seems that the influence of the Baltic Sea evaporation on regional
precipitation is not large (although statistically significant links are detected) and probably
limited to the Baltic region.
The present study highlights mechanisms driving summertime interannual variability of
precipitation over Europe. Since the summertime NAO is structurally different from that for
other seasons, its impact on summer precipitation variability over Europe is also principally
different. We found that during summer the leading modes of regional precipitation are not
associated with evaporation in the North Atlantic, but strongly linked to local processes such as
evaporation from the European land surface and from the surface of the Mediterranean Sea.
However, since our assessment of the links to land surface evaporation is limited to reanalysis
product, we hope that further diagnostic studies of the observational data as well as model
experiments will allow obtaining more accurate estimates of these links, thus, providing
extremely useful information for the seasonal climate prediction for the European region.
Acknowledgments
This research was supported by the Royal Society grant (International Incoming Short
Visits). Major part of the present study has been performed during IIZ work at the Environmental
17
Systems Science Centre, University of Reading as a visiting scientist. IIZ was also supported by
the Russian Foundation for Basic Research Grant 05-05-64908.
References
Adler, R.F., and coauthors (2003), The Version-2 Global Precipitation Climatology Project
(GPCP) monthly precipitation analysis (1979-present), J. Hydromet., 4, 1147-1167.
Barnston, A.G., and R.E. Livezey (1987), Classification, seasonality and persistence of low-
frequency atmospheric circulation patterns, Mon. Weather Rev., 115, 1083-1126.
Bendat, J.S., and A.G. Piersol (1966), Measurement and Analysis of Random Data, 390 pp., John
Wiley, Hoboken, N. J.
Briffa, K.R., and T.J. Osborn, (2002), Blowing hot and cold, Science, 295, 2227-2228.
Cassou, C., and L. Terray (2001), Oceanic forcing of the wintertime low-frequency atmospheric
variability in the North Atlantic European sector: a study with the APREGE model, J. Clim., 14,
4266-4291.
Christensen, J.H., and O.B. Christensen (2003), Severe summertime flooding in Europe, Nature,
421, 805-806.
Colman, A., and M. Davey (1999), Prediction of summer temperature, rainfall and pressure in
Europe from preceding winter North Atlantic ocean temperature, Int. J. Climatol., 19, 513-536.
18
Drevillon, M., L. Terray, P. Rogel, and C. Cassou (2001), Mid latitude Atlantic SST influence on
European climate variability in the NCEP reanalysis, Clim. Dyn., 18,
doi:10.1007/s003820100178.
Huffman, G.J., and coauthors (1997), The Global Precipitation Climatology Project (GPCP)
combined precipitation dataset, Bull. Amer. Meteorol. Soc., 78, 5-20.
Hurrell, J.W. (1995), Decadal trends in the North Atlantic oscillation: Regional temperature and
precipitation, Science, 269, 676-679.
Hurrell, J.W., and C.K. Folland (2002), A change in the summer atmospheric circulation over the
North Atlantic, CLIVAR Exch., 7(3-4), 52-54.
Kalnay, E., Kanamitsu, M., Kistler, R., Collins, W., Deaven, D., Gandin, L., Iredell, M., Saha, S.,
White, G., Wollen, J., Zhu, Y., Chelliah, M., Ebisuzaki, W., Higgins, W., Janowiak, J., Mo, K. C.,
Ropelewski, C., Wang, J., Leetma, A., Reynolds, R., Jenne, R. and D. Joseph (1996), The
NCEP/NCAR 40-year reanalysis Project. Bull. Amer. Met. Soc., 77, No. 3, 437-471.
Kerr, R.A. (2000), A North Atlantic climate pacemaker for the centuries, Science, 288, 1984-
1985.
Koenigk, T., and U. Mikolajewicz (2008), Seasonal to interannual climate predictability in mid
and high northern latitudes in a global climate model, Clim. Dyn., 28, doi:10.1007/s00382-008-
0419-1.
Koster, R.D., and M.J. Suarez (1995), Relative contributions of land and ocean processes to
precipitation variability, J. Geophys. Res., 100, D7, 13775-13790.
19
Koster, R.D., and coauthors (2004), Regions of strong coupling between soil moisture and
precipitation, Science, 305, 1138-1140.
Lenderink, G., A. van Ulden, B. van den Hurk, and E. van Meijgaard (2007), Summertime
interannual temperature variability in an ensemble of regional model simulations: analysis of
surface energy budget, Clim. Change, 81, 233-247.
Marsh, T. J. and J. Hannaford (2007), The summer 2007 floods in England and Wales - a
hydrological appraisal. Centre for Ecology & Hydrology. 32pp.
North, G.R., T.L. Bell, and R.F. Calahan (1982), Sampling errors in the estimation of empirical
orthogonal functions, Mon. Wea. Rev., 110, 699-706.
Ogi, M., K. Yamazaki, and Y. Tachibana (2005), The summer northern annular mode and
abnormal summer weather in 2003, Geophys. Res. Lett., 32, L04706.
Pal, J.S., F. Giorgi, and X. Bi (2004), Consistency of recent European summer precipitation trends
and extremes with future regional climate projections, Geophys. Res. Lett., 31, L13202.
Pauling, A., J. Luterbacher, C. Casty, and H. Wanner (2006), Five hundred years of gridded high-
resolution precipitation reconstructions over Europe and the connection to large-scale circulation,
Clim. Dyn., 26, doi:10.1007/s00382-005-0090-8.
Portis, D.H., J.E. Walsh, M. El Hamly, and P.J. Lamb (2001), Seasonality of the North Atlantic
Oscillation, J. Clim., 14, 2069-2078.
Qian, B., H. Xu, and J. Corte-Real (2000), Spatial-temporal structures of quasi-periodic
oscillations in precipitation over Europe, Int. J. Climatol., 20, 1583-1598.
20
Rodwell, M.J., and C.K. Folland (2002), Atlantic air-sea interaction and seasonal predictability,
Q. J. R. Meteorol. Soc., 128, 1413-1443.
Seneviratne, S.I., D. Lüthi, M. Litschi, and C. Schär (2006), Land-atmosphere coupling and
climate change in Europe, Nature, 443, 205-209.
Schär, C., D. Lüthi, and U. Beyerle (1999), The soil-precipitation feedback: a process study with a
regional climate model, J. Climate, 12, 722-741.
Schär, C., D. Lüthi, and U. Beyerle (2004), The role of increasing temperature variability in
European summer heatwaves, Nature, 427, 332-336.
Sutton, R.T., and D.L.R. Hodson (2005), Atlantic ocean forcing of North American and European
summer climate, Science, 309, 115-118.
Trenberth, K.E. (1999), Atmospheric moisture recycling: Role of advection and local evaporation,
J. Climate, 12, 1368-1381.
Trenberth, K.E., A. Dai, R.M. Rasmussen, and D.B. Parsons (2003), The changing character of
precipitation, Bull. Am. Meteorol. Soc., 84, 1205-1217.
Vidale, P.L., D. Lüthi, R. Wegmann, and C. Schär (2007), European summer climate variability
in a heterogeneous multi-model ensemble, Clim. Change, 81, 209-232.
von Storch, H., and A. Navarra (1995), Analysis of Climate Variability, 334 pp., Springer-Verlag,
New-York.
Wibig, J. (1999), Precipitation in Europe in relation to circulation patterns at the 500 hPa level,
Int. J. Climatol., 19, 253-269.
21
Wilks, D.S. (1995), Statistical Methods in the Atmospheric Sciences, 467 pp., Academic, San
Diego, Calif.
Yu, L., and R.A. Weller (2007), Objectively analyzed air-sea heat fluxes for the global ice-free
oceans (1981-2005), Bull. Amer. Meteorol. Soc., 88, 527-539.
Yu, L., R.A. Weller, and B. Sun (2004), Improving latent and sensible heat flux estimates for the
Atlantic Ocean (1988-99) by a synthesis approach, J. Climate, 17, 373-393.
Zolina, O., C. Simmer, A. Kapala, and S. Gulev (2005), On the robustness of the estimates of
centennial-scale variability in heavy precipitation from station data over Europe, Geophys. Res.
Lett., 32, L14707, doi: 10.1029/2005GL023231.
Zveryaev, I.I. (2004), Seasonality in precipitation variability over Europe, J. Geophys. Res., 109,
D05103, doi:10.1029/2003JD003668.
Zveryaev, I.I. 2006. Seasonally varying modes in long-term variability of European precipitation
during the 20th century. J. Geophys. Res. 111, D21116, doi: 10.1029/2005JD006821.
Table Captions
Table 1. Correlation coefficients between PC-1 and PC-2 of summer, June, July and August
precipitation, and indices of teleconnection patterns. Coefficients, shown in bold, are statistically
significant at the 95% significance level.
Table 2. Correlation coefficients between PC-1 and PC-2 of July SLP, 500hPa fields, and
precipitation, and indices of teleconnection patterns. Coefficients, shown in bold, are statistically
significant at the 95% significance level.
22
Table 3. Correlation coefficients between PC-1 and PC-2 of July precipitation, and evaporation
in different regions. Coefficients, shown in bold, are statistically significant at the 95%
significance level.
Figure Captions Figure 1. Spatial patterns of the first two EOF modes of the summer mean (a, b), June (c, d),
July (e, f) and August (g, h) GPCP precipitation (1979-2006). Red (blue) color indicates positive
(negative) values.
Figure 2. Principal components of the first two EOF modes of the summer mean (a, b), June (c,
d), July (e, f) and August (g, h) GPCP precipitation (1979-2006). Blue (green) curves depict the
NAO (SCA) index.
Figure 3. Spatial patterns of the first two EOF modes of July 500hPa (a, b) and SLP (c, d) fields
(1979-2006). Red (blue) color indicates positive (negative) values.
Figure 4. Spatial patterns of the first two EOF modes of July evaporation in the Baltic Sea –
North Sea region (1979-2006). Red (blue) color indicates positive (negative) values.
Figure 5. Spatial patterns of the first two EOF modes of July evaporation from the surface of
Mediterranean Sea (1979-2006). Red (blue) color indicates positive (negative) values.
Figure 6. Spatial patterns of the first two EOF modes of July evaporation from the European
land surface (1979-2006). Red (blue) color indicates positive (negative) values.
23

24
Table 1. Correlation coefficients between PC-1 and PC-2 of summer, June, July and August
precipitation, and indices of teleconnection patterns. Coefficients, shown in bold, are statistically
significant at the 95% significance level.
Summer June July August
PC-1 PC-2 PC-1 PC-2 PC-1 PC-2 PC-1 PC-2NAO 0.67 0.14 0.68 0.48 0.50 -0.12 0.63 0.04SCA 0.10 0.30 -0.16 0.76 -0.21 0.65 -0.26 0.49 Table 2. Correlation coefficients between PC-1 and PC-2 of July SLP, 500hPa fields, and
precipitation, and indices of teleconnection patterns. Coefficients, shown in bold, are statistically
significant at the 95% significance level.
SLP 500hPa
PC-1 PC-2 PC-1 PC-2PRE PC-1 0.85 -0.31 0.91 0.23 PRE PC-2 0.15 0.17 -0.16 -0.09NAO 0.73 0.04 0.49 -0.07EAWR 0.13 0.74 0.24 0.72 Table 3. Correlation coefficients between PC-1 and PC-2 of July precipitation, and evaporation
in different regions. Coefficients, shown in bold, are statistically significant at the 95%
significance level.
N. Atlantic Baltic Mediterranean Europe Europe
Precip. EVA1 EVA2 EVA1 EVA2 EVA1 EVA2 EVA1 EVA2 PRE1 -0.14 *** 0.04 0.48 0.43 -0.42 0.78 0.34 PRE2 0.10 *** -0.16 0.17 -0.21 0.23 -0.26 0.30
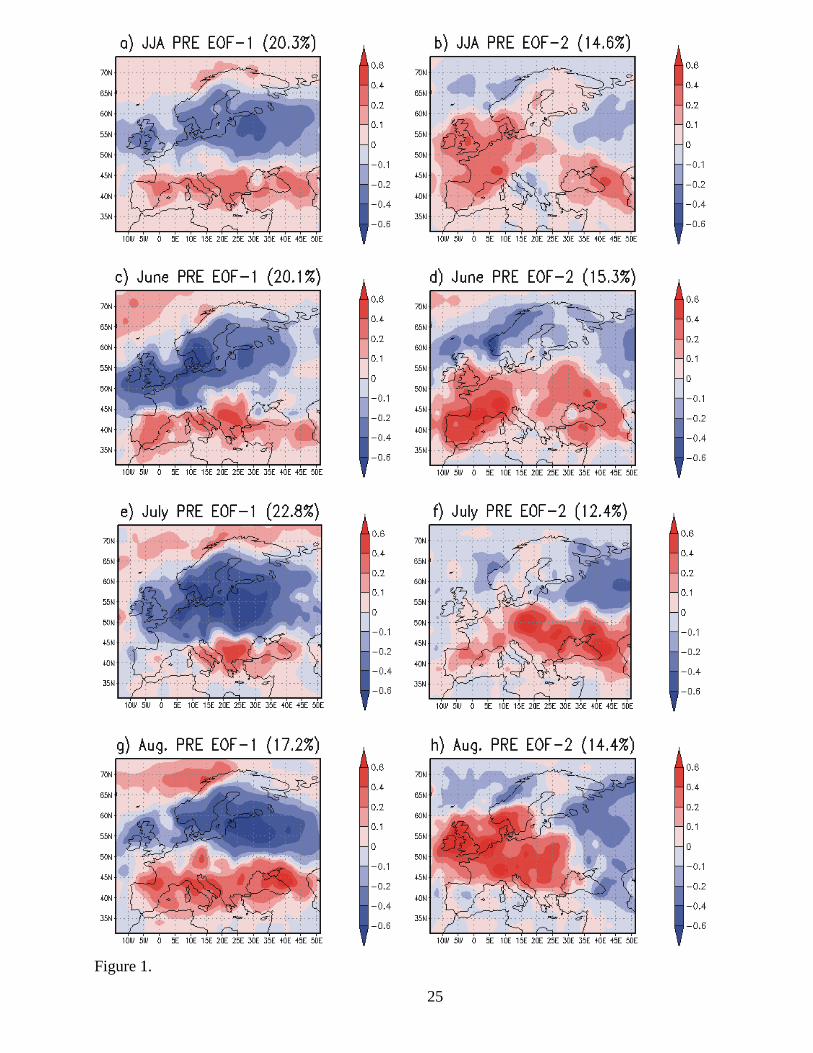
Figure 1.
25
1975 1980 1985 1990 1995 2000 2005 2010-3
-2
-1
0
1
2
1975 1980 1985 1990 1995 2000 2005 2010-3
-2
-1
0
1
2
1975 1980 1985 1990 1995 2000 2005 2010-3-2-10123
1975 1980 1985 1990 1995 2000 2005 2010-3-2-10123
1975 1980 1985 1990 1995 2000 2005 2010-3-2-10123
1975 1980 1985 1990 1995 2000 2005 2010-2
-1
0
1
2
3
1975 1980 1985 1990 1995 2000 2005 2010-3-2-10123
1975 1980 1985 1990 1995 2000 2005 2010-3-2-10123
a) JJA PRE PC-1 b) JJA PRE PC-2
c) June PRE PC-1 d) June PRE PC-2
e) July PRE PC-1 f) July PRE PC-2
g) August PRE PC-1 h) August PRE PC-2
Figure 2.
26
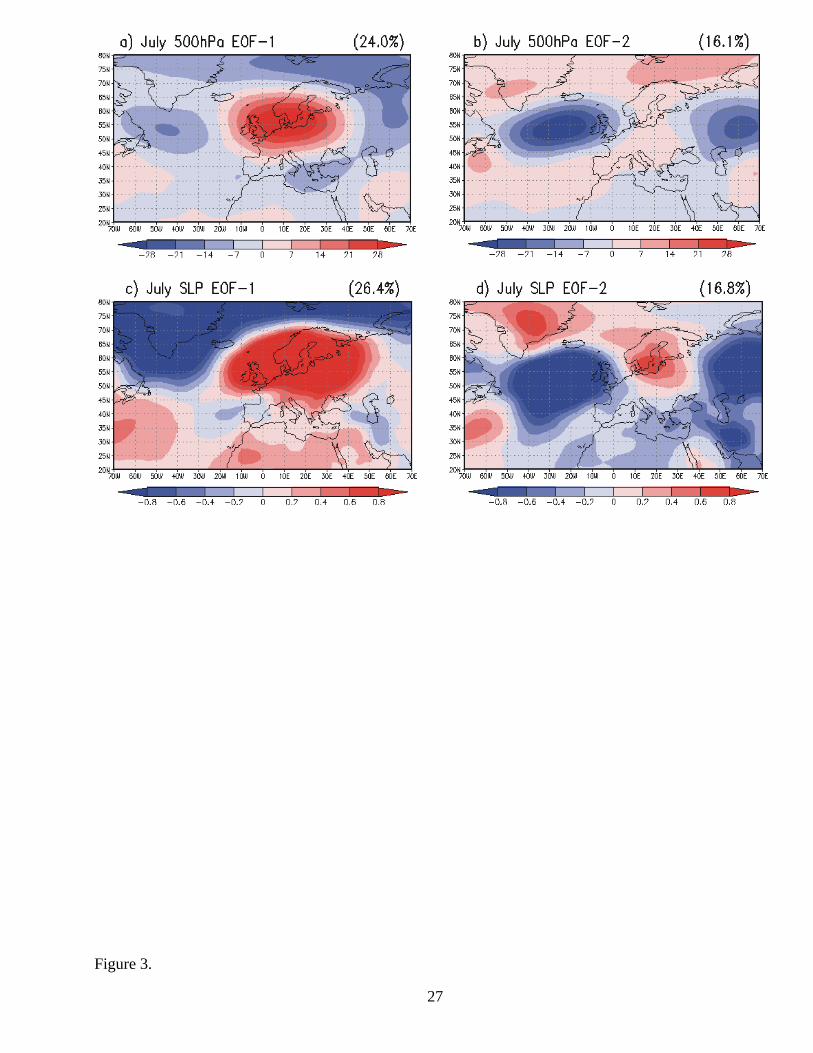
Figure 3.
27
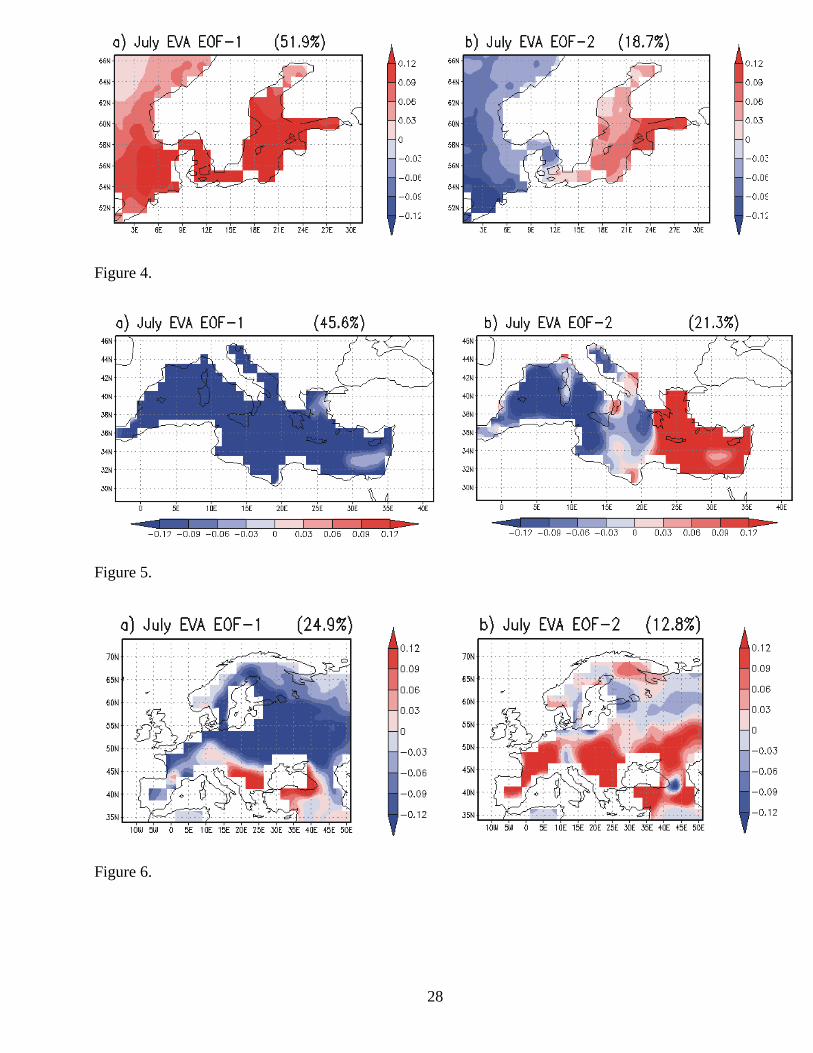
Figure 4.
Figure 5.
Figure 6.
28