climate-smart agriculture in kenya - world...
TRANSCRIPT

1
Climate-Smart Agriculture in Kenya Supplementary Material This publication is a product of the collaborative effort between the International Center or Tropical Agriculture (CIAT) – lead Center of the CGIAR Research Program on Climate Change, Agriculture and Food Security (CCAFS) – and the World Bank to identify country-specific baselines on CSA in Africa (Kenya and Rwanda), Asia (Sri Lanka), and Latin America and the Caribbean (Nicaragua and Uruguay). The document was prepared under the co-leadership of Andrew Jarvis, Andreea Nowak, and Caitlin Corner-Dolloff (CIAT), and Marc Sadler, Vikas Choudhary, and Ladisy Komba Chengula (World Bank). The main authors of this profile are Dorothy A. Amwata (South Eastern Kenya University) and Andreea Nowak (CIAT), and the team was comprised of Caitlin Corner-Dolloff (CIAT), Miguel Lizarazo (CCAFS), and Elizabeth Minchew (CIAT-Consultant). This document should be cited as: World Bank; CIAT. 2015. Climate-smart agriculture in Kenya. CSA Country Profiles for Africa, Asia, and Latin America and the Caribbean Series. Washington D.C.: The World Bank Group. Acknowledgements Special thanks to the institutions that provided information for this study: James Kinyangi (Climate Change and Agriculture East Africa, Maren Radeny, Victor Orindi, Dickson Nyariki (South Eastern Kenya University), Jecinta Kimiti (South Eastern Kenya University), Michael Okoti (KARI), Joab Osumba (FICCF), Evans Kituyi (IDRC), Esther Magambo (MoA), Robin Mbae (Ministry of Livestock), Gilbert Ouma (University of Nairobi), Stephen Kinguyu (MWMR), and Francis Opiyo (DDC, UNDP). This profile has benefited from comments received from Ademola Braimoh and Neeta Hooda (World Bank), Evan Girvetz (CIAT-Kenya), and Sabrina Chesterman (ICRAF).

2
Annex I: Acronyms ABMS Activity Baseline and Monitoring Survey ACT African Conservation Tillage AgGDP Agricultural Gross Domestic Product AREHF African real estate housing Finance ARM Athi River Mining ASALs Arid and semi-arid Lands ASDS Agriculture Sector Development Support Programme CBPP Contagious Bovine Pleuro-Pneumonia CBS Central Bureau of Statistics CCPP Contagious Caprine Pleuro-Pneumonia CIC Climate Innovation Centre COP Conference of Parties CSA Climate Smart Agriculture CTP Climate Technology Programme DTMA Drought Tolerant Maize for Africa EADD East Africa Dairy Development ECF East Coast Fever FAO Food and Agriculture Organization of the United Nations GDP Gross Domestic Product GHG Greenhouse gas GoK Government of Kenya GVEP Global Village Energy Partnership ICCA Institute of Climate Change Adaptation IFDC International Fertilizer Development Centre ISFM Integrated Soil Fertility Management KALRO Kenya Agricultural and Livestock Research Organization KCCWG Kenya Climate Change Working Group KIRDI Kenya Industrial Research and Development Institute KNBS Kenya National Bureau of Statistics MALF Ministry of Agriculture Livestock and Fisheries MDG Millennium Development Goals NCCAP National Climate Change Action Plan OPM Office of the Prime Minister PWC PriceWaterhouse Coopers SALM Sustainable Agricultural Land Management SBSTA Subsidiary Body for Scientific and Technological Advice STAK Seed Traders Association of Kenya USDA United States Department of Agriculture UTaNRMP Upper Tana Catchment Natural Resource Management WEMA Water Efficient Maize for Africa WFP United Nations World Food Programme

3
Annex II: Agriculture sub-sectors in Kenya The contribution of agriculture to GDP showed an upward trend from 27.8% to 29.3 % in 2013, but with a decline (27.3 %) in 2014 (World Bank, 2014; Trade Economics, 2014). The decline noted in 2014 was as a result of low and unreliable long and short rains. The Sector’s real gross value-added growth decelerated in 2013 to 2.9 % from a revised growth of 4.2 % in 2012 (World Bank, 2008-2014). The lowest agricultural GDP rate and value-added agricultural GDP was noted in 2008, a period during which Kenya experienced the post- election violence following the country’s 2007 general elections.
Graphic 1: Agricultural and GDP Growth in Kenya. Source: World Bank (2014)
Graphic 2: Trends in agricultural land in Kenya (2008-2013). Sources: FAO (2012); IRIN (2012) and WDI (2014)
0
10
20
30
40
50
60
2008 2009 2010 2011 2012 2013
Agricultural land (% of land area) Arable land (% of land area)

4
The agriculture sector is comprised of three sub-sectors – crops, livestock and fisheries – which contribute about 78%, 20% and 2% to the agricultural GDP (AgGDP), respectively (GoK, 2007). In the crop sub-sector, apart from rice and wheat, most cereal crops recorded significant declines in production during the 2008 to 2012 period. Consecutive years of below-average rainfall that have resulted in 2011 being one of the driest years since 1950 (Amwata et al., 2015). Have contributed to declines in agriculture yields. As a consequence of, in 2011, about 3.5 million people have been declared food insecure in Kenya, with significant numbers facing catastrophic conditions. For example, maize production declined from 39.7 million bags in 2012 to 38.9 million bags in 2013. Similarly, the 2013/2014 maize harvest fell drastically short of the projected figure of 43.4 million bags, reaching just 28.9 million bags (USDA, 2014; The East African, 2013). This decline of 33.4% was attributed to low rainfall levels. Hence, food supply in Kenya has been heavily dependent on imports. Every year Kenya imports between 10% and 40% of its maize, depending on the annual production (Short et al., 2013). These stagnations and declines in cereal yields have followed the trends in the Sub-Saharan Africa (SSA) region. These have stagnated at slightly above 1 ton per hectare, whereas in other low income countries around the world agricultural productivity is at 2 ton/ha/yr.; the world average is about 3.5 tons/ha/yr. The total productivity in SSA has grown by only about 50% in the last 25 years. However, the performance of crops was boosted by the higher output of rice paddy and wheat, which increased by 6,908.1 tonnes and 31,797 tonnes respectively within the same period. The contribution of these major crops to AgGDP has steadily increased from 23.8% in 2010 to 25.3% in 2013, yet the volumes marketed over time have been inconsistent as depicted by both downward and upward trends. The crop sub-sector is further categorised into three sub-sub-sectors: i) industrial crops that contribute 17% of the AgGDP and 55% of agricultural exports; ii) horticulture, which has recorded a remarkable export-driven growth in the past five years and is now the largest sub-sub-sector, contributing about 33% of the AgGDP and 38% of export earnings; and iii) food crops that contribute about 32% of the AgGDP and 0.5% of exports earnings. Horticulture is the largest sub-sub-sector, contributing 33% of the AgGDP and 38% of export earnings in 2010, accounting for 65% of total Kenya’s export earning valued at Ksh. 71.6 billion. The volume of fresh horticultural exports increased from 205.7 thousand tonnes in 2012 to 213.8 thousand tonnes in 2013. Thus, horticulture has enjoyed a steady growth of 10% to 14%, with the value of exports growing by an average of 16% (GoK, 2014). Livestock support livelihoods and the animal resource industry (livestock, wildlife, farmed wildlife, companion and aquatic animals) contributes 22% of the national GDP.
5
Improvements in animal genetics, control of trade-sensitive diseases, value-addition of livestock produce and increased access to markets have greatly increased the industry’s performance. In addition, the fisheries sub-sector production is estimated at 150,000 MT annually and it contributes about 0.5% of the National GDP (GoK, 2010b), which is valued at Kshs 8 billion at ex-vessel price.

6
Annex III: Kenya’s farming systems The most important agricultural regions are located in the Central, Western and Rift Valley areas. The farming systems in the country are primarily rain-fed and small-scale, where farmers own land averaging between 0.3 to 3 hectares in size (RoK, 2010), contributing about 75% of total agricultural output produced on rain-fed agricultural lands (RoK, 2012a). These farming systems can be categorized as 1) small scale integrated crop-livestock/fish-tree farming systems; 2) crop-tree systems; 3) crop-livestock tree systems; 4) rice-fish integrated systems and 5) fish-poultry systems. Livestock is kept under smallholder zero-grazing systems, an intensive livestock production system involving the “cut and-carry” method of feed management. This system is characterized by ownership of one to two dairy livestock units and is found in many parts of medium to high agro-ecological potential areas and by the growing of coffee, tea and/or potato [9] (Osumba and Rioux, 2014). The smallholder mixed crop-livestock system, with maize-based dairy production with or without cash crops, extends across 30% to 35% of the country’s land area and is characterized by drought- tolerant and fast maturing livestock (beef, small ruminants) and crops (pigeon peas, cowpeas, dolicos, sorghum, millet, cassava and sweet potatoes). The large-scale mixed crop-livestock-tree farming system, which covers over 80% of the country’s land area, takes two forms, the first being private or government-owned ranches that are commercially well-equipped and use modern technology. Improved dairy herds grazed on improved pastures are common in this system in Kenya, with fodder conservation and supplementary feeds used to varying degrees. Pasture-legume mixtures, hay and purchased feed are commonly used as well. The second form includes extensive livestock production systems where crops are grown along the river valleys and livestock herd sizes are large due to communal grazing systems, and there is low use of purchased inputs like feed, drugs and artificial insemination (ASAL, 2012).

7
Annex IV: Fertilizer consumption
Graphic 3: Fertilizer consumption in Kenya and sub-Saharan Africa (Excluding South Africa (2006-2015). Source: FAO (2015)
Graphic 4: Fertilizer consumption in Kenya by different crops (2001/2002-2009). Source: Ministry of Agriculture Farm Input Division (2010)

8
Annex V: Climate change impacts on agriculture The mean annual temperature has increased by 1.0°C since 1960 with an increase of 0.21°C per decade. This increase in temperature has been most rapid in MAM (0.29°C per decade) and slowest in JJAS (0.19°C per decade). The daily temperature observations show significantly increasing trends in the frequency of hot days1, and much large increasing trends in the frequency of hot nights. The average numbers of ‘hot’ days have increased by 57 between 1960 and 2003. The rate of increase is most strongly in MAM when the average number of hot days has increased by 5.8 days per month (an additional 18.8% of MAM days). The mean numbers of ‘hot’ nights per year have increased by 113 within the same period. The rate of increase is stronger in SON, where the average number of hot SON nights has increased by 12 days per month over this period. Similarly, the average number of ‘cold ‘days per year has decreased by 16 (4.4% of days) between 1960 and 2003. This rate of decrease is most rapid in SON when the average number of cold SON days has decreased by 1.8 days per month over this period. The average number of ‘cold’ nights per year has decreased by 42 (11.5% of days).This rate of decrease is most rapid in DJF when the average number of cold DJF nights has decreased by 3.5 nights per month (11.4% of DJF nights) over this period (Ojwang’ et al., 2010)1. Projections shows that the mean annual temperatures in the country are expected to increase by 1-2.8°C by the 2060s, and 1.3-4.5°C by the 2090s (IPCC, 2007). This will be accompanied by an increase in mean annual rainfall by up to 48%, with the increase in the total rainfall greatest from October to December while the proportional change is largest in January and February. The regional variation within Kenya means that rainfall increases are expected to be concentrated from the Lake Victoria region to the central highlands east of the Rift Valley. The eastern and northern arid and semi-arid lands (ASAL) are expected to see an overall decrease in precipitation due to climate change (Ojwang’ et al., 2010). The climate projection for the ASAL of Kenya may include longer and more frequent dry periods interspersed with intense but shorter and unpredictable periods of rainfall. Such weather patterns are likely to deplete water and pasture resources, leading to natural resource scarcity (GoK, 2007)2.
1 Ojwang’ G.O., Agatsiva, J and Situma, C. 2010. Analysis of Climate Change and Variability Risks in the Smallholder Sector: Case studies of the Laikipia and Narok Districts representing major agro-ecological zones in Kenya. FAO, Rome, Italy. 2 Government of Kenya, (GOK) .2007. Kenya Vision 2030. Ministry of State for Planning National Development and Vision 2030. Nairobi: Kenya Government Printers.

9
Figure 1: Observed and projected changes in precipitation and temperature in Kenya (1975, 2025). Source: USAID, 2010

10
Figure 2: Projected impacts of climate change on main crops in Kenya by 2030.
Source: Tegemeo Institute (2010),)

11
ANNEX VI: Selection of important production systems in Kenya
Identifying the main production systems key for food security in the country requires an understanding of the complex interaction between social, economic and environmental factors at national and subnational levels, apart from the spatial and agro-ecological heterogeneity that can be found regionally. This means that the importance of a production system varies both within a country and between countries. In order to account for this variability, the study departed from a methodology developed by CIAT (2014) to identify and prioritize productions systems key for food security in a given country, based on a set of indicators such as: harvested area, variation in production, net production value (NPV), contribution to agricultural gross domestic product (AgGDP), contribution to national gross domestic product (GDP), and calories intake. These indicators help establish the relevance of the production system for the country’s economy and food security. Below we discuss more in detail these sub-indicators. Harvested area (ha): indicates the total cultivated area for the production system. For livestock systems look at pastures. The indicator is calculated as a five-year average and provides information on which production system is the most prevalent per area and can be interpreted as harvested or simple crop area. Knowledge of harvested area also constitutes an indirect source of information regarding land use for agriculture. Variation in production: this indicator was added to the CIAT (2014) methodology, in order to offer more insights on how the production has varied in the past five years, and the implications this may have on the evaluation of the production systems’ relevance for national economy and food security. The variation in production for each production system was calculated as follows:
(Variation in production) = (Standard deviation) / Average for 5 years in production) Contribution to the agricultural GDP (%) illustrates the importance of the production system in the agricultural sector in each country, and becomes a benchmarking parameter that allows it to be compared against other production systems. To calculate the economic contribution of each production system we used the five-year averages (2005-2009; or the most recent years for which data was available for all the indicators) of the g ross production value (GPV) (constant 2004-2006 USD), the total gross national agricultural output (agricultural GDP) and gross national GDP (National GDP) data for each country. The contribution of each crop to Agricultural GDP (%) was calculated as follows: (Contribution to Ag. GDP) = (gross production value of crop) / (total gross national Ag.
GDP) * 100

12
Contribution to national GDP (%) allows for a benchmark comparison with the rest of the sectors of the national economy. For this indicator, we took into account the five-year average (most recent years). The contribution of each production system to national GDP was calculated as follows:
(Contribution to national GDP) = (gross production value of crop) / (total gross national GDP) * 100
Net production value (USD 2004−2006 USD constant) reflects the importance of each production system in currency value to the economies of the region. For this indicator, we took into account the five-year average (most recent years). Using the following equation, it also becomes an indicator of the volume of production, which can be linked to food security for the case of crops that are considered staple foods or that account for a substantial fraction of the consumption of calories. (Production in tons) = (Net value of production in US$) / (Unit price of tons in US$/ton)
Calorie intake (food supply) (kcal/capita/day) was chosen as the primary indicator of food security as it reflects which production systems are sustaining the population and reducing hunger (food supply). For this indicator, we took into account the five-year average (most recent years). Calorie intake is measured by the FAO at the country level, and is based on national food balance sheets (Headey and Ecker, 2012). In order to then identify the production systems most important for national economy and food security, we then calculated the total score of the production system, based on the average value of each indicator mentioned above. These indicators were weighted, assigning for each a percentage (17%). The production system with the highest score indicated highest importance. Formula: Total score = (NPV * 0.017) + (Contribution to AgGDP * 0.017) + (Contribution to GDP * 0.017) + (Calorie intake* 0.017) + (Harvested area * 0.017) + (Variation in production *
0.017) Since monocultures may present high values in the indicators and skew the results, each indicator was weighted in order to ensure the meaning was not lost. It is important to note that the contribution of a production system to food supply and livelihoods may not be reflected in the specific crop’s regional economic contribution to agricultural production.

13
ANNEX VII: CSA Practices in Kenya For collecting data on CSA practices in the country (types of practices, levels of adoption, climate-smartness scores, etc.) we used several processes and methods described below. Step 1: A first identification and initial listing of practices was carried out through a literature review and consultation of the CSA Compendium (CCAFS and ICRAF, forthcoming), and were determined based on the feasibility of implementing them in the important production systems of the country. The list of practices was then confirmed with criteria from in-country experts (mainly agronomists with experience in the selected production systems or agricultural regions of interest in the country). Step 2: After a first validation of the list of CSA practices identified in the country (and related to the main production systems), experts were then asked to provide, via semi-structured interviews, surveys or focus group discussions, information on where, how, and to what extent the practice is adopted in the country and the production system it is associated with. Step 3: Moreover, experts were also asked to give qualitative evaluations of different components of the ‘climate smartness’ concept for each of the identified practices. For assessing climate-smartness levels of a practice we used categories of indicators (and sub-indicators) related to the management and use of carbon, nitrogen, energy, weather, water and knowledge, using a set of proxies for each to evaluate climate-smartness. We recognize that there are many possible angles to look at when assessing the smartness of a production system, and that this list of categories is not exhaustive. However, we considered them as important entry points for adaptation and mitigation of climate change in the agricultural sector, based on previous work undertaken by Aggarwal et al (2013) as part of CCAFS’ initiative on “Climate-Smart Villages”, a community approach to sustainable agricultural development. We argue that a combination of efficient use and management of water, energy, carbon and nitrogen, combined with efforts to reduce climate risks and to promote local knowledge and social capital when implementing the practice, increase the practice’s likelihood to contribute to goals related to adaptation, mitigation and improved productivity. In order to operationalize the analysis of the practice’s performance in the six categories of interest, we asked experts specific questions that offer insights into the proxies used for carbon-, nitrogen-, energy-, weather-, water- and knowledge- smartness. On a scale from 0 to 5, experts indicated the

14
level of change that the implementation of each practice would bring about, based on knowledge and previous 5 experience with implementing the practice. It is important to note that these indicators and associated questions should not be taken as absolute metrics for assessment, but they should just guide the qualitative assessment of the practice and be adapted to the context of the analysis. Value Potential impact
5 Very high positive change 4 High positive change 3 Moderate positive change 2 Low positive change 1 Very low positive change 0 No change; Not applicable; No data
Table 6: Valuation of potential positive impact of CSA practices
The smartness level of a category is an average of the scores (0-5) obtained in each sub-indicator of the respective category. The climate-smartness dimensions and respective sub-indicators are outlined in the table below.
Table 7: Climate-smartness categories and sub-categories Smartness category
Anticipated change (sub-indicator)
1. Water smartness
1.1. Allows reduction in the volume of water consumption per unit of product (food) (l/kg/ha, l/ha etc.) 1.2. Enhances water quality available for agricultural production (by reducing chemicals, sediments, metals in the water bodies) 1.3. Enhances water and moisture retention in soils (mm/m, %) 1.4. Promotes protection/ conservation of hydric sources (especially headwaters) 1.5. Promotes water capture/ use of rainwater for agricultural production
2. Energy smartness
2.1. Allows for reduced consumption of fossil energy (reflected by savings in fossil fuel combustion, or electric energy consumption [J/kg, J/h, etc.]) 2.2. Promotes the use of renewable energy sources (e.g. wind and/or solar energy, biogas, etc.)
3. Carbon smartness
3.1. Increases above- and below-ground biomass (ton/ha; kg/m2 etc.), This is related to the mitigation pillar in terms of carbon dioxide (CO2) capture (plant biomass, wood etc.). 3.2. Enhances the accumulation of organic matter in soils (soil carbon stock) (Soil Organic Carbon (SOC) or Soil Organic Matter [SOM]: %; kg/ha; g/m3; kg/m3). Refers to the mitigation pillar in terms of CO2 capture (increases in soil Carbon and indirectly improvement of biological and physical soils conditions that impact the greenhouse gas [GHG] emissions.) 3.3. Reduces soil disturbance (reflected in number of hours of tractor labor, application of alternative soil management techniques, etc.). Refers to the mitigation pillar in terms of CO2, reducing carbon emissions (mainly emissions associated with tillage process)

15
3.4. Promotes techniques to better manage the quality of animal diet and/or manure in livestock systems (manure management and animal husbandry mitigation practices, etc.)
4. Nitrogen smartness
4.1. Reduces the need of synthetic nitrogen-based fertilizers (e.g. kg/ha/year) 4.2. Reduces nitrous oxide (N2O) emissions (by adopting better techniques of fertilizers use and soil management practices). Reflected in, for instance, reductions in number of grams of N2O/m2/year.
5. Weather smartness
5.1. Minimizes negative impacts of climate hazards (such as soil degradation, effects of flood or prolonged drought events among others). 5.2. Helps prevent climatic risks (refers to practices that allow farmers be more prepared to mitigate climate risks, such as water reservoirs, early warning systems, heat/, water stress- pests- and diseases- tolerant/ resistant varieties, etc.)
6. Knowledge smartness
6.1. Allows rescuing or validates local knowledge or traditional techniques.
Step 4: Experts were then asked to provide qualitative evaluations of the impacts of each practice on the CSA pillars - adaptation, mitigation and productivity. This was complemented with information from a literature review. Step 5: Then we identified high-interest practices, based on total climate-smartness score and adoption level of the practice, as following:
1. A detailed list of all practices identified in the country was compiled. The practices were ordered by value obtained in the climate-smartness assessment (highest values first);
2. The first quintile of the list, (the 20% highest values of the list) was identified. For instance, if the list includes 50 practices, identify the top 10 with highest smartness score.
3. Practices in the first quintile with low adoption level were then highlighted.
4. The high-interest practices will then be those practices with high smartness values and low adoption rates.
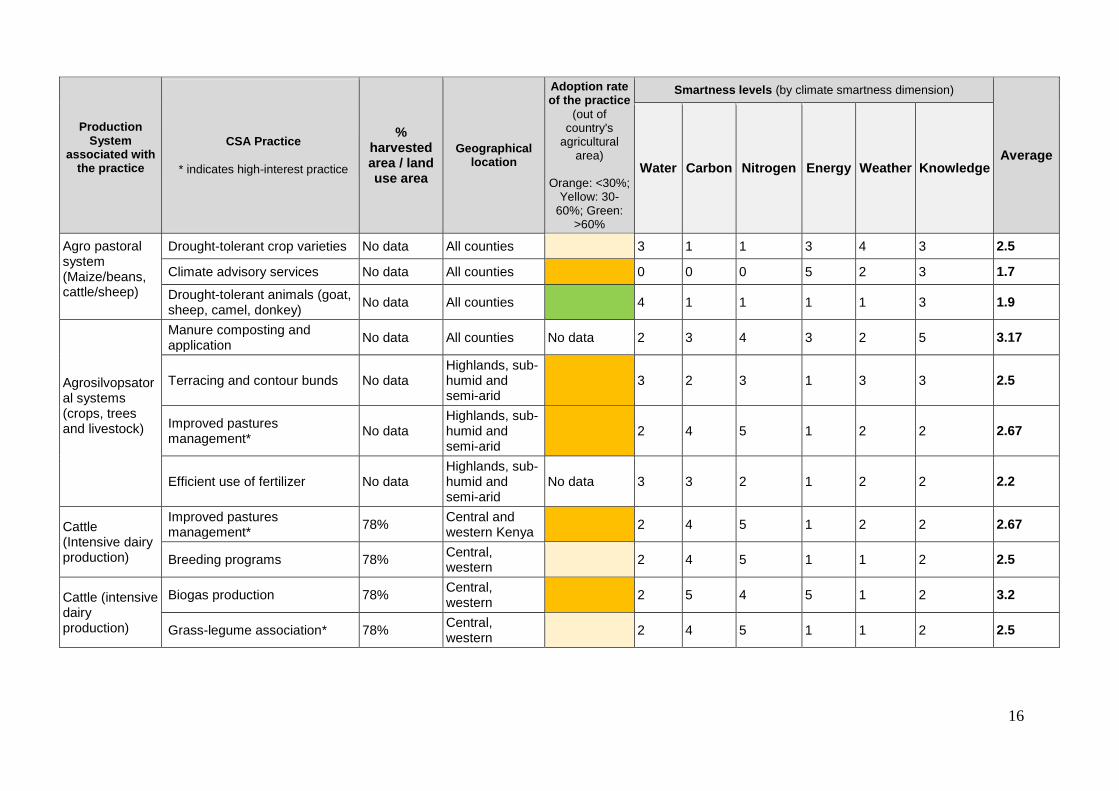
Step 6: From the literature review and expert consultations we also identified challenges and barriers to adoption and/or scaling out of the identified CSA practices, related to policies, institutions, finances, etc. Step 7 : We then studied the implementation of a CSA practice into more detail, by means of a case study. The table below illustrates a detailed list of practices identified in Kenya.
16
Production System
associated with the practice
CSA Practice
* indicates high-interest practice
% harvested area / land use area
Geographical location
Adoption rate of the practice
(out of country's
agricultural area)
Orange: <30%;
Yellow: 30-60%; Green:
>60%
Smartness levels (by climate smartness dimension)
Average Water Carbon Nitrogen Energy Weather Knowledge
Agro pastoral system (Maize/beans, cattle/sheep)
Drought-tolerant crop varieties No data All counties 3 1 1 3 4 3 2.5
Climate advisory services No data All counties 0 0 0 5 2 3 1.7
Drought-tolerant animals (goat, sheep, camel, donkey)
No data All counties 4 1 1 1 1 3 1.9
Agrosilvopsatoral systems (crops, trees and livestock)
Manure composting and application
No data All counties No data 2 3 4 3 2 5 3.17
Terracing and contour bunds No data Highlands, sub- humid and semi-arid
3 2 3 1 3 3 2.5
Improved pastures management*
No data Highlands, sub- humid and semi-arid
2 4 5 1 2 2 2.67
Efficient use of fertilizer No data Highlands, sub- humid and semi-arid
No data 3 3 2 1 2 2 2.2
Cattle (Intensive dairy production)
Improved pastures management*
78% Central and western Kenya
2 4 5 1 2 2 2.67
Breeding programs 78% Central, western
2 4 5 1 1 2 2.5
Cattle (intensive dairy production)
Biogas production 78% Central, western
2 5 4 5 1 2 3.2
Grass-legume association* 78% Central, western
2 4 5 1 1 2 2.5

17
Production System
associated with the practice
CSA Practice
* indicates high-interest practice
% harvested area / land use area
Geographical location
Adoption rate of the practice
(out of country's
agricultural area)
Orange: <30%; Yellow: 30-
60%; Green: >60%
Smartness levels (by climate smartness dimension)
Average Water Carbon Nitrogen Energy Weather Knowledge
Cattle (meat and milk)
Hay-making and silage 78% Central, Eastern and Rift valley
3 1 4 1 2 2 2.2
Cattle (meat and milk) (Semi-extensive dairy production)
Grass-legume association 78% Semi-arid, Eastern Kenya,
2 4 5 1 1 2 2.5
Cattle (milk) Improved forage-based feeding 78% Central and Western Kenya
3 2 2 1 4 2 2.33
Cereal/ legume (beans, pigeon peas, cowpeas)
Intercropping No data Semi-arid 4 3 5 3 3 4 3.67
Drought-tolerant crop varieties No data Semi-arid 3 1 1 3 4 3 2.5
Terracing and contour bunds No data semi-arid 3 2 3 1 3 3 2.5
Maize Manure Highlands, sub-humid areas
No data 3 3 2 1 2 2 2.2
Maize and sorghum
Manure composting and application*
No data All regions 2 3 4 3 2 5 3.2
Maize, beans, coffee
Terracing and contour bunds* No data East, West, Center
3 2 3 1 3 3 2.5
Maize/ beans
Intercropping No data West, East 4 3 5 3 3 4 3.7
Conservation agriculture* No data West, East 4 5 5 2 3 3 3.7
Manure composting and application
No data West, East No data 2 3 4 3 2 5 3.2

18
Production System
associated with the practice
CSA Practice
* indicates high-interest practice
% harvested area / land use area
Geographical location
Adoption rate of the practice
(out of country's
agricultural area)
Orange: <30%; Yellow: 30-60%; Green: >60%
Smartness levels (by climate smartness dimension)
Average Water Carbon Nitrogen Energy Weather Knowledge
Maize/ beans, cowpeas, pigeon peas cotton, sunflower, soybean, groundnuts
Crop rotation No data
Coast, central, Kisii highlands, western, eastern and Uasin Gishu and Kericho counties
3 3 5 2 3 3 3.2
Maize/ coffee/ tea/ pyrethrum
Intercropping No data Central and semi-arid areas
4 3 5 3 3 4 3.7
Mulching* No data Central and semi-arid areas
No data 2 3 2 3 4 3 2.8
Manure Central and semi-arid areas
No data 3 3 2 1 2 2 2.2
Maize/ sorghum, trees
Alley cropping No data Semi-arid 2 3 5 1 2 2 2.5
Mono-cropping
Water-efficient irrigation techniques
0.1% Eastern Kenya 4 3 0 2 4 2 2.5
Crop rotation 0.1% Eastern Kenya 3 3 5 2 3 3 3.2
Efficient use of fertilizer 0.1% Eastern Kenya No data 3 3 2 1 2 2 2.2
Mulching 0.7 Kericho, Central 2 3 2 3 4 3 2.8
Manure composting and application
0.7 Kericho, Central No data 3 3 2 1 2 2 2.2
Climate advisory services 0.7 Kericho, Central 0 0 0 5 2 3 1.7

19
Annex VIII: Legislative frameworks and policies in Kenya The Constitution of Kenya (2010) provides for the Agricultural policy as a function of the National Government and devolves key components of agriculture including crop and animal husbandry, plant and animal disease control and fisheries. In line with CSA principles, the Constitution affirms the right of every person to be free from hunger and to have food of acceptable quality. This is achieved through promotion of sustainable approaches to natural resource management, establishes the right to food security and to live in a clean and healthy environment, while ensuring sustainable and productive management of land resources. It allows for devolution of agriculture services to local level thus providing opportunities for CSA. The Farm Forestry Rules (2009) require farmers to establish and maintain farm forestry (e.g. woodlots or trees on farms) on at least 10% of every agricultural land holding. Likewise, species of trees or varieties planted must not have adverse effects on water sources, crops, livestock, soil fertility and the neighbourhood and must not be of invasive nature. Moreover, agriculture authorities at the district (now county) level are required to identify land at risk of degradation and establish measures necessary for ensuring its conservation including planting of trees. Kenya Vision 2030 recognizes the significance of agriculture to its goal of achieving an average GDP growth rate of 10% per year up to the year 2030 resulting in reduction of hunger and poverty. Approaches to tackle these issues include: i) increasing productivity of agricultural enterprises; ii) better policies for land use and natural resources management, for example, developing more irrigable land regions for crop and livestock production; iii) improving market access and marketing through improved supply chains; and iv) adding value to agricultural products before exposing them to local and international markets. It is expected that these endeavours will create a knowledge-based society enjoying a high quality of life. Agriculture is expected to contribute to all these issues through the Agricultural Sector Development Strategy (ASDS 2010-2020) focuses on transforming smallholder agriculture from low-productivity subsistence activities, to a more innovative agribusiness enterprise operationalized through a five year Medium Term Plans (MTPs), the current one MTP (2013 to 2017) that emphasizes on devolution, socio economic development, equity and national unity. Sectoral Policies The National Irrigation Policy (draft) (2014) aims to expand land under irrigation; increase agricultural water harvesting and storage capacities; promote water harvesting, use of waste water, and exploitation of groundwater for irrigation; build capacity for generation and utilization of irrigation research, innovation and technology; and promote and adopt an integrated approach to sustainable commercial irrigation farming. The National Climate Change Response Strategy (NCCRS) (2010) acts as a framework for integrating climate concerns into government development priorities, planning and budgeting. Both the NCCRS and the NCCAP view agriculture as the most weather-dependent sector of the Kenyan economy, and as the one which will “bear the brunt” of climate change and variability. With a fully developed NC government CRS, Kenya may be the first country in Africa to establish an independent climate change authority that

20
will guide the implementation of a strategy of this kind (Chonghaile, 2012). Agriculture is one of the major sectors of focus in Kenya’s NCCRS, identifying substantial needs for adaptation and mitigation. The adaptation measures suggested for agriculture in NCCRS include: changes in land use or activities, changes of location, restoration of degraded ecosystems, provision of downscaled weather information and farm inputs, water harvesting for irrigation, protection of natural resource base (soil and water conservation techniques), research and dissemination of superior (drought tolerant, salt-tolerant, pest and disease resistant) crops. The National Climate Change Action Plan 2013-2017 (2012) suggests a low-carbon climate resilient development pathway for the economy. It highlights the priority actions for planning in key climate sensitive sectors, including agriculture. These CSA priorities include agro forestry, conservation tillage, and management of agricultural wastes. For livestock, it prioritizes improved management of grazing systems, biogas, livestock diversification, and improved breeding of animals. The adaptation actions include drought tolerant crops, water harvesting, integrated soil fertility management, insurance schemes, and price stabilization schemes for livestock, strategic food reserves, and mainstreaming climate change into agricultural extension services.
The Climate Change Bill (draft) (2014) was a recommendation from the NCCRS to support the mainstreaming of climate change within national policy. The bill focuses on establishing a national Climate Change Authority as the entity that would coordinate activities across sectors, including agriculture, and guide the implementation of the NCCRS. It aims to enhance climate resilience and low carbon growth, and to mainstream climate change into planning processes, while creates mechanisms to promote climate resilient actions through necessary policy reforms. The Agriculture Sector Development Strategy (2010-2010) recognizes the need to transform agriculture from tradition to a modern agri-business enterprise and focuses on addressing challenges of food and nutrition security, over-dependence on rain fed agriculture, youth unemployment, poverty reduction and high cost of inputs. Climate adaptation as a priority (GoK, 2010a). Regarding adaptation, it prioritizes investment in weather information systems, research on drought tolerant crop varieties, soil and water conservation, water harvesting, and strengthening integrated pest management systems. Kenya is one of the champions in agricultural mitigation and hosts various innovative land based carbon projects, including Vi Agroforestry’s Agricultural Carbon Project, which transforms sustainable agricultural practices into carbon credits and biogas development programs. Kenya plans to build on mitigation through proper agricultural waste management, organic farming, mulching, agroforestry and biotechnology. The National Food and Nutrition Security Policy (2012) recognizes climate change as an emerging issue for food and nutrition security, and advocates for adaptation interventions that enhance farming communities’ resilience to climate change induced effects. It also recognizes the role of mitigation in addressing climate change The Water Catchment Policy (2013), now under development, could help facilitate multi-objective landscape-scale planning that could deliver climate-smart agriculture. The Arid and Semi-Arid Lands (ASALs) Policy (2007) aims to revitalise ASALs by harnessing livelihood opportunities in the drylands. The policy acknowledges pastoralism

21
as a legitimate and productive livelihood and aims to develop the ASALs coherently by providing basic services (health, education and infrastructure) and decentralizing the planning of livelihood diversification, community participation and drought early warning systems. ASALs are the most vulnerable to impacts of climate change and variability, thus the policy provides ASAL-specific linkages between adaptation and development agendas. The National Livestock Policy (2008) seeks to create a favourable environment for private sector to thrive by creating a mechanism for capacity building and supervision, regulation and improved access to market information. It prioritizes actions such as breeding, nutrition and feeding, value addition and marketing, disease control and research and extension. Even though CSA is not mentioned explicitly, it is implied, and the policy provides the opportunity for CSA through breeding programmes, improvement and conservation of feed and animal genetic resources. The Draft Climate Change Policy (2009) facilitates a coordinated, coherent and effective response to the local, national and global challenges faced when mainstreaming climate change into the development planning process across all sectors. By putting in place vital policy architecture to frame climate change response within the attainment of low carbon and climate resilient development, Kenya aims to safeguard the wellbeing of citizens and the country’s prosperity in the face of a changing climate. Besides, the policy highlights that notes that an enabling policy environment for investment in the agriculture offer great potentials for creation of green jobs. The National Land Policy (2009) encourages sustainable intensification of land use in high-potential, densely populated areas, through the application of efficient methods, improvement of the condition and productivity of degraded lands, and through application of cost-effective irrigation methods The National Irrigation Policy (draft) (2014) aims to expand land under irrigation; increase agricultural water harvesting and storage capacities; promote water harvesting, use of waste water, and exploitation of groundwater for irrigation; build capacity for generation and utilization of irrigation research, innovation and technology; and promote and adopt an integrated approach to sustainable commercial irrigation farming. The National Agricultural Research System Policy (2012) aims to establish an integrated national agricultural research system that guides and supports the development of an innovative, commercially oriented, and modern agricultural sector; design a novel funding mechanism for agricultural research that ensures adequacy, predictability and sustainability of research; and formulate a comprehensive framework for partnership building and consultation, and collaboration with stakeholders. Regional Frameworks The Comprehensive African Agriculture Development Programme (CAADP) emphasizes land water management, capacity building, food security and research and technology dissemination/ adoption, livestock, forestry and fisheries. CAADP has incorporated CSA through sustainable intensification and resiliency of production systems and the

22
reduction of greenhouse gas emissions caused by agriculture. Kenya’s CAADP Compact (formed of government representatives, development CAADP Compact contributes to Kenya’s Agricultural Sector Development Strategy (ASDS). The East African Community Climate Change Policy (EACCCP) is focused on improving the adaptive capacity and resilience of the East African Region to impacts of climate change. Under the agriculture and food security, emphasis is on improving sustainable land use systems as a pre-requisite for enhanced agricultural production and food security under the changing climate. The Regional Land Policy aims to ensure sustainable use of natural and agricultural resources. It promotes adaptation and enhances resilience and livelihoods through delineation of different land-use types.