climate smart agriculture: an introduction - bruno verbist (klimos)
TRANSCRIPT

Climate Smart Agriculture
An introductionBruno Verbist
Brussel, 22 November 2016
www.kuleuven.be/klimos

Overview
Climate change & impacts Mitigation & Adaptation Climate Smart Agriculture Some tools
2

AR5 WGI SPM
Change in average surface temperature 1901-2012Warming in the climate system is
unequivocal
3
AR5 WGI SPM
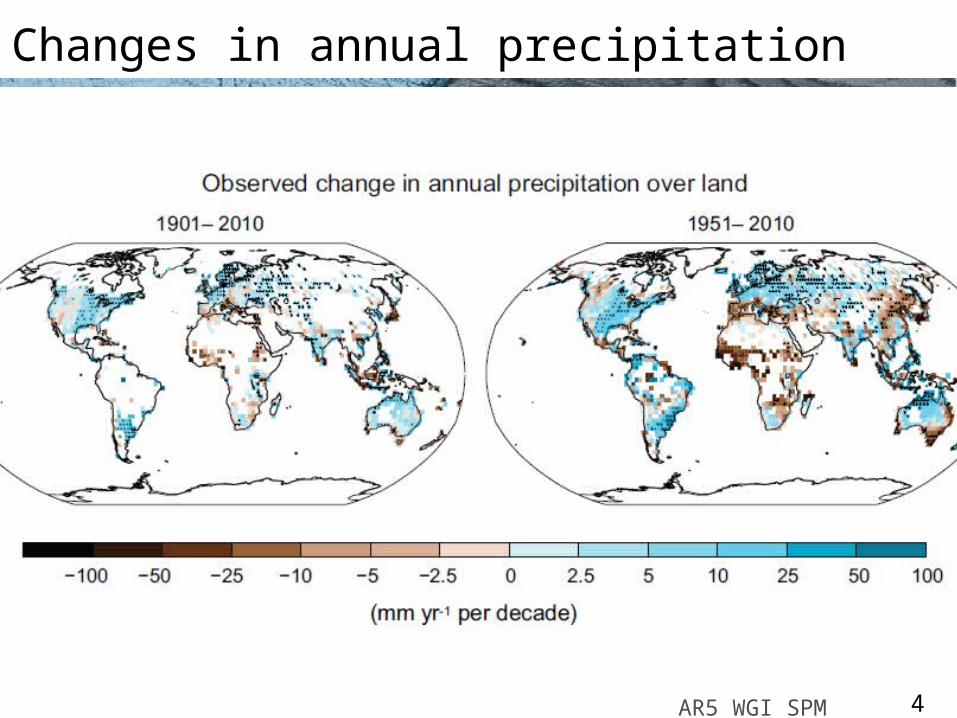
Changes in annual precipitation
4

AR5 WGI SPM
AR5 WGI Regional Atlas• > 70 pages of maps: temperature and precipitation
changeshttp://www.climatechange2013.org/images/report/WG1AR5_AnnexI_FINAL.pdf
5

Spatial downscaling
http://ccafs-climate.org/data_spatial_downscaling/

Total global emissions
Total global emissions: 41.9 ± 2.8 GtCO2 in 2015, 49% over 1990Percentage land-use change: 36% in 1960, 9% averaged 2006-2015
Three different methods have been used to estimate land-use change emissions, indicated here by different shades of grey
Source: CDIAC; Houghton et al 2012; Giglio et al 2013; Le Quéré et al 2016; Global Carbon Budget 2016

Historical cumulative emissions by source
Land-use change represents about 26% of cumulative emissions over 1870–2015, coal 35%, oil 26%, gas 10%, and others 3%
Others: Emissions from cement production and gas flaringSource: CDIAC; Houghton et al 2012; Giglio et al 2013; Le Quéré et al 2016; Global Carbon Budget 2016

31%11.6 GtCO2/yr
Fate of anthropogenic CO2 emissions (2006-2015)
Source: CDIAC; NOAA-ESRL; Houghton et al 2012; Giglio et al 2013; Le Quéré et al 2016; Global Carbon Budget 2016
26%9.7 GtCO2/yr
34.1 GtCO2/yr
91%
9%3.5 GtCO2/yr
16.4 GtCO2/yr
44%
Sources = Sinks

Mitigation and adaptation
Adjustments in human and natural systems, in response to actual or expected climate stimuli or their effects, that moderate harm or exploit beneficial opportunities.
Source: UNDP

Example: The potential impacts of climate change on maize production in Africa and Latin America in 2055
Jones & Thornton, 2003

Vulnerability (outcome)
Source: adapted from O’Brien et al. 2007

Vulnerability (contextual)
Source: adapted from O’Brien et al. 2007

”Climate-smart landscapes operate on the principles of integrated landscape management, while explicitly incorporating adaptation and mitigation into their management objectives” (CGIAR)

KEY FEATURES OF CLIMATE-SMART (AGRICULTURAL) LANDSCAPES(Scherr et al. 2012)
- Climate-smart practices at field and farm level- Minimum tillage- Water management- Nutrient management- Agroforestry- Livestock management
- Diversity of land use across the landscape- To reduce risk- To provide strategic reserves- To sustain perennial habitat as carbon stocks
- Management of land use interactions at landscape scale- Spatial arrangement to enhance field-level benefits- Secure ecosystem functions- Forest-farming interactions to maximize mitigation efforts

Example 1 Agroforestry: Potential for mitigation, adaptation & development Akinnifesi et al. 2010.
TreatmentUnfertilized Maize 1.1 (36.5) 1.1 (61.7) 1.4 (65.6)Fertilized Maize 3.1 (27.9) 4.3 (32.2) 2.3 (36.9)Gliricidia without fertilizer 3.9 (27.1) 3.1 (38.4) 2.6 (21.7)Gliricidia + 50% fertilizer 4.9 (24.8) NA 3.2 (11.7)
Table 1. Average yield values (t ha-1 yr-1)* and coefficients of variation (c.v. %) in parentheses for different nutrient management treatments at 3 sites in SSA.
*Means were based on n = 13 years for Malawi, 12 years for Zambia, and 12 years for Nigeria NA = not available
Yield stability analysis shows strong fertilizing AND stabilizing effects of agroforestry trees
BONUS BONUS
INSURANCE

Jambi, Sumatra, IndonesiaRubber seedlings can be transplanted into gaps in existing agroforests
“Sisipan”
Rubber agroforests: - 70-90% of species of natural forest- > 3 million ha- > 2 billion USD/yr for rubber alone

Clonal planting material successfully established with limited weeding in a system post slash & burn (CIRAD & ICRAF)

Carbon vs. Profitability
Adapted from Gockowski et al., 2001)

Example 2:Improving adaptation of cattle to climate change through introduction of genes obtained from drought and heat
tolerant cattle in Ethiopia AMCEN, 2011: Addressing Climate Change Challenges in Africa; A Practical Guide Towards Sustainable development

Example 3 Biogas: Potential for mitigation, adaptation & development
The biogas technology is a proven and established technology in many partsof the world, especially Asia. Several countries in this region have embarkedon large-scale programmes on domestic biogas, such as China (about 30.5million household digesters by December 2008), India (about 4.1 million byMarch 2009), Nepal (about 220,000 plants by mid-2009) and Vietnam .In Africa, large-scale programmes started since 2009: a technical potential of about 18.5 million households*.
*Felix ter Heegde and Kai Sonder, October 2006: Domestic Biogas in Africa, a first assessment of the potential and need.
Rwanda filmpje Biogas is brilliant filmpje

Need for climate proofing of interventions
Underlying framework of different MRV – tools (Climate-smart Agriculture Handbook, FAO, 2013)

(CLIMATE) SMART LANDSCAPES ASK FOR :
- application of “standard” sustainability principles in land use planning and land management
- a double-scale approach (in place and in time)- enhancing overall resilience at “standard” scale
plus
- making robust structures against extremes

Some available tools1. Climate proofing: KLIMOS Toolkit:2. ICRAF’s Land degradation Surveillance
Framework (LDSF) (baseline data)3. Climate Change, Agriculture and Food
Security baseline (CCAFS)4. MOSAICC – A modelling system for
assessing the impact of climate change on agriculture
5. Greenchoice monitoring and evaluation framework (South Africa)
6. EX-ACT (Ex-Ante Carbon Balance Tool)

Conclusion• CSA technologies/areas have clear benefits for
development, mitigation and adaptation: Need for implementation, exploration and removal of bottlenecks
• Various approaches needed in different conditions
• Need for sustainability assessments and M&E…
• …. potential role for universities, colleges, … in N & S to carry out part of the agenda e.g. baseline studies, applied research


Recommended websites:About CSA:https://ccafs.cgiar.org/http://ecoagriculture.org/http://www.fao.org/docrep/018/i3325e/i3325e.pdf
http://www.globalcarbonproject.org/http://www.globalcarbonatlas.org/The resilience alliance: http://www.resalliance.org

Assessment, M&E for CSA within a project cycle and broader policies and programmes

Carbon cycle: stocks and fluxes (Gt and Gt/year)
Source: http://earthobservatory.nasa.gov/Features/CarbonCycle/?src=eoa-features (2011)