climate health summit september 20, 2015 coal & health: past, present, and future alan h....
TRANSCRIPT

Climate HealthSummit
September 20, 2015
COAL & HEALTH:PAST, PRESENT, AND FUTURE
Alan H. Lockwood, MD, Emeritus Professor of Neurology
University at BuffaloPast President and Co-Chair
Environment and Health CommitteePhysicians for Social Responsibility

CME Declarations
Nothing to declare Book royalties donated to PSR

Objectives
Coal in today’s society Health effects of coal’s life cycle: mining,
transport, combustion, waste disposal Coal and hazardous air pollutants (HAPS) SOx and NOx: contributions to heart
disease, cancer, respiratory disease, stroke
Air of the future: CO2 and ozone Climate interventions and “Clean Coal”

Air Pollution Damages in 2005406 Coal Plants: $62 billion
Source: NAS Hidden Costs of Energy, 2009

Coalworkers PneumoconiosisFell for years after 1969 law
Source: AS Laney & MD Attfield, Occup Enviorn Med, 2010

West Virginia, Where You Live Counts
As coal production increased, health status worsened and rates of cardiopulmonary disease, lung disease, cardiovascular disease, diabetes and kidney disease worsened.
Example result for COPD: odds ratio and 95% confidence interval Less than 4 million tons: 0.969 (0.596 – 1.577) More than 4 million tons: 1.559 (1.069 – 2.272)
Source: Hendryx & Ahern, Am J Public Health, 2008

Coal Transport
About 70% of all rail traffic is related to coal transport
Rail accidents are much more common per ton-mile than road traffic
Diesel locomotives emit particulates that are harmful to health
Trucks produce particulates from diesel engines and wear and tear of roads
Source: Lockwood, AH, The Silent Epidemic, MIT Press, 2012

Two Killed in Coal Train Derailment, August 12, 2012

Coal Ash
We burn about 1 billion tons of coal each year This produces about 100 million tons of coal
combustion waste As pollution control devices become more efficient
as mandated by the Clean Air Act, the ash becomes more toxic
Ash is poorly regulated and often stored under substandard conditions Repositories commonly unlined Heavy metals, e.g., arsenic, leak into water supply
Source: Lockwood AH, The Silent Epidemic, MIT Press, 2012

Kingston spill, December 22, 2008
Dam failed holding back a 84 acre area
1.1 billion gallons released
At dozens of other sites, arsenic and other toxicants have leached into ground water

Air Pollutants
Criteria Air Pollutants: harmful to health and environment, have National Ambient Air Quality Standards (NAAQS) Carbon Monoxide Lead Nitrogen Dioxide Particulates (10 and 2.5 micron aerodynamic
diameter) Ozone Sulfur Dioxide
Mercury

Hazardous Air Pollutants (HAPS) Released by Coal Combustion
(from over 60) Oxides of sulfur Oxides of nitrogen Arsenic Beryllium Cadmium Chromium Mercury
Nickel HCl HF Acreolin Dioxins Formaldehyde Uranium and
Thorium
Source: EPA Report to Congress, publication 453/R-98-004a

Leading Causes of Death Due to Disease in Americans
Heart Disease – leading cause in US – 611,103 in 2013 Myocardial Infarct Congestive Heart
Failure Fatal Arrhythmia
Malignant neoplasms – Second leading cause in US, 584,881 deaths in 2013
Respiratory disease – third leading cause in US – 149,205 in 2013 Asthma (esp. kids) Emphysema Bronchitis Cancer
Stroke – Fourth leading cause in US, 128,978 deaths in 2008
Source: CDC, 2015, 2013 data (most recently available)

Source: van Donkellar et al., EHP 2010;118:847
Satellite Derived PM2.5 Concentration2001 - 2006

Source: Lockwood, The Silent Epidemic, MIT Press 2012
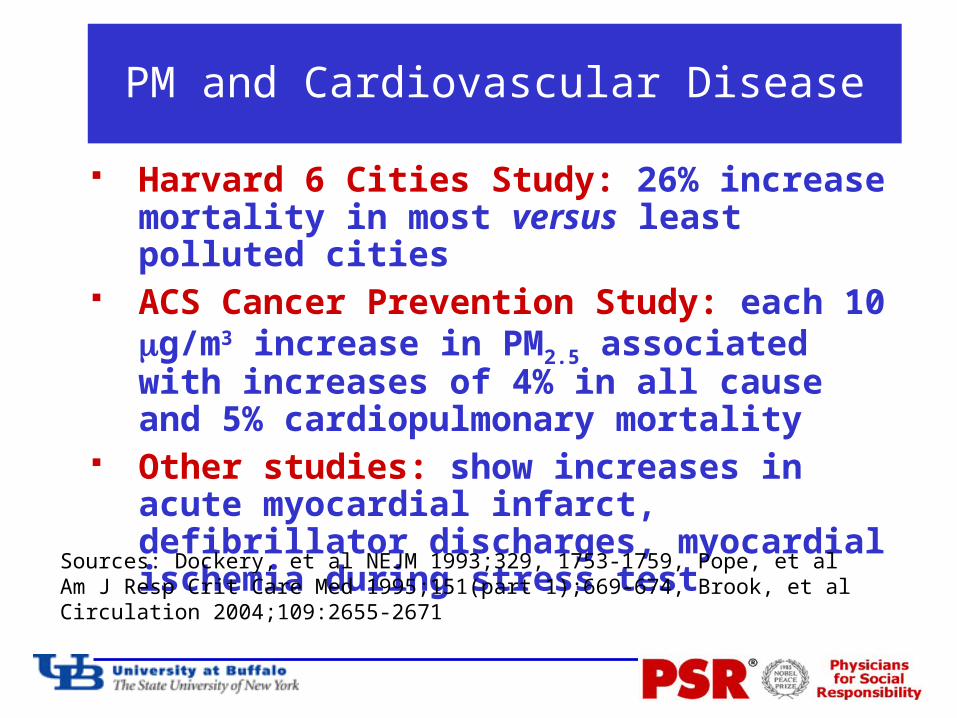
PM and Cardiovascular Disease
Harvard 6 Cities Study: 26% increase mortality in most versus least polluted cities
ACS Cancer Prevention Study: each 10 mg/m3 increase in PM2.5 associated with increases of 4% in all cause and 5% cardiopulmonary mortality
Other studies: show increases in acute myocardial infarct, defibrillator discharges, myocardial ischemia during stress test
Sources: Dockery, et al NEJM 1993;329, 1753-1759, Pope, et al Am J Resp Crit Care Med 1995;151(part 1);669-674, Brook, et al Circulation 2004;109:2655-2671

Air Pollution and Stroke
Korean Study: increased ischemic stroke risk with daily increases in suspended particulates and sulfur dioxide, one day lag nitrogen dioxide, and carbon monoxide, and 3 day lag for ozone
Taiwan study: on warm days (> 20 C) positive association between PM10, NO2, SO2, CO, and O3 for cerebral hemorrhage and ischemic stroke admissions
Women’s Health Initiative: an increase of 10 μg/m3 in the PM2.5 concentration was associated with a 24% increase in the risk for a cardiovascular event and an increased risk for a cerebrovascular event
Sources: Hong et al Stroke 2002, Tsai et al Stroke 2003, Miller, et al, NEJM, 2007

Stroke and PM2.5
Increase in odds ratio for stroke comparing 25th with 75th percentile increase (6.4 mg/m3)P = 0.001
Source: Wellenius Arch Int Med 2012;172(3):229

Source:US EPA

Greenhouse Gases, 0 - 2005
Source: IPCC Fourth and Fifth Assessment Report
Global Warming Mean LifetimePotential, 20 YearC02 = 1 30,000-35,000 yearsMethane = 86 12.4 yearsN20 = 268 114 years

CO2 Emissions From Coal: 1995-2013From Over 36 Trillion Total tons/year
China, 7,179 Mt in 2013
USA, 1,688 Mt in 2013
India, 1,667 Mt in 2013
Brazil, 60 Mt in 2013
Source: Globalcarbonatlas.org
Russian Federation, 465 Mt in 2013

Source: Institute for Sustainable Development and International Relations
US Path to Deep Decarbonization
Electricity UseBy Sector
MT
CO
2 /
EJ
12 EJ
22 EJ
1 EJ = 1018 JEJ = Exajoule
CO2 Emissions byFuel Type

Carbon Capture and Storage
Source: IPCC CCS Report, 2005

Oklahoma EarthquakesMagnitude 3.0 or Greater

Elements of Carbon Capture and Storage
Production of waste stream with high carbon dioxide percentage (Capture)
Compression and liquification of carbon dioxide
Transport to disposal site: pipeline Disposal in perpetuity (Storage)

Carbon Capture and Storage:Must deal with 35+ trillion tons
per year Still in experimental stage Energy intense process Requires huge new infrastructure
Modify or construct new generating units New pipelines
Unproven long-term storage strategies Will not be 100% efficient: less may not
be enough to prevent climate change

Increase in Daily Summer 1-h Maximum Ozone: 1990s-2050
Source: Bell et alClimatic Change2007;82:61-76
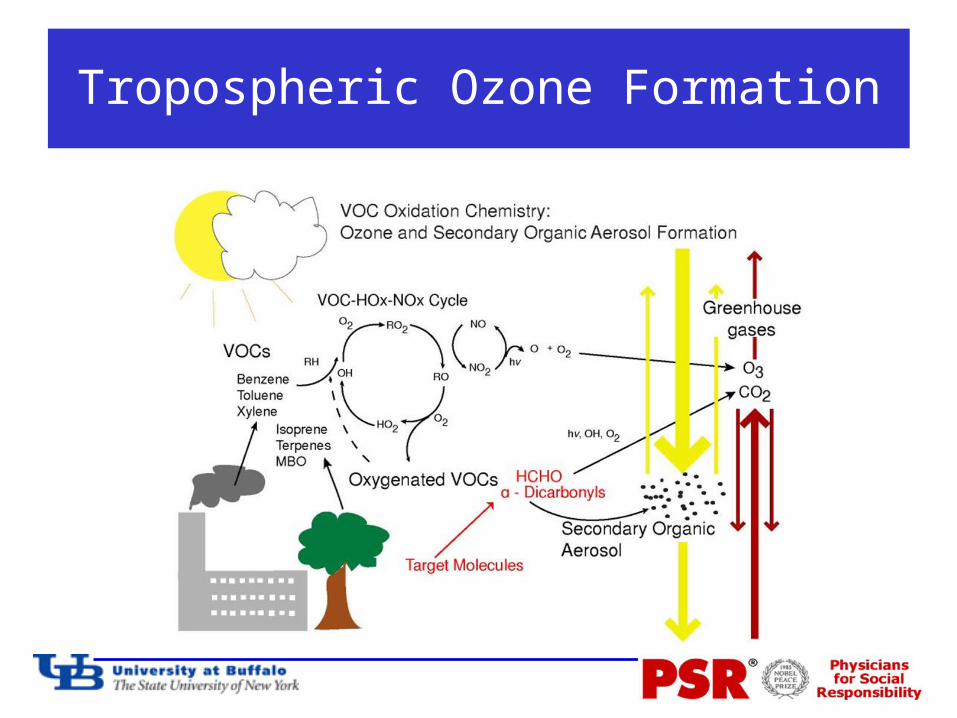
Tropospheric Ozone Formation

Wall Street and CoalWhose War Is It?
Alpha Natural Resources (bought Massy for $7.1 billion 4 years ago), Walter Energy, Patriot Coal, many smaller companies, all have filed for bankruptcy.
But, domestic coal consumption rose by 4% between 2012 and 2015.
Arch Coal
Peabody Energy

Costs versus Benefits, Clean Air Act
Source:US EPA

Sustainable Energy Future
Improve efficiency Use more renewables More Wind Energy More solar
Photovoltaic Sun-powered boilers Now-experimental
Artificial photosynthesis Hydrolysis to generate hydrogen
Federal support for R&D and Education
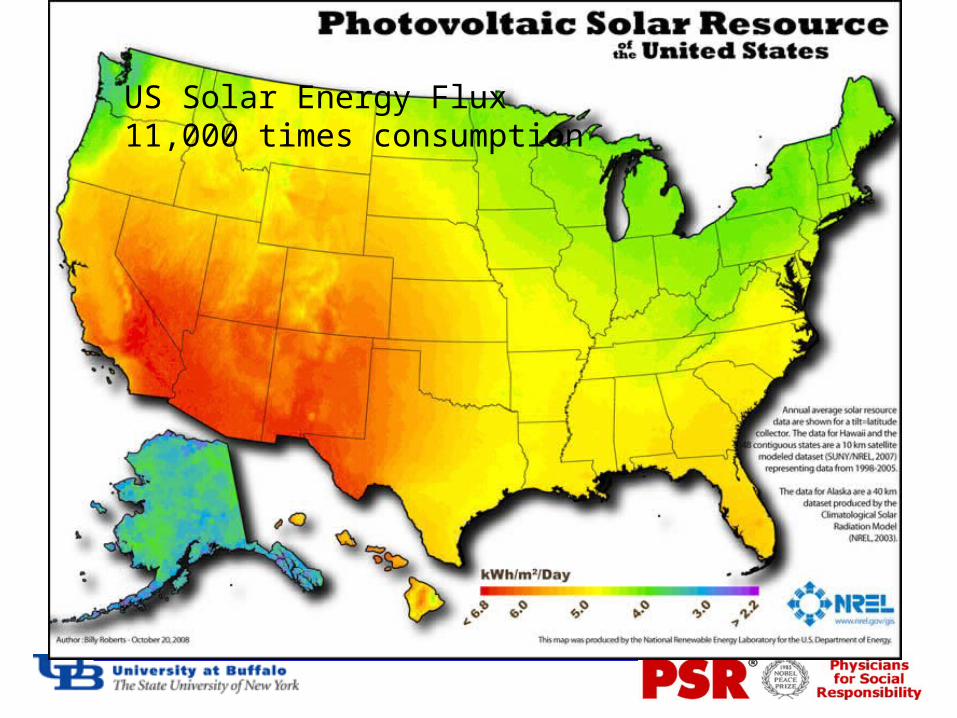
US Solar Energy Flux11,000 times consumption

Wind Energy 78 times annual usage

Photocatalytic Splitting of H2O
Catalysts added to cell Illuminated by artificial
sunlight Bubbles: oxygen, front of
cell; hydrogen, back of cell
Reference: Concepcion, et al, Chemical approaches to artificial photosynthesis, PNAS, Sept 25, 2012, 109:15560-15564
R Valentine, Wikipedia

What You Do MattersTake Action
Ask your candidates if they support EPA’s current clean air and carbon dioxide emission standards.
Speak to your friends, family, and colleagues about the importance of clean air and protecting our health.
Join Physicians for Social Responsibility go to: www.psr.org

We are replacingCFLs with LEDs
Lockwood home, Buffalo, NY, 4,400 Watt PV Array
We replace CFLs With LEDs
Here is Some of What We Do, Thanks!