climate data record (cdr) program - university of...
TRANSCRIPT
CDR Program AMSU-B/MHS FCDR for Hydrological Applications C-ATBD <TBD By CDR Program> Rev. 1 05/20/14
1
Climate Data Record (CDR) Program
Climate Algorithm Theoretical Basis Document (C-ATBD)
The Development of Advanced Microwave Sounding Unit-B (AMSU-B) and Microwave Humidity Sounder (MHS) Fundamental
Climate Data Records (FCDR) for Hydrological Applications
C-ATBD 1: AMSU-B/MHS FCDR
CDR Program AMSU-B/MHS FCDR for Hydrological Applications C-ATBD <TBD By CDR Program> Rev. 1 05/20/14
2
CDR Program Document Number: TBD by CDR Program Document Manager Originator Document Number: N/A Revision 1 / January 2015 DSR Number: DSR-XXX by CDR Program Document Manager
CDR Program AMSU-B/MHS FCDR for Hydrological Applications C-ATBD <TBD By CDR Program> Rev. 1 05/20/14
3
REVISION HISTORY
Rev. Author DSR No. Description Date
1 Ralph Ferraro, NOAA/NESDIS/STAR Isaac Moradi, James Beauchamp UMD/ESSIC/CICS
DSR-XXX Initial Submission to CDR Program 1/22/15
CDR Program AMSU-B/MHS FCDR for Hydrological Applications C-ATBD <TBD By CDR Program> Rev. 1 05/20/14
4
TABLE of CONTENTS
1. INTRODUCTION ............................................................................................................................ 7 1.1 Purpose ....................................................................................................................................................... 7 1.2 Definitions ................................................................................................................................................... 7 1.3 Document Maintenance.............................................................................................................................. 8
2. OBSERVING SYSTEMS OVERVIEW ........................................................................................... 9 2.1 Products Generated .................................................................................................................................. 10 2.2 Instrument Characteristics ........................................................................................................................ 10
3. ALGORITHM DESCRIPTION .................................................................................................... 12 3.1 Algorithm Overview .................................................................................................................................. 12 3.2 Processing Outline .................................................................................................................................... 12 3.2.1 Reading Input .................................................................................................................................... 12 3.2.2 Geolocation Correction ...................................................................................................................... 12 3.2.3 Inter-Satellite Correction ................................................................................................................... 12 3.2.4 Calculating Radiance .......................................................................................................................... 13 3.2.5 Generating Brightness Temperatures ................................................................................................ 13 3.2.6 Quality Control .................................................................................................................................. 13 3.2.7 Writing Output .................................................................................................................................. 14 3.3 Algorithm Input ......................................................................................................................................... 14
3.3.1 Primary Sensor Data .......................................................................................................................... 14 3.3.2 Ancillary Data .................................................................................................................................... 15 3.3.3 Derived Data ..................................................................................................................................... 15 3.3.4 Forward Models ................................................................................................................................ 15
3.4 Theoretical Description .............................................................................................................................. 15 3.4.1 Physical and Mathematical Description ............................................................................................. 15 3.4.1.1 Geolocation Correction ....................................................................................................... 15 3.4.1.2 Inter-Satellite Calibration .................................................................................................... 16 3.4.2 Data Merging Strategy....................................................................................................................... 17 3.4.3 Numerical Strategy ............................................................................................................................ 17 3.4.4 Calculations ....................................................................................................................................... 17 3.4.5 Look-Up Table Description ................................................................................................................ 17 3.4.5.1 Inter-Satellite Calibration Coefficients............................................................................... 17 3.4.5.2 Ta to Tb Conversion .......................................................................................................... 19 3.4.5.3 Latbox Calculation............................................................................................................. 19 3.4.5.4 Climatological Quality Check ............................................................................................. 20 3.4.6 Parameterization ............................................................................................................................... 20 3.4.7 Algorithm Output .............................................................................................................................. 20
4. TEST DATASETS AND OUTPUTS ........................................................................................... 21 4.1 Test Input Datasets .................................................................................................................................... 21 4.2 Test Output Analysis .................................................................................................................................. 21
CDR Program AMSU-B/MHS FCDR for Hydrological Applications C-ATBD <TBD By CDR Program> Rev. 1 05/20/14
5
4.2.1 Reproducibility .................................................................................................................................. 21 4.2.2 Precision and Accuracy ...................................................................................................................... 21 4.2.3 Error Budget ...................................................................................................................................... 22
5. PRACTICAL CONSIDERATIONS .............................................................................................. 23 5.1 Numerical Computation Considerations .................................................................................................... 23 5.2 Programming and Procedural Considerations ............................................................................................ 23 5.3 Quality Assessment and Diagnostics .......................................................................................................... 23 5.4 Exception Handling .................................................................................................................................... 23 5.4.1 Conditions Checked ........................................................................................................................... 23 5.4.2 Conditions Not Checked .................................................................................................................... 24 5.4.3 Conditions Not Considered Exceptions .............................................................................................. 24 5.5 Algorithm Validation .................................................................................................................................. 25 5.5.1 Geolocation Correction ..................................................................................................................... 25 5.5.2 Inter-Satellite Calibration .................................................................................................................. 26 5.6 Processing Environment and Resources ..................................................................................................... 26
6. ASSUMPTIONS AND LIMITATIONS ....................................................................................... 26 6.1 Algorithm Performance .............................................................................................................................. 27 6.2 Sensor Performance ................................................................................................................................... 27
7. FUTURE ENHANCEMENTS ....................................................................................................... 29 7.1 Enhancement 1 – Extention of NOAA-15 FCDR Record .............................................................................. 29 7.2 Enhancement 2 - Correction of Frequency Shift ......................................................................................... 29
8. REFERENCES ............................................................................................................................... 30
APPENDIX A. ACRONYMS AND ABBREVIATIONS.................................................................. 31
APPENDIX B. AMSU-B/MHS SENSOR DETAILS ...................................................................... 33
APPENDIX C. AMSU-B/MHS FCDR FILE FORMAT ................................................................. 36
CDR Program AMSU-B/MHS FCDR for Hydrological Applications C-ATBD <TBD By CDR Program> Rev. 1 05/20/14
6
LIST of FIGURES
Figure 2-1: Equator crossing times for NOAA POES and MetOp. ................................................................ 9
Figure 2-2: AMSU-B/MHS scan geometry. ................................................................................................ 11
Figure 3-1: Overall processing flow chart.................................................................................................. 13
Figure 3-2: Schematic explanation of the geolocation correction method ……………………………………………16
Figure 3-2: Time series of original and inter-calibrated NOAA-15 and NOAA-17 AMSU-B ………….…………17
Figure 5-2: Difference between ascending and descending Tbs from NOAA-15 AMSU-B ……………………...25
LIST of TABLES
Table 2-1: AMSU-B/MHS FCDR Product Attributes ……………………………………………………………………………… 11
Table 3-1: AMSU-B/MHS Calibration Coefficients ……………………………………………………………………………… 19
Table 4-1: Error Budget of AMSU-B/MHS Window Channels FCDR ……………………………………………………..22
CDR Program AMSU-B/MHS FCDR for Hydrological Applications C-ATBD <TBD By CDR Program> Rev. 1 05/20/14
7
1. Introduction
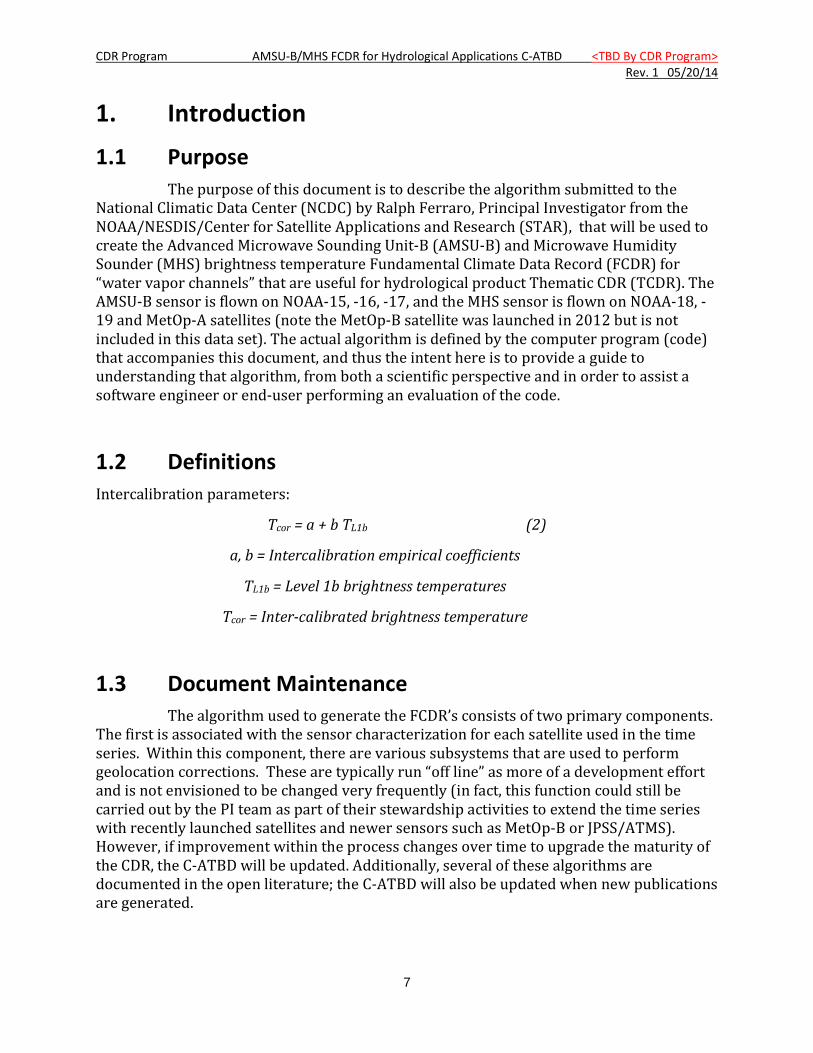
1.1 Purpose The purpose of this document is to describe the algorithm submitted to the
National Climatic Data Center (NCDC) by Ralph Ferraro, Principal Investigator from the NOAA/NESDIS/Center for Satellite Applications and Research (STAR), that will be used to create the Advanced Microwave Sounding Unit-B (AMSU-B) and Microwave Humidity Sounder (MHS) brightness temperature Fundamental Climate Data Record (FCDR) for “water vapor channels” that are useful for hydrological product Thematic CDR (TCDR). The AMSU-B sensor is flown on NOAA-15, -16, -17, and the MHS sensor is flown on NOAA-18, -19 and MetOp-A satellites (note the MetOp-B satellite was launched in 2012 but is not included in this data set). The actual algorithm is defined by the computer program (code) that accompanies this document, and thus the intent here is to provide a guide to understanding that algorithm, from both a scientific perspective and in order to assist a software engineer or end-user performing an evaluation of the code.
1.2 Definitions Intercalibration parameters:
Tcor = a + b TL1b (2)
a, b = Intercalibration empirical coefficients
TL1b = Level 1b brightness temperatures
Tcor = Inter-calibrated brightness temperature
1.3 Document Maintenance The algorithm used to generate the FCDR’s consists of two primary components.
The first is associated with the sensor characterization for each satellite used in the time series. Within this component, there are various subsystems that are used to perform geolocation corrections. These are typically run “off line” as more of a development effort and is not envisioned to be changed very frequently (in fact, this function could still be carried out by the PI team as part of their stewardship activities to extend the time series with recently launched satellites and newer sensors such as MetOp-B or JPSS/ATMS). However, if improvement within the process changes over time to upgrade the maturity of the CDR, the C-ATBD will be updated. Additionally, several of these algorithms are documented in the open literature; the C-ATBD will also be updated when new publications are generated.
CDR Program AMSU-B/MHS FCDR for Hydrological Applications C-ATBD <TBD By CDR Program> Rev. 1 05/20/14
8
The second change is associated with inter-satellite calibration and time series extension and reprocessing after transition to NCDC. In this case, it is envisioned that updated corrections, most likely in the form of look up tables of coefficients and derived data, would be delivered to the CDR program and those tables updated within the C-ATBD.
Synchronization between this document and the algorithm is achieved through version and revision numbers, i.e., there will be consistency between the version numbers on the front cover of this document and the version and revision numbers contained within the FCDR software itself (i.e., various header files within the software documentation).
CDR Program AMSU-B/MHS FCDR for Hydrological Applications C-ATBD <TBD By CDR Program> Rev. 1 05/20/14
9
2. Observing Systems Overview This section provides an overview of the characteristics of the AMSU-B/MHS
observing systems and its calibration strategy. For more specific details on the AMSU-B/MHS sensor, please refer to Appendix B.
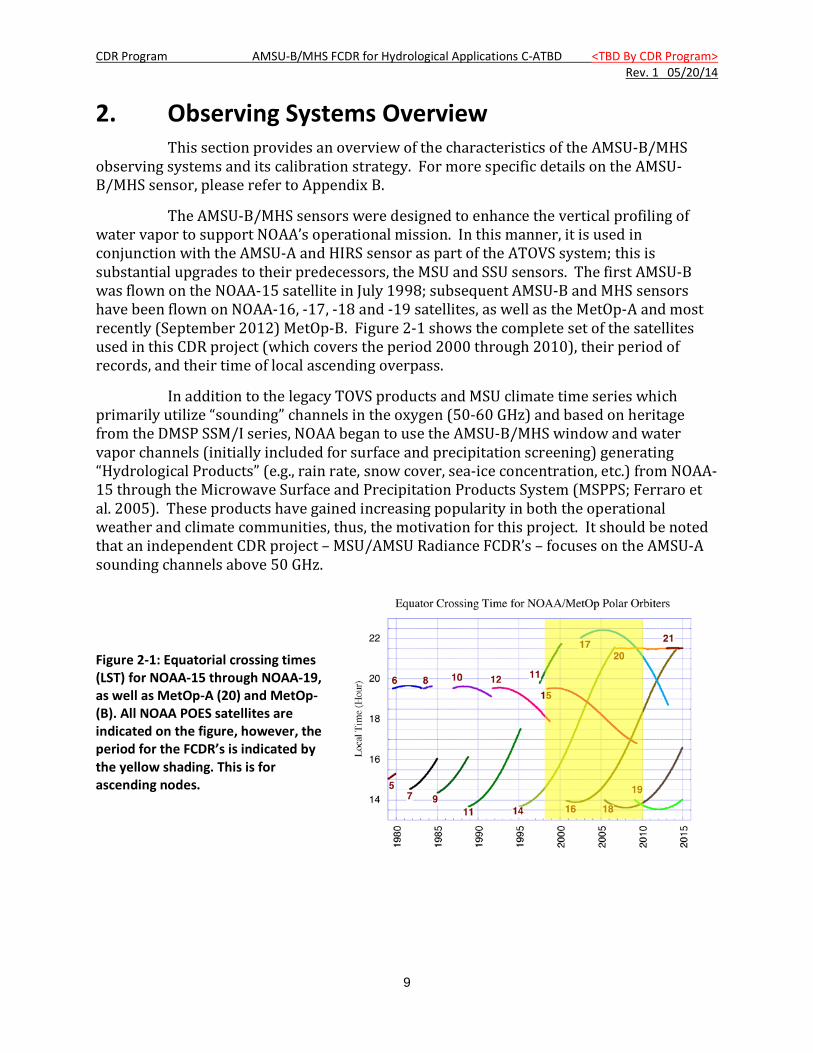
The AMSU-B/MHS sensors were designed to enhance the vertical profiling of water vapor to support NOAA’s operational mission. In this manner, it is used in conjunction with the AMSU-A and HIRS sensor as part of the ATOVS system; this is substantial upgrades to their predecessors, the MSU and SSU sensors. The first AMSU-B was flown on the NOAA-15 satellite in July 1998; subsequent AMSU-B and MHS sensors have been flown on NOAA-16, -17, -18 and -19 satellites, as well as the MetOp-A and most recently (September 2012) MetOp-B. Figure 2-1 shows the complete set of the satellites used in this CDR project (which covers the period 2000 through 2010), their period of records, and their time of local ascending overpass.
In addition to the legacy TOVS products and MSU climate time series which primarily utilize “sounding” channels in the oxygen (50-60 GHz) and based on heritage from the DMSP SSM/I series, NOAA began to use the AMSU-B/MHS window and water vapor channels (initially included for surface and precipitation screening) generating “Hydrological Products” (e.g., rain rate, snow cover, sea-ice concentration, etc.) from NOAA-15 through the Microwave Surface and Precipitation Products System (MSPPS; Ferraro et al. 2005). These products have gained increasing popularity in both the operational weather and climate communities, thus, the motivation for this project. It should be noted that an independent CDR project – MSU/AMSU Radiance FCDR’s – focuses on the AMSU-A sounding channels above 50 GHz.
Figure 2-1: Equatorial crossing times (LST) for NOAA-15 through NOAA-19, as well as MetOp-A (20) and MetOp-(B). All NOAA POES satellites are indicated on the figure, however, the period for the FCDR’s is indicated by the yellow shading. This is for ascending nodes.
CDR Program AMSU-B/MHS FCDR for Hydrological Applications C-ATBD <TBD By CDR Program> Rev. 1 05/20/14
10
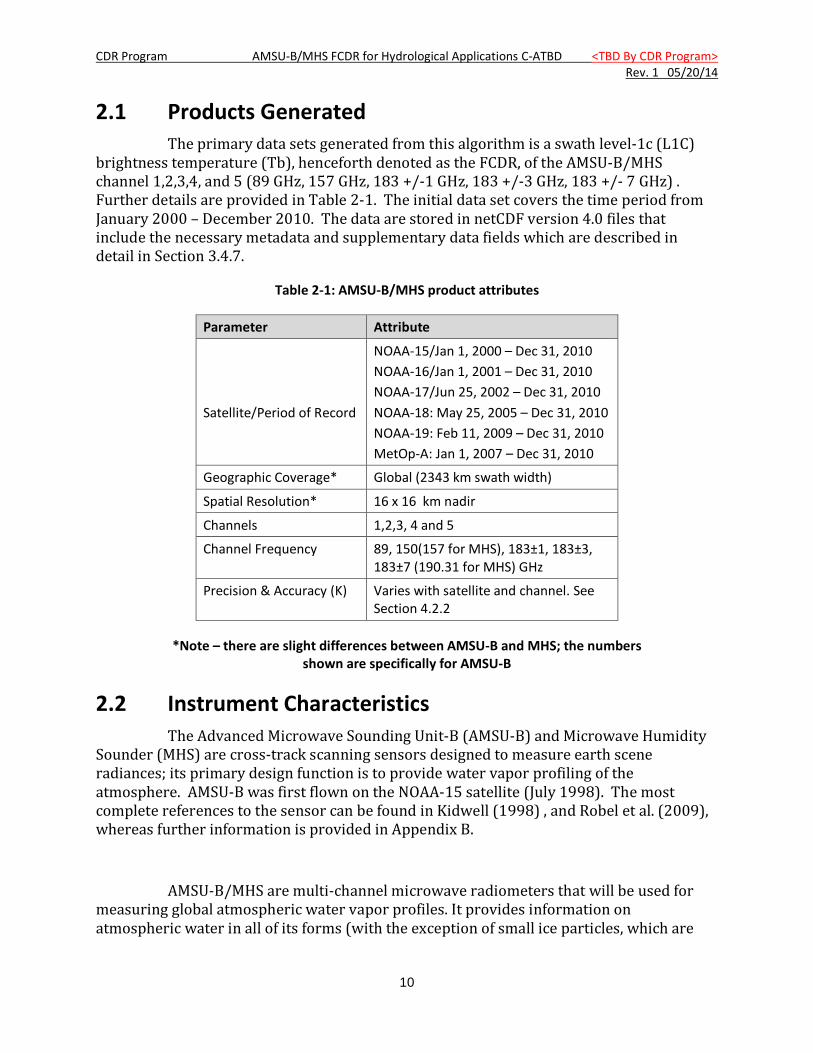
2.1 Products Generated The primary data sets generated from this algorithm is a swath level-1c (L1C)
brightness temperature (Tb), henceforth denoted as the FCDR, of the AMSU-B/MHS channel 1,2,3,4, and 5 (89 GHz, 157 GHz, 183 +/-1 GHz, 183 +/-3 GHz, 183 +/- 7 GHz) . Further details are provided in Table 2-1. The initial data set covers the time period from January 2000 – December 2010. The data are stored in netCDF version 4.0 files that include the necessary metadata and supplementary data fields which are described in detail in Section 3.4.7.
Table 2-1: AMSU-B/MHS product attributes
Parameter Attribute
Satellite/Period of Record
NOAA-15/Jan 1, 2000 – Dec 31, 2010 NOAA-16/Jan 1, 2001 – Dec 31, 2010 NOAA-17/Jun 25, 2002 – Dec 31, 2010 NOAA-18: May 25, 2005 – Dec 31, 2010 NOAA-19: Feb 11, 2009 – Dec 31, 2010 MetOp-A: Jan 1, 2007 – Dec 31, 2010
Geographic Coverage* Global (2343 km swath width)
Spatial Resolution* 16 x 16 km nadir
Channels 1,2,3, 4 and 5
Channel Frequency 89, 150(157 for MHS), 183±1, 183±3, 183±7 (190.31 for MHS) GHz
Precision & Accuracy (K) Varies with satellite and channel. See Section 4.2.2
*Note – there are slight differences between AMSU-B and MHS; the numbers shown are specifically for AMSU-B
2.2 Instrument Characteristics The Advanced Microwave Sounding Unit-B (AMSU-B) and Microwave Humidity
Sounder (MHS) are cross-track scanning sensors designed to measure earth scene radiances; its primary design function is to provide water vapor profiling of the atmosphere. AMSU-B was first flown on the NOAA-15 satellite (July 1998). The most complete references to the sensor can be found in Kidwell (1998) , and Robel et al. (2009), whereas further information is provided in Appendix B.
AMSU-B/MHS are multi-channel microwave radiometers that will be used for measuring global atmospheric water vapor profiles. It provides information on atmospheric water in all of its forms (with the exception of small ice particles, which are
CDR Program AMSU-B/MHS FCDR for Hydrological Applications C-ATBD <TBD By CDR Program> Rev. 1 05/20/14
11
transparent at microwave frequencies). AMSU-B provides information even in cloudy conditions.
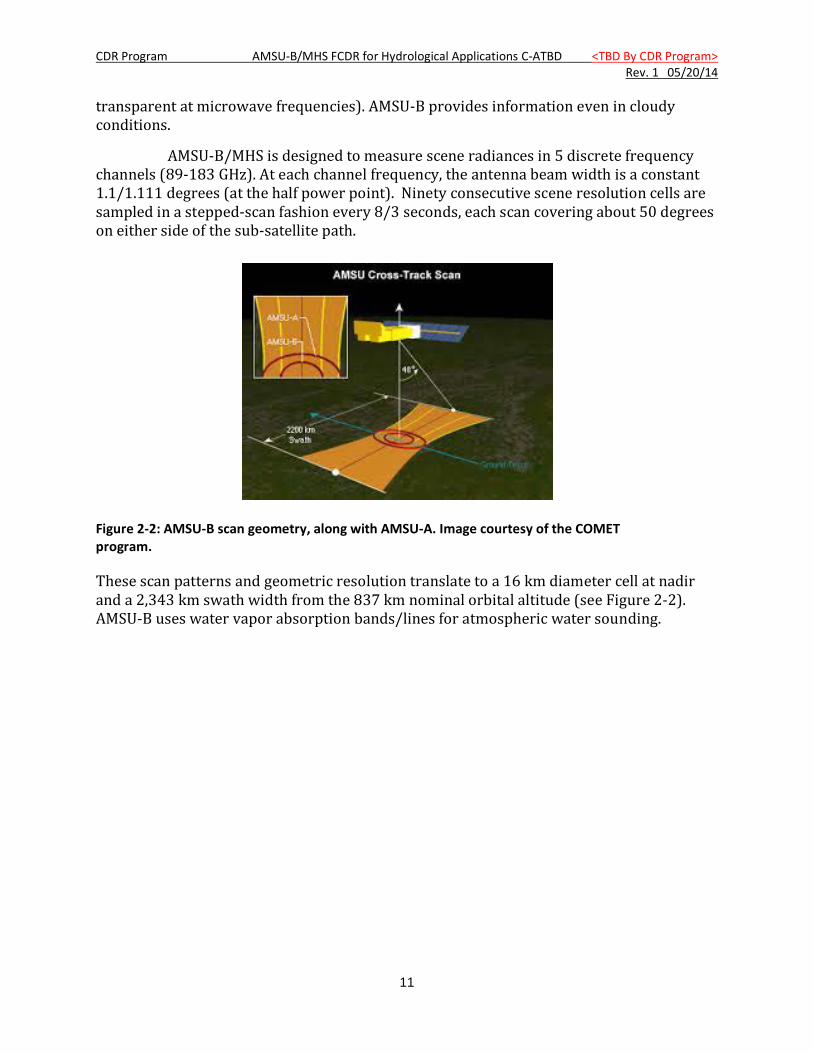
AMSU-B/MHS is designed to measure scene radiances in 5 discrete frequency channels (89-183 GHz). At each channel frequency, the antenna beam width is a constant 1.1/1.111 degrees (at the half power point). Ninety consecutive scene resolution cells are sampled in a stepped-scan fashion every 8/3 seconds, each scan covering about 50 degrees on either side of the sub-satellite path.
Figure 2-2: AMSU-B scan geometry, along with AMSU-A. Image courtesy of the COMET program.
These scan patterns and geometric resolution translate to a 16 km diameter cell at nadir and a 2,343 km swath width from the 837 km nominal orbital altitude (see Figure 2-2). AMSU-B uses water vapor absorption bands/lines for atmospheric water sounding.
CDR Program AMSU-B/MHS FCDR for Hydrological Applications C-ATBD <TBD By CDR Program> Rev. 1 05/20/14
12
3. Algorithm Description
3.1 Algorithm Overview This section describes the generation of the FCDR’s for the AMSU-B/MHS
channels described in Table 2-1. It provides details on the geolocation correction, and the inter-satellite calibration, which are the two main steps to convert the original AMSU-B/MHS Level-1B ( L1B ) data to AMSU-B/MHS FCDR’s. There are other intermediate steps such as the conversion from antenna to brightness temperature, the generation of look-up table parameters (that are part of an off-line system) and quality control that are part of the FCDR algorithm. Specific details are provided in the sections below.
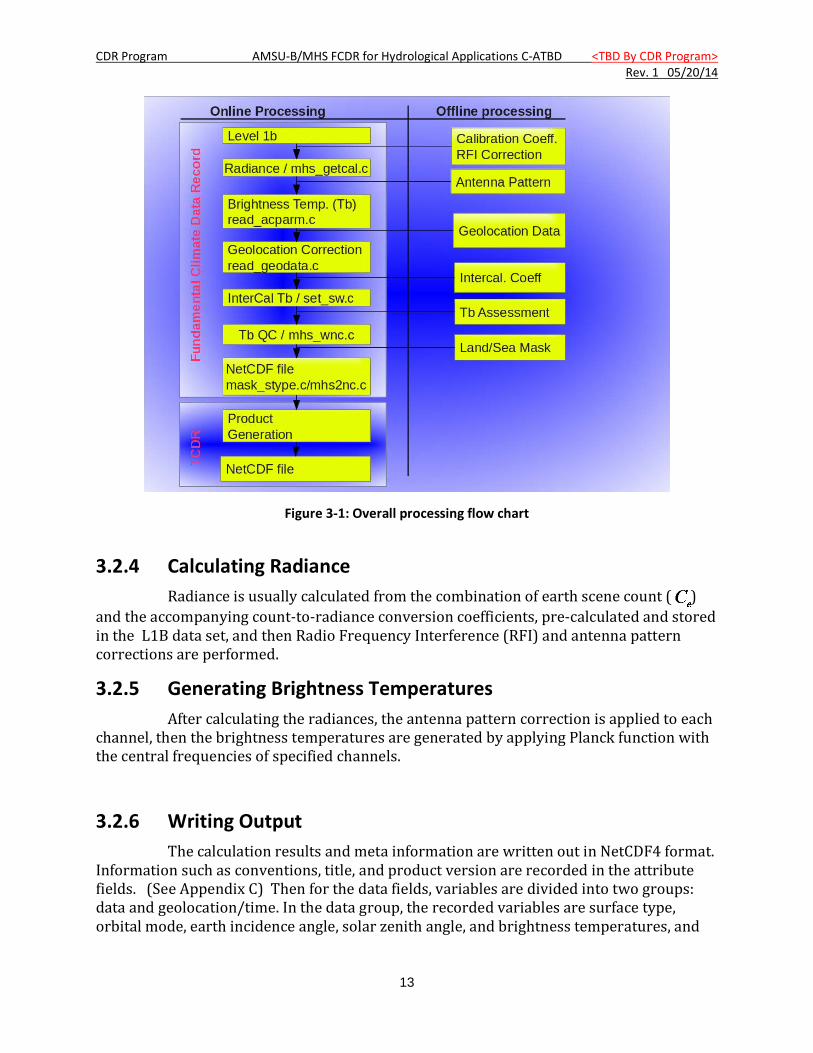
3.2 Processing Outline The steps of the AMSU-B/MHS FCDR algorithms include reading the input data (
L1B ), processing the data in six steps (described in following sections), and the writing of the output data (FCDR). The overall processing flow is shown in Figure 3-1. Note that in Figure 3-1, the steps for generating Thematic CDR’s (TCDR) are shown, however, this is not included in this C-ATBD.
3.2.1 Reading Input The operational system first reads all the input data which include primary
sensor data (including earth scene count, warm count, and cold count from AMSU-B/MHS L1B data), ancillary data (including land-sea mask, GFS data, etc), and derived data (including various correction coefficients, and new geolocation dataset). These data will be described in more details in Sections 3.3.1-3.
3.2.2 Geolocation Correction Geolocation has been corrected offline, and a new geolocation dataset, including
latitude, longitude, scan angle, and Earth Incidence Angle (EIA), has been developed. The operational system reads the new geolocation dataset and uses the data in the remaining tasks without further processing of the geolocation data. More details on geolocation correction are described in 3.4.1.1.
3.2.3 Inter-satellite Correction The inter-satellite coefficients (slope and intercept) for each channel are
calculated offline. The operational system uses these coefficients to determine corrected brightness temperatures. More details on how these coefficients are calculated are described in 3.4.1.2.
CDR Program AMSU-B/MHS FCDR for Hydrological Applications C-ATBD <TBD By CDR Program> Rev. 1 05/20/14
13
Figure 3-1: Overall processing flow chart
3.2.4 Calculating Radiance Radiance is usually calculated from the combination of earth scene count ( )
and the accompanying count-to-radiance conversion coefficients, pre-calculated and stored in the L1B data set, and then Radio Frequency Interference (RFI) and antenna pattern corrections are performed.
3.2.5 Generating Brightness Temperatures After calculating the radiances, the antenna pattern correction is applied to each
channel, then the brightness temperatures are generated by applying Planck function with the central frequencies of specified channels.
3.2.6 Writing Output The calculation results and meta information are written out in NetCDF4 format.
Information such as conventions, title, and product version are recorded in the attribute fields. (See Appendix C) Then for the data fields, variables are divided into two groups: data and geolocation/time. In the data group, the recorded variables are surface type, orbital mode, earth incidence angle, solar zenith angle, and brightness temperatures, and
CDR Program AMSU-B/MHS FCDR for Hydrological Applications C-ATBD <TBD By CDR Program> Rev. 1 05/20/14
14
quality flags. Data in the geolocation/ time group include latitude, longitude, scan time, and scan time since 1998.
3.3 Algorithm Input
3.3.1 Primary Sensor Data The primary sensor data for AMSU Hydrology FCDR is L1B AMSU-B/MHS data
(Note: AMSU-A L1B data are also required for generating the complete set of AMSU Hydrology FCDR. However, the descriptions of the AMSU-A FCDR are not included in this document but in a separate C-ATBD.). The generic L1B data, accessible from NOAA Comprehensive Large Array-data Stewardship System (CLASS), keep orbital records of these cross-scan sensors in binary format with approximately 14 files per day. AMSU-B/MHS has a resolution of 16x16 kilometers at nadir view which increases towards the edge of the scan (approximately 26 x 52 km). The data size is ~25 GB per satellite year with a total data size of more than 1 TB for all satellites and all available years. More descriptions of this data set is refered to Robel et al., (2009), KLM user’s guide.
3.3.2 Ancillary Data The production package requires a land-sea mask. The binary data is on a 1/16
degree gridded map with cylindrical projection. The size of the map is about 16 MB. The file is located in directory ./input.
3.3.3 Derived Data The operational system requires the following derived data: corrected
geolocation data, inter-satellite calibration coefficients, RFI coefficients, and antenna pattern correction (APC) coefficients.
Geolocation (latitude, longitude, earth incidence angle, and scan angle) is corrected following the approach described in 3.4.1.1 (Moradi et al, 2013). The corrected geolocation data is 18 GB per satellite year with a total size of 650 GB for all satellites and all available years. The files are under /amsu/amsu/1b-geo/amsu-b/sat/year (for AMSU-B) and /amsu/amsu/1b-geo/mhs/sat/year (for MHS).
The AMSU-B/MHS inter-satellite calibration coefficients, including the slope and intercept of the linear regression, for each channel, year, onboard satellite, is stored in two text files with the size of 300 KB. These files, slope.dat and intercept.dat, are provided under ./input directory. The derivation of the data is described in 3.4.1.2.
The AMSU-B/MHS antenna pattern correction (APC) coefficients, including the efficiencies with which the antenna detects the Earth, the satellite platform, and the space are stored in the APC file. Every satellite has one APC file with the size of 3 KB. The files are provided under the current directory. The derivation of the data is described in Hewison and Saunders (1996).

CDR Program AMSU-B/MHS FCDR for Hydrological Applications C-ATBD <TBD By CDR Program> Rev. 1 05/20/14
15
3.3.4 Forward Models Not applicable.
3.4 Theoretical Description
3.4.1 Physical and Mathematical Description
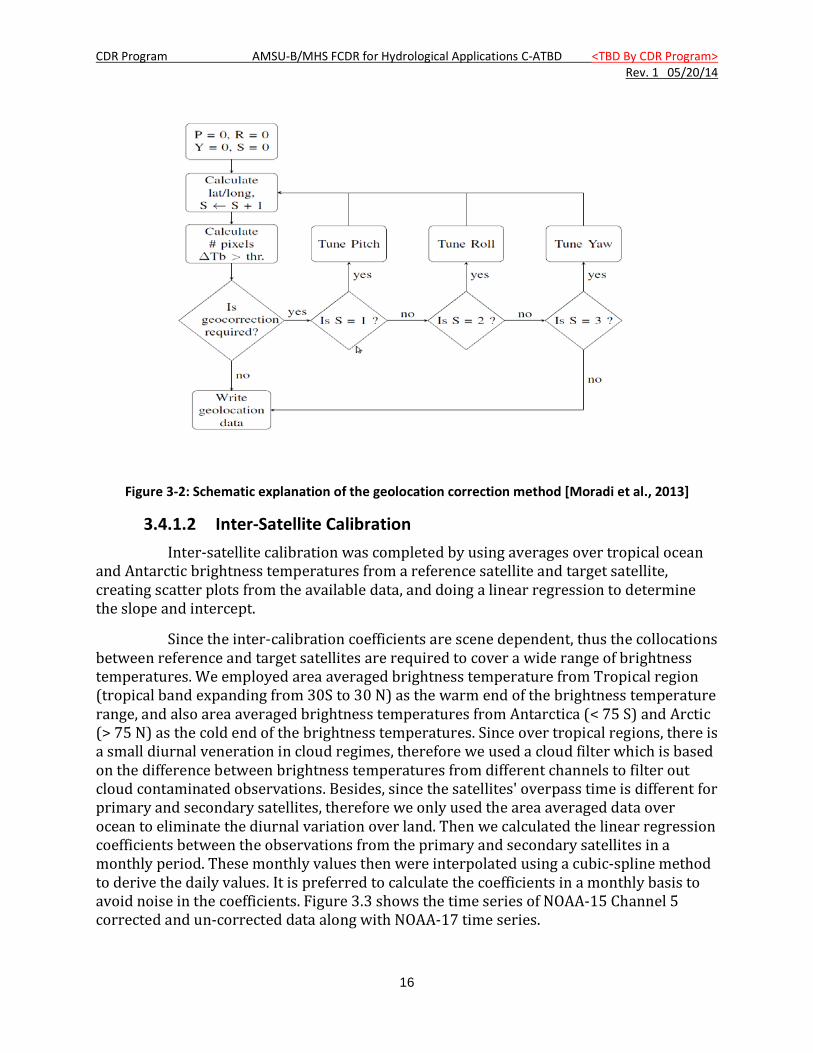
3.4.1.1 Geolocation Correction The geolocation has been corrected for all AMSU-B/MHS sensors aboard the
NOAA Polar-orbiting Operational Environmental Satellites (POES) satellites (NOAA-15 to -19). The correction algorithm is schematically explained in Figure 3-2.
The main geolocation errors for AMSU-B/MHS instruments include a timing error in NOAA-17 data, and a wrong stepping angle that was used to geolocate NOAA-18 MHS data. Generally, AMSU-B and MHS sensors have less geolocation problems than AMSU-A.
A new geolocation dataset has been developed for the AMSU-B/MHS instruments aboard NOAA POES satellites. The new dataset includes latitude, longitude, scan angle, and EIA. This dataset will be used throughout the project for inter-satellite calibration.
This geolocation correction method cannot be applied to MetOp-A data as the geometry of the MetOp-A orbit is different from NOAA satellites and our method introduces some extra geolocation error. In addition, our investigations show that the MetOp-A geolocation error is negligable, less than a few kilometers, and does not introduce large error in scan bias or LZA. Detailed description of the geolocation correction algorithm, results, and discussion has been published in Moradi et al. (2013).
CDR Program AMSU-B/MHS FCDR for Hydrological Applications C-ATBD <TBD By CDR Program> Rev. 1 05/20/14
16
Figure 3-2: Schematic explanation of the geolocation correction method [Moradi et al., 2013]
3.4.1.2 Inter-Satellite Calibration Inter-satellite calibration was completed by using averages over tropical ocean
and Antarctic brightness temperatures from a reference satellite and target satellite, creating scatter plots from the available data, and doing a linear regression to determine the slope and intercept.
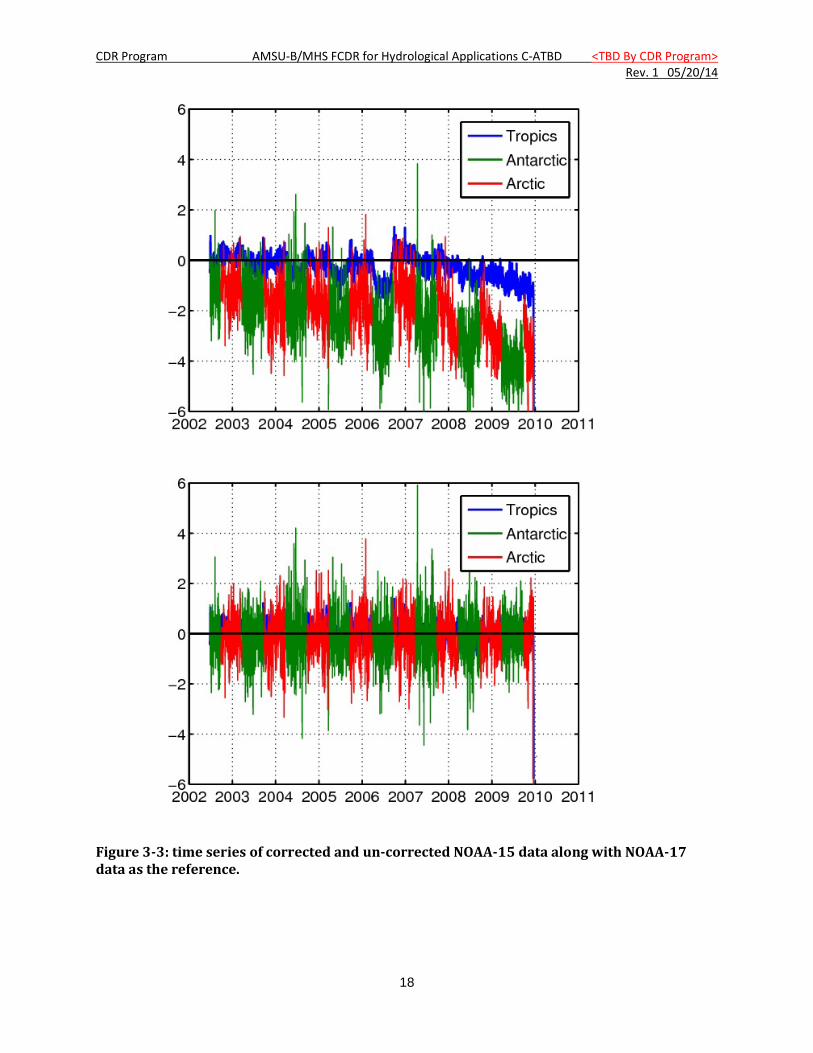
Since the inter-calibration coefficients are scene dependent, thus the collocations between reference and target satellites are required to cover a wide range of brightness temperatures. We employed area averaged brightness temperature from Tropical region (tropical band expanding from 30S to 30 N) as the warm end of the brightness temperature range, and also area averaged brightness temperatures from Antarctica (< 75 S) and Arctic (> 75 N) as the cold end of the brightness temperatures. Since over tropical regions, there is a small diurnal veneration in cloud regimes, therefore we used a cloud filter which is based on the difference between brightness temperatures from different channels to filter out cloud contaminated observations. Besides, since the satellites' overpass time is different for primary and secondary satellites, therefore we only used the area averaged data over ocean to eliminate the diurnal variation over land. Then we calculated the linear regression coefficients between the observations from the primary and secondary satellites in a monthly period. These monthly values then were interpolated using a cubic-spline method to derive the daily values. It is preferred to calculate the coefficients in a monthly basis to avoid noise in the coefficients. Figure 3.3 shows the time series of NOAA-15 Channel 5 corrected and un-corrected data along with NOAA-17 time series.
CDR Program AMSU-B/MHS FCDR for Hydrological Applications C-ATBD <TBD By CDR Program> Rev. 1 05/20/14
17
3.4.2 Data Merging Strategy The original sampling provided by the six AMSU-B/MHS sensors is preserved in
the output FCDR data with no merging of the resulting data either in space or in time. The resulting Tb FCDR from each of the six sensors are intercalibrated to be physically consistent with the observed Tb from NOAA-17/-18. AMSU-B/MHS channels, especially channels sensitive to lower troposphere, are subject to the influence from both the atmosphere and the surface, and consequently show diurnal cycle effect especially over land. Since the six satellites have different Equatorial Crossing Time (ECT), i.e. they overpass a certain location on earth at different times of the day, the observations of the AMSU-B/MHS channels from these satellites cannot be merged without removing the diurnal effect in the measurements. Most of the TCDR derived from the AMSU-B/MHS FCDR also have diurnal cycle, so it is important for the FCDR to retain its temporal signature so as to preserve the diurnal properties of the TCDR. Therefore, there is no plan to merge either the FCDR or TCDR for this project.
3.4.3 Numerical Strategy For geolocation correction, the subroutines to compute the spacecraft position
and velocity from the Two-Line Element (TLE) files were implemented based on the North American Aerospace Defense Command (NORAD) SGP code (Vallado et al., 2006). Details on the numerical calculations of the pixel geolocation and associated angles are provided in Moradi et al. (2013).
CDR Program AMSU-B/MHS FCDR for Hydrological Applications C-ATBD <TBD By CDR Program> Rev. 1 05/20/14
18
Figure 3-3: time series of corrected and un-corrected NOAA-15 data along with NOAA-17 data as the reference.
CDR Program AMSU-B/MHS FCDR for Hydrological Applications C-ATBD <TBD By CDR Program> Rev. 1 05/20/14
19
3.4.4 Calculations Details on the processing steps involved in the algorithm are provided in Section
3.2.
3.4.5 Look-Up Table Description Five stages of the algorithm use data that has been calculated and is stored in
static look-up tables. The look-up tables used in each stage are described in this section.
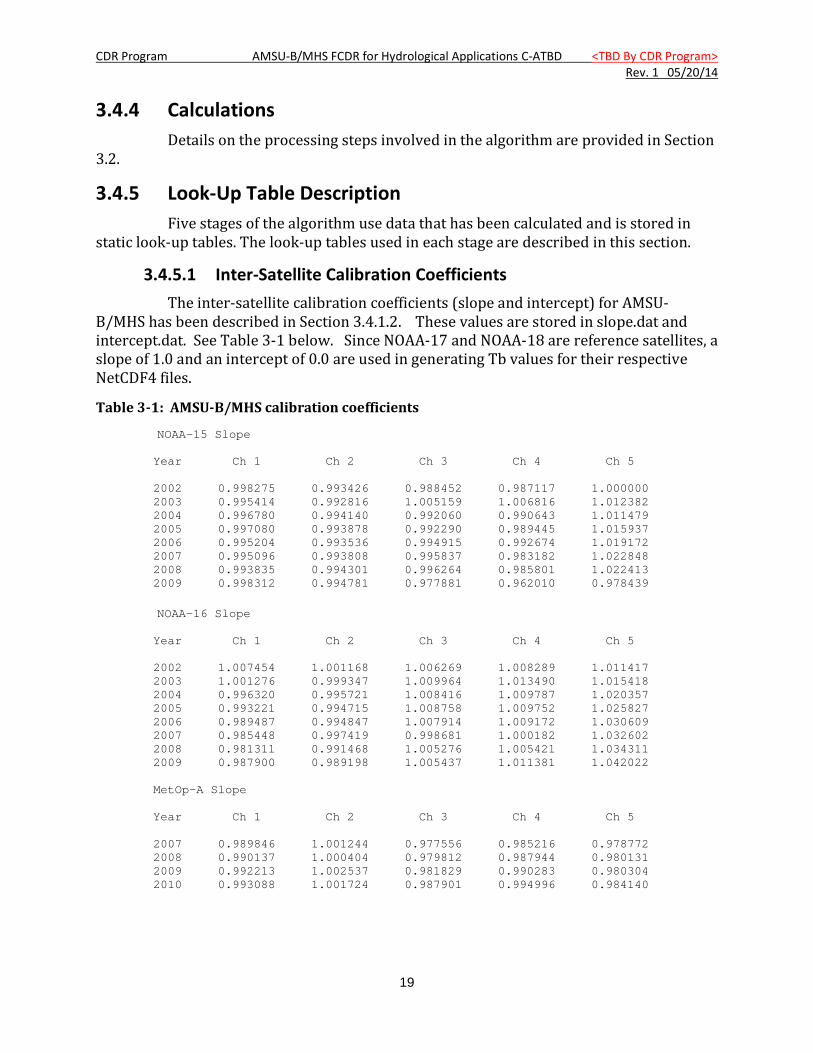
3.4.5.1 Inter-Satellite Calibration Coefficients The inter-satellite calibration coefficients (slope and intercept) for AMSU-
B/MHS has been described in Section 3.4.1.2. These values are stored in slope.dat and intercept.dat. See Table 3-1 below. Since NOAA-17 and NOAA-18 are reference satellites, a slope of 1.0 and an intercept of 0.0 are used in generating Tb values for their respective NetCDF4 files.
Table 3-1: AMSU-B/MHS calibration coefficients
NOAA-15 Slope Year Ch 1 Ch 2 Ch 3 Ch 4 Ch 5 2002 0.998275 0.993426 0.988452 0.987117 1.000000 2003 0.995414 0.992816 1.005159 1.006816 1.012382 2004 0.996780 0.994140 0.992060 0.990643 1.011479 2005 0.997080 0.993878 0.992290 0.989445 1.015937 2006 0.995204 0.993536 0.994915 0.992674 1.019172 2007 0.995096 0.993808 0.995837 0.983182 1.022848 2008 0.993835 0.994301 0.996264 0.985801 1.022413 2009 0.998312 0.994781 0.977881 0.962010 0.978439 NOAA-16 Slope Year Ch 1 Ch 2 Ch 3 Ch 4 Ch 5 2002 1.007454 1.001168 1.006269 1.008289 1.011417 2003 1.001276 0.999347 1.009964 1.013490 1.015418 2004 0.996320 0.995721 1.008416 1.009787 1.020357 2005 0.993221 0.994715 1.008758 1.009752 1.025827 2006 0.989487 0.994847 1.007914 1.009172 1.030609 2007 0.985448 0.997419 0.998681 1.000182 1.032602 2008 0.981311 0.991468 1.005276 1.005421 1.034311 2009 0.987900 0.989198 1.005437 1.011381 1.042022 MetOp-A Slope Year Ch 1 Ch 2 Ch 3 Ch 4 Ch 5 2007 0.989846 1.001244 0.977556 0.985216 0.978772 2008 0.990137 1.000404 0.979812 0.987944 0.980131 2009 0.992213 1.002537 0.981829 0.990283 0.980304 2010 0.993088 1.001724 0.987901 0.994996 0.984140
CDR Program AMSU-B/MHS FCDR for Hydrological Applications C-ATBD <TBD By CDR Program> Rev. 1 05/20/14
20
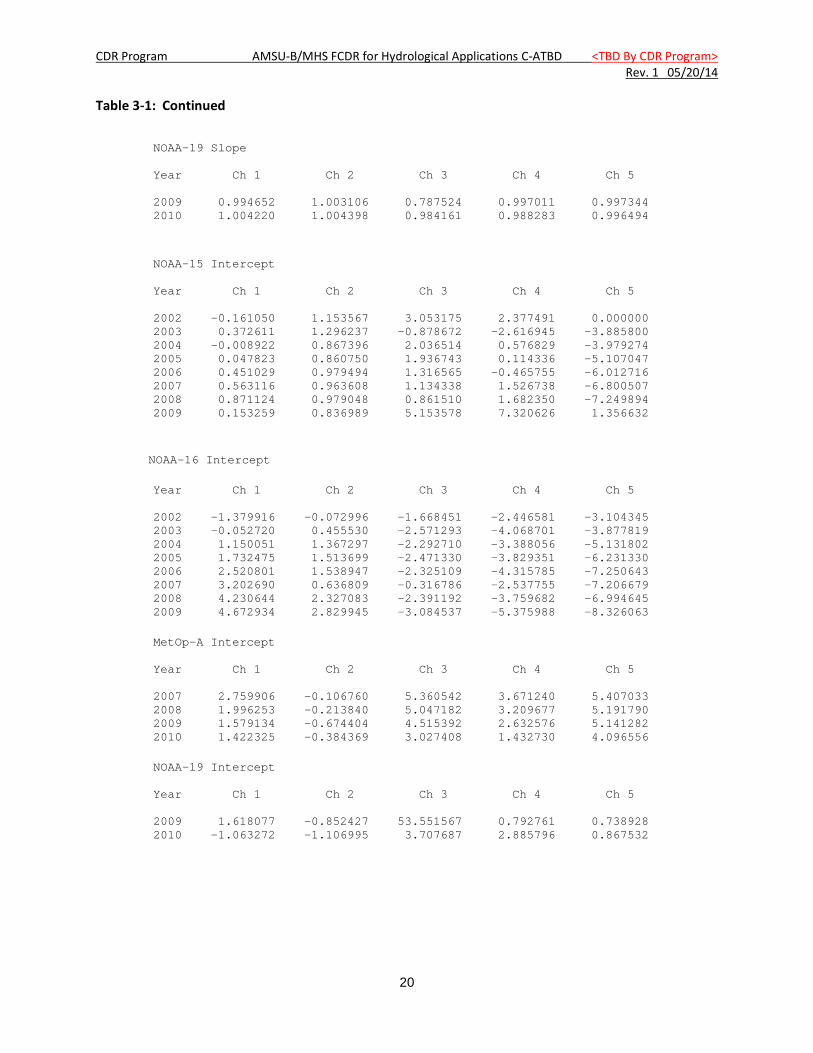
Table 3-1: Continued NOAA-19 Slope Year Ch 1 Ch 2 Ch 3 Ch 4 Ch 5 2009 0.994652 1.003106 0.787524 0.997011 0.997344 2010 1.004220 1.004398 0.984161 0.988283 0.996494
NOAA-15 Intercept Year Ch 1 Ch 2 Ch 3 Ch 4 Ch 5 2002 -0.161050 1.153567 3.053175 2.377491 0.000000 2003 0.372611 1.296237 -0.878672 -2.616945 -3.885800 2004 -0.008922 0.867396 2.036514 0.576829 -3.979274 2005 0.047823 0.860750 1.936743 0.114336 -5.107047 2006 0.451029 0.979494 1.316565 -0.465755 -6.012716 2007 0.563116 0.963608 1.134338 1.526738 -6.800507 2008 0.871124 0.979048 0.861510 1.682350 -7.249894 2009 0.153259 0.836989 5.153578 7.320626 1.356632 NOAA-16 Intercept Year Ch 1 Ch 2 Ch 3 Ch 4 Ch 5 2002 -1.379916 -0.072996 -1.668451 -2.446581 -3.104345 2003 -0.052720 0.455530 -2.571293 -4.068701 -3.877819 2004 1.150051 1.367297 -2.292710 -3.388056 -5.131802 2005 1.732475 1.513699 -2.471330 -3.829351 -6.231330 2006 2.520801 1.538947 -2.325109 -4.315785 -7.250643 2007 3.202690 0.636809 -0.316786 -2.537755 -7.206679 2008 4.230644 2.327083 -2.391192 -3.759682 -6.994645 2009 4.672934 2.829945 -3.084537 -5.375988 -8.326063 MetOp-A Intercept Year Ch 1 Ch 2 Ch 3 Ch 4 Ch 5 2007 2.759906 -0.106760 5.360542 3.671240 5.407033 2008 1.996253 -0.213840 5.047182 3.209677 5.191790 2009 1.579134 -0.674404 4.515392 2.632576 5.141282 2010 1.422325 -0.384369 3.027408 1.432730 4.096556 NOAA-19 Intercept Year Ch 1 Ch 2 Ch 3 Ch 4 Ch 5 2009 1.618077 -0.852427 53.551567 0.792761 0.738928 2010 -1.063272 -1.106995 3.707687 2.885796 0.867532
CDR Program AMSU-B/MHS FCDR for Hydrological Applications C-ATBD <TBD By CDR Program> Rev. 1 05/20/14
21
3.4.5.2 Ta to Tb Conversion The antenna pattern correction (APC) coefficients used to convert antenna
temperature (Ta) to Tb for AMSU-B/MHS are stored in text files *_APC.dat, with * stands for satellite name, e.g. N15_APC.dat. These coefficients were directly taken from the ATOVS and AVHRR Pre-processing Package (AAPP) and derivation of these coefficients is described in Hewison and Saunders (1996).
3.4.5.3 Latbox Calculation In order to process microwave sensor observation, it is often important to know
the underlying surface type (land, ocean, or coast) by using a land-sea mask. The land-sea mask included in the AMSU-B/MHS FCDR Production Package is a gridded map with cylindrical projection. Since AMSU-B/MHS footprint size varies across the scan line due to the cross-scan design, the number of land-sea map pixels falling into each footprint is not fixed even at the same latitude. The look-up table, latbox_table90.dat, provides the information on how many pixels a footprint should cover based on its beam position.
3.4.5.4 Climatological Quality Check The lower and upper limits of observed brightness temperatures for the five
AMSU-B/MHS channels have been specified in the look-up table input.dat based on climatology. If a brightness temperature fails to pass the climatological quality check, a fill value is given, and a flag is set in the corresponding QC bit.
3.4.6 Parameterization The antenna pattern correction or APC is a parameterization of the measured
antenna pattern. It is described in Section 3.3 and AAPP documentation.
3.4.7 Algorithm Output For each input L1B file, the algorithm produces an output FCDR file in NetCDF4
format. There are approximately 14 files per sensor per day and each file is approximately 8 Mbytes. The FCDR file contains the final inter-calibrated brightness temperature (Tb) for each channel. Two groups of variables are provided. The first group, geolocation/time, contains latitude, longitude, scan time, and scan time since 1998. The second group has surface type, orbital mode, earth incidence angle, solar zenith angle, corrected Tb data for the 89 GHz, 157 GHz, 183 +/-1 GHz, 183 +/-3 GHz and 183 +/- 7 GHz channels, and quality flags. The data are truncated to the nearest 0.001 degree for the latitude and longitude values and to the nearest 0.0001 K for the Tb and 0.01 degree for view angles. Internal NetCDF data compression is used to compress the files. An example of the format of the FCDR files is provided in Appendix C.
CDR Program AMSU-B/MHS FCDR for Hydrological Applications C-ATBD <TBD By CDR Program> Rev. 1 05/20/14
22
4. Test Datasets and Outputs
4.1 Test Input Datasets The test dataset is composed of one month of AMSU-B/MHS Level-1B data from
NOAA-15, -16, -17, -18, -19 and Metop-A for September 2009 and the following ancillary data: corrected geolocation data, inter-satellite calibration correction coefficients, and land-sea mask data. The corrected geolocation data include latitude, longitude, EIA, and scan angle for each channel. They were generated offline using a geolocation correction approach developed in this project (Moradi et al., 2013). The inter-satellite calibration method developed in this study was applied to derive the correction coefficients. All test input data are operational data. It is noted that, since many of the correction coefficients were derived from long term data, the statistics from the one-month test data will not closely resemble the general statistics of the FCDR dataset.
4.2 Test Output Analysis
4.2.1 Reproducibility A set of brightness temperature FCDRs derived from the test L1B data during
development is also delivered with the test input data. The brightness temperatures generated from the AMSU-B/MHS FCDR processing system using the test input data should reproduce the same FCDRs as the data created during development. Comparisons of basic statistics such as monthly mean and standard deviation of the brightness temperatures between the two data sets will suffice to confirm the reproducibility of the test data.
4.2.2 Precision and Accuracy This project includes two major accomplishments: inter-satellite calibration and
geolocation correction. Precision of the inter-satellite calibrated data is measured by the standard deviation of the brightness temperatures difference between satellite. NOAA-17 AMSU-B acts as the reference satellite for NOAA-15 and NOAA-16 and NOAA-18 is used as reference for NOAA-19 and MetOp-A because of the small frequency difference between MHS and AMSU-B channels.
To determine the accuracy of the FCDR, SI traceable standards for the AMSU-B/MHS microwave frequencies are required. However, such standards are not yet available. Also unavailable are reliable and stable vicarious targets that can be used to determine the accuracy of the AMSU-B/MHS measurements. The lack of “truth” makes it difficult to compute the accuracy of the AMSU-B/MHS FCDR.
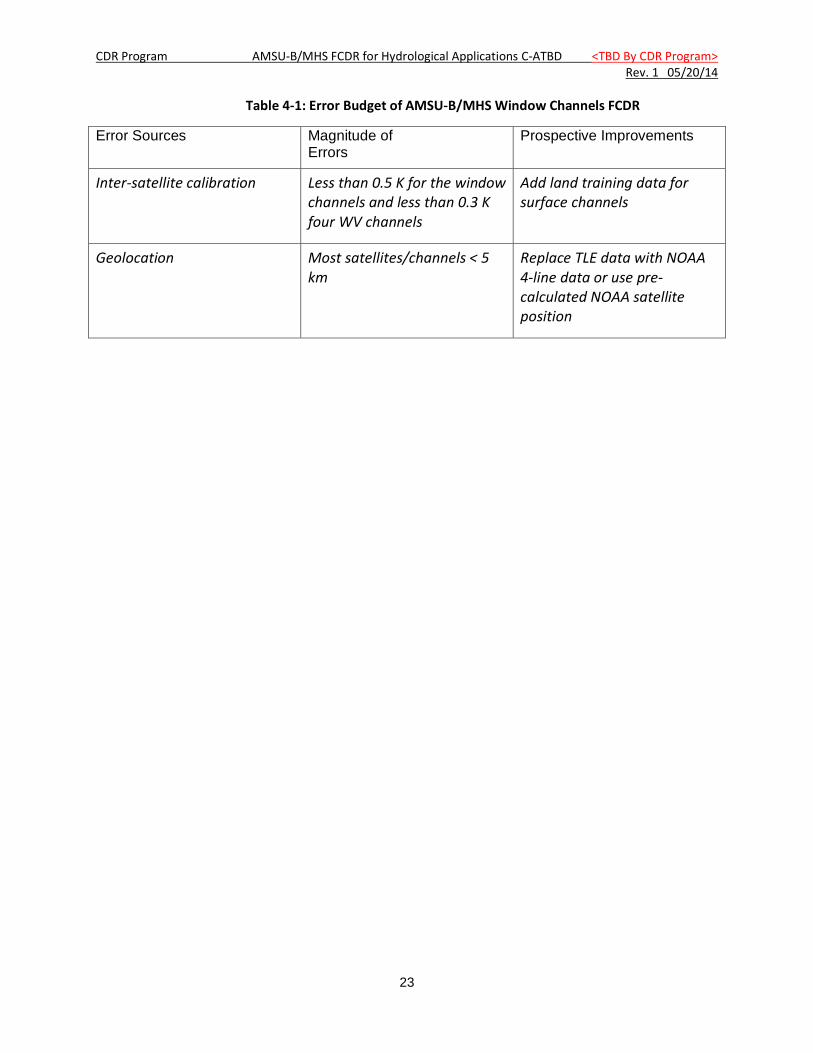
4.2.3 Error Budget The various errors associated with the AMSU-B/MHS FCDR data are listed in
Table 4-1. It is noted that these errors cannot be combined in simple forms.
CDR Program AMSU-B/MHS FCDR for Hydrological Applications C-ATBD <TBD By CDR Program> Rev. 1 05/20/14
23
Table 4-1: Error Budget of AMSU-B/MHS Window Channels FCDR
Error Sources
Magnitude of Errors
Prospective Improvements
Inter-satellite calibration Less than 0.5 K for the window channels and less than 0.3 K four WV channels
Add land training data for surface channels
Geolocation Most satellites/channels < 5 km
Replace TLE data with NOAA 4-line data or use pre-calculated NOAA satellite position
CDR Program AMSU-B/MHS FCDR for Hydrological Applications C-ATBD <TBD By CDR Program> Rev. 1 05/20/14
24
5. Practical Considerations
5.1 Numerical Computation Considerations Endian
The AMSU-B/MHS FCDR Production Package assumes IEEE little-endian environment. Note the original AMSU/MHS L1B data is in IEEE big-endian, so endian swapping is required before further processing.
Precision
The code can be run under 64-bit mode.
Parallelization
This production package is not considered computationally intensive so parallel computation is not performed.
5.2 Programming and Procedural Considerations The code that implements the FCDR algorithms follows standard procedural
programming constructs. No unusual programming techniques or optimizations are used as simplicity was an important design criterion.
5.3 Quality Assessment and Diagnostics The output of geo-location correction has been assessed, and the results are
described in Moradi et al. (2013). Further assessment of the inter-satellite calibration will be implemented.
5.4 Exception Handling Error and exception conditions are handled by direct checking of
conditions/return codes in the main control flow rather than by a language-supported exception construct.
5.4.1 Conditions Checked The following conditions identify errors that necessitate the program terminate.
These errors are trapped and the program prints a suitable message, then exits gracefully with a non-zero status indicating the type of error.
• If an incorrect number of arguments are supplied to the program, a usage message is printed and it exits.
• If there is an error opening or reading an input file, the program prints an error message and exits.
CDR Program AMSU-B/MHS FCDR for Hydrological Applications C-ATBD <TBD By CDR Program> Rev. 1 05/20/14
25
• If there is an error creating or writing to an output file, the program prints an error message and exits.
The following exceptions are trapped and recovered from by skipping over the item that can’t be processed, setting codes to track this, and continuing processing with the next item:
• If there is an error opening or reading a standalone geolocation file, the processing of this orbit is skipped over, and the program execution continues.
• If an orbit has scan number smaller than an allowed limit (700), the processing of this orbit is skipped over, and the program execution continues.
• If an input Tb < 10 K or Tb > 400 K, that Tb is set equal -99., and program execution continues.
• If an input latitude < -90 or latitude > 90 , that latitude is set equal -999., and program execution continues.
• If an input longitude < -180 or longitude > 180 , that longitude is set equal -999., and program execution continues.
• If an input solar zenith angle < -90 or solar zenith angle > 90 , that solar zenith angle is set equal -999., and program execution continues.
• If an input earth incidence angle < 0 or earth incidence angle > 180 , that earth incidence angle is set equal -999., and program execution continues.
5.4.2 Conditions Not Checked The following possible error condition is not checked for:
• In the unlikely event that the program would run out of memory, the process would terminate unexpectedly.
5.4.3 Conditions Not Considered Exceptions Where data fields are missing or do not satisfy quality control checks (described
in Section 3.2.7), quality flags are set, and for those quality issues classified as serious the corresponding data fields are set to indicate missing data. All corrections/conversions are applied only to non-missing data, and if any processing stage identifies certain data as missing, it remains missing for all future processing stages. This is considered normal processing and not an exception condition.
5.5 Algorithm Validation The algorithm validation has been carried out with regards to geolocation
correction, and inter-satellite calibration. Most of the results have been presented in
CDR Program AMSU-B/MHS FCDR for Hydrological Applications C-ATBD <TBD By CDR Program> Rev. 1 05/20/14
26
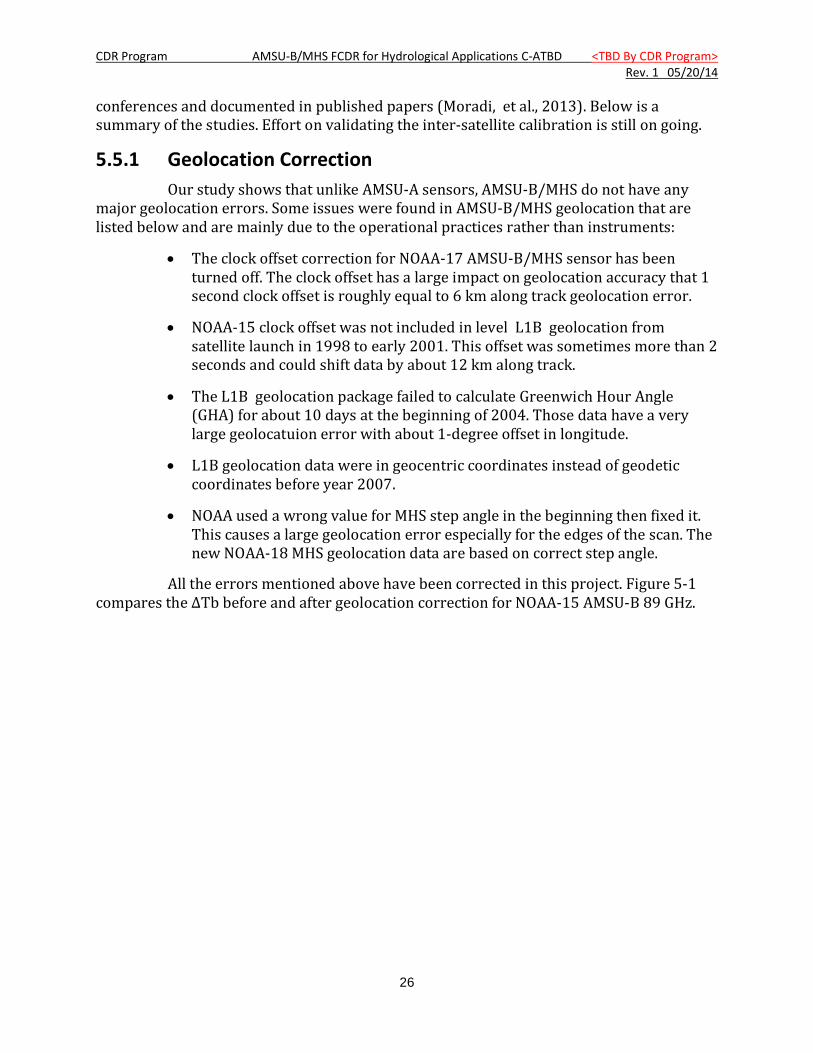
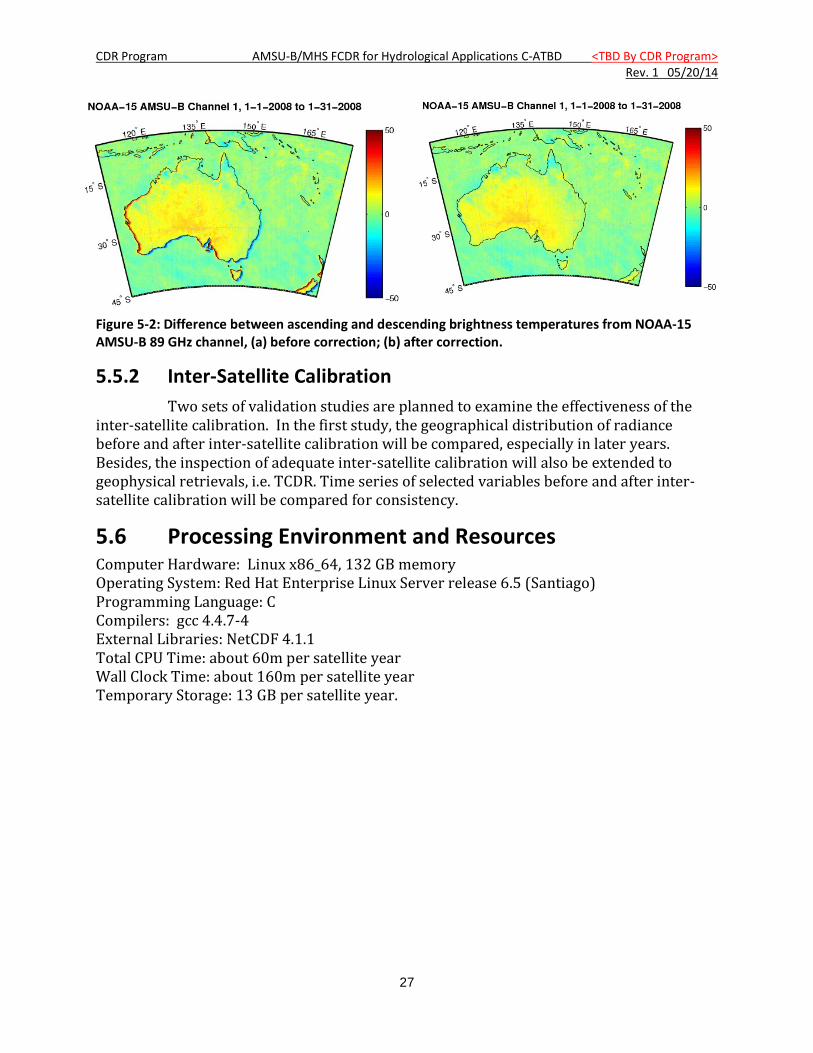
conferences and documented in published papers (Moradi, et al., 2013). Below is a summary of the studies. Effort on validating the inter-satellite calibration is still on going.
5.5.1 Geolocation Correction Our study shows that unlike AMSU-A sensors, AMSU-B/MHS do not have any
major geolocation errors. Some issues were found in AMSU-B/MHS geolocation that are listed below and are mainly due to the operational practices rather than instruments:
• The clock offset correction for NOAA-17 AMSU-B/MHS sensor has been turned off. The clock offset has a large impact on geolocation accuracy that 1 second clock offset is roughly equal to 6 km along track geolocation error.
• NOAA-15 clock offset was not included in level L1B geolocation from satellite launch in 1998 to early 2001. This offset was sometimes more than 2 seconds and could shift data by about 12 km along track.
• The L1B geolocation package failed to calculate Greenwich Hour Angle (GHA) for about 10 days at the beginning of 2004. Those data have a very large geolocatuion error with about 1-degree offset in longitude.
• L1B geolocation data were in geocentric coordinates instead of geodetic coordinates before year 2007.
• NOAA used a wrong value for MHS step angle in the beginning then fixed it. This causes a large geolocation error especially for the edges of the scan. The new NOAA-18 MHS geolocation data are based on correct step angle.
All the errors mentioned above have been corrected in this project. Figure 5-1 compares the ∆Tb before and after geolocation correction for NOAA-15 AMSU-B 89 GHz.
CDR Program AMSU-B/MHS FCDR for Hydrological Applications C-ATBD <TBD By CDR Program> Rev. 1 05/20/14
27
Figure 5-2: Difference between ascending and descending brightness temperatures from NOAA-15 AMSU-B 89 GHz channel, (a) before correction; (b) after correction.
5.5.2 Inter-Satellite Calibration Two sets of validation studies are planned to examine the effectiveness of the
inter-satellite calibration. In the first study, the geographical distribution of radiance before and after inter-satellite calibration will be compared, especially in later years. Besides, the inspection of adequate inter-satellite calibration will also be extended to geophysical retrievals, i.e. TCDR. Time series of selected variables before and after inter-satellite calibration will be compared for consistency.
5.6 Processing Environment and Resources Computer Hardware: Linux x86_64, 132 GB memory Operating System: Red Hat Enterprise Linux Server release 6.5 (Santiago) Programming Language: C Compilers: gcc 4.4.7-4 External Libraries: NetCDF 4.1.1 Total CPU Time: about 60m per satellite year Wall Clock Time: about 160m per satellite year Temporary Storage: 13 GB per satellite year.
CDR Program AMSU-B/MHS FCDR for Hydrological Applications C-ATBD <TBD By CDR Program> Rev. 1 05/20/14
28
6. Assumptions and Limitations
6.1 Algorithm Performance The inter-satellite calibration is performed following the approach developed in
this study which uses daily averaged brightness temperatures over tropical oceans as well as nighttime data over Arctic and Antarctica. It is estimated that the diurnal variation of brightness temperatures is small in these regions hence the time difference between reference and target satellites can be neglected. The monthly coefficients are calculated using three months of data (one month before the given month and one month after) then are interpolated to calculate daily coefficients. The drawback of this method is that the short term variations are smooth out and are not represented in the calibrated data. However, estimating monthly intercalibration coefficients then interpolating to daily values, yields more stable results than directly calculating the daily values.
CDR Program AMSU-B/MHS FCDR for Hydrological Applications C-ATBD <TBD By CDR Program> Rev. 1 05/20/14
29
7. Future Enhancements
7.1 Enhancement 1 – Extension of NOAA-15 FCDR Record NOAA-15 was launched on May 13, 1998 while the current NOAA-15 AMSU-B
FCDR starts on January 1, 2000. With some additional effort, the NOAA-15 FCDR record can be extended back to late October 1998. Since AMSU-B data were affected by RFI, the quality of the data even after corrections may not be very good compared to the data after 2000. Therefore, an extensive evaluation will be required for the recovered NOAA-15 AMSU-B data before 2000.
7.2 Enhancement 2 – Inter-Satellite Calibration over Land, Scan Asymmetry, AMSU-B to MHS differences The inter-satellite calibration has been performed over tropical ocean to take
advantage of the weak diurnal cycle effect and data homogeneity in this region. Since land emissivity is about twice as high as ocean emissivity, the brightness temperature over land is usually much higher than over ocean in tropical and sub-tropical regions. Therefore, the inter-satellite calibration results are more representative of the low end of the brightness temperature range rather than of the higher brightness temperatures. Since inter-satellite bias can be scene temperature dependent, it is desirable that inter-satellite calibration is also performed over land in the future. A significant challenge to overcome in the future study will be to accurately model the diurnal effect in window channels over land. The difference between land and ocean is only expected to be significant for window channels since water vapor channels are not sensitive to the land surface emissivity, this practice is not required for the water vapor channels.
Scan asymmetry is another bias in AMSu-B/MHS data that need to be considered. Although, some of the satellites such as NOAA-18 MHS do not suffer from scan asymmetry but other satellites such as NOAA-15 AMSU-B and MetOp-A MHS show a significant scan asymmetry.
Although, AMSU-B and MHS sensors are very similar but there are some small differences that prevent merging the two datasets, including polarization difference as well as a small frequency change for second and third channels. Some extensive studies are required to quantify the differences due to these changes and seek the possibility to merge the two datasets.
CDR Program AMSU-B/MHS FCDR for Hydrological Applications C-ATBD <TBD By CDR Program> Rev. 1 05/20/14
30
8. References Chen, Y., Weng, F., Han, Y., and Liu, Q (2008). Validation of the Community Radiative Transfer Model
by using CloudSat data, J. Geophys. Res., vol. 113, D00A03, doi:10.1029/2007JD009561.
EUMETSAT (2010). ATOVS Level L1B Product Guide, available at http://oiswww.eumetsat.org/WEBOPS/eps-pg/ATOVS-L1/ATOVSL1-PG-index.htm.
Ferraro, R.R., F. Weng, N. Grody, L. Zhao, H. Meng, C. Kongoli, P. Pellegrino, S. Qiu and C. Dean (2005). NOAA operational hydrological products derived from the AMSU. IEEE Trans. Geo. Rem. Sens., 43: 1036 – 1049.
Kidwell, K.B., edited (1998). NOAA Polar Orbiter Data User’s Guide, available at http://www.ncdc.noaa.gov/oa/pod-guide/ncdc/docs/podug/index.htm.
Mo, T (1999). AMSU-B/MHS antenna pattern corrections. IEEE Trans. Geosci. Remote Sens., 37(1): 103-112, 1999.
Moradi, I., H. Meng, R.R. Ferraro, and S. Bilanow (2013). Correcting geolocation errors for microwave instruments aboard NOAA satellites. IEEE Trans. Geosci. Remote Sens., 51, 3625-3637. DOI: 10.1109/TGRS.2012.2225840.
Robel, J., et al. edited (2009). NOAA KLM User’s Guide, available at http://www.ncdc.noaa.gov/oa/pod-guide/ncdc/docs/podug/index.htm.
D. A. Vallado, P. Crawford, R. Hujsak, and T. Kelso, Revisiting spacetrack report #3. AIAA/AAS Astrodynamics Specialist Conf., Keystone, CO, American Institute of Aeronautics and Astronautics, Aug. 2006.
CDR Program AMSU-B/MHS FCDR for Hydrological Applications C-ATBD <TBD By CDR Program> Rev. 1 05/20/14
31
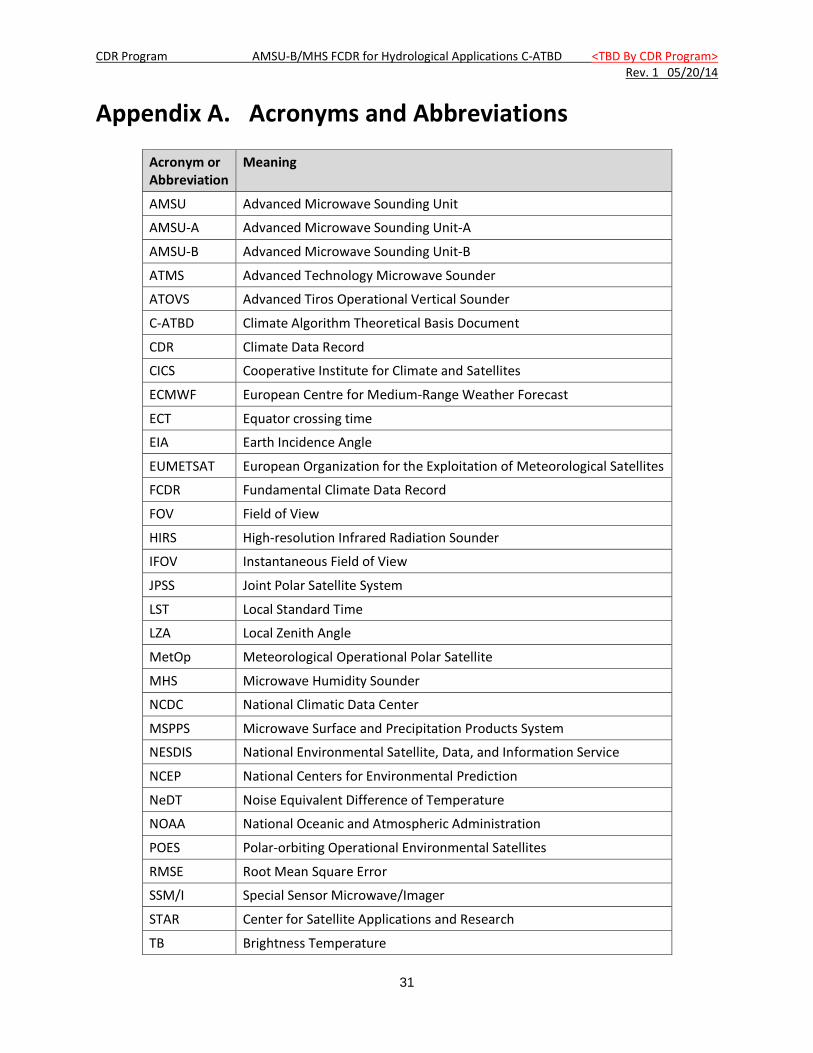
Appendix A. Acronyms and Abbreviations
Acronym or Abbreviation
Meaning
AMSU Advanced Microwave Sounding Unit
AMSU-A Advanced Microwave Sounding Unit-A
AMSU-B Advanced Microwave Sounding Unit-B
ATMS Advanced Technology Microwave Sounder
ATOVS Advanced Tiros Operational Vertical Sounder
C-ATBD Climate Algorithm Theoretical Basis Document
CDR Climate Data Record
CICS Cooperative Institute for Climate and Satellites
ECMWF European Centre for Medium-Range Weather Forecast
ECT Equator crossing time
EIA Earth Incidence Angle
EUMETSAT European Organization for the Exploitation of Meteorological Satellites
FCDR Fundamental Climate Data Record
FOV Field of View
HIRS High-resolution Infrared Radiation Sounder
IFOV Instantaneous Field of View
JPSS Joint Polar Satellite System
LST Local Standard Time
LZA Local Zenith Angle
MetOp Meteorological Operational Polar Satellite
MHS Microwave Humidity Sounder
NCDC National Climatic Data Center
MSPPS Microwave Surface and Precipitation Products System
NESDIS National Environmental Satellite, Data, and Information Service
NCEP National Centers for Environmental Prediction
NeDT Noise Equivalent Difference of Temperature
NOAA National Oceanic and Atmospheric Administration
POES Polar-orbiting Operational Environmental Satellites
RMSE Root Mean Square Error
SSM/I Special Sensor Microwave/Imager
STAR Center for Satellite Applications and Research
TB Brightness Temperature
CDR Program AMSU-B/MHS FCDR for Hydrological Applications C-ATBD <TBD By CDR Program> Rev. 1 05/20/14
32
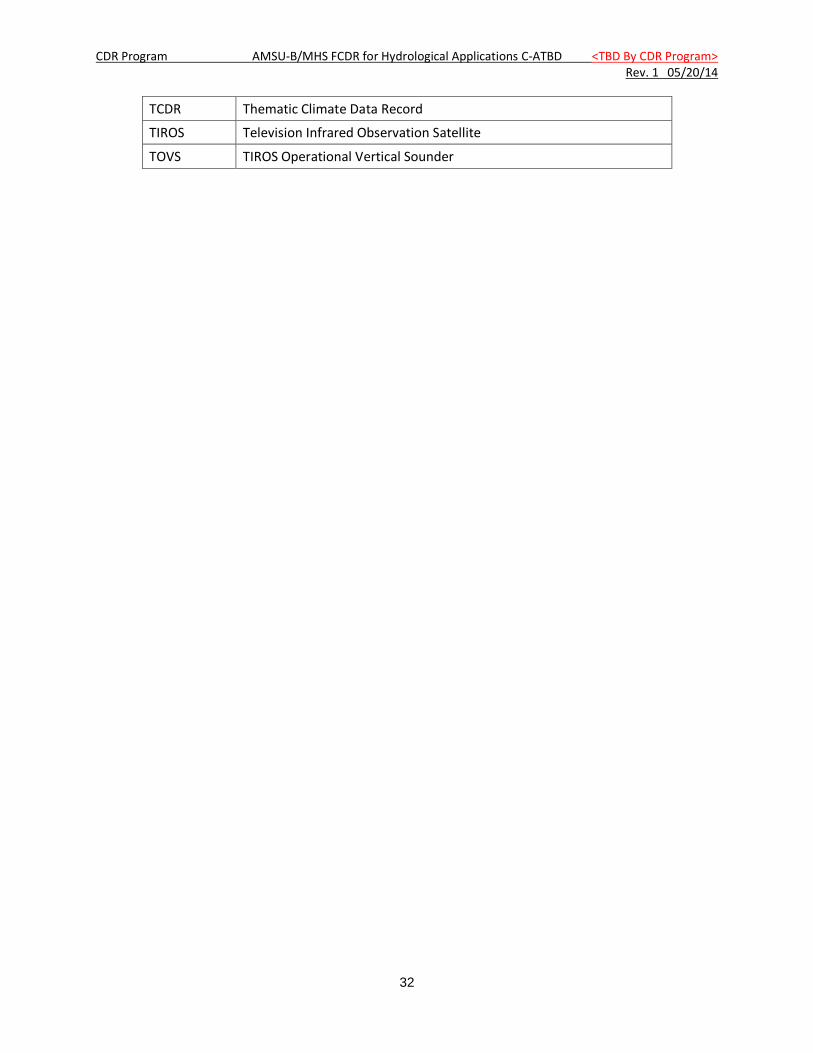
TCDR Thematic Climate Data Record
TIROS Television Infrared Observation Satellite
TOVS TIROS Operational Vertical Sounder
CDR Program AMSU-B/MHS FCDR for Hydrological Applications C-ATBD <TBD By CDR Program> Rev. 1 05/20/14
33
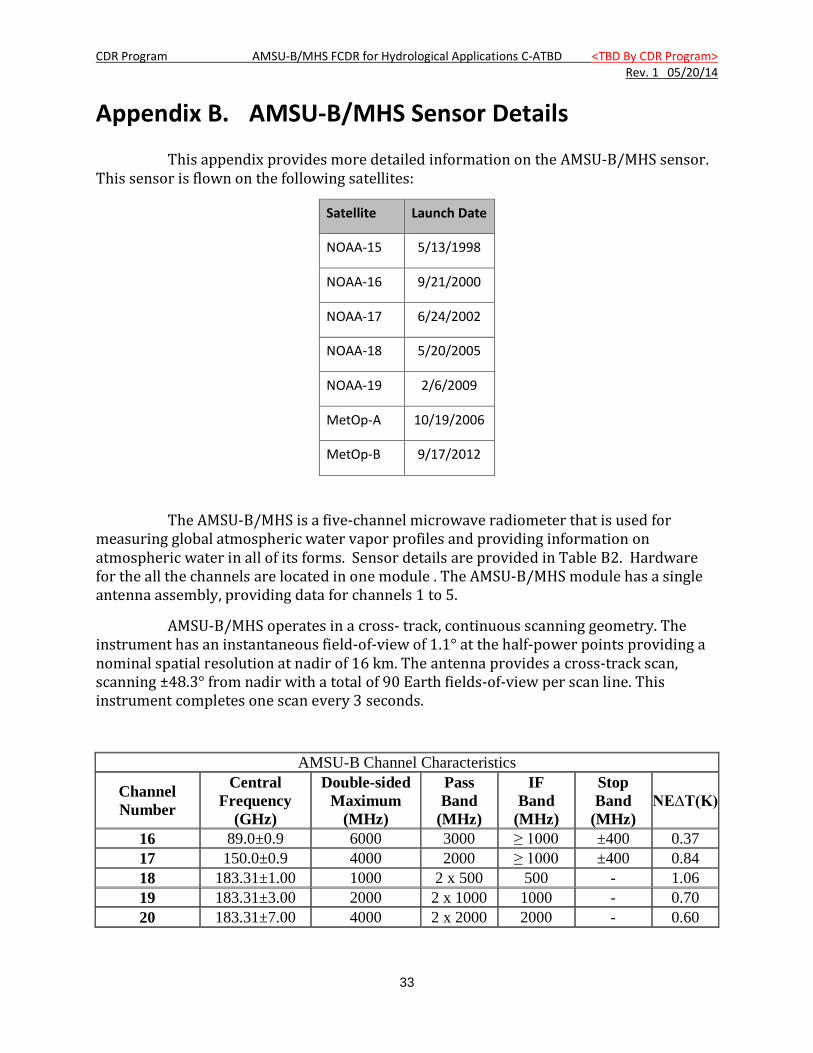
Appendix B. AMSU-B/MHS Sensor Details
This appendix provides more detailed information on the AMSU-B/MHS sensor. This sensor is flown on the following satellites:
Satellite Launch Date
NOAA-15 5/13/1998
NOAA-16 9/21/2000
NOAA-17 6/24/2002
NOAA-18 5/20/2005
NOAA-19 2/6/2009
MetOp-A 10/19/2006
MetOp-B 9/17/2012
The AMSU-B/MHS is a five-channel microwave radiometer that is used for measuring global atmospheric water vapor profiles and providing information on atmospheric water in all of its forms. Sensor details are provided in Table B2. Hardware for the all the channels are located in one module . The AMSU-B/MHS module has a single antenna assembly, providing data for channels 1 to 5.
AMSU-B/MHS operates in a cross- track, continuous scanning geometry. The instrument has an instantaneous field-of-view of 1.1° at the half-power points providing a nominal spatial resolution at nadir of 16 km. The antenna provides a cross-track scan, scanning ±48.3° from nadir with a total of 90 Earth fields-of-view per scan line. This instrument completes one scan every 3 seconds.
AMSU-B Channel Characteristics
Channel Number
Central Frequency
(GHz)
Double-sided Maximum
(MHz)
Pass Band
(MHz)
IF Band
(MHz)
Stop Band
(MHz) NE∆T(K)
16 89.0±0.9 6000 3000 ≥ 1000 ±400 0.37 17 150.0±0.9 4000 2000 ≥ 1000 ±400 0.84 18 183.31±1.00 1000 2 x 500 500 - 1.06 19 183.31±3.00 2000 2 x 1000 1000 - 0.70 20 183.31±7.00 4000 2 x 2000 2000 - 0.60
CDR Program AMSU-B/MHS FCDR for Hydrological Applications C-ATBD <TBD By CDR Program> Rev. 1 05/20/14
34
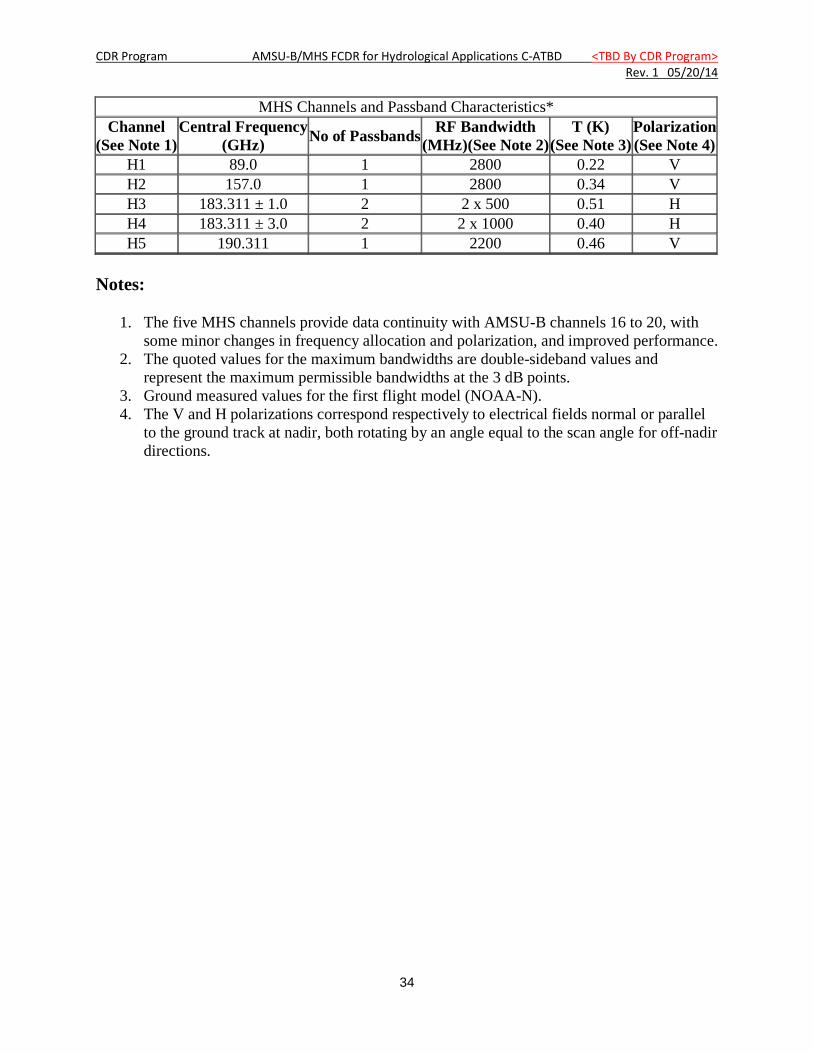
MHS Channels and Passband Characteristics* Channel
(See Note 1) Central Frequency
(GHz) No of Passbands RF Bandwidth (MHz)(See Note 2)
T (K) (See Note 3)
Polarization (See Note 4)
H1 89.0 1 2800 0.22 V H2 157.0 1 2800 0.34 V H3 183.311 ± 1.0 2 2 x 500 0.51 H H4 183.311 ± 3.0 2 2 x 1000 0.40 H H5 190.311 1 2200 0.46 V
Notes:
1. The five MHS channels provide data continuity with AMSU-B channels 16 to 20, with some minor changes in frequency allocation and polarization, and improved performance.
2. The quoted values for the maximum bandwidths are double-sideband values and represent the maximum permissible bandwidths at the 3 dB points.
3. Ground measured values for the first flight model (NOAA-N). 4. The V and H polarizations correspond respectively to electrical fields normal or parallel
to the ground track at nadir, both rotating by an angle equal to the scan angle for off-nadir directions.
CDR Program AMSU-B/MHS FCDR for Hydrological Applications C-ATBD <TBD By CDR Program> Rev. 1 05/20/14
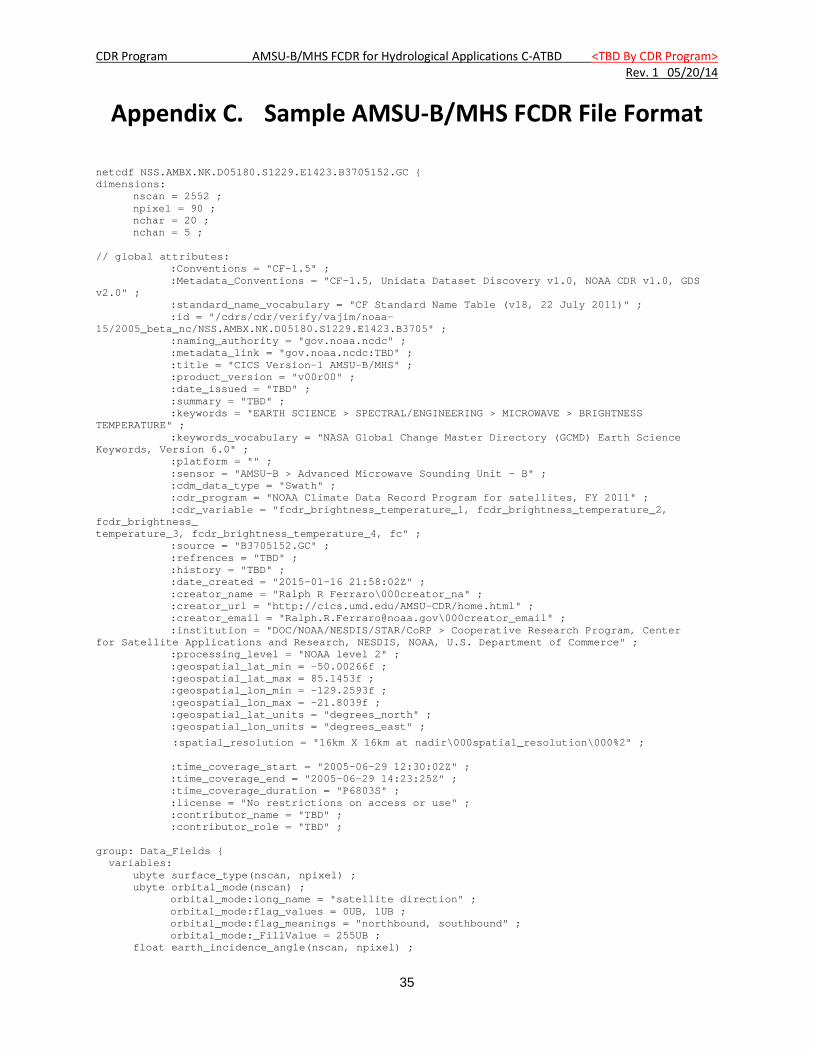
35
Appendix C. Sample AMSU-B/MHS FCDR File Format netcdf NSS.AMBX.NK.D05180.S1229.E1423.B3705152.GC { dimensions: nscan = 2552 ; npixel = 90 ; nchar = 20 ; nchan = 5 ; // global attributes: :Conventions = "CF-1.5" ; :Metadata_Conventions = "CF-1.5, Unidata Dataset Discovery v1.0, NOAA CDR v1.0, GDS v2.0" ; :standard_name_vocabulary = "CF Standard Name Table (v18, 22 July 2011)" ; :id = "/cdrs/cdr/verify/vajim/noaa-15/2005_beta_nc/NSS.AMBX.NK.D05180.S1229.E1423.B3705" ; :naming_authority = "gov.noaa.ncdc" ; :metadata_link = "gov.noaa.ncdc:TBD" ; :title = "CICS Version-1 AMSU-B/MHS" ; :product_version = "v00r00" ; :date_issued = "TBD" ; :summary = "TBD" ; :keywords = "EARTH SCIENCE > SPECTRAL/ENGINEERING > MICROWAVE > BRIGHTNESS TEMPERATURE" ; :keywords_vocabulary = "NASA Global Change Master Directory (GCMD) Earth Science Keywords, Version 6.0" ; :platform = "" ; :sensor = "AMSU-B > Advanced Microwave Sounding Unit - B" ; :cdm_data_type = "Swath" ; :cdr_program = "NOAA Climate Data Record Program for satellites, FY 2011" ; :cdr_variable = "fcdr_brightness_temperature_1, fcdr_brightness_temperature_2, fcdr_brightness_ temperature_3, fcdr_brightness_temperature_4, fc" ; :source = "B3705152.GC" ; :refrences = "TBD" ; :history = "TBD" ; :date_created = "2015-01-16 21:58:02Z" ; :creator_name = "Ralph R Ferraro\000creator_na" ; :creator_url = "http://cics.umd.edu/AMSU-CDR/home.html" ; :creator_email = "[email protected]\000creator_email" ; :institution = "DOC/NOAA/NESDIS/STAR/CoRP > Cooperative Research Program, Center for Satellite Applications and Research, NESDIS, NOAA, U.S. Department of Commerce" ; :processing_level = "NOAA level 2" ; :geospatial_lat_min = -50.00266f ; :geospatial_lat_max = 85.1453f ; :geospatial_lon_min = -129.2593f ; :geospatial_lon_max = -21.8039f ; :geospatial_lat_units = "degrees_north" ; :geospatial_lon_units = "degrees_east" ;
:spatial_resolution = "16km X 16km at nadir\000spatial_resolution\000%2" ;
:time_coverage_start = "2005-06-29 12:30:02Z" ; :time_coverage_end = "2005-06-29 14:23:25Z" ; :time_coverage_duration = "P6803S" ; :license = "No restrictions on access or use" ; :contributor_name = "TBD" ; :contributor_role = "TBD" ; group: Data_Fields { variables: ubyte surface_type(nscan, npixel) ; ubyte orbital_mode(nscan) ; orbital_mode:long_name = "satellite direction" ; orbital_mode:flag_values = 0UB, 1UB ; orbital_mode:flag_meanings = "northbound, southbound" ; orbital_mode:_FillValue = 255UB ; float earth_incidence_angle(nscan, npixel) ;
CDR Program AMSU-B/MHS FCDR for Hydrological Applications C-ATBD <TBD By CDR Program> Rev. 1 05/20/14
36
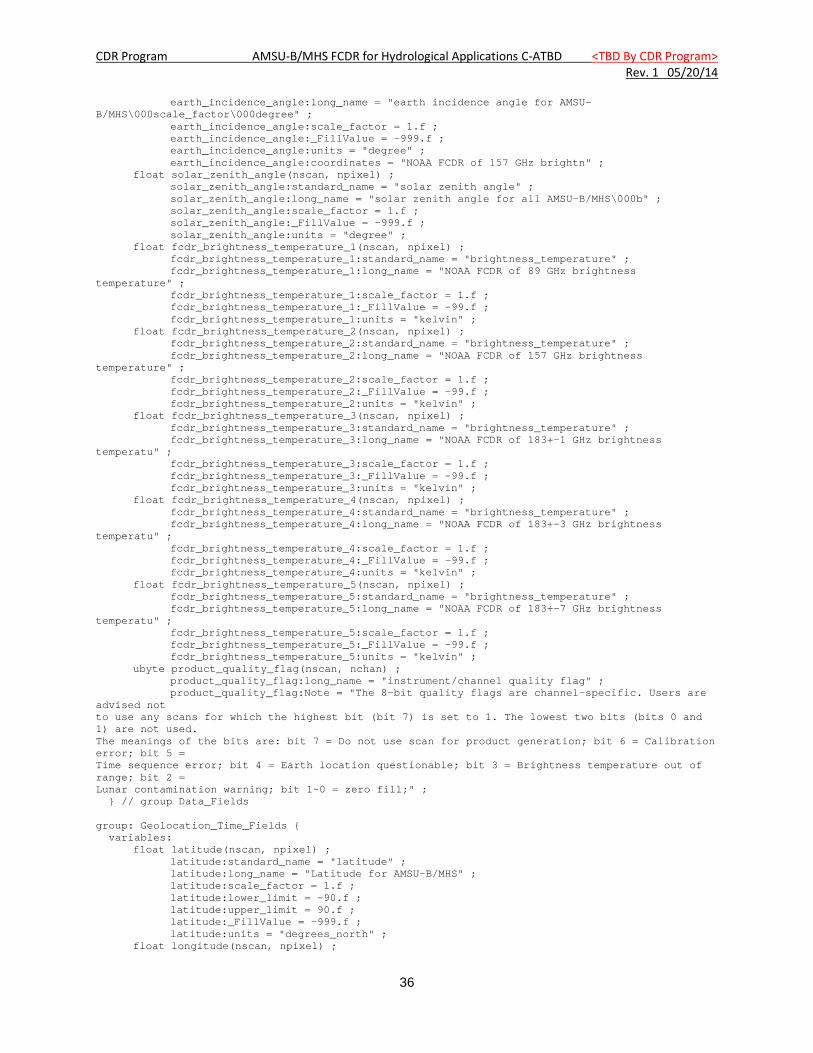
earth_incidence_angle:long_name = "earth incidence angle for AMSU-B/MHS\000scale_factor\000degree" ; earth_incidence_angle:scale_factor = 1.f ; earth_incidence_angle:_FillValue = -999.f ; earth_incidence_angle:units = "degree" ; earth_incidence_angle:coordinates = "NOAA FCDR of 157 GHz brightn" ; float solar_zenith_angle(nscan, npixel) ; solar_zenith_angle:standard_name = "solar zenith angle" ; solar_zenith_angle:long_name = "solar zenith angle for all AMSU-B/MHS\000b" ; solar_zenith_angle:scale_factor = 1.f ; solar_zenith_angle:_FillValue = -999.f ; solar_zenith_angle:units = "degree" ; float fcdr_brightness_temperature_1(nscan, npixel) ; fcdr_brightness_temperature_1:standard_name = "brightness_temperature" ; fcdr_brightness_temperature_1:long_name = "NOAA FCDR of 89 GHz brightness temperature" ; fcdr_brightness_temperature_1:scale_factor = 1.f ; fcdr_brightness_temperature_1:_FillValue = -99.f ; fcdr_brightness_temperature_1:units = "kelvin" ; float fcdr_brightness_temperature_2(nscan, npixel) ; fcdr_brightness_temperature_2:standard_name = "brightness_temperature" ; fcdr_brightness_temperature_2:long_name = "NOAA FCDR of 157 GHz brightness temperature" ; fcdr_brightness_temperature_2:scale_factor = 1.f ; fcdr_brightness_temperature_2:_FillValue = -99.f ; fcdr_brightness_temperature_2:units = "kelvin" ; float fcdr_brightness_temperature_3(nscan, npixel) ; fcdr_brightness_temperature_3:standard_name = "brightness_temperature" ; fcdr_brightness_temperature_3:long_name = "NOAA FCDR of 183+-1 GHz brightness temperatu" ; fcdr_brightness_temperature_3:scale_factor = 1.f ; fcdr_brightness_temperature_3:_FillValue = -99.f ; fcdr_brightness_temperature_3:units = "kelvin" ; float fcdr_brightness_temperature_4(nscan, npixel) ; fcdr_brightness_temperature_4:standard_name = "brightness_temperature" ; fcdr_brightness_temperature_4:long_name = "NOAA FCDR of 183+-3 GHz brightness temperatu" ; fcdr_brightness_temperature_4:scale_factor = 1.f ; fcdr_brightness_temperature_4:_FillValue = -99.f ; fcdr_brightness_temperature_4:units = "kelvin" ; float fcdr_brightness_temperature_5(nscan, npixel) ; fcdr_brightness_temperature_5:standard_name = "brightness_temperature" ; fcdr_brightness_temperature_5:long_name = "NOAA FCDR of 183+-7 GHz brightness temperatu" ; fcdr_brightness_temperature_5:scale_factor = 1.f ; fcdr_brightness_temperature_5:_FillValue = -99.f ; fcdr_brightness_temperature_5:units = "kelvin" ; ubyte product_quality_flag(nscan, nchan) ; product_quality_flag:long_name = "instrument/channel quality flag" ; product_quality_flag:Note = "The 8-bit quality flags are channel-specific. Users are advised not to use any scans for which the highest bit (bit 7) is set to 1. The lowest two bits (bits 0 and 1) are not used. The meanings of the bits are: bit 7 = Do not use scan for product generation; bit 6 = Calibration error; bit 5 = Time sequence error; bit 4 = Earth location questionable; bit 3 = Brightness temperature out of range; bit 2 = Lunar contamination warning; bit 1~0 = zero fill;" ; } // group Data_Fields group: Geolocation_Time_Fields { variables: float latitude(nscan, npixel) ; latitude:standard_name = "latitude" ; latitude:long_name = "Latitude for AMSU-B/MHS" ; latitude:scale_factor = 1.f ; latitude:lower_limit = -90.f ; latitude:upper_limit = 90.f ; latitude:_FillValue = -999.f ; latitude:units = "degrees_north" ; float longitude(nscan, npixel) ;
CDR Program AMSU-B/MHS FCDR for Hydrological Applications C-ATBD <TBD By CDR Program> Rev. 1 05/20/14
37
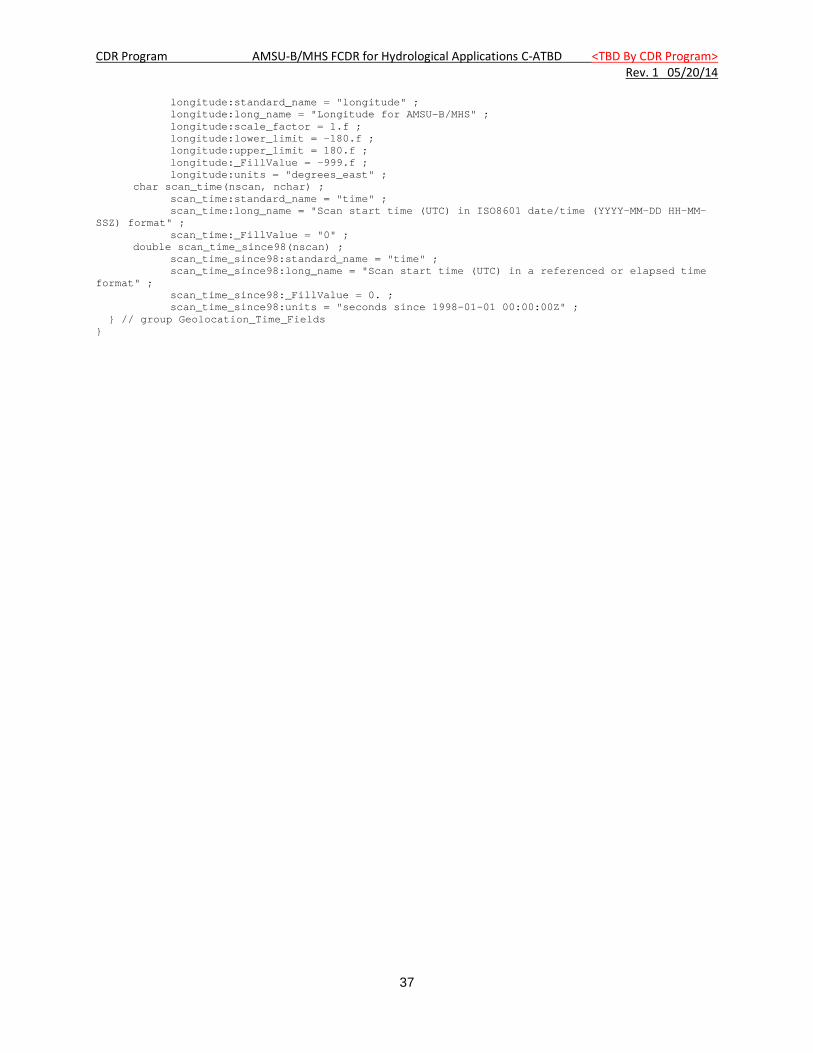
longitude:standard_name = "longitude" ; longitude:long_name = "Longitude for AMSU-B/MHS" ; longitude:scale_factor = 1.f ; longitude:lower_limit = -180.f ; longitude:upper_limit = 180.f ; longitude:_FillValue = -999.f ; longitude:units = "degrees_east" ; char scan_time(nscan, nchar) ; scan_time:standard_name = "time" ; scan_time:long_name = "Scan start time (UTC) in ISO8601 date/time (YYYY-MM-DD HH-MM-SSZ) format" ; scan_time:_FillValue = "0" ; double scan_time_since98(nscan) ; scan_time_since98:standard_name = "time" ; scan_time_since98:long_name = "Scan start time (UTC) in a referenced or elapsed time format" ; scan_time_since98:_FillValue = 0. ; scan_time_since98:units = "seconds since 1998-01-01 00:00:00Z" ; } // group Geolocation_Time_Fields }