climate change impacts on agriculture and soil carbon sequestration potential in the huang-hai plain...
TRANSCRIPT

Climate change impacts on agriculture and soil carbon sequestration
potential in the Huang-Hai Plain of China
Allison M. Thomson *, R. Cesar Izaurralde, Norman J. Rosenberg, Xiaoxia He
Joint Global Change Research Institute, Pacific Northwest National Laboratory and the University of Maryland,
College Park, 8400 Baltimore Ave. Suite 201, College Park, MD 20740, USA
Received 3 May 2005; received in revised form 18 October 2005; accepted 1 November 2005
Available online 15 December 2005
Abstract
For thousands of years, the Huang-Hai Plain in northeast China has been one of the most productive agricultural regions of the country. The
future of this region will be determined in large part by how global climatic changes impact regional conditions and by actions taken to mitigate or
adapt to climate change impacts. One potential mitigation strategy is to promote management practices that have the potential to sequester carbon
in the soils. The IPCC estimates that 40 Pg of C could be sequestered in cropland soils worldwide over the next several decades; however, changes
in global climate may impact this potential. Here, we assess the potential for soil C sequestration with conversion of a conventional till (CT)
continuous wheat system to a wheat–corn double cropping system and by implementing no till (NT) management for both continuous wheat and
wheat–corn systems. To assess the influence of these management practices under a changing climate, we use two climate change scenarios (A2
and B2) at two time periods in the EPIC agro-ecosystem simulation model. The applied climate change scenarios are from the HadCM3 global
climate model for the periods 2015–2045 and 2070–2099 which projects consistent increases in temperature and precipitation of greater than 5 8Cand up to 300 mm by 2099. An increase in the variability of temperature is also projected and is, accordingly, applied in the simulations. The EPIC
model indicates that winter wheat yields would increase on average by 0.2 Mg ha�1 in the earlier period and by 0.8 Mg ha�1 in the later period due
to warmer nighttime temperatures and higher precipitation. Simulated yields were not significantly affected by imposed changes in crop
management. Simulated soil organic C content was higher under both NT management and double cropping than under CT continuous wheat. The
simulated changes in management were a more important factor in SOC changes than the scenario of climate change. Soil C sequestration rates for
continuous wheat systems were increased by an average of 0.4 Mg ha�1 year�1 by NTin the earlier period and by 0.2 Mg ha�1 year�1 in the later
period. With wheat–corn double cropping, NT increased sequestration rates by 0.8 and 0.4 Mg ha�1 year�1 for the earlier and later periods,
respectively. The total C offset due to a shift from CT to NTunder continuous wheat over 16 million hectares in the Huang-Hai Plain is projected to
reach 240 Tg C in the earlier period and 180 Tg C in the later period. Corresponding C offsets for wheat–corn cropping are 675–495 Tg C.
# 2005 Elsevier B.V. All rights reserved.
Keywords: Soil organic carbon; China; Climate change mitigation; Agriculture; Simulation modeling
www.elsevier.com/locate/agee
Agriculture, Ecosystems and Environment 114 (2006) 195–209
1. Introduction
Human activities during the past two centuries have
elevated to unprecedented levels the atmospheric concen-
trations of CO2, CH4, N2O, and other greenhouse gases; this
is expected to lead to large-scale alterations in the global
climate (Houghton et al., 2001). Soil carbon (C) sequestra-
tion (SCS) has been emerging as a plausible strategy with
* Corresponding author. Tel.: +1 301 314 6750; fax: +1 301 314 6719.
E-mail address: [email protected] (A.M. Thomson).
0167-8809/$ – see front matter # 2005 Elsevier B.V. All rights reserved.
doi:10.1016/j.agee.2005.11.001
near-term potential for mitigating increasing atmospheric
concentrations of greenhouse gases. The IPCC Second
Assessment Report estimated that it may be possible, over
the course of the next 50–100 years, to restore about two-
thirds of the estimated 55 Pg C lost to the atmosphere
through cultivation of agricultural soils (Cole et al., 1996).
Management for SCS includes practices that conform to
principles of sustainable agriculture such as reduced tillage,
erosion control, diversified cropping systems and improved
soil fertility (Lal et al., 1998a,b; Paul et al., 1997). Soil C
sequestration in climate change mitigation was found to be a

A.M. Thomson et al. / Agriculture, Ecosystems and Environment 114 (2006) 195–209196
substantial contributor to offsetting industrial CO2 emissions
in an analysis with the global energy model MiniCAM
(Edmonds et al., 1996a,b, 1999). While the potential for SCS
is finite, large-scale implementation of the already available
technologies can be used to offset C emissions while other
mitigation options and clean energy technologies needed to
stabilize atmospheric concentrations are developed.
The People’s Republic of China accounted for 13% of the
world’s C emissions in 2002 and that share is projected to rise
to 18% by 2025 (US DOE, 2004). Most of these emissions
result from energy production and transportation; however,
agricultural land also contributes to C emissions. All these
reasons make SCS a viable option for near-term climate
change mitigation. Most regions of China have been
cultivated for thousands of years, primarily with rice (Oryza
sativa L.) and grain crops such as wheat (Triticum aestivum
L.). Historically, agriculture has been of low intensity and
relied on organic fertilizers and the return of crop residues to
the soil-practices that helped prevent erosion and maintain
soil fertility. Since 1940, agricultural production has
intensified in China and the area of cultivation expanded in
response to policy changes and rapid population growth (Tong
et al., 2003). This has resulted in declines in soil organic
matter (SOM) as tillage is intensified and crop residues are
removed or burned (Crook and Colby, 1996; Li et al., 2003).
The decline in SOM results in lower levels of soil nutrients
such as nitrogen (N), thereby increasing fertilizer needs (Li,
2000). While grain yield per unit area has steadily increased,
yield per unit of fertilizer added has declined (Gale et al.,
2002; Li, 2000). Cultivation-induced C losses of China’s soils
have been estimated on average at 15 Mg C ha�1, represent-
ing a total loss of 2 Pg C (Song et al., 2005).
The Huang-Hai Plain of China is the country’s most
productive wheat growing region and has been cultivated for
many centuries. Land productivity has been maintained in
recent years with increasing introduction of the double
cropping of summer crops, such as corn (Zea mays L.), with
winter wheat. Currently, rainfed grain agriculture is possible
but studies indicate that this region will be vulnerable to
climate change. While the HadCM3 GCM used in this study
projects increased precipitation, other global climate models
project a decline in precipitation. In one climate change
analysis, Tao et al. (2003) found agriculture to be negatively
impacted due to soil moisture deficits from higher
temperatures and declining precipitation. Erda (1996) found
that a combination of agronomic characteristics and socio-
economic circumstances contribute to the vulnerability of
the Huang-Hai Plain under GCM projections of sharply
reduced precipitation. A companion study by Jinghua and
Erda (1996) modeled corn production and found declining
yields, leading to the conclusion that yields will become
more vulnerable to climatic variability if the projected
climate changes occur.
Alternative management in the Huang-Hai Plain could
reduce the vulnerability of the region to what are still
uncertain changes in climate and, at the same time,
contribute to climate change mitigation by sequestering C
in soils. The greatest soil C stocks in China are found in the
northeast and the lowest values in the west and south (Zhou
et al., 2003). More regionally focused accountings of soil C
stocks have begun (Wang et al., 2002a,b) and modeling
studies have examined the impacts of management practices
on soils. Modeling corn production systems with the RothC
model, Yang et al. (2003) compared the performance of
different fertilizer treatments on soil organic C (SOC) and
found that the most beneficial practice was returning crop
residues to the soil. Without supplemental fertilization, they
found, SOC levels decline. In a comparison with US
croplands, Li et al. (2003) found a much higher rate of
annual SOC loss for the year 1990 in China (1.6%) than in
the US (0.1%). This difference is attributed to lower crop
residue return in China (25%) compared to the US (90%).
Here, we report on the modeling of alternative manage-
ment practices designed to improve soil quality by reducing
tillage and increasing the return of crop residue to the soil.
We examine these management strategies under scenarios of
possible future changes in climate to determine a range of
potential future crop production and SOC stocks and to
determine whether a changing climate would impact SOC
response to management change. In essence, we assess the
technical potential of soils in the Huang-Hai Plain to act as
sinks of atmospheric CO2 under changing climate and the
extent to which alternate management practices could
influence this potential.
2. Methods
2.1. Study region
The Huang-Hai Plain of China is an important
agricultural, economic, and cultural region that extends
between latitudes 348390 and 428620N and longitudes
1138460 to 122870E. It includes the provinces of Beijing,
Tianjin, Hebei and Shandong (Fig. 1). It is a large alluvial
plain developed by the intermittent flooding of the Huang,
Huai and Hai rivers (Zhu et al., 1983) with a semi-arid to
sub-humid warm temperate climate. A monsoonal pre-
cipitation distribution results in droughts and floods
frequently impacting agricultural production.
Dominant soils are classified as Fluvisols (FAO
taxonomy) or Fluvi-aquic (Chinese Soil Taxonomy; Wu
et al., 2003). Soil properties for 18 study sites were selected
by Sun et al. (2001) from the most comprehensive dataset
available, the Second National Soil Census of China
(Chinese National Soil Survey Office, 1997, 1998). The
soil properties from this database are used to initialize the
model runs in each of the 18 representative farms (Table 1).
The soil database was combined with weather records in a
GIS to create 18 modeling regions for the Huang-Hai Plain
(Fig. 1). The agricultural land area of each of these regions
was calculated based on the percentage of land in agriculture

A.M. Thomson et al. / Agriculture, Ecosystems and Environment 114 (2006) 195–209 197
in each province in China (Fischer et al., 1998; Table 1).
While the soil database is comprehensive and widely applied
(e.g. Song et al., 2005), independent datasets of soil
properties and SOC change over time have not been readily
available. Thus, confidence in the SOC model projections is
inferred from previous validations (Izaurralde et al., 2005).
2.2. Climate change scenarios
The climate change projections were obtained from runs
of the HadCM3 model (Gordon et al., 2000; Pope et al.,
2000), archived by the IPCC Data Distribution Center, for
Table 1
Initial soil properties for each representative farm as taken from the National So
ID Site Agricultural land area
(million hectares)
Layer depth
(cm)
5200 Shijiazhuan 0.93 0–50
Hebei 50–95
5201 Xintai 0.70 0–14
Hebei 14–30
5202 Zhangjiakou 1.42 0–17
Hebei 17–39
5203 Chengde 1.30 0–10
Hebei 10–21
5204 Beijing 0.41 0–30
Beijing 30–60
5205 Tianjin 0.50 0–15
Tianjing 15–33
5206 Tangshan 1.17 0–14
Hebei 14–31
5207 Baoding 0.79 0–5
Hebei 5–15
15–25
5208 Changzhou 0.78 0–15
Hebei 15–33
5209 Dezhou 1.33 0–20
Shandong 20–28
5210 Yantai 0.47 0–20
Shandong 20–47
5211 Jinan 1.16 0–20
Shandong 20–28
5212 Taian 1.44 0–25
Shandong 25–46
5213 Weifang 0.87 0–24
Shandong 24–39
5214 Laiyang 0.55 0–14
Shandong 14–25
5215 Qingdao 0.65 0–20
Shandong 20–35
5216 Hezhe 0.74 0–17
Shandong 17–41
5217 Linxi 0.80 0–20
Shandong 20–45
the A2 and B2 scenarios developed for the Third Assessment
Report (Cubasch et al., 2002; Nakicenovic and Swart, 2000).
The monthly values for maximum temperature, minimum
temperature and precipitation were obtained from the IPCC
database for a baseline period (1961–1990) and two future
30 years periods—2015–2045 and 2070–2099. These are
referred to hereafter by the middle year—2030 and 2085,
respectively (Table 3). The changes from the HadCM3
baseline period for 2030 and 2085 were calculated and
applied to the historical baseline climate record for each
study site. In addition, the record of daily maximum and
minimum temperature and precipitation for the baseline
il Survey Office of China
Bulk density Organic C
(Mg m�3)
Sand
(%)
Silt
(%)
Clay
1.24 0.74 34 48 19
1.30 0.38 63 23 14
1.24 1.32 34 48 19
1.30 0.78 63 23 14
1.13 2.73 49 30 21
1.57 1.38 48 29 23
1.36 0.69 50 22 27
1.42 0.64 35 35 30
1.58 2.88 49 30 21
1.58 1.73 48 29 23
1.33 3.10 72 13 16
1.45 1.80 65 16 19
1.42 3.48 70 21 9
1.43 1.33 65 24 11
1.33 0.31 73 13 14
1.43 0.31 74 13 13
1.57 0.18 84 6 11
1.42 3.10 72 13 16
1.43 1.80 65 16 19
1.42 1.75 39 38 24
1.43 0.99 35 38 27
1.37 4.10 77 13 10
1.50 2.80 71 20 10
1.42 1.75 43 36 21
1.43 0.99 17 44 39
1.13 0.93 45 32 24
1.57 0.69 46 31 23
1.13 1.74 55 23 22
1.57 0.98 47 30 23
1.42 0.71 39 41 20
1.37 0.72 38 41 21
1.41 0.71 41 22 37
1.37 0.63 18 30 52
1.33 0.80 62 8 31
1.57 0.59 32 33 35
1.41 0.71 53 30 17
1.37 0.56 50 31 19

A.M. Thomson et al. / Agriculture, Ecosystems and Environment 114 (2006) 195–209198
Table 2
Matrix of EPIC model runs at each of the 18 representative farms for both
the A2 and B2 scenarios
Time period Tillagea Cropping systemb
2030 CT W
W–C
NT W
W–C
2085 CT W
W–C
NT W
W–C
a CT = conventional till; NT = no till.b W = continuous winter wheat; W–C = wheat–corn double cropping.
Fig. 1. Name and number of the 18 representative farms and the location of the study area in China.
period was used to generate monthly climatic statistics
needed to drive the EPIC model.
The A2 scenario describes a very heterogeneous world of
high population growth, slow economic development and
strong regional cultural identities. In contrast, the B2
scenario reflects a heterogeneous world where there is
diverse technological change, low population growth and
emphasis on local solutions to economic, social and
environmental sustainability problems. Scenario A2 has a
higher rate of atmospheric CO2 accumulation and therefore
a greater associated climate change. In the baseline period,
CO2 concentration is 370 ppmv; at the 2030 period, it is
450 ppmv for the A2 and 430 ppmv for the B2 scenario. A
greater change is seen in the 2085 period where CO2 in the
A2 scenario reaches 735 ppmv, compared to 535 ppmv for
the B2 scenario.
One limitation of this type of study has been that while
GCMs project changes in average monthly temperature and
precipitation, they do not provide data on changes in
variability. Increases in the range of climate variability, an
anticipated effect of climate change, could be particularly
important to the agricultural sector. Here, we assume that
while variability of climate may change, the relationship
between daily variability and monthly variability remains
constant. Using the daily and monthly data for the baseline
period, we defined the relationship between the monthly
(Stdmo) and daily (Stddo) standard deviations in both
maximum and minimum temperature. Then, using the
standard deviations from the monthly climate change data
(Stdmc), we calculated the daily standard deviations under
climate change as Stddc = Stdmc � Stddo/Stdmo.
2.3. Agricultural management
The matrix of simulations (Table 2) includes four crop
management options: continuous winter wheat, double
cropped wheat–corn, conventional tillage (CT) and no
tillage (NT). Under both CT and NT management, the
continuous wheat system is fertilized twice with N (46-0-0)
and once with N and P (10-46-0). Conventional tillage is
simulated with passes of moldboard plow, offset disk, and
spike harrow before planting with a grain drill. All tillage
operations are eliminated to simulate NT management. The
double cropped system is winter wheat with a summer corn
crop. The corn crop is fertilized at the same rate as the wheat
and a no till planter is used with an additional disking
operation at planting for the CT management. All
simulations were run without irrigation. Planting dates
were adjusted automatically by the EPIC model to adapt to
changing temperatures using data on growing season length
and weather.
Simulations included wind and water erosion processes
and soil properties were treated dynamically by the model to
allow for an explicit accounting of the long term-effects of
changes in climate and management on soil C stocks. The
final soil profile for each farm from the baseline period (year

A.M. Thomson et al. / Agriculture, Ecosystems and Environment 114 (2006) 195–209 199
1990) was used to initialize the soil for the 2030 simulation
and the soil profile from the 2030 period (year 2045) was
used to initialize the 2085 run.
2.4. EPIC model description
Environmental Policy Integrated Climate (EPIC) Version
3060 is a biophysical process model which can simulate
detailed farm management and the associated impact on
crop production and soils (Williams, 1995). The concept of
radiation-use efficiency is used to simulate crop growth by
calculating the potential daily photosynthetic production of
biomass. The daily potential growth is decreased by stresses
caused by shortages of water and nutrients; by temperature
extremes; and by inadequate soil aeration. Daily potential
photosynthesis is proportionally decreased according to the
most severe stress of the day. Stockle et al. (1992a,b) adapted
EPIC to simulate the CO2-fertilization effect on radiation-
use efficiency (RUE) and evapotranspiration (ET). Elevated
atmospheric CO2 concentration (CO2) increases photo-
synthesis in C3 plants and reduces evapotranspiration in both
C3 and C4 plants due to reduced stomatal conductance,
thereby improving water use efficiency. A non-linear
equation was developed in EPIC to express the RUE
response to increasing CO2 following experimental evidence
summarized by Kimball (1983). That analysis showed crop
yield increases of 33% with a doubling of atmospheric CO2,
and assigned a 99% confidence in this response ranging from
24 to 43%. Stockle et al. (1992a,b) modeled this response as
a function of crop type and while those parameters have not
been specifically tested against observations, they are
consistent with results arising from free air CO2 (FACE)
experiments (Amthor, 2001).
Izaurralde et al. (2005) introduced algorithms in EPIC,
based on the approach used in the Century model (Parton
et al., 1987), to simulate soil C dynamics in response to land
use change, soil management, and climate change. The C
routines interact directly with soil moisture, temperature,
erosion, tillage, soil density, leaching, and translocation
functions in EPIC. Additionally, the algorithms describe the
effect of soil texture on C stabilization and model lignin
concentration as a sigmoidal function of plant age. The
model has been tested against data from long term
agricultural experiments and found to be reasonably
accurate in reproducing loss and accumulation of soil C
at five sites in the US Great Plains and one site in Canada
(Izaurralde et al., 2005).
2.5. EPIC model validation
The EPIC model has been validated extensively in the US
and other regions of the world. EPIC has undergone
improvements and validation under a variety of climates,
soils, and management environments including water
erosion and snowmelt runoff (Chung et al., 1999; Puurveen
et al., 1997), wind erosion (Potter et al., 1998), crop yield
(Roloff et al., 1998), climatic variability (Izaurralde et al.,
1999; Legler et al., 1999), climate change (Brown and
Rosenberg, 1999; Easterling et al., 1996; Izaurralde et al.,
2003; Thomson et al., 2002), nutrient cycling (Cavero et al.,
1998), and soil C sequestration (Izaurralde et al., 2001,
2005).
Here, we use government crop yield statistics to compare
against EPIC simulations of wheat and corn yields.
Provincial wheat and corn yields were extracted from the
Agricultural Economy Database (http://www.naturalresour-
ces.csdb.cn/ny/cdroom/tx2new.asp) prepared by the Insti-
tute of Geographical Sciences and Natural Resources
Research at the Chinese Academy of Sciences. The annual
average yield for each province, based on total provincial
production and land area under cultivation, steadily
increases from 3.1 to 4.3 Mg ha�1 during 1960–1990. It
is clear that increases in yields have occurred in the past 50
years with the use of higher yielding crop varieties and
agricultural reforms (Hsu and Gale, 2001; Sinclair and Bai,
1997). However, the state reported crop yield and other
agricultural statistics are likely biased upwards due to
underestimation of crop land area (Crook and Colby, 1996;
Frolking et al., 1999; Gale et al., 2002). Most studies of
agriculture in China use these state-reported statistics as the
primary countrywide data set (Jinghua and Erda, 1996; Tong
et al., 2003; Wang et al., 2002a,b, 2003; Wu et al., 2003;
Zhou et al., 2003). EPIC simulations by Sun et al. (2001) re-
created the historically increasing trend of the average
provincial yields by increasing the planting density, fertilizer
applications and irrigation each year. We compared the
baseline simulations of this study to the provincial yield
records. The average winter wheat yields reported for 1960–
1990 range from 1.7 to 2.5 Mg ha�1, while EPIC simulated
average yields range from 0.2 to 2.0 Mg ha�1. The simulated
yields consistently under predict the reported values by 0.3–
1.5 Mg ha�1. The annual simulated yields over-predict yield
in the first half of the baseline period (1960–1975) by as
much as 4.0 Mg ha�1. After 1975, the simulations under-
predict yields by as much as 3.0 Mg ha�1.
An alternative to official government statistics is to
validate simulation models with field data from agricultural
experiment stations. However, the lack of a central source of
data complicates this type of model validation. In some
instances, field data have been used to parameterize
simulation models for specific sites in China (Kang et al.,
2003; Li et al., 2003; Liu et al., 1998; Yang et al., 2003).
Zhang et al. (1999) report winter wheat yields from four
experiment stations within our study region. Dryland wheat
yields at Luaocheng and Gaocheng experiment stations are
2.58 and 2.61 Mg ha�1, respectively, and the average EPIC
wheat yield for the baseline period in that region is
2.5 Mg ha�1 (representative farm 5200). Dryland wheat
yield at the Nanpi experiment station was 3.2 Mg ha�1 while
at the Linxi experiment station it was 2.8 Mg ha�1. The
corresponding EPIC yields for the representative farms in
those regions are on average too low (1.5 Mg ha�1 at farm
A.M. Thomson et al. / Agriculture, Ecosystems and Environment 114 (2006) 195–209200
5208 and 1.4 Mg ha�1 at farm 5209, respectively), although
the maximum yields during the EPIC 30 years simulation are
3.2 and 2.7 Mg ha�1, respectively, showing that the model is
capable of simulating the potential production at these sites.
For larger regional and country-wide studies, remote
sensing provides some information for model testing
(Frolking et al., 1999; Gao and Xhang, 1997). Other studies
of agriculture in China have been similarly limited by data
availability, particularly with regards to soil data from
agricultural experiments. Wang et al. (2002) in a prior study
using EPIC to simulate erosion in China, acknowledge the
limitation due to lack of data for validation. Other studies
with proven agricultural simulation models have likewise
been hampered by difficulties in verifying model output of
specific locations in China (Erda, 1996; Matthews et al.,
1997; Terjung et al., 1983) and authors discuss the
limitations on studies due to the difficulty of obtaining site
data and the unreliability of state-reported crop yields
(Verburg et al., 2000; Wang et al., 2002a,b).
2.6. Statistical analysis of simulation results
The EPIC simulation results were analyzed with the
GLM procedure in SAS (SAS Inst. Inc., Cary, NC) in a
factorial design of 4 climate scenarios by four management
treatments with 18 replications (farms). Mean separations
were obtained using Fisher’s least significant difference at
the 0.05 level of probability (L.S.D.0.05). Assumptions of
normal distribution of the data were tested and confirmed
using the UNIVARIATE procedure in SAS (options
‘normal’ and ‘plot’) on residual values calculated with
the GLM procedure.
The rate of change of C in soils is calculated for the top
30 cm of the soil profile. The difference in soil C mass from
the initial soil and the final soil is taken and divided by the
simulation length. Soil C offsets due to no till are calculated
as [(NTfinal � NTinitial) � (CTfinal � CTinitial)] and offsets
from conversion to a wheat–corn system from a continuous
wheat system are calculated as [(WCfinal �WCinitial)
� (WFfinal �WFinitial)]. Naturally, a soil may lose C under
both CT and NT treatments; but, if the loss is smaller under
NT, then a potential emission of C has been offset by the
management practice.
3. Results and discussion
3.1. Climate change projections
3.1.1. 2030 (2015–2045) period
Temperature increases during the period centered around
2030 are moderate, ranging from 0.5 to 2 8C for both
maximum and minimum temperature (Table 3). Increases in
maximum temperature are greater than increases in
minimum temperature, an effect that increases heat stress
on crops. There is little difference in temperature change
between the A2 and B2 scenarios during this period.
Precipitation is projected to increase during the 2030 period,
with the exception of some drying (�30 mm) that might
occur over the southern part of the study area in the A2
scenario. The pattern of change is varied with large increases
over the central region (200 mm) and small increases in the
north (50–100 mm). Under the B2 scenario, increases in
precipitation across the study region range from 25 to
75 mm.
3.1.2. 2085 (2070–2099) period
Changes in climate increase in magnitude during the
period centered around 2085. Temperature increases for A2
and B2 range from 2.5 to over 5 8C. Under A2, the maximum
temperature increases by an average of 5 8C; the average
minimum temperature increases by 3.6 8C. Temperature
increases are greater in the northern part of the study region.
The pattern of change in the B2 scenario is similar, but the
magnitude is smaller with a maximum temperature increase
of 3.2 8C and a minimum temperature increase of 2 8C.
Precipitation is projected to increase uniformly over the
study region under both A2 and B2 scenarios. The increase
ranges from 200 to 300 mm under A2 and from 100 to
240 mm under B2. In a region where baseline precipitation
is between 400 and 900 mm annually, such changes would
be capable of impacting crop production.
Many GCM’s project increases in nighttime (minimum)
temperatures greater than the increases in daytime (max-
imum) temperatures. In this region, the HadCM3 model
projects an opposite relationship. Minimum temperatures
control the break in dormancy and spring crop growth. Also,
higher maximum temperatures could increase respiration
losses as well as induce heat stress on crop growth and
development.
3.1.3. Variability
The standard deviation (Std) of maximum and minimum
temperatures increase under the scenarios studied. During
the 2030 period, only those of the A2 scenario increase by an
average of 0.27 8C. In the 2085 period, the Std increases for
both the A2 and B2 scenarios. Under the A2 scenario, the Std
increases by 0.79 8C and under the B2 scenario, by an
average of 0.54 8C. In general, there is little difference in the
change in Std between maximum and minimum tempera-
tures. The Std of air temperatures is projected to increase
towards the later part of the century with larger increases
under the A2 scenario.
3.2. Crop production
Average winter wheat yields for the 1960–1990 baseline
period range from 0.5 to 2.5 Mg ha�1 across the 18
representative farms (Table 4). Yields are positively
influenced by the increasing precipitation projected under
the climate change scenarios, with the highest average yields
in the 2085 time period when the precipitation increase is

A.M
.T
ho
mso
net
al./A
gricu
lture,
Eco
systems
an
dE
nviron
men
t1
14
(20
06
)1
95
–2
09
20
1
Table 3
Air temperature and precipitation at 18 representative farms in the Huang-Hai Plain under baseline climate and the changes projected
Farm ID Baseline Deviations from baseline
Tmax
(8C)
Tmin
(8C)
Precipitation
(mm)
A2 2030 A2 2085 B2 2030 B2 2085
Tmax
(D8C)
Tmin
(D8C)
Precipitation
(Dmm)
Tmax
(D8C)
Tmin
(D8C)
Precipitation
(Dmm)
Tmax
(D8C)
Tmin
(D8C)
Precipitation
(Dmm)
Tmax
(D8C)
Tmin
(D8C)
Precipitation
(Dmm)
5200 19.1 7.8 509 0.9 1.6 96 3.4 4.8 235 0.8 1.6 75 1.6 2.9 207
5201 19.5 8.0 505 0.9 1.6 96 3.4 4.8 235 0.8 1.6 75 1.6 2.9 207
5202 14.8 2.7 385 1.8 1.7 59 4.1 5.1 191 1.2 1.8 54 2.5 3.4 135
5203 15.7 3.3 506 1.7 1.7 56 4.1 5.1 191 1.2 1.8 54 2.5 3.4 135
5204 17.7 6.5 562 1.7 1.7 56 4.1 5.1 191 1.2 1.8 54 2.5 3.4 135
5205 17.8 8.2 557 1.7 1.7 56 4.1 5.1 191 1.2 1.8 54 2.5 3.4 135
5206 17.0 6.1 631 1.4 1.3 8 4.8 5.3 193 1.5 1.8 40 3.0 3.3 102
5207 18.5 7.3 526 1.7 1.7 56 4.1 5.1 191 1.2 1.8 54 2.5 3.4 135
5208 18.4 7.9 600 0.9 1.6 96 3.4 4.8 235 0.8 1.6 75 1.6 2.9 207
5209 18.8 8.2 559 0.9 1.6 96 3.4 4.8 235 0.8 1.6 75 1.6 2.9 207
5210 16.2 9.5 658 0.8 0.8 68 3.7 3.9 283 0.8 0.9 69 2.1 2.3 237
5211 19.4 10.1 655 0.9 1.6 96 3.4 4.8 235 0.8 1.6 75 1.6 2.9 207
5212 18.8 7.5 692 1.2 1.4 �33 3.8 4.5 300 1.0 1.3 53 2.3 2.9 188
5213 18.5 7.5 603 0.8 0.8 68 3.7 3.9 283 0.8 0.9 69 2.1 2.3 237
5214 17.6 6.0 691 0.8 0.8 68 3.7 3.9 283 0.8 0.9 69 2.1 2.3 237
5215 15.8 9.6 706 0.9 0.9 �10 3.7 3.9 273 0.9 1.0 29 2.3 2.4 136
5216 19.5 9.1 623 1.2 1.4 �33 3.8 4.5 300 1.0 1.3 53 2.3 2.9 188
5217 18.8 8.9 831 0.9 0.9 �10 3.7 3.9 273 0.9 1.0 29 2.3 2.4 136

A.M
.T
ho
mso
net
al./A
gricu
lture,
Eco
systems
an
dE
nviron
men
t1
14
(20
06
)1
95
–2
09
20
2
Table 4
Average baseline winter wheat grain yield and the change in average winter wheat yields over the 30 years simulation periods for each of the study sites
ID Baseline
(Mg ha�1)
A2 2030 (Mg ha�1) B2 2030 (Mg ha�1) A2 2085 (Mg ha�1) B2 2085 (Mg ha�1)
Continuous
wheat
Wheat–corn Continuous
wheat
Wheat–corn Continuous
wheat
Wheat–corn Continuous
wheat
Wheat–corn
CT NT CT NT CT NT CT NT CT NT CT NT CT NT CT NT
5200 2.5 1.0 0.7 �0.1 �0.2 0.6 0.5 �0.5 �0.6 1.7 1.5 0.7 0.6 1.5 1.2 0.6 0.5
5201 0.9 0.4 0.3 0.1 0.0 0.2 0.1 �0.1 �0.1 1.0 0.9 1.1 1.0 1.0 0.9 1.0 0.9
5202 0.7 0.1 0.0 �0.3 �0.3 0.1 0.0 �0.4 �0.4 0.5 0.5 0.1 0.0 0.5 0.4 0.0 �0.1
5203 1.1 �0.1 �0.2 �0.5 �0.6 �0.4 �0.4 �0.6 �0.5 0.5 0.4 0.2 0.1 �0.1 �0.2 �0.3 0.0
5204 1.2 �0.2 �0.3 �0.4 �0.5 �0.2 �0.3 �0.5 �0.5 0.2 0.1 0.1 0.0 0.1 0.0 �0.1 �0.1
5205 1.4 0.0 �0.1 �0.6 �0.6 �0.2 �0.3 �0.6 �0.6 0.5 0.4 0.0 �0.1 0.2 0.2 �0.1 �0.3
5206 1.7 �0.2 �0.3 �0.7 �0.7 �0.2 �0.3 �0.7 �0.7 0.4 0.3 0.1 0.1 0.0 �0.1 �0.2 �0.3
5207 0.5 �0.1 �0.1 �0.2 �0.3 �0.1 �0.1 �0.2 �0.3 0.3 0.3 0.2 0.1 0.2 0.2 0.1 0.0
5208 1.5 0.6 0.5 0.0 �0.1 0.2 0.1 �0.3 �0.3 1.1 0.9 0.6 0.5 1.0 0.9 0.6 0.5
5209 1.4 0.6 0.4 0.3 0.2 0.3 0.2 0.0 0.0 1.6 1.4 1.3 1.3 1.4 1.2 1.2 1.1
5210 1.5 0.4 0.3 �0.1 �0.1 0.0 0.0 �0.3 �0.3 1.2 1.1 0.6 0.6 0.9 0.7 0.4 0.3
5211 1.2 0.6 0.5 0.3 0.3 0.3 0.2 �0.1 �0.1 1.1 1.0 1.2 1.2 1.0 1.0 1.0 0.9
5212 1.8 �0.3 �0.4 �0.8 �0.8 0.1 0.0 0.0 �0.1 1.1 0.9 1.8 1.5 0.8 0.7 1.1 1.0
5213 1.6 0.4 0.2 0.1 0.1 0.0 �0.1 �0.2 �0.1 1.2 1.0 1.5 1.3 0.8 0.7 1.2 1.0
5214 1.8 0.1 �0.1 0.2 �0.1 0.1 �0.1 0.0 �0.1 0.9 0.8 1.6 1.0 0.7 0.5 1.3 0.6
5215 2.3 0.0 �0.2 �0.2 �0.3 0.7 0.3 0.7 0.4 1.5 1.3 2.7 1.6 1.4 1.1 2.3 1.2
5216 1.3 �0.2 �0.2 �0.3 �0.4 0.2 0.2 0.1 0.1 1.3 1.1 1.5 1.3 0.9 0.9 1.0 0.9
5217 1.7 �0.1 �0.2 �0.2 �0.3 0.4 0.2 0.3 0.2 1.0 0.8 0.8 1.0 0.8 0.7 0.9 0.7

A.M. Thomson et al. / Agriculture, Ecosystems and Environment 114 (2006) 195–209 203
Table 5
Crop yields, water erosion, SOC change, eroded C, residue C and respired C annual means grouped by climate change scenario and cropping system
Scenario Period Crop yield
(Mg ha�1)
Water erosion
(Mg ha�1)
DSOC
(Mg ha�1)
Eroded C
(Mg ha�1)
Residue C
(Mg ha�1)
Respired C
(Mg ha�1)
A2 2030 1.39 0.33 2.36 0.46 5.51 5.95
2085 2.30 0.38 2.53 0.54 7.26 7.50
B2 2030 1.39 0.39 3.01 0.46 5.70 6.12
2085 2.07 0.39 3.50 0.52 7.04 7.26
L.S.D.0.05a 0.26 0.09 5.84 0.02 0.48 0.51
Crop Tillage
Wheat CT 1.94 0.89 �8.03 0.46 5.25 5.86
NT 1.83 0.16 5.59 0.43 4.86 5.10
Wheat CT 1.75 0.31 �10.76 0.55 7.77 8.42
Corn NT 1.64 0.15 24.60 0.54 7.62 7.45
L.S.D.0.05a 0.26 0.09 5.84 0.02 0.48 0.51
a Fisher’s least significant difference treatment differences within a group that are larger than the L.S.D.0.05 are significantly different at p < 0.005.
greatest. The ANOVA analysis shows that yields of winter
wheat are significantly different during the 2085 period
(Table 5) and that the crop management system does not
significantly affect yield. Crop yields are influenced more by
the time period than by the GCM scenario due to the
pronounced increase in precipitation for both the A2 and B2
scenarios in 2085 and the substantial increase in atmospheric
CO2. The variability of wheat yields was not significantly
affected by the changes in climate or in management
practice.
Increases in dryland winter wheat yields are similar to
those found by Sun et al. (2001) in a study with the HadCM2
model projections of climate change. The Huang-Hai Plain
was identified by Erda (1996) as one of the most vulnerable
agricultural regions of China primarily as a result of
precipitation declines projected by a different GCM. The
HadCM3 projects increased precipitation for the region,
which is beneficial to dryland crop yields and would also
reduce irrigation demand. The future of agricultural
production in the region is vulnerable to changes in
precipitation, and further studies with global and regional
climate change projection models are necessary to assess the
full range of potential climate change impacts and
adaptation strategies.
3.3. Agro-ecosystem carbon balance
3.3.1. Impact of climate and management on soil C
stocks
The pattern of crop residue C responses to treatment
variables was similar to those of crop yields. Residue C
was impacted primarily by the crop mix, with the highest
residue C values occurring in 2085 time period, when crop
production is greatest, under the wheat–corn double
cropping system. These projections of residue C input and
therefore soil C may be biased downward due to under
prediction of grain crop yields. In contrast, eroded C is
significantly influenced by tillage practice and by
cropping system (Table 5). Soil C stocks in the top
30 cm change significantly as a result of management
changes (Tables 5 and 6). Climate change did not
influence soil C stocks, but conversion from CT to NT
induced differences. Some increase in soil C occurs due to
the conversion to a wheat–corn double cropping system
under NT, but not under CT.
The magnitude of the simulated soil C change was a
function of initial soil C (Fig. 2). Regardless of the climate
scenario or the management option, the simulated data
suggests that soils low in C content would tend to accrue
more C than soils high in C content. In the EPIC model, soil
C change is regulated by two major mechanisms: C inputs
and variations in decomposition rates of C material
(Izaurralde et al., 2005). Soils relatively rich in soil C
content may not accrue C because they may already be near
their saturation level (Hassink, 1996; Six et al., 2002) or the
simulated C inputs are not large enough to offset the losses
dictated by the decomposition rates. Conversely, soils
relatively poor in soil C content respond more readily to
changes in management showing significant increases,
especially under NT and double cropping. To facilitate the
visualization of the trends portrayed in Fig. 2 we fitted third
order polynomials between initial soil C and soil C change.
These curvilinear relationships, however, lack predictive
value. Thus, the small soil C increases predicted at the high
end of soil C content are artifacts of the curvilinear fit rather
than a prediction of soil C accrual.
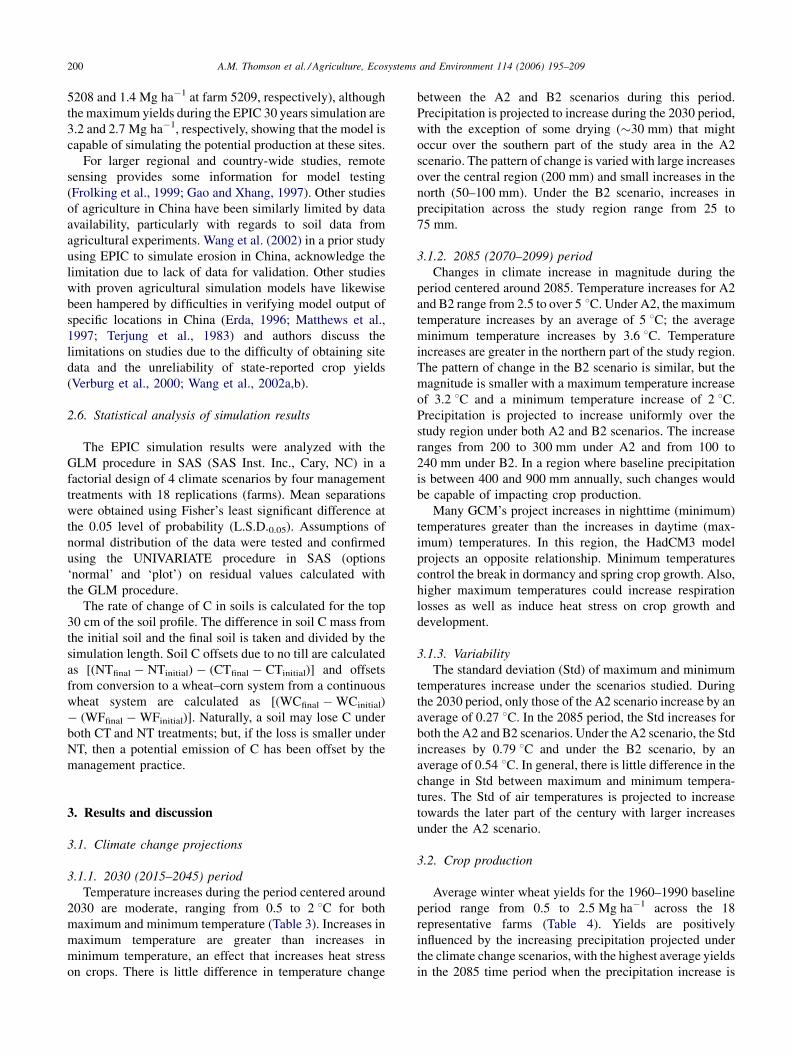
3.3.2. Soil C offset rates
The soil C mass in the top 30 cm of the soil was
calculated for each simulation and the total change and
rate of change over the 30 years period are given in
Tables 6–8. The IPCC estimated that changes in
agricultural management practices could result in C
sequestration in soils at a rate of 0.36 Mg C ha�1 year�1

A.M. Thomson et al. / Agriculture, Ecosystems and Environment 114 (2006) 195–209204
in non-Annex I countries, including China (Watson et al.,
2000). In this simulation study, the study region loses soil
C under CT by an average of 0.27 Mg C ha�1 year�1 while
NT continuous wheat and wheat–corn result in soil C
accumulation of 0.10 and 0.32 Mg C ha�1 year�1, respec-
tively (Table 6). For the NT simulations, the rates of
change are generally greater during the first period, 2030,
and smaller during the second, 2085. The reduction in rate
is greatest for the NT wheat–corn management which
sequesters the greatest amount of soil C during the first
period and approaches a saturation point in the second
period. The soils under CT management continue with an
equal or greater rate of soil C increase in the 2085 time
period. The soil C rate change is not consistently different
as a result of the scenario selected (A2 or B2).
Soil C offsets under NT are given in Table 7, expressed as
the rate of change in soil C in Mg C ha�1 year�1 over the
30 year simulation period. With a few exceptions, the NT
always results in a positive soil C offset averaging 0.23–
0.37 Mg C ha�1 year�1 for continuous wheat and 0.34–
0.86 Mg C ha�1 year�1 for wheat–corn. A higher rate for
wheat in a rotation was also calculated by West and Post
(2002) in a global analysis of soil C sequestration rates.
Fig. 2. Relationship between initial soil C and the change in soil C over the 30
polynomials were fitted to facilitate the visualization of the trends and not for p
They found a rate of 0.25 (�0.26) Mg C ha�1 year�1 for
continuous wheat and 0.74 (�0.52) Mg C ha�1 year�1 for
wheat in rotation in the years following the conversion from
CT to NT. They also found an average sequestration rate of
0.16 (�0.14) Mg C ha�1 year�1 for increasing rotation
complexity under CT and 0.26 (�0.56) Mg C ha�1 year�1
for increasing rotation complexity under NT. The rate for
increasing the rotation complexity of a wheat system was
found to be 0.51 (�0.47) Mg C ha�1 year�1. The increase in
rotation complexity simulated by the wheat–corn system in
this study resulted in soil C offsets that were slightly
negative or neutral under CT and positive under NT
(Table 8).
These results suggest that a change to NT wheat–corn
double cropping is the management practice that would
result in the greatest soil C sequestration or offset. This
management causes the least disturbance to the soil and
returns the greatest amount of organic inputs from crop
residues under both the A2 and B2 scenarios of climate
change. Although in most cases the soils continue to
sequester or offset C the rate of change slows in the second
time period (2085), indicating a potential C saturation point
in the future.
years simulation period described using the third order polynomial. The
redictive purposes.
A.M
.T
ho
mso
net
al./A
gricu
lture,
Eco
systems
an
dE
nviron
men
t1
14
(20
06
)1
95
–2
09
20
5
Table 6
Rate of change in soil C mass in the top 30 cm over 30 years (Mg C ha�1 year�1)
ID Conventional tillage–continuous wheat No tillage–continuous wheat Conventional tillage–wheat–corn No tillage–wheat–corn
A2 B2 A2 B2 A2 B2 A2 B2
2030 2085 2030 2085 2030 2085 2030 2085 2030 2085 2030 2085 2030 2085 2030 2085
5200 0.04 0.10 0.01 0.10 0.63 0.55 0.60 0.54 0.01 0.00 �0.10 0.07 0.84 0.45 0.77 0.56
5201 �0.18 �0.06 �0.22 �0.03 0.24 0.18 0.15 0.25 �0.20 �0.13 �0.29 �0.07 0.52 0.03 0.51 0.41
5202 �0.51 �0.27 �0.55 �0.28 �0.54 �0.16 �0.58 �0.19 �0.84 �0.39 �0.78 �0.34 �0.38 �0.23 �0.22 �0.20
5203 �0.04 0.08 �0.09 0.02 0.17 0.39 0.15 0.20 0.04 0.07 �0.04 0.06 0.54 0.62 0.83 0.72
5204 �0.62 �0.44 �0.71 �0.42 �0.32 �0.21 �0.35 �0.18 �0.75 �0.52 �0.78 �0.44 �0.15 �0.11 �0.06 �0.06
5205 �0.56 �0.40 �0.60 �0.39 �0.20 �0.17 �0.26 �0.15 �0.62 �0.51 �0.69 �0.41 �0.16 �0.09 �0.06 �0.06
5206 �0.51 �0.32 �0.54 �0.31 �0.10 �0.07 �0.11 �0.07 �0.54 �0.40 �0.64 �0.28 0.09 0.05 0.16 �0.21
5207 �0.01 0.04 �0.03 0.02 0.09 0.15 0.05 0.13 �0.03 �0.01 �0.03 0.00 0.25 0.27 0.31 0.30
5208 �0.51 �0.36 �0.53 �0.31 �0.11 �0.13 �0.18 �0.09 �0.56 �0.42 �0.68 �0.35 0.02 �0.45 0.02 �0.39
5209 �0.26 �0.06 �0.29 �0.05 0.36 0.25 0.26 0.30 �0.35 �0.19 �0.48 �0.11 0.64 0.18 0.66 0.29
5210 �0.79 �0.53 �0.79 �0.54 �0.48 �0.31 �0.51 �0.33 �0.82 �0.55 �0.95 �0.45 �0.24 �0.61 �0.22 �0.57
5211 �0.29 �0.13 �0.30 �0.10 0.14 0.04 0.06 0.10 �0.35 �0.25 �0.55 �0.11 0.64 0.09 0.60 0.18
5212 �0.26 0.08 �0.11 0.00 0.19 0.40 0.35 0.29 �0.19 0.09 �0.10 0.04 0.69 0.52 1.04 0.41
5213 �0.34 �0.11 �0.36 �0.12 0.03 0.07 0.01 0.06 �0.30 �0.19 �0.39 �0.10 0.47 0.03 0.48 0.10
5214 �0.01 0.10 �0.02 0.08 0.49 0.41 0.49 0.43 0.13 0.09 0.88 0.14 0.95 0.88 0.91 0.88
5215 �0.05 0.17 0.07 0.10 0.58 0.26 0.71 0.26 �0.06 0.12 �0.02 0.10 1.15 1.09 1.19 1.13
5216 �0.18 0.07 �0.07 0.01 0.09 0.42 0.29 0.31 �0.20 0.05 �0.16 0.04 0.53 0.53 0.85 0.34
5217 �0.11 0.12 0.01 0.06 0.26 0.32 0.42 0.28 �0.13 0.03 �0.11 0.04 0.81 0.25 1.03 0.23

A.M. Thomson et al. / Agriculture, Ecosystems and Environment 114 (2006) 195–209206
Table 7
Soil C offset as a result of implementing no till (Mg C ha�1 year�1)
ID Continuous wheat Wheat–corn
A2 B2 A2 B2
2030 2085 2030 2085 2030 2085 2030 2085
5200 0.58 0.46 0.59 0.44 0.83 0.45 0.86 0.49
5201 0.42 0.24 0.37 0.28 0.73 0.16 0.80 0.48
5202 �0.03 0.11 �0.03 0.10 0.45 0.17 0.56 0.13
5203 0.22 0.31 0.24 0.18 0.50 0.55 0.86 0.66
5204 0.30 0.24 0.36 0.23 0.59 0.41 0.71 0.38
5205 0.36 0.23 0.34 0.24 0.46 0.42 0.63 0.35
5206 0.41 0.25 0.43 0.24 0.63 0.45 0.80 0.07
5207 0.10 0.11 0.09 0.10 0.28 0.29 0.34 0.30
5208 0.40 0.23 0.36 0.22 0.58 �0.03 0.71 �0.04
5209 0.63 0.32 0.55 0.35 0.99 0.37 1.15 0.40
5210 0.32 0.22 0.27 0.20 0.58 �0.06 0.73 �0.11
5211 0.43 0.17 0.36 0.20 0.99 0.34 1.15 0.29
5212 0.45 0.32 0.46 0.29 0.88 0.43 1.14 0.36
5213 0.36 0.18 0.36 0.19 0.77 0.22 0.87 0.21
5214 0.50 0.31 0.50 0.34 0.82 0.78 0.84 0.74
5215 0.62 0.09 0.64 0.16 1.21 0.97 1.22 1.02
5216 0.27 0.35 0.36 0.30 0.73 0.47 1.02 0.30
5217 0.37 0.21 0.42 0.22 0.93 0.22 1.14 0.19
Table 8
Soil C offset as a result of implementing double cropping of corn with wheat (Mg C ha�1 year�1)
ID Conventional tillage No tillage
A2 B2 A2 B2
2030 2085 2030 2085 2030 2085 2030 2085
5200 �0.03 �0.10 �0.10 �0.03 0.21 �0.10 0.17 0.02
5201 �0.02 �0.07 �0.07 �0.04 0.28 �0.15 0.36 0.16
5202 �0.33 �0.12 �0.23 �0.05 0.16 �0.07 0.36 �0.02
5203 0.08 �0.01 0.05 0.04 0.37 0.23 0.67 0.52
5204 �0.12 �0.08 �0.07 �0.02 0.17 0.10 0.28 0.12
5205 �0.05 �0.11 �0.09 �0.02 0.04 0.08 0.20 0.09
5206 �0.03 �0.09 �0.10 0.03 0.19 0.12 0.27 �0.14
5207 �0.02 �0.06 0.00 �0.02 0.16 0.12 0.26 0.17
5208 �0.05 �0.06 �0.15 �0.04 0.13 �0.33 0.20 �0.30
5209 �0.09 �0.12 �0.19 �0.06 0.28 �0.07 0.40 �0.01
5210 �0.03 �0.03 �0.16 0.09 0.24 �0.30 0.29 �0.23
5211 �0.06 �0.12 �0.25 �0.02 0.50 0.05 0.54 0.08
5212 0.07 0.01 0.01 0.04 0.50 0.12 0.69 0.11
5213 0.04 �0.08 �0.04 0.02 0.45 �0.04 0.47 0.04
5214 0.15 0.00 0.09 0.06 0.46 0.47 0.42 0.45
5215 �0.02 �0.05 �0.09 0.00 0.57 0.83 0.48 0.86
5216 �0.02 �0.02 �0.09 0.03 0.44 0.10 0.57 0.03
5217 �0.02 �0.08 �0.12 �0.03 0.54 �0.07 0.61 �0.06
Table 9
Total C change and offset in each simulation period for the study region (Pg C)
Scenario Continuous wheat Wheat–corn Carbon offset with
no till
Carbon offset with
double cropping
Conventional till No till Conventional till No till Continuous wheat Wheat–corn Conventional till No till
Baseline �0.20
A2 2030 �0.13 0.04 �0.15 0.20 0.18 0.35 �0.02 0.16
2085 �0.04 0.08 �0.07 0.10 0.12 0.18 �0.03 0.02
B2 2030 �0.13 0.05 �0.17 0.25 0.17 0.43 �0.05 0.21
2085 �0.05 0.07 �0.05 0.11 0.11 0.16 0.00 0.05

A.M. Thomson et al. / Agriculture, Ecosystems and Environment 114 (2006) 195–209 207
3.3.3. Total soil C stock
The rates of change in soil C vary by representative farm.
Thus, in order to examine the total impact of management
changes on the soil C stock of the Huang-Hai Plain region,
we multiplied the rate of change by the land area under
cultivation (Table 1). The potential change in soil C stock
over the simulation time periods is calculated assuming that
the management practices are applied uniformly over the
representative farm region.
Total soil C stocks in the Huang-Hai Plain region decline
under all climate scenarios with CT but increase under NT
management (Table 9), indicating that management changes
are more significant than climate scenarios in determining
future SOC. The increases in soil C under NT are greater
with the wheat–corn double cropping system because of
greater C inputs to soil. This results in soil C sequestration
and, consequently, greenhouse gas emission offsets. The
offsets due to implementation of a wheat–corn double
cropping system are slightly negative under CT due to the
increased disturbance of the soil, but positive when NT is
adopted.
4. Conclusions
The total soil C sequestration potential of the Huang-
Hai Plain if NT were to be fully adopted would range from
0.11 to 0.18 Pg C for CT and from 0.16 to 0.43 Pg of C for
wheat–corn double cropping (Table 9). The soil C
sequestration potential of the region is greatest in the
near-term and will decline over time as management
practices that sequester soil C or offset soil C losses are
adopted. These changes in soil C can be achieved through
alteration in management practices without significant
positive or negative impact on crop yields. The specific
development scenario (A2 or B2) did not significantly
alter the C sequestration potential of the region, but future
precipitation increases simulated would prove beneficial
to both crop yields and soil organic C. This study was
conducted with the projections of the HadCM3 GCM.
Other climate change projections and models could, of
course, result in different outcomes for the agricultural
simulations.
The estimated potential SCS under adoption of no till
management represents a small fraction of the IPCC’s
estimate of 40 Pg of C that might potentially be sequestered
in agricultural soils worldwide. However, our simulations
show that a switch to double cropping and NT could
contribute to climate change mitigation efforts in China.
This analysis considers only one agricultural region of
China, and further analyses considering other regions and
cropping systems, particularly paddy rice, might identify
other management practices appropriate for climate change
mitigation efforts. Assessments of climate change impacts
and adaptation and mitigation strategies in China would be
greatly enhanced by wider availability of field data and field
experimental results.
Acknowledgements
This research was conducted for the US Department of
Energy–China Meteorological Administration Bilateral
Agreement on the Study of Regional Climate and was
supported by the US DOE Office of Biological and
Environmental Research under contract DE-AC06-76RLO
1830. The technical advice of Dr. Changsheng Li is
gratefully acknowledged.
References
Amthor, J.S., 2001. Effects of atmospheric CO2 concentration on wheat
yield: review of results from experiments using various approaches to
control CO2 concentration. Field Crops Res. 73, 1–34.
Brown, R.A., Rosenberg, N.J., 1999. Climate change impacts on the
potential productivity of corn and winter wheat in their primary United
States growing regions. Clim. Change 41, 73–107.
Cavero, J., Plant, R.E., Shennan, C., Williams, J.R., Kiniry, J.R., Benson,
V.W., 1998. Application of EPIC model to nitrogen cycling in irrigated
processing tomatoes under different management systems. Agric. Syst.
56, 391–414.
Chinese National Soil Survey Office, 1997. China Soil Data from Census.
China Agricultural Press, Beijing, China (in Chinese).
Chinese National Soil Survey Office, 1998. China Soil. China Agricultural
Press, Beijing, China (in Chinese).
Chung, S.W., Gassman, P.W., Kramer, L.A., Williams, J.R., Gu, R., 1999.
Validation of EPIC for two watersheds in southwest Iowa. J. Environ.
Qual. 28, 971–979.
Cole, V., Cerri, C., Minami, K., Mosier, A., Rosenberg, N., Sauerbeck, D.,
1996. Agricultural options for mitigation of greenhouse gas emissions.
In: Watson, R.T., Zinyowera, M.C., Moss, R.H. (Eds.), Climate Change
1995: Impacts, Adaptation and Mitigation of Climate Change. Cam-
bridge University Press, Cambridge, UK, pp. 744–771.
Crook, F.W., Colby, W.H., 1996. The future of China’s grain market. In:
Agricultural Information Bulleting Number 730, US Department of
Agriculture, Economic Research Service, Washington, DC, 24 pp.
Cubasch, U., Meehl, G.A., Boer, G.J., Stouffer, R.J., Dix, M., Noda, A.,
Senior, C.A., Raper, S., Yap, K.S., 2002. Projections of future climate
change. In: Houghton, J.T., Ding, Y., Griggs, D.J., Noguer, M. (Eds.),
Climate Change 2001: The Scientific Basis. Cambridge University
Press, Cambridge, UK.
Easterling, W.E., Hays, C.J., Easterling, M.M., Brandle, J.R., 1996. Mod-
eling the effect of shelterbelts on maize productivity under climate
change: an application of the EPIC model. Agric. Ecosyt. Environ. 61,
163–176.
Edmonds, J., Wise, M., Pitcher, H., Richels, R., Wigley, T., MacCracken,
C., 1996a. An integrated assessment of climate change and the
accelerated introduction of advanced energy technologies: an appli-
cation of MiniCAM 1.0. Mitig. Adapt. Strateg. Glob. Change 1, 311–
339.
Edmonds, J., Wise, M., Sands, R., Brown, R., Kheshgi, H., 1996b. Agri-
culture, land-use, and commercial biomass energy: a preliminary inte-
grated analysis of the potential role of biomass energy for reducing
future greenhouse related emissions. In: PNNL-11155, Pacific North-
west National Laboratory, Washington, DC.
Edmonds, J., Dooley, J., Kim, S.H., 1999. Long-term energy technology:
needs and opportunities for stabilizing atmospheric CO2 concentrations.
In: Walker, C.E., Bloomfield, M.A., Thorning, M. (Eds.), Climate
Change Policy: Practical Strategies to Promote Economic Growth
and Environmental Quality. Monograph Series on Tax, Trade, and
Environmental Policies and U.S. Economic Growth. American Council
for Capital Formation, Center for Policy Research, Washington, DC, pp.
81–107.

A.M. Thomson et al. / Agriculture, Ecosystems and Environment 114 (2006) 195–209208
Erda, L., 1996. Agricultural vulnerability and adaptation to global warming
in China. Water Air Soil Pollut. 92, 63–73.
Fischer, G., Chen, Y., Sun, L., 1998. The balance of cultivated land in China
during 1988–1995. Interim Report IR-98-047/August. International
Institute for Applied Systems Analysis. Laxenburg, Austria.
Frolking, S., Xiao, X., Zhuang, Y., Salas, W., Li, C., 1999. Agricultural land
use in China: a comparison of area estimates from ground-based census
and satellite-borne remote sensing. Glob. Ecol. Biogeogr. 8, 407–416.
Gale, F., Tuan, F., Lohmar, B., Hsu, H., Gilmour, B., 2002. China’s food and
agriculture: issues for the 21st century. USDA Economic Research
Service Agricultural Information Bulletin no. AIB775. Washington,
DC, 64 pp.
Gao, Q., Xhang, X., 1997. A simulation study of responses of the Northeast
China transect to elevated CO2 and climate change. Ecol. Appl. 7 (2),
470–483.
Gordon, C., Cooper, C., Senior, C.A., Banks, H., Gregory, J.M., Johns, T.C.,
Mitchell, J.F.B., Wood, R.A., 2000. The simulation of SST, sea ice
extents and ocean heat transports in a version of the Hadley Centre
coupled model without flux adjustments. Climate Dyn. 16, 147–168.
Hassink, J., 1996. Preservation of plant residues in soils differing in
unsaturated protective capacity. Soil Sci. Soc. Am. J. 60, 487–491.
Houghton, J.T., Ding, D.J., Griggs, D.J., Noguer, M., van der Linden, P.J.,
Xiaosu, D. (Eds.), 2001. Climate Change 2001: The Scientific Basis.
IPCC. Cambridge University Press, Cambridge, p. 892.
Hsu, H., Gale, F., 2001. China: agriculture in transition. USDA Agriculture
and Trade Report WRS012. USDA Economic Research Service,
Washington, DC, 26 pp.
Izaurralde, R.C., Rosenberg, N.J., Brown, R.A., Legler, D.M., Tiscareno-
Lopez, M., Srinivasan, R., 1999. Modeled effects of moderate and strong
Los Ninos on crop productivity in North America. Agric. For. Meteor.
94, 259–268.
Izaurralde, R.C., Haugen-Kozyra, K.H., Jans, D.C., McGill, W.B., Grant,
R.F., Hiley, J.C., 2001. Soil C dynamics: measurement, simulation and
site-to-region scale-up. In: Lal, R., Kimble, J.M., Follett, R.F., Stewart,
B.A. (Eds.), Assessment Methods for Soil Carbon. Lewis Publishers,
Boca Raton, FL, pp. 553–575.
Izaurralde, R.C., Rosenberg, N.J., Brown, R.A., Thomson, A.M., 2003.
Integrated assessment of Hadley Center (HadCM2) climate-change
impacts on agricultural productivity and irrigation water supply in
the conterminous United States Part II. Regional agricultural production
in 2030 and 2095. Agric. For. Meteor. 117, 97–122.
Izaurralde, R.C., Williams, J.R., McGill, W.B., Rosenberg, N.J., Quiroga
Jakas, M.C., 2005. Simulating soil C dynamics with EPIC: model
description and testing against long-term data. Ecol. Modell. (http://
www.sciencedirect.com/science/journal/03043800 under the section
Articles in Press, verified 26 September 2005).
Jinghua, W., Erda, L., 1996. The impacts of potential climate change and
climate variability on simulated maize production in China. Water Air
Soil Pollut. 92, 75–85.
Kang, S., Zhang, L., Liang, Y., Dawes, W., 2003. Simulation of winter wheat
yield and water use efficiency in the Loess Plateau of China using
WAVES. Agric. Syst. 78, 355–367.
Kimball, B.A., 1983. Carbon dioxide and agricultural yield: an assemblage
of analysis of 430 prior observations. Agron. J. 75, 779–788.
Lal, R., Kimble, J., Follett, R., Stewart, B.A. (Eds.), 1998a. Adv. Soil Sci.:
Management of carbon sequestration in soil. CRC Press, Boca Raton,
FL.
Lal, R., Kimble, J., Follett, R., Stewart, B.A. (Eds.), 1998b. Soil processes
and the carbon cycle. Adv. Soil Sci.. CRC Press, Boca Raton, FL.
Legler, D.M., Bryant, K.J., O’Brien, J.J., 1999. Impact of ENSO-related
climate anomalies on crop yields in the US. Clim. Change 42, 351–375.
Li, C., 2000. Loss of soil carbon threatens Chinese agriculture: a compar-
ison on agroecosystem carbon pool in China and the U.S. Quat. Sci. 20
(4), 345–350 (in Chinese).
Li, C., Zhuang, Y., Frolking, S., Galloway, J., Harriss, R., Moore, B.,
Schimel, D., Wang, X., 2003. Modeling soil organic carbon change in
croplands of China. Ecol. Appl. 13 (2), 327–336.
Liu, Y., Teixeira, J.L., Zhang, H.J., Pereira, L.S., 1998. Model validation and
crop coefficients for irrigation scheduling in the North China Plain.
Agric. Water Manag. 36, 233–264.
Matthews, R.B., Kropff, M.J., Horie, T., Bachelet, D., 1997. Simulating the
impact of climate change on rice production in Asia and evaluating
options for adaptation. Agric. Syst. 54 (3), 399–425.
Nakicenovic, N., Swart, R. (Eds.), 2000. Special Report on Emissions
Scenarios. Cambridge University Press, Cambridge, UK, p. 612.
Parton, W.J., Schimel, D.S., Cole, C.V., Ojima, D.S., 1987. Analysis of
factors controlling soil organic matter levels in Great Plains grasslands.
Soil Sci. Soc. Am. J. 51, 1173–1179.
Paul, E.A., Paustian, K., Elliott, E.T., Cole, C.V. (Eds.), 1997. Soil organic
matter in temperate agroecosystems: long-term experiments in North
America. Lewis Publishers CRC Press, Boca Raton, FL.
Pope, V.D., Gallani, M.L., Rowntree, P.R., Stratton, R.A., 2000. The impact
of new physical parametrizations in the Hadley Centre climate model–
HadAM3. Climate Dyn. 16, 123–146.
Potter, K.N., Williams, J.R., Larney, F.J., Bullock, M.S., 1998. Evaluation of
EPIC’s wind erosion submodel using data from southern Alberta. Can. J.
Soil Sci. 78, 485–492.
Puurveen, H.P., Izaurralde, R.C., Chanasyk, D.S., Williams, J.R., Grant,
R.F., 1997. Evaluation of EPIC’s snowmelt and water erosion submo-
dels using data from the Peace River region of Alberta. Can. J. Soil Sci.
77, 41–50.
Roloff, G., de Jong, R., Zentner, R.P., Campbell, C.A., Benson, V.W., 1998.
Estimating spring wheat yield variability with EPIC. Can. J. Soil Sci. 78,
541–549.
Sinclair, T.R., Bai, Q., 1997. Analysis of high wheat yields in Northwest
China. Agric. Syst. 53, 373–385.
Six, J., Conant, R.T., Paul, E.A., Paustian, K., 2002. Stabilization mechan-
isms of soil organic matter: implications for C-saturation of soils. Plant
Soil 241, 155–176.
Song, G., Li, L., Pan, G., Zhang, Q., 2005. Topsoil organic carbon storage of
China and its loss by cultivation. Biogeochemistry 74, 47–62.
Stockle, C.O., Dyke, P.T., Williams, J.R., Allen, C.A., Rosenberg, N.J.,
1992a. A method for estimating direct and climatic effects of rising
atmospheric carbon dioxide on growth and yield of crops. Part II—
Sensitivity analysis at three sites in the Midwestern U.S.A. Agric. Syst.
38, 239–256.
Stockle, C.O., Williams, J.R., Rosenberg, N.J., Allen, C.A., 1992b. A
method for estimating direct and climatic effects of rising atmospheric
carbon dioxide on growth and yield of crops. Part I—Modification of
the EPIC model for climate change analysis. Agric. Syst. 38, 225–
228.
Sun, L., Rosenberg, N.J., Izaurralde, R.C., 2001. Assessment of climate
change impacts on agriculture in the northern part of the North China
Plain. PNNL Technical Report 13546. Pacific Northwest National
Laboratory, Richland, WA, 35 pp.
Tao, F., Yokozawa, M., Hayashi, Y., Erda, L., 2003. Future climate change,
the agricultural water cycle, and agricultural production in China. Agric.
Ecosyst. Environ. 95, 203–215.
Terjung, W.H., Ji, H.-Y., Hayes, J.T., O’Rourke, P.A., Todhunter, P.E., 1983.
Actual and potential yield for rainfed and irrigated maize in China. Int. J.
Biometeor. 28 (2), 115–135.
Thomson, A.M., Brown, R.A., Ghan, S.J., Izaurralde, R.C., Rosenberg, N.J.,
Leung, L.R., 2002. Potential impacts of climate change on winter wheat
production in eastern Washington State: a simulation study linking the
PNNL Regional Climate Model with EPIC. Clim. Change 54, 141–164.
Tong, C., Hall, C.A.S., Wang, H., 2003. Land use change in rice, wheat and
maize production in China (1961–1998). Agric. Ecosyst. Environ. 95,
523–536.
United States Department of Energy, 2004. World Energy and Economic
Outlook. In: Energy Information Administration, US DOE, Washington,
DC.
Verburg, P.H., Chen, Y., Veldkamp, T.A., 2000. Spatial explorations of land
use change and grain production in China. Agric. Ecosyst. Environ. 82,
333–354.

A.M. Thomson et al. / Agriculture, Ecosystems and Environment 114 (2006) 195–209 209
Wang, E., Harman, W.L., Williams, J.R., Xu, C., 2002a. Simulated effects of
crop rotations and residue management on wind erosion in Wuchan,
West-Central Inner Mongolia, China. J. Environ. Qual. 31, 1240–1247.
Wang, S., Zhou, C., Liu, J., Tian, H., Li, K., Yang, X., 2002b. Carbon storage
in northeast China as estimated from vegetation and soil inventories.
Environ. Pollut. 116 (Suppl.), S157–S165.
Wang, S., Tian, H., Liu, J., Pan, S., 2003. Pattern and change of soil organic
carbon storage in China: 1960s–1980s. Tellus 55B, 416–427.
Watson, R.T., Noble, I.R., Bolin, B., Ravindranath, N.H., Verardo, D.J.,
Dokken, D.J. (Eds.), 2000. Land Use, Land Use Change and Forestry:
A Special Report of the IPSS. Cambridge University Press, Cambridge,
UK.
West, T.O., Post, W.M., 2002. Soil organic carbon sequestration rates by
tillage and crop rotation: a global data analysis. Soil Sci. Soc. Am. J. 66,
1930–1946.
Williams, J.R., 1995. The EPIC model. In: Singh, V.P. (Ed.), Computer
Models in Watershed Hydrology. Water Resources Publication, High-
lands Ranch, CO, pp. 909–1000.
Wu, H., Guo, Z., Peng, C., 2003. Land use induced changes of organic
carbon storage in soils of China. Glob. Change Biol. 9, 305–
315.
Yang, X.M., Zhang, X.P., Fang, H.J., Zhu, P., Ren, J., Wang, L.C., 2003.
Long-term effects of fertilization on soil organic carbon changes in
continuous corn of northeast China: RothC model simulations. Environ.
Manag. 32 (4), 459–465.
Zhang, H., Wang, X., You, M., Liu, C., 1999. Water–yield relations and
water-use efficiency of winter wheat in the North China Plain. Irrig. Sci.
19, 37–45.
Zhou, C., Zhou, Q., Wang, S., 2003. Estimating and analyzing the spatial
distribution of soil organic carbon in China. Ambio 32 (1), 6–
12.
Zhu, S., Wang, Z., Hseung, Y., 1983. Effect of diverting water from south
to north on the ecosystem of the Huang-Huai–Hai Plain. In: Biswas,
Z., Dakang, J.E., Nickum, L., Changming, (Eds.), Long-distance
Water Transfer: A Chinese Case Study and International Experiences.
Water Resources Series, 3. United Nations Univ., pp. 432.