climate change effects on water resources in amman … · individual project report climate change...
TRANSCRIPT

Individual Project Report
Climate Change -Mitigation and Adaptation
1(39)
Climate Change effects on Water Resources
in Amman Zarqa Basin – Jordan
(Author)
Eng. Bassam Mohammed Al-Qaisi
Ministry of Water and Irrigation –Water Authority of Jordan – Jordan
Amman -11131
Phone +962 779902705, Fax +962 65813661
E-mail [email protected]
Climate Change mitigation and adaptation
Advanced International Training Programme
in Norrkoping – Sweden
October 25 – November 19
2010

Individual Project Report
Climate Change -Mitigation and Adaptation
2(39)
Table of contents
1 Preamble (preface) ............................................................................................................. 3
2 Executive Summary (abstract) ........................................................................................... 3
3 Introduction ...................................................................................................................... 4
4 Backqround ...................................................................................................................... 4
5 Case Study . ....................................................................................................................... 5
6 Objectives of the study ...................................................................................................... 6
Methodology ..................................................................................................................... 6
8 Problem Description ........................................................................................................... 7
9 Amman Zarqa Basin Physical Characteristics .................................................................. 7
10 Hydrogeology .................................................................................................................. 10
11 Rainfall ...........................................................................................................................15
12 Temerture and Evaporation ............................................................................................20
13 Runoff .............................................................................................................................. 22
14 Ifiltration ........................................................................................................................ 24
15 Water Quality ............................................................................................................... 27
16 Artificial Recharge .......................................................................................................... 28
17 Results ............................................................................................................................ 29
18 Discussion ..................................................................................................................... 30
19 Conclusion .................................................................................................................... 31
20 The way forward ........................................................................................................... 31
21 Acknowledgements ...................................................................................................... 31
22 Abbreviations ............................................................................................................... 32
23 References ..................................................................................................................... 32
24 Appendices .................................................................................................................... 34

Individual Project Report
Climate Change -Mitigation and Adaptation
3(39)
1. Preamble
This project is produced as an integral part of the Advanced International Training Program of
Climate Change - Mitigation and Adaptation 2010. The training was sponsored by Swedish
International Development Agency (SIDA) and organized under the guidance of Swedish
Meteorological and Hydrological Institute (SMHI) in Norrkoping, Sweden during the 25th
October to 19th
November, 2010. The overall objective of this training is to progress the
knowledge and awareness about Climate Change Phenomenon and its consequences. The
main objective of the training is to provide methods for identification of vulnerable sectors in
the society to climate change, both in national and international perspectives and encourage
the participants to research & development about the improved strategies for mitigation &
adaptation.
2. Executive Summary (abstract)
The Amman Zarqa Basin(AZB) area which extended northen to the Syrian boarders, the
Azraq basin to the east, Yarmouk basin to the northwest, and Amman area to the southwest.
The total area of the basin 4120km2 where around 95% of the area is within Jordan and 5% is
in Syria. The basin represents a transitional zone between the semi arid highlands in the west
to the arid desert in the east. The main populated centers are the cities of Amman, Zarqa,
Jaresh and Russaifeh. Groundwater is the main source of water supply in the basin, whereas
extracted from Basalt and Limestone aquifers through a huge number of wells.
Unjust and wrongful groundwater extracting generate depletion in water level and
deterioration in the water quality where engendering narrowly use. Climate change effects
extra challenge squeeze on the water budget in the basin and cause intimidation on the water
resources. Amman Zarqa Basin has been taken as case study area to demonstrate the climate
change effect on precipitation distribution and water resources availability. In addition
observe the metrological parameters.
The methodology of this study is to analysis precipitation distribution and rainfall variability
and intensity, observe evaporation and temperature changes, gauging the runoff volume, and
explored the groundwater recharge variability. The second part of this study is to suggest
climate change mitigation and adaptation methods.
This study deduce that the mean annual precipitation over the area is reducing from 300mm in
previous studies to 267.92mm, which is defined out of 58 rainfall station and for 58 years
monitoring records, and this study is designated that increase in the minimum value and the
potential evaporation value (2436) mm has unsystematically fluctuation. The runoff
coefficients in the basin vary from 2,45 to 3 % where generate runoff average volume
26MCM yearly.
The groundwater recharge where seemes to be observed around (5-5.75)% according to water
budget method which used to calculate the infiltration volume where found around 60MCM/y
The water quality deteriorates to critical limits. The study suggests the water harvesting
methods, artificial recharge to take as agent to mitigate climate change effects on water
resources.
Keywords: Climate change, rainfall, infiltration, artificial recharge, metrology, retention dams

Individual Project Report
Climate Change -Mitigation and Adaptation
4(39)
3. Introduction
Jordan is a Mediterranean country that depends mostly on rain as its main water resource.
Recent years have witnessed shortage in the rainfall in different parts of the country. As a
result, numerous streams have dried out, ground water level has fallen more than 18 meters
and most water aquifers are experiencing high salinity, which makes them unsuitable for
domestic or irrigation uses. In addition, extreme weather conditions such as flash floods
during winter and heat waves during summer are becoming more frequent in the region.
Jordan has one of the lowest levels of water resource availability, per capita, in the world.
Water scarcity will become an even greater problem over the next two decades as the
population doubles and climate change potentially makes precipitation uncertain and variable.
Management of water resources is therefore a key issue facing national government
authorities. Increasing overall water extraction to meet demand carries a high cost.
Groundwater the main source in Jordan due to the limitation of surface water resources. The
groundwater resources have been exploited since 1950s by government and private sectors
with few wells to reach more than 4000 wells nowadays.
These conditions are in additionally to consequences of global climatic changes that have
recently been affecting several locations, which are dramatically impacting wide ranges of
ecosystems. Decreases in the amount of precipitation and other extreme climate events(BGR),
including hot extremes, heat waves are very likely to become more frequent in multitudes and
subtropical land regions.
As a countermeasure for the expected groundwater deteriorations, Ministry of water and
irrigation (MWI)/Water Authority of Jordan (WAJ) have developed a groundwater-
abstraction stepped reduction scheme which strictly proposes that the use of renewable
groundwater for municipal and mainly irrigation water use will be reduced until 2020 in order
to reach a sort of “safe yield” or less disturbed condition.
Jordan is now accessing non-renewable water resources from fossilized deep-water aquifers.
Water quantity and quality also have major health and environmental impacts. Assessing
those impacts against alternative water management and efficiency strategies, and in the light
of policy costs and economic development issues, can optimize the use of a scarce resource.
4. Background
Countries in the Arab region are confronted with various water problems due to both climatic
conditions and socio-economic factors. From an eco-climatic point of view, most of the
region extends across semi-arid, arid and hyper-arid zones. The semi-arid belts have been
particularly affected by cycles of drought and desertification in the past. Socio-economically,
the region is characterized by a fast increasing population, which has resulted in a sharp
decline of the per capita availability of water, from about 2200 m3/capita/year to less than
1000 m3/capita/year over the past 25 years (IHP, 2005).
Natural recharge of aquifer from precipitation and surface water runoff helps to maintain the
water level of producing aquifers, control contamination of existing water supply by waste
water and lessen or entirely avoid the degradation of fresh water resources due to mixing with
adjacent or underlying brackish/saline waters. As ground water is of fundamental importance
to meet rapidly expanding urban, industrial and agricultural water requirements in arid and
semi-arid areas, the artificial recharge technique has become a standard practice in the
development and management of groundwater resources (Kruseman, 1997).

Individual Project Report
Climate Change -Mitigation and Adaptation
5(39)
Among the various artificial recharge methods, one of the methods is to retain surface water
by constructing dams across the surface channel and let storage water to percolate into
depleting groundwater aquifer. It refers to the movement of water through man-made systems
from surface to underground water bearing strata where it may be stored for future use. In
areas where groundwater is an important component of the water supply and rainfall
variability does not allow for a sufficient level of aquifer recharge by natural means, this
technology provides for the artificial enhancement of the natural recharge.
Jordan is known for its scarce water resources. Throughout history, the people in Jordan have
suffered from water shortages due to the semi-arid climate that is associated with limited
annual rainfall. Over the past few decades, the problem was enormous due to high natural
population growth, rural to urban migration and major influxes of population in response to
political and economic crises in the Middle East. These trends have resulted in increased
demand from domestic and industrial users.
The variability in the surface water resources left no choice but the use of groundwater
resources to cover part of the shortage. The total renewable safe yield of the groundwater
resources in the whole of Jordan is 277 MCM/year, which does not include the Disi aquifer as
this is a non-renewable source. Although extraction from these sources exceeded this safe
yield by more than 200 MCM/year in recent years, Water Authority of Jordan (WAJ) was
unable to meet the substantially increasing demand. The declining per capita water
availability in Jordan.
The water resources strategy included existing and potential sources. Investment programs
were developed to implement new projects such as water harvesting, dams and rehabilitation
and restructuring water systems to minimize the unaccounted for water (UFW). Concentration
was made on demand management and public awareness programmes. New sources were
identified to relief the existing groundwater source and allow the natural recharge of these
sources and to restore their water quality which shall relief part of water shortage in Greater
Amman area. This situation is deteriorating each year by the increase of demand and
therefore, MWI had to consider the option of implementing the Disi Project by conveying
water from the southern part of Jordan to Amman.
5. Case Study
Amman Zarqa Basin (AZB) has been taken as case study to demonstrate the climate change
effect on precipitation distribution and water resources availability. The (AZB) is one of the
largest developed areas in Jordan. It is also the fastest growing region both industrially and in
terms of population. New industries and irrigation projects are being implemented in the area.
Groundwater represents the main source of water supply in the basin. Most of the
groundwater exists and is being abstracted from the Basalt and B2/A7 layers within an area
enclosed by the saturated limit of the B2/A7. This area includes the highest concentration of
wells where depletion and deterioration in water quality has reached to critical stages.
Abstraction in Amman-Zarqa basin started in mid sixties (8.46MCM) and increased
continuously through the nineties (119MCM).The estimated annual recharge is approximately
70.0MCM.

Individual Project Report
Climate Change -Mitigation and Adaptation
6(39)
6. Objectives of the study
This study objected to identify the effect of climate change in water level and water quality on
the Amman Zarqa Basin (AZB) by the following:-
1. Determination the fluctuations in weather parameters in the study area and study the
impacts of climate change on the water resouces
2. Engagement of water depletion and water quality deterioration with Climate Change
in the Region.
3. Encourage the Ministry of water and irrigation (MWI) and Water Authority of Jordan
(WAJ) to mitigate and adapt the impacts of Climate Change.
7. Methodology
The methodologies adopted for this study included items such as the study of the weather
and atmospherically parameters simultaneously with the assessment of the hydro-geology of
the area, the analyses of time series, the classification of the groundwater quality, the
development of water balances, and possibly the execution of groundwater modelling to
assess the impacts of climate change. The detailed elements of the methodology are:
1. Study and analyse the fluctuation of the annual precipitation data, and the cumulative
annual evaporation.
2. Study and analyse the annual average temperature records, the prevailing winds and the
heat waves in the region, and the land cover and land use that impacted by the climate
change.
3. Analyses is of the interaction between rainfall, the surface water hydrology (floods) and
groundwater level behavior.
4. Evaluate the groundwater types in the study area, and evaluate the water quality against
standards, along with evaluation of the surface water quality (floods).
8. Problem description
This study drive to carry out a pilot project aimed to detect trend in weather parameters and
valuate the influence of climate change on the water resources in Amman zarqa basin . The
Amman Zarqa Basin has been designated for this study because of the importance of this area
as a groundwater supply area for Amman city, and because of the depletion of the aquifers
and water quality deterioration in the last few decades.
Available data A wide range of data is available including geological maps, groundwater level
measurements, infiltration data, pumping test analysis, groundwater samples for water quality

Individual Project Report
Climate Change -Mitigation and Adaptation
7(39)
analysis, meteorological stations data available and rainfall, runoff data, and climate data
including potential evaporation.
Fieldwork
The fieldwork within the study area included visits to the regional meteorological stations,
Ground water monitoring wells, surface water and floods stations and the springs in the Regan
as well. Well visits included the checking of water levels, taking the water quality (EC
measurement).
This study carried out cooperatively with the Ministry of water and irrigation (MWI) and
Water Authority of Jordan (WAJ) whereas they provided the study with all of the
groundwater and surface water data and records in addition to water quality results that they
have, maps, facilities for fields investigation.
9. Amman Zarqa Basin (AZB)
Physical Characteristics
9.1 Location
The study area extends north to the Syrian boarders, the Azraq basin to the east, Yarmouk
basin to the northwest, and Amman area to the southwest. The total area of the basin
4120km2 where about 95% of its area is within Jordan and only 5% is in Syria. The basin
extends from the Syrian city of Salkhad in Jebal al-Arab with an elevation of 1460 m to south
of Amman and then westward to discharges its water at its confluence with River Jordan at an
elevation of -350 m. The basin represents a transitional area between the semi arid highlands
in the west to the arid desert in the east.
About 2.72 million people (2004) are living in the basin representing about 50% of the total
population in Jordan. The main populated centers are the cities of Amman, Zarqa, Jaresh and
Russaifeh. (Fig. 9.1).
Figure 9.1: Location map of the study area

Individual Project Report
Climate Change -Mitigation and Adaptation
8(39)
9.2 Topography
A sloping terrain from 950m near the Arab Mountain to 620m near the Sukhna area and 735m
southwest of Amman characterizes the study area. The topography reflects the geology
consisting mainly of a basaltic mountain that slopes down to a central, gently rolling plateau
bounded from north and south by rugged and dissected limestone hills. The stream flow of the
Zarqa River is impounded by King Talal Dam at an elevation of 120 m and a capacity of 82
MCM. The area behind the river is about 3100 km2 producing an (average) runoff of about 60
MCM/y. (Fig. 9.2).
Figure 9.2: Topographic map of the study area (dar alhandasa)
9.3 Climate
Jordan lies in the eastern side of the Mediterranean. The climate is semi-arid and
characterized by cold humid winter with lower temperatures including moderate frosts during
the nights and warm dry summer. According to the 50-years mean annual rainfall map,
rainfall ranges between 100-500mm. The mean monthly surplus volumes are in December,
January, February and March. Average evaporation constitutes approximately 90% of the
total rainfall (WAJ, 1989). Average estimated infiltration rate is approximately 4-10% (WAJ,
1989; Mahamid, 1994). The eastern highlands of Jordan and its climate is characterised by hot
summers and mild winters. Low amounts of precipitation occur during the relatively wet
months from October to May and they are normally associated with the inland vapour
transport from the Mediterranean Sea.
The annual average temperature is 17.3°C. The daily average temperature ranges from
approximately 8 °C in the winter to 25°C in the summer . Prevailing winds at Amman Airport
are from the southwest in the winter shifting to the northwest in the summer. The available
data for the water years from 1965-66 through to 1989-90 indicate that the cumulative annual
evaporation, based on Class A pan data, is in the order of at least 2000 millimetres. Monthly
evaporation rates range from approximately 85 up to 90 millimetres in December and January
to 210 millimetres in April, and up to 300 millimetres in May (Chehata and Livant,
1997).And the evaporation reach 567 millimeters in Augast.

Individual Project Report
Climate Change -Mitigation and Adaptation
9(39)
9.4 Geology
The rock outcropping in the study area ranges in age from Creteaceous (Ajlun) to recent
(Macdonald & Partners, 1964). The succession from top to bottom is given below:
Table (9.1) The outcropping of the basalt and B2/A7 formations
Group Formation Description
Recent Recent
Alluvium
River gravels and superficials gravels, silts
Basalt Basalt Scoriacous basalt, volcanic plugs
Balqa B2 -Amman Limestone, marl, massive chert.
Ajlun A7- Wadi Sir Crystalline and chalky limestone
1- Wadi Sir Formation A7 ( Turonian)
It is the upper most unit of the Ajlun group. It outcrops extensively both in the north,
central and south parts of the area. The massive crystalline limestone is karstic and
weathered in the top 20m of the formation. Below them there is a general increase in the
marl chalky limestone and thin marl beds occur, indicating a transition into the underlying
Shueib formation. The formation ranges in thickness between 50-250m dipping to the east
and northeast.
2- Amman Formation B2 (Santonian_Campanian):- It is a cyclic deposit of chalk, phosphate,
silicified phosphate, limestone and Chert. Its thickness ranges reaches 47m in the study
area.
3- The Plateau Basalt (Oligocene-Pleistocene) :- Basalt outcrops in the northeastern part of
the basin. Six major flows have been identified in the study area. Thin layers of clay and
gravel consisting of limestone and Chert pebbles have been encountered between the
successive flows. The basalt thickness in the northeastern part is 400m and wedges to the
west towards the periphery of the flows.
4- Younger Alluvium Formation :- The younger alluvial consists of thin deposits overlying
the basalt in the cemented out-wash and the old river terraces.
Figure (9.2) Outcropping and formations in the study area(adopted from dar alhandasa)

Individual Project Report
Climate Change -Mitigation and Adaptation
10(39)
9.5 Structure
Generally low dips and gentle folding except for the abrupt flexures and associated faults
characterize the study area. Such features mark the limits of the important synclines of Wadi
Sayih and Muasher in the south and south-central parts. North of the Muasher syncline there
appears to be another turndown of fault. The limestone north of the basalt formation is
affected also by a flexure downloading the strata to the south. In the central part of the area
the structures are covered by the basalt flow where the basalt filled a major synclinal structure
having a pitch to southeast (Macdonald & Partners, 1965).
10. Geo-Hydrogeology
10.1 Aquifers Classification
Based on the geologic and structural features descried in the pervious section, three main
aquifers were identified:
The B2/A7 limestone aquifer
Most of this limestone formation is wholly within the limit of saturation. In areas where the
formation is below the water level and fissures and joints exist, it was recorded as a potential
aquifer. The degree of fracturing and porosity controls the yield and availability of water.
The Basalt and the Older Alluvial aquifer
Both are considered one of the main aquifer system in the study area and extend from the
basin center to the north and northeast. The alluvial deposits lie below the basalt, in the
drainage channels and depressions of the former land surface and within the basalt sequence.
They are considered as the major conduits carrying recharge water from the high rainfall areas
into the Dhuliel and other groundwater provinces.
Figure (10.1) hydraulics streams in the study area(adopted from dar alhandasah)

Individual Project Report
Climate Change -Mitigation and Adaptation
11(39)
Apart from the interflow alluvial within the basalt, scoriaceous and jointed basalt in the east
and central part is considered a very good aquifer. Both formations are considered in
hydraulic connection. Thus, they are considered as one unconfined aquifer system.
10.2 Hydraulic Parameters
Transmissivity
Geological structures are considered the main control factor for the location of high yield
aquifers (100m3/hr). Wells that were drilled by Macdonald & partners (1964) showed that the
main synclinal structures are considered as potential aquifers. Several wells were drilled in the
B2/A7 aquifer and showed that the highest yield aquifers are located in the Muasher syncline.
This formation has poor ability to transmit water and wells should be restricted to areas of the
major structural deformations where high secondary permeability exists.
Limited number of wells that were drilled in this aquifer has transmissivity data. In order to
calculate the transmissivity (T) for the remaining wells. The correlation for the Wadi Sir
formation is illustrated by the following equation.(Fig.10.2):
T= 48.27S0.88
( 10.1)
T= transmissivity
S=specific capacity
Figure (10.2) transmissivity and specific drawdown for the B2/A7 formation.
The main synclinal features are the Muasher in central part of the study area, the East-
Abdalliah in the southwest, and the Hallabat in the northeast. As a result, a zone of
scoriaceous basalt reaching to a thickness of 45m is considered to be the primary aquifer in
basalt flows where the transmissivity values are considered very high. Away from the high
yield areas, the basalt is made up of a series of semi-interdependent channels or pipes lying
side-by-side giving the possibility to pump from one well without affecting the next. The
correlation equation for the basalt formation is illustrated by the following equation:
T=223.55S0.64
(10.2)
y = 48.271x0.8885
R² = 0.5353
1
10
100
1000
10000
100000
0.1 1 10 100 1000
Tra
ns
mis
siv
ity
Specific Capacity
B2/A7 Formation

Individual Project Report
Climate Change -Mitigation and Adaptation
12(39)
10.3 Specific-yield
Lack of observation wells in the study area prevented the obtaining of specific-yield values.
Also the nature of basalt and the semi-interdependent channels make it very difficult to
estimate the specific-yield for a large area. Nevertheless it is obvious that the few specific-
yield values that were measured indicate that the system is under water-table conditions.
Estimated values for specific-yield range between 0.05 and 0.40 and are shown in Figure
(19.3).
Figure 10.3: Specific yield distribution over the study area
10.4 Flow-Net
Static-water level readings were obtained from more than 200 wells prior to 1980 when the
system was in equilibrium. For the central and Hallabat areas, the year 1965 was the initial
water level. The groundwater flows from the northeast from Arab Mountain in Syria towards
the west and northwest into the Yarmouk basin Figure (10.4) and toward the east to the Azraq
basin. The configuration of contour lines indicates the aquifer characteristics. The
groundwater velocity varies through the study area considerably according to permeability.
Figure 10.4: Measured steady state water-level map of the study area

Individual Project Report
Climate Change -Mitigation and Adaptation
13(39)
10.5 Recharge
Recharge occurs through direct and indirect recharge in the study area. Direct recharge is due
to direct rainfall infiltration on the study area. Indirect recharge consists of lateral flow from
the high rainfall areas in the Arab Mountain.
Direct recharge within the study area was calculated by multiplying the 50-years average
annual rainfall by the infiltration ratio. Previous studies have calculated the average
infiltration rate based on the water budget method. In the Amman-Zarqa basin water
resources study (Water Resources in Jordan,Mudallal,1989), the calculated infiltration rate
was 7.0%-10.0% of the total rainfall amount. Recent study by Mahamid (1998) showed that
the infiltration rate ranges between 3%-6%. And ARD study an infiltration rate of 6% was
used to calculate recharge. The annual rainfall in the study varies between 100 – 500mm.
Estimated mean annual direct recharge in the study area totals to around 32MCM. Indirect
recharge or lateral flow via the basalt and associated gravel was calculated according to
Darcy’s law in the model. Model Results showed that annual lateral recharge from the north
is approximately 46.5 MCM. Total annual recharge to the study area was estimated to be
80MCM.(ARD)
10.6 Abstraction
Development in the study area started in the early sixties. Abstraction increased gradually
from 8.46 MCM in 1965 to 123.4MCM in 1998. The increase in abstraction from 1965-1975
was concentrated in the Dhuliel-Hallabat area where the abstraction reached to approximately
37 MCM/yr. Starting from 1980, a gradual expansion of the wells took place in the north and
northeast. By the year 1995, another expansion to the east was noticed leading to increase in
abstraction to 123.4MCM by 1998. Total domestic and industrial abstraction is around
48.8MCM, representing 40% of the total production in the study area.
10.7 Land cover The soils of the basin differ widely according to rainfall and relieves. In the most humid west,
reddish to brownish clay and clay loams prevail. Toward the east, the soil become more
immature with silty loam to loamy in texture, yellowish brown to strong brown with very high
carbonate content, (See figure 10.5).
Figure (10.5) AZB land cover (adopted from Shatanawy)

Individual Project Report
Climate Change -Mitigation and Adaptation
14(39)
Soil erosion on the steeper slope is main cause of colluvial processes where sheet erosion is
more pronounced in the eastern part. Different types of soil erosion are causing serious
problem threatening the storage capacity of King Talal Dam. Soil depth is function of slope
where deep colluvial soils have been accumulated in the valleys and lower slopes. The upper
slopes are affected by soil erosion and degradation, leaving behind shallow and stony soil.
(shatanawy,2002).
10.8 Landuse During the last 20 years, the basin has undergone considerable land use changes. The
expansion of Amman and other towns has been enormous, where before large areas of grazing
land and fertile agricultural land could be found between Amman and other towns, it has now
developed into one large urban conglomerate.(Shatanawy,2002).
Zarqa River basin is capable of supporting forests and agricultural activities. Natural forests
occurring in the mountainous part are composed of oak, pine, juniper, wild olive and cypress.
Agricultural activities and their associated weeds have supplanted the indigenous flora
communities. Agriculture is scattered with the basin from rainfed orchards, olive and field
crops to irrigated agriculture on the river banks and the Jordan valley. Private Irrigated area
using groundwater as a source of irrigation water can be found in scattered places in the
middle and the eastern part of the basin. The main industrial activities in the basin are: al-
Hussein thermal power plant, the oil refinery, textile industries, paper processing, leather
production, food Industries, distilleries, drugs and chemical industries, intermediate
petrochemicals, engineering industries, paper and carton products and mining industries
(Phosphate).
These activities are considered the main source of pollution to the surface and groundwater. In
addition to that, the basin includes four municipal wastewater treatment plants whose effluent
has reached 70 MCM/year and is discharged to the river. This volume is expected to reach
180 MCM by the year 2025.(shatanawy.2002)
Figure 10.6) AZB landuse (adopted from Shatanawy,2002)

Individual Project Report
Climate Change -Mitigation and Adaptation
15(39)
11. Rainfall
The hydrological network in and in the vicinity of the study area consists of 94 rainfall
stations 58 of them within the (AZB) area others are in surrounded where they distributed as
some of them shows in figure (11.1) .thirty five stations according to the data accuracy and
geographical distribution was selected to establish the water contour map (see figure (11.1) .
Figure (11.1) rainfall station location
Farther more there is three from seven evaporation stations are located within the basin area.
Among to the stations there are 8 wadis as in figure (11.3) drain in the study area. The
location and long term average annual rainfall are listed in table (11.1) where the most
stations recording was started in the fourth decade of the last century. Two stream gauging
stations are recognizing in the study area. For groundwater recharge many water wells in the
basin has been observed.
Precipitation Distribution The amount of rainfall is mainly governed by the topography. Precipitation analysis shows
that the rainfall distributions can be divide into four zones within (AZB), the Highlands,
Plateaus and Terrain flat, Desert area and Lowlands (Gours) where these divided represents
the Jordan topography. In the highlands the rainfall stations, Jarash, kitta, Dibbin, Aluk,
Sweilih and Husain collage represent this area with rainfall ranging from 543.35 mm/y in kitta
to 319.32mm/y in aluk station.
The Plateaus and Terrain flat covered by stations Miduar, Baalama, Sukhna, Khaldiah,
Nuasif, Um El-jimal, Zarqa and Rusaifah with annual rainfall range from220.74mm/y in
Miduar station to 119.76mm/y in Um-El jemal station. While in Desert area the Annual

Individual Project Report
Climate Change -Mitigation and Adaptation
16(39)
0
50
100
150
200
250
300
350
1942
1945
1948
1951
1954
1957
1965
1968
1971
1974
1977
1980
1983
1986
1989
1992
1995
1998
2001
2004
2007
Rai
nfa
ll(m
m)
Time- Years
Ruseifa Station Rainfall
rainfall ranged from 112.86mm/y in Um Qaiteen station to 66.48 in wadi Salaheb station and
by incursion out of the basin to eastern south to al Emary station where the annual reainfall
about 41.24mm/y. The fourth part of the basin is the lowlands where stations Dair all and
Subaihi located there with annual rainfall ranged from 277.44mm/y to 391.75mm/y
respectively. Nearly all of the precipitation occurs during the months from October to May.
Snowfall is not uncommon in the highlands during the coder winter months. A comparison of
data from adjacent stations reveals that rain storms are often very local events in Jordan.
Figure (11.3) illustrates that the highest rainfall in recorded in the northern highlands around
Ajlun and Swaleh
Table (11.1) AZB rainfall Station location and precipitation
Figure (11.2) Annual Rainfall for Ruseifa Station
Sation name
North palestine
grid
East palestine
grid Yearly P.(MM) um-Quttein 192.5 303.5 136.78
H5 192.5 348.5 67.8
Deir El-Kahf 185 325 108.47
al-Qrryatein 144.8 330 72.32
Azraq Evap 114.15 320 53.83
El-umari 107.3 342 41.24
wadi salahib 159.7 381.5 61.48
midwar 188.5 244 220.47
Baalama 182.8 252.7 195.59
Jarash 187.5 234.5 355.72
Kitta 187 229.5 543.35
Dibbin 184.8 229 504.11
Aluk 174.8 237.2 319.32
Individual Project Report
Climate Change -Mitigation and Adaptation
17(39)
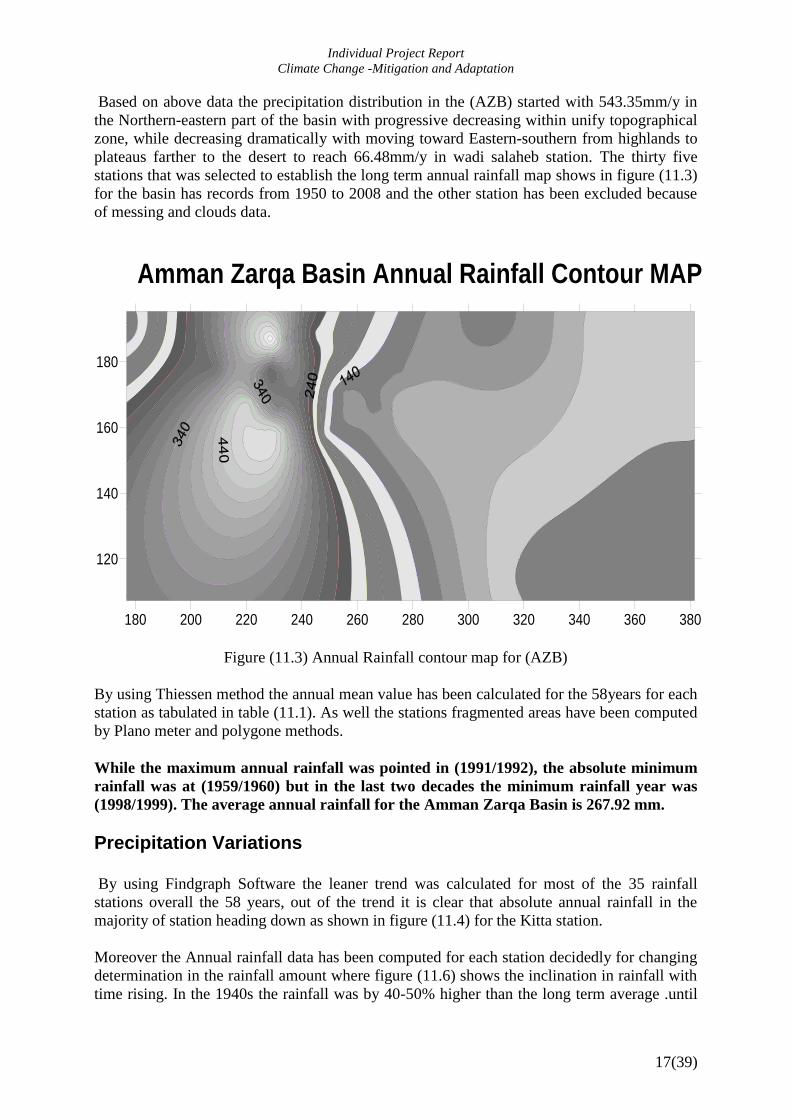
Based on above data the precipitation distribution in the (AZB) started with 543.35mm/y in
the Northern-eastern part of the basin with progressive decreasing within unify topographical
zone, while decreasing dramatically with moving toward Eastern-southern from highlands to
plateaus farther to the desert to reach 66.48mm/y in wadi salaheb station. The thirty five
stations that was selected to establish the long term annual rainfall map shows in figure (11.3)
for the basin has records from 1950 to 2008 and the other station has been excluded because
of messing and clouds data.
Figure (11.3) Annual Rainfall contour map for (AZB)
By using Thiessen method the annual mean value has been calculated for the 58years for each
station as tabulated in table (11.1). As well the stations fragmented areas have been computed
by Plano meter and polygone methods.
While the maximum annual rainfall was pointed in (1991/1992), the absolute minimum
rainfall was at (1959/1960) but in the last two decades the minimum rainfall year was
(1998/1999). The average annual rainfall for the Amman Zarqa Basin is 267.92 mm.
Precipitation Variations By using Findgraph Software the leaner trend was calculated for most of the 35 rainfall
stations overall the 58 years, out of the trend it is clear that absolute annual rainfall in the
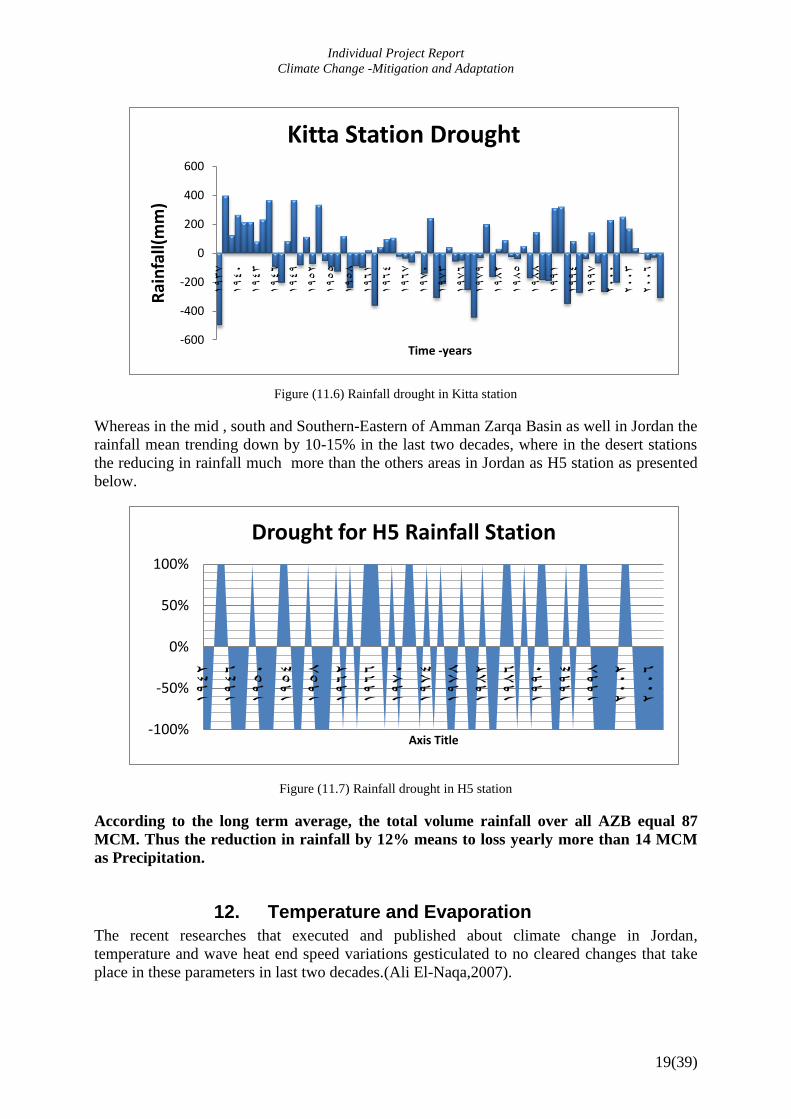
majority of station heading down as shown in figure (11.4) for the Kitta station.
Moreover the Annual rainfall data has been computed for each station decidedly for changing
determination in the rainfall amount where figure (11.6) shows the inclination in rainfall with
time rising. In the 1940s the rainfall was by 40-50% higher than the long term average .until
180 200 220 240 260 280 300 320 340 360 380
Amman Zarqa Basin Annual Rainfall Contour MAP
120
140
160
180

Individual Project Report
Climate Change -Mitigation and Adaptation
18(39)
0
50
100
150
200
250
300
350
400
450
500
40s50s60s70s80s90s2000sLog term
Rai
nfa
ll(m
m)
AZB Rainfall Stations
the late 1960s the average annual rainfall dropped to between 20 to 30 % below the long term
average.
Figure (11.4) Rainfall trend in Kitta station
Figure (11.5) Rainfall dropping down in(AZB) decidedly
Around 1963/1965 it rose again to a level of 10 to 15% above the long term average. In the
following years the average sharply dropped again, reaching a low of up to 20% below
average around 1978/1979. Thereafter, the situation differs for the different station. At some
station in the north the average rainfall seems to have increased until to day, whereas most
other stations as shown in Kitta station Figure (11.6) averages decreasing below the long term
average.
Individual Project Report
Climate Change -Mitigation and Adaptation
19(39)
-600
-400
-200
0
200
400
600
1937
1940
1943
1946
1949
1952
1955
1958
1961
1964
1967
1970
1973
1976
1979
1982
1985
1988
1991
1994
1997
2000
2003
2006
Rai
nfa
ll(m
m)
Time -years
Kitta Station Drought
-100%
-50%
0%
50%
100%
1942
1946
1950
1954
1958
1962
1966
1970
1974
1978
1982
1986
1990
1994
1998
2002
2006
Axis Title
Drought for H5 Rainfall Station
Figure (11.6) Rainfall drought in Kitta station
Whereas in the mid , south and Southern-Eastern of Amman Zarqa Basin as well in Jordan the
rainfall mean trending down by 10-15% in the last two decades, where in the desert stations
the reducing in rainfall much more than the others areas in Jordan as H5 station as presented
below.
Figure (11.7) Rainfall drought in H5 station
According to the long term average, the total volume rainfall over all AZB equal 87
MCM. Thus the reduction in rainfall by 12% means to loss yearly more than 14 MCM
as Precipitation.
12. Temperature and Evaporation
The recent researches that executed and published about climate change in Jordan,
temperature and wave heat end speed variations gesticulated to no cleared changes that take
place in these parameters in last two decades.(Ali El-Naqa,2007).

Individual Project Report
Climate Change -Mitigation and Adaptation
20(39)
This study has been reorganise the five evaporation station that located within AZB with
yearly evaporation data based on class A pan method for more 25 years according to The
table (12.1) below show.
Table (12.1) AZB evaporation station data
Years
AL0019 AL0035 AL0053 AL0059 AL0066
1980 1981
2606 2570 2953 1982
2318 2740 2543
1983
2354 2422 2795 1984
2595 2775 3359
1985
2840 2848 1986
2965 2661
1987
2785 3395 2548
1988 2359
2512 3071 2183
1989 2478 2459
3851 2122
1990 2684 2472
3592 1948
1991 2334 2341
3059 2160
1992 1785 2059
3539 1953
1993 2573 2380
2630 1748
1994 2332 2003
2603 1910
1995 2447 1704
2504 2076
1996 2349 1943 2313 2722 2079
1997 1678 3102
2449 2124
1998 2048 3023
2578 2112
1999 2267 3399 2300 2643 1832
2000 2159 3418 1018 2529 1910
2001 2202 3308 2550 3090 1983
2002 2229 2383
3010 1652
2003 2079 3267
2815 1718
2004 2132 3082 2044 2742 2118
2005 1780 2362 1903 2600 2071
2006 2365 3216 2222 2988 2109
2007 1865 2824 2473 3310 2608
2008 3253 2664 1265 2968 1945
2009
3236
The evaporation data for stations (AL0019, AL0035, AL0059, and AL0066) has divided for
two decadal (1988-1998, 1998-2008), and thiessen Polygons and Isohyatal maps are used to
calculate the evaporation value, where found the potential evaporation value for period
(1988-1998) is about 2452 mm but for period (1998-2008) it is about 2502 mm.
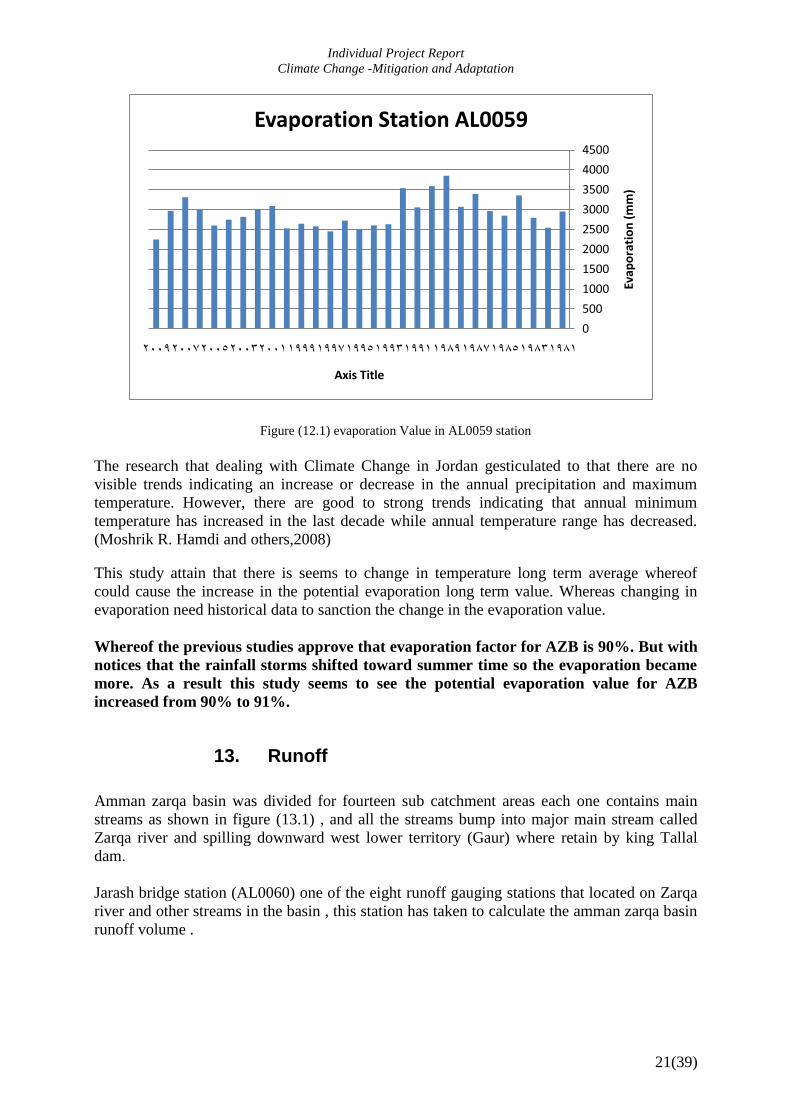
The evaporation data indicated that AL0035 station in Baqa near Amman city has clear
variation from 2292mm in the first decade to 2995 mm in the second. Other stations has
limited variation as shown in AL0059 data in figure (12.1) below.
Individual Project Report
Climate Change -Mitigation and Adaptation
21(39)
0
500
1000
1500
2000
2500
3000
3500
4000
4500
198119831985198719891991199319951997199920012003200520072009
Evap
ora
tio
n (
mm
)
Axis Title
Evaporation Station AL0059
Figure (12.1) evaporation Value in AL0059 station
The research that dealing with Climate Change in Jordan gesticulated to that there are no
visible trends indicating an increase or decrease in the annual precipitation and maximum
temperature. However, there are good to strong trends indicating that annual minimum
temperature has increased in the last decade while annual temperature range has decreased.
(Moshrik R. Hamdi and others,2008)
This study attain that there is seems to change in temperature long term average whereof
could cause the increase in the potential evaporation long term value. Whereas changing in
evaporation need historical data to sanction the change in the evaporation value.
Whereof the previous studies approve that evaporation factor for AZB is 90%. But with
notices that the rainfall storms shifted toward summer time so the evaporation became
more. As a result this study seems to see the potential evaporation value for AZB
increased from 90% to 91%.
13. Runoff
Amman zarqa basin was divided for fourteen sub catchment areas each one contains main
streams as shown in figure (13.1) , and all the streams bump into major main stream called
Zarqa river and spilling downward west lower territory (Gaur) where retain by king Tallal
dam.
Jarash bridge station (AL0060) one of the eight runoff gauging stations that located on Zarqa
river and other streams in the basin , this station has taken to calculate the amman zarqa basin
runoff volume .

Individual Project Report
Climate Change -Mitigation and Adaptation
22(39)
Figure (13.1) Main streams in AZB – (adopted from Shatanawy )
Runoff gauging stations are shown in figure (13.2) below , whereas all the surface runoff of
AZB pass AL0060 Runoff station (Jarash Bridge Station) it became the reference to calculate
runoff volume .
Figure (13.2) AZB runoff stations
The runoff data from all the stations was screened and evaluated, this stations recorded runoff
base flow and flood flow. At station AL0060 the recorded found from year 1980 to 2008 and
the data was divided to three decadal sections for comparison purpose.

Individual Project Report
Climate Change -Mitigation and Adaptation
23(39)
0
20
40
60
80
100
120
Bas
e a
nd
Flo
od
Flo
w(M
CM
)
Time
AL0060 Station Base and Flood Flow
Table (131) base and flood flow at AL0060 station
The base flow articulate increase because of outflow of al-Sammra sewage treatment plant .
Where the outflow as recorded in 2009 to be 161032 m 3
/ day (54MCM/Y) about 30MCM
pass station AL0060 this plant start at 1988. In figure (13.3) below where the red columns
represent the historical flood flow at station AL0060 and the blue columns represent the base
flow. The figure clarify the increase in base flow since 1988 according to outflow of Sammra
station and its clarify the decrease in flood flow average since last two decades, except the
year 1992 where there unreasonable rainfall and flood flow at that year.
Figure (13.3) Base flow and Flood flow at AL0060 station
The factors that affect the rainfall-runoff relationship in a specific catchment can be divided
into two main categories or characteristics, namely those related to the rainfall and those
related to the watershed. The history of rainfall prior to an event will determine antecedent
conditions and may have a strong influence on runoff production.
The available date for rainfall-runoff events in Amman Zarqa Basin in period from 1950 to
2008 analyzed and derive the runoff coefficient. Analyzing the rainfall data recorded by rain
gauges, it was found that there are eight major rainfall events resulting in floods within the
catchment. All the rainfall that may have contributed to producing runoff is plotted with the
discharges for each storm. It can be seen that there is a quick response of runoff upon the
rainfall. The rainfall intensity and runoff coefficient was calculated in an attempt to establish
a relation between two. The correlation was not found to be very high (R2= 0.123). When
considering all the rainfall, the average runoff coefficient was found to be (3-5) %.
Years
Base Flow (MCM)
Flood Flow (MCM)
Total Flow (MCM)
80-89 41.7 27 68.7
90-99 68.4 28 96.4
2000-2008 64.5 21.2 85.7

Individual Project Report
Climate Change -Mitigation and Adaptation
24(39)
-90
-86
-82
-78
-74
-70
-66
-62
-58
-54
-50
1968 1970 1972 1974 1976 1978 1980 1982 1984 1986 1988 1990 1992 1994 1996 1998 2000 2002 2004 2006 2008 2009
S.W
.L [M
]
DATE
AL1041 : WADI DHULAIL OBSERVATION WELL NO.TW-6AMMAN-ZARQA BASIN
PGE: 272484 PGN : 171392 ALT : 576 m TD: 155 m Aquifer:B2\A7 Type: Recorder
In a second attempt not all of the rainfall or runoff of some of the eight storms was taken into
consideration. Rainfall not producing runoff or runoff without apparent rainfall. The value of
R2 was now found to be 0.6824. The rainfall that has been taken into consideration to develop
the relationship between the runoff coefficient and rainfall intensity is plotted with runoff .
The runoff coefficients for each storm event were calculated based on the rainfall and runoff
considered. The runoff coefficient was not found to be the same for every storm because it
depends upon the antecedent conditions, rainfall intensity, duration of rainfall and distribution
over the basin. Therefore an average runoff coefficient was calculated to be (3- 5) %.
According to above the total Runoff volume seems to be around 26MCM/Yearly in
additional to 50MCM/yearly flooded from Al-SAmmra treatment staion.
14. Infiltration
The previous studies that carried out on Amman Zarqa Basin such as ARD study where it
interested in the eastern part of the basin, extend to the recharge value to be 32 MCM /year.
Whereas the Mahammed in his PHD research that establish in (1996) and cover the Dhulail
area (400km2) as a part of AZB, estimate the recharge to be 58 MCM/year. And he estimate
the yearly drawdown in groundwater level is about 0.5 m as in figure (14.1) below.
Figure (14.1) Drawdown in water level
In 2010 Dar Alhansah carried out 3D modeling that determined the domain area (10000km2)
to be cover Amman zarqa basin and Azraq basin (Zarqa Governorate) in this beta version of
this model the infiltration rate estimated to be within range from 80mm/year in the western-
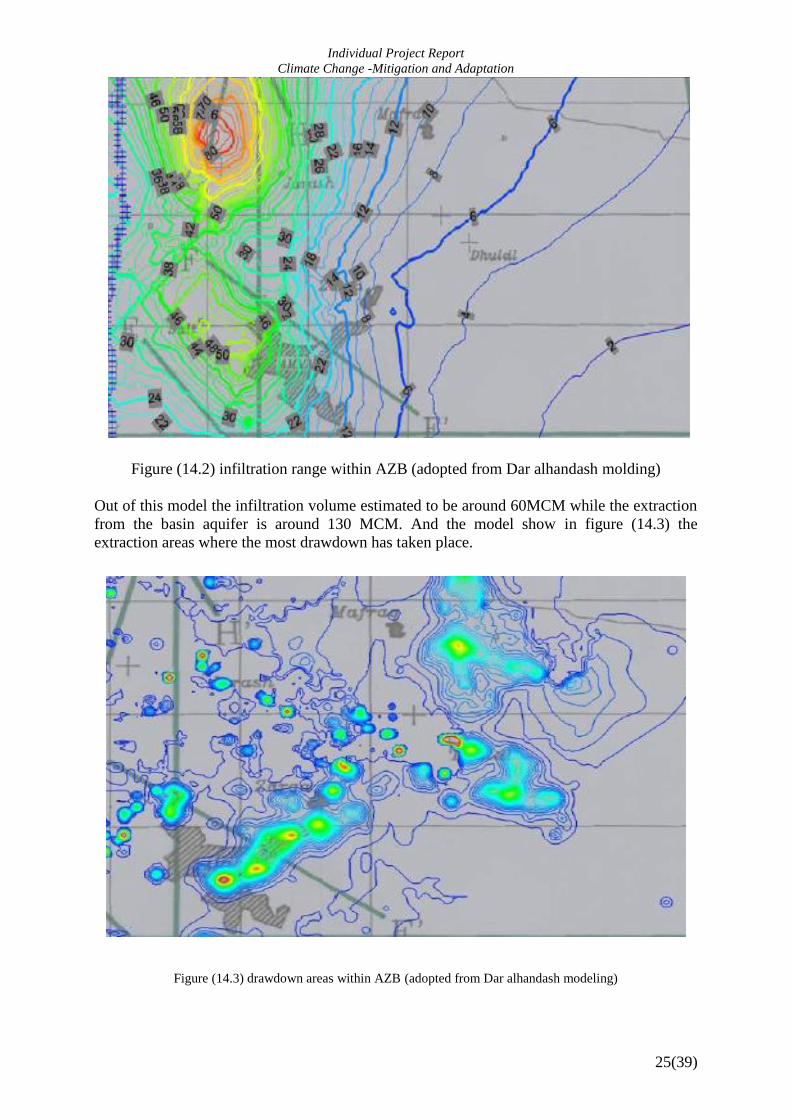
northern part to 4mm/year in the eastern-southern part of the basin as shown in figure (14.2)
Individual Project Report
Climate Change -Mitigation and Adaptation
25(39)
Figure (14.2) infiltration range within AZB (adopted from Dar alhandash molding)
Out of this model the infiltration volume estimated to be around 60MCM while the extraction
from the basin aquifer is around 130 MCM. And the model show in figure (14.3) the
extraction areas where the most drawdown has taken place.
Figure (14.3) drawdown areas within AZB (adopted from Dar alhandash modeling)

Individual Project Report
Climate Change -Mitigation and Adaptation
26(39)
475
480
485
490
495
500
505
510
515
12
-May
-68
12
-May
-70
12
-May
-72
12
-May
-74
12
-May
-76
12
-May
-78
12
-May
-80
12
-May
-82
12
-May
-84
12
-May
-86
12
-May
-88
12
-May
-90
12
-May
-92
12
-May
-94
12
-May
-96
12
-May
-98
12
-May
-00
12
-May
-02
12
-May
-04
12
-May
-06
12
-May
-08
Wat
er
leve
l (m
asl)
AL1041 Zatari well
In this study groundwater level data has been collected and analysis for 77 observation wells
just 43 of them drilled to extract water from B2/A7 others drilled to penetrate the lower
aquifers such as kurop. The effect of this wells depend upon the correlation between the well
and the aquifer whereas found some of this wells drilled throw the aquifer partially and some
of the observation wells drilled for production but because of limited capacity it used for
observation.
Observation wells show that there is yearly drawdown as seen in Zatari well in figure (14.4)
where drawdown equal 22m in 40 years to the amount of 0.55m/year
Figure (14.4) groundwater level in AL1041 zatari well
Most the drawdown concentrated in the Amman Zarqa, Dhulail and Hlabat areas where the
most production wells located. It is difficult to calculate the recharge volume specifically
while the lateral flow that recharge the basin from Jabal Al Arab undefined but it is presumed
around 48 MCM/y (ARD).
Whereas the average annual rainfall in Amman Zarqa basin is 267.9mm out of 58 years
records as in section 11 of this study, and the runoff volume identify to be 26MCM as average
of 28 years gagging as in section 13 of this study additional to 36 MCM became out the basin
according to initial extracting. However the water budget approach has applied to identify the
infiltration volume as following:-
∆S = P-R-I-E (14.1)
Where ∆S = Groundwater Recharge volume m3
P = Precipitation volume m3
R = Runoff volume m3
I = Initial Extraction volume m3
E = Evaporation volume m3

Individual Project Report
Climate Change -Mitigation and Adaptation
27(39)
The total Rainfall over AZB according to 4120km2 as an area and 267.9mm average annual
rainfall equal 1billion cM/y. whereas the evaporation value in the basin around 91%, the net
rainfall volume 87McM/y.
The total rainfall volume divided as following:-
1- Total surface runoff = 28 Million cubic meter (McM)
2- Infiltration to limestone aquifer (B2/A7) = 36 McM
3- Percolated to deep sandstone aquifer ( Kunub) = 12 McM
4- Initial extracting = 12McM
The indirect recharge (lateral flow) that feed AZB = 48McM (ARD).
Summing up the net recharge that feed the AZB (B2/A7) 96 MCM/y while the total
Extracting from the aquifer (B2/A7) reach 130 MCM.
15. Water Quality
Unjust and wrongful groundwater extracting from Amman Zarqa basin generate depletion in
water level as clear in data gathering and this depletion coincide the deterioration in the water
quality where engendering narrowly use.
Salinity Climate Change Effects extra challenge squeeze on the water budget in the basin and
cause intimidation on the water resources. As result of depletion in water level in most of
groundwater observation wells that distributed over all of AZ basin, and outcome the
According to
Based on the collected data from the WAJ central labs, the maximum, minimum and average
values for the Ec, NO3, NH4 and E.coli parameters of the Ruseifa well field are presented in
Table below.
Table ( 15.1) Ec, NO3, E.coli and NH4 Values For the Ruseifa Groundwater Wells
Well
NO.
Date
Period
Ec(s/cm) NO3 (mg/l) E.Coli NH4 (mg/l)
AVG. MIN. MAX AVG. MIN. MAX MIN. MAX MIN. MAX
NR-2 2003-2009 1202 862 1621 56 44.6 68 2 16000 <0.05 3.65
NR-5 2003-2009 1157 902 1461 63.6 51 76.73 <2 24000 NA NA
R-1 2003-2009 1485 1303 1698 46.6 32.08 56.32 2 2 NA NA
R-2A 2003-2009 NA 538 1430 NA 44.5 45.2 700 9000 <0.003 <0.1
R-3 2003-2009 560 549 576 13.4 10.94 15.41 <2 <2 NA NA
R-4 2003-2009 1457 1402 1602 49.2 59 69.3 <2 <2 NA NA
R-5 2003 1004 927 1247 49.5 44.6 67.75 4 16000 NA NA
R-7 2002-2008 NA 1159 1159 NA 57.7 78.35 8 1600 NA NA
R-8 2003-2006 1310 1282 1485 59.4 44.9 69.9 <2 <2 0.05 <0.1
R-9 2005-2007 1226 1105 1285 45.2 36.9 50.7 <2 4 <0.1 0.1
R-10 2003-2009 1053 759 2140 39 18 41 <1 35000 NA NA
R-11 2009 2146 2130 2170 78.1 71.56 85.7 <1.8 2 NA NA
R-17 2003-2009 635 545 948 16.6 6.42 47.1 1 >16000 NA NA
R-18 2003-2009 745 615 1212 14.7 3.75 47.8 <1 35 <0.05 <0.1
Table (15.1) adopted from water authority lab. Report 2010

Individual Project Report
Climate Change -Mitigation and Adaptation
28(39)
Based on the listed data in table-3, the following can be concluded regarding the status of the
Awajan wells water quality.
The average EC values vary from 635s/cm for well R-17 to 2146 s/cm for well R-11
(TDS: 400 mg/l – 1351 mg/l), that is within the Jordan Standards (JS286/2008).
For the Ruseifa field wells, the average NO3 concentration ranges from 13.4 mg/l for well
R-3 to 63.6 mg/l for well NR-5. The maximum recorded NO3 concentration for the
majority of the field wells exceeds the JS286-2008, indicating clear pollution incidences
affecting the water quality of most of the wells.
16. (Artificial Recharge) national adaptation/mitigation plan.
Artificial recharge of ground water may be used for various purposes. In Southern California
it has been operated for about 30 years to replenish the overburden ground water basins, store
reclaimed water, repel seawater intrusion, retard ground subsidence, and increase gas/oil
production. Because of increasing water consumption, potential decrease in allocation of
surface water supplies, declining water levels in many ground water basins, and concern about
water-quality degradation, better management of water resources is highly desirable (Madrid,
1998). There are many methods of artificially increasing ground water supplies but they may
all be classified into direct and indirect methods (Huisman and Olsthoorn, 1983): with indirect
methods an increased recharge is obtained by locating the means for groundwater abstraction
as close as practicable to areas of rejected recharge or natural discharge. With direct methods
water from surface sources is conveyed, sometimes over considerable distances, to suitable
aquifers where it is made to percolate into the body of groundwater.
Direct methods can be divided into surface recharge techniques and subsurface
recharge techniques. In surface recharge, water moves from the land surface to the aquifer by
means of infiltration through the soil. The surface is usually excavated and water is added to
spreading basins, ditches, pits, and shafts and allowed to infiltrate. Generally, surface methods
are dependent on the contact time the water has with the soil. Direct surface methods involve
low construction costs and are easy to operate and maintain, in comparison to other methods.
In spreading basins, water is distributed over the surface of basins excavated in the existing
terrain and is most effective in highly permeable soils. Maintenance of a layer of water over
the soil is necessary. Recharge is most effective when there are no impeding layers between
the land surface and the aquifer. The common problem with recharging using a spreading
basin is that suspended sediment in the recharge water or microbial growth can clog the
surface material (ARWP, 2004). Recharge pits and shafts may be circular, rectangular or
square cross-section and may be backfilled with porous material. Pits and shafts are effective
ways to penetrate the less permeable strata between surface and water table in areas where a
spreading basin may not be effective, in order to access the dewatered aquifer.
A ditch is a long narrow trench with its bottom width less than its depth. The system can be
easily designed to fit the topographic and geologic conditions at a site. Recharge wells are
used to directly recharge water into deep water-bearing zones. One of the more popular
techniques is Aquifer Storage and Recovery, the storage of water in a well during times when
water is available, and recovery of the water from the same well during times when it is
needed. Recharge wells can be used to dispose of treated industrial wastewater, to divert
Individual Project Report
Climate Change -Mitigation and Adaptation
29(39)
excess stream flow, or most commonly, the water injected is potable water treated to drinking
water standards (ARWP, 2004).
Indirect methods include installing groundwater-pumping facilities near connected surface
water bodies to lower groundwater levels and induce infiltration elsewhere in the drainage
basin. Indirect methods include modifying aquifers to enhance groundwater reserves.
Enhanced streambed infiltration is creating a system of wells near a surface water body. One
line of wells is set parallel the bank of a river and a second line of wells are located a short
distance from the river but conjunctive wells are screened in both a shallow confined aquifer
and a deeper artesian aquifer. Water is pumped from the deeper aquifer and if its
potentiometric surface is lowered below the shallow water table, water from the shallow
aquifer drains directly into the deeper aquifer (ARWP, 2004).
In addition to a lower net precipitation rate, rainfall events occur as infrequent, short duration,
high intensity storms that bring a major portion of the annual rainfall to the surface during a
very short period of time. Flash flood events may be a direct result of this type of storm over
an arid or semiarid watershed. Under these conditions, the surface layer is unable to infiltrate
the incident rainfall, resulting in precipitation excess surface flows that propagate rapidly
through the watershed. Even for low intensity rainfall events, the surface crust that develops
on arid watersheds can lead to significant surface runoff (Abu-Awwad and Shatanawi, 1997).
Once on the surface, water in an arid region is subject to a high evaporative demand from the
low humidity and high temperature environment. In many cases, the surface flows never reach
the valley bottom (Lavee et al., 1997).
Water availability in arid regions is both sporadic and highly variable in intensity. Consider a
flash flood in desert setting. The input into the system is extremely small and infrequent,
possibly a thunderstorm of high intensity lasting only a few hours, while its response, a flood
wave propagating over a crusted surface, occurs rapidly and may be of great magnitude. In
order to manage this water resource sustainably (i.e. maintain a constant flux of water into the
system), one must exert some degree of control over the system by altering its response time
and storage capacity. While the precipitation inputs are not alterable, many possibilities exist
in modifying the watershed surface, aquifer properties and storage capacity (Vivoni, 2000).
Retention dams have been widely used in Saudi Arabia, United Arab Emirates and Sultanate
of Oman and, to a lesser extent, also in Syria and Jordan. The dams were built across valleys
with recurrent surface water runoff to recharge aquifers spread on the valley beds (UNEP,
2003).
Hafayer are mechanically-excavated ponds of different shapes (square, rectangular, circular)
and depths. They are usually excavated in low ground along floodwater courses and seasonal
valleys in desert and semi-desert regions. This technology can serve one of two objectives. If
the Hafayer bottom is permeable, it can be used to ensure infiltration of the surface runoff
flow retained in it, to recharge the groundwater in the Hafayer region. In contrast, if the
Hafayer bottom is impermeable, it can be used as a storage tank for drinking water supply,
irrigation or raising livestock. In both cases, Hafayer play a role of surface runoff harvesting
technology, similar to artificial groundwater recharge dams. Hafayer were used for artificial
recharge purposes in Syria and Jordan in the Hammad basin. In addition, recharge pits as the
artificial recharge technique have been used since a few decades. This kind of method can be
seen in Al-Mowaquar valley in Jordan. Similarly the injection well method has been also
applied on a large scale in Qatar, and at a more experimental level in Syria, Jordan and
Kuwait.

Individual Project Report
Climate Change -Mitigation and Adaptation
30(39)
17. Summary of Results
This study carried out to identify the effect of climate change on the water resources in
Amman zarqa basin and clarify the evaluation in weather parameters. Starting with
precipitation distribution this study achieve to the long term average (19950-2008) rainfall
amount is 267.92 mm /y where it was 300 mm/y in the previous studies which means that
there is reducing in the rainfall amount with around 12% in the last decade.
The second result says that the rainfall distribution is retreat toward the spring season. Most
the rainfall in the previous time (50s,60s) was occur in December and January but in the
present time most the rainfall occur in February and March were the day time is increase and
the temperature raise association with increasing of evaporation. Drought circulation in the
region out of comparison between the med of twentieth century and the end of the century the
circulation expanded from three or four years to be come around five to seven years which
intimidate the water resources durability, land cover stability, eco-system and the
environmental stabilization.
In the temperature and the evaporation parameters, this study relay on the researches that
carried out by some of specialist in Jordan who's interested in Amman Zarqa and other areas
in Jordan where they agree each other that the lower limit of the long term average
temperature is increase while the upper limit long term temperature remain at the same edge.
According the limit increase in average temperature in additional to retreated in rainfall
distribution, this study tend to approbate that evaporation ratio in Amman Zarqa basin
increase from 90% to 91%.
The runoff records that take in consideration is cover the period from 1980 to 2009, for
comparison the records was divided for three decadal, out of this study the precipitation in
AZB produce flood flow 28 MCM /y as an average, with take in considering that the base
flow which recorded in the same station Jarash bridge station is include the out flow of the
sewage treatment plant (AL-SAMMRA) where it start in 1989. The runoff volume
formalizes 4.45% from the long term average precipitation. Water budget used to
calculate the infiltration volume wherein found to be around 44MCM/y.
18. Discussion
Climate change phenomena which lead the international environmental scientists,
organizations and economists as well, should take in considering to inure us to initiation the
precautionary actions starting with evaluates the bearable effects on various activities such as
water resources. Whereof this study carried out, to demonstrate the hazards on that menace
water resources in Jordan. The data bank in ministry of water and irrigation of Jordan has
provided this study with all of surface water hydrology and groundwater hydrology data as
well, where this data use to fulfilment the target of this study.
The most atmospheric parameter that definitely change, is the Carbon oxide concentration
witch nonstop raising, causative earth temperature ascent whereof the climate change regard.
However in Jordan out of this study can notice acuteness weather parameters more than
climate change, where this study in precipitation distribution section define 12% reducing in
rainfall in the last decade however the previous studies beckon that the precipitation in Jordan
was reduce with 20 to 40 percentage in fiftieths and sixtieths of the last century, where at that

Individual Project Report
Climate Change -Mitigation and Adaptation
31(39)
time the shortage in rainfall not concert with heat waves. Increase in temperature and reduce
in rainfall will duplicate the effect on water budget, farther more climate change phenomena
around the word gesture to increase in rainfall intensity.
In AZB with 12% reducing in rainfall and rising in evaporation correlated with rainfall
intensity increase going to duplicate the tension on the groundwater budget specifically,
where the effects on surface water going to be less tension. Water harvesting constructions
one of the methods that can against the unbalance situation which going to occur according to
climate change phenomena, where this constructions can restrain some of the flood water or
retard the flood flow to allow to this water to percolate to groundwater budget, and with this
action most of climate change dangers will eliminate in additional to alienation the scarcity
hazards on groundwater quality.
19. Conclusions
According to this study, the climate change phenomena can be classified as witnessing
recording or seems to be phenomena where it is early to fixing the trend in rainfall
distribution. Although precautionary actions should be taken to mitigate depletion in water
level and water quality deterioration in additional to climate change. While the more suitable
action is water harvesting projects which fulfilment against water shortage and climate
variations effects.
Whereas, this study agree the reducing in rainfall about 12% yearly. and seems to otherness
increase decrease in evaporation amount with 1%. In additional to rainfall decreasing the
hotheadedness weather parameters phenomena going to redistribute the percentage between
groundwater and surface water, whereof the infiltration percentage from thunder storms is
very less than infiltration from inert rainfall. So the effect of the climate change going to be
more on groundwater, with take conceding 12% reducing in rainfall should generate 15-20%
shortage in ground water recharge. By anther hand the surface water according to climate
change going to be reduce in absolute amount but going to be in increasing regarding to
rainfall percentage. And this could make stress on surface water hydrological constructions.
Regarding to the above this study deeply recommended to worth the water harvesting and
artificial recharge constructions as a mitigation and adaptation actions to face both of water
resources shortage which has taken place in Jordan and to face the possible effects coming
from climate change. With respect to limit cost of these constructions and the ability to
funded and implemented locally.
20. The way forward
Based on the results of this study, the amman zarqa basin situation is very critical and
precaution actions should taken place to protect the water resources. Artificial Recharge
projects or water harvesting projects could be the suitable solution.
The big dams constriction show that each cubic meter from the dam capacity cost one Jordan
dinar and the each meter that collected from by harvesting project cost one Jordan dinar
either,(madoneh project for water harvesting,2007 , Alwahda Dam construction project,
2009) while the harvesting project can implemented by local employees and by local funding.
So according to the above and by economical value the Water harvesting is much benefit.

Individual Project Report
Climate Change -Mitigation and Adaptation
32(39)
21. Acknowledgements
After praising God
Firstly, I would like to express my deepest thanks and gratitude to the Sweden International
Development Agency (SIDA) for giving me this opportunity to carry out this study and for all
of them assistant to me.
I am thankful and I appreciate the support of Sweden Metrology and Hydrology Institute
(SMHI) and am very thankful all the members of the Institute lecturer and administrators
people.
I am thankful for Dr. Lars Marklund for giving me valuable suggestions and constructive
criticism. I appreciate his sharing of concepts and giving me his valuable time.
I also appreciate the efforts of all of Ministry of Water and Irrigation, Water Authority of
Jordan members for their assistant and constructive suggestions which provided insight and
clarity.
I wish to thank all of my friends and colleagues for their assistance and encouragement.
I am very appreciating all of my colleagues in (MENA) team for the very nice and useful time
that we spend to gather.
Last but not least, I am grateful to my parents, my wife, daughters, sons, brothers and sisters
for their patience and encouragement.
22. List of used definitions and abbreviations
MWI Ministry of Water and Irrigation of Jordan
WAJ Water Authority of Jordan
AZB Amman Zarqa Basin
UFC Uncounted of Cost
B2/A7 The second layer of balqa /the seventh layer of ajloun group
MCM/Y Million Cubic Meter /Year
EC Electrical Conductivity
T Trasmissivity
ARD Associates in Rural Development
H5 Safawy station
MASL Meter Above Sea Level
P Precipitation volume
R Runoff volume
I Initial Extraction volume
E Evaporation volume
AZ Azraq basin
TDS Total dissolves solid

Individual Project Report
Climate Change -Mitigation and Adaptation
33(39)
23. References
1- Abed, A. K. (1982). Geology of Jordan. Al- Nahda Al-Islamiah Library, Amman –
Jordan.
2- Abu- Awwad, A.M. and Shatanawi, M.R. (1997). Water harvesting and infiltration
in arid areas affected by surface: examples from
3- Bender, F., U.S.G.S. (1975). Geology of the Arabian Peninsula, Jordan, Prof Paper
560-I.
4- Chahata M., Livnat A. Thorpe R. (1997). Water Quality Improvement and
Conservation Project, Feasibility Study of Artificial Recharge in Jordan Case of
Wadi Madoneh and Wadi Butum. Amman - Jordan.
5- Dradekah, A. Kh. (2000) Groundwater hydrology, Published by ALBalqa University
support. Amman – Jordan.
6- Dhakal, B. (2007).Devlopment of design criteria for the construction of retention
dams in wadi Madoneh, Jordan, MSC thesis submitted to the UNESCO –IHE,
Delft–Netherlands.
7- Nonner, J. (2007 ),Artificial Recharge ,Internal Research Paper and Lecture Note
. UNESCO-IHE, Delft - Netherlands .
8- Zomorodi, K. (2005), Simplified Solutions For groundwater Mounding Under
Storm water Infiltration facilities, Annual Water Resources Conference , Seattle
Washington . 71Studies and Reports
9- Germany Geological Institute(B.G.R ), ( 1996 ), Model simulations of the
Muwaqqar well field Report ,Amman – Jordan.
10- Japan International Cooperation Agency(JAICA), Ministry of Water and Irrigation –
Jordan, (2001).The Study on Water Resources Management in The Hashemite
Kingdom of Jordan, 11- Final Report Volume 1, Main Report Part-A Water Resources Management
Master Plan .2009 jordan
12- Ministry of Water and Irrigation (MWI), (2007), Data Bank.
13- Project Staff, (1989)Amman Zarqa Basin, Water Resources Study, Draft Final
Report. North Jordan Water Resources
14- United States Development Project UNDP, (1970), The hydrology of the Mesozooic
- Cainozoic Aquifers of the Western Highlands and Plateau of East Jordan,
USA.United States Geological Survey, Application of Borehole Geophysics To
Water-Resources Investigations., Techniques of Water-Resources Investigations ,
Book 2, Chapter E1, 1987 USA.
15- USAID, (1997), Feasibility Study of Artificial Recharge in Jordan Case of Wadi
Madoneh & Wadi Butum, Amman – Jordan .
16- Water Authority of Jordan, (2007), Drilling Data for Madoneh Wells Field files,
Drilling Directorate . Amman-Jordan.
17- Water Authority of Jordan,(2007), Drilling Data for Tamween Wells Field files,
Drilling Directorate ,Amman-Jordan .
18- Water Authority of Jordan,(2007), Drilling Data for Muaqurre Wells Field Files ,
Drilling Directorate ,Amman-Jordan .
19- Water Authority of Jordan,(2007), Drilling Data for Phosphate Wells Field Files ,
Drilling Directorate ,Amman-Jordan .
20- Water Authority of Jordan ,(2007), Pumping Test Analysis for Madonen ,
Tamween, Muaqurre, and Phosphate Wells Field, Drilling Directorate, Amman-
Jordan .

Individual Project Report
Climate Change -Mitigation and Adaptation
34(39)
1981/1982
1986/1987
1988/1989
1992/1993
1999/2000
1994/1995
2000/2001
1983/1984
1984/1985
1998/1999
2001/2002
1990/1991
1991/1992
1996/1997
1997/1998
2002/2003
2003/2004
2007/2008
1985/1986
1989/1990
1995/1996
2004/2005
2005/2006
2008/2009
2006/2007
1979/1980
1980/1981
1987/1988
1993/1994
EL HAWAYAH(AL0604) 53665391626565595964636216064667058495569686266634062176
0
20000
40000
60000
80000
100000
120000
140000
Ye
arl
y S
pri
ng
Dis
ch
arg
e V
olu
me
(m
3)
water_year
Yearly Spring Discharge Volume (m3)
EL …
21- Associates in Rural Development (ARD),Hydrogeological Assessment of the
Amman-Zarqa Groundwater Aquifer Using Groundwater Flow and transport
Model. 2001.
22- Mohammed Abdel Mohdi Al-khatib,Develoment of a groundwater model for the
two upper aquifers (shallow and middle) of the azraq basin, 1999 –jordan
university
23- Jihad Saleh Al-Mahamid,Three Dimensional Numerical Model for Groundwater
flow and contamination transport of Dhuleil- Hallaqbat Aquifer system, 1998
Jordan unevirsity .
24- Ministry of water and irrigation,Jordan'sWater Strategy 2008-2022. 2009 jordan
25- Dar al-Handasah,Feasibility Study and ESIA for Zarqa Governorate Water Wells
Rehabilitation ,Main Report,2010 Jordan.
26-
24. Appendices (if relevant)
Appendix A yearly spring discharge volume
Zarqa and Rusaifah well field

Individual Project Report
Climate Change -Mitigation and Adaptation
35(39)
0
500
1000
1937
1940
1943
1946
1949
1952
1955
1958
1961
1964
1967
1970
1973
1976
1979
1982
1985
1988
1991
1994
1997
2000
2003
2006
Axi
s Ti
tle
Axis Title
jubeiha station rainfall
0100200300400
rain
fall(
mm
)
Axis Title
Sukhna Rainfall Station
0200400
1942
1945
1948
1951
1954
1957
1960
1963
1966
1969
1972
1975
1978
1981
1984
1987
1990
1993
1996
1999
2002
2005
2008
Axi
s Ti
tle
Axis Title
H5 Rainfall Station
0100200300
rain
fall(
mm
)
Axis Title
Qryat Station
050100150200
rain
fall(
MM
)
Axis Title
Azraq Station
Appendix B Rainfall Stations

Individual Project Report
Climate Change -Mitigation and Adaptation
36(39)
0
100
200
300
1937
1940
1943
1946
1949
1952
1955
1958
1961
1964
1967
1970
1973
1981
1984
1987
1990
1993
1996
1999
2002
2005
2008
Axi
s Ti
tle
Axis Title
zarqa station rainfall
0
200
400
600
800
1956
1959
1962
1952
1950
1953
1956
1959
1962
1965
1968
1971
1974
1977
1980
1983
1986
1989
1992
1995
1998
2001
2004
2007
Axi
s Ti
tle
Axis Title
amman hussein college
0
200
400
600
800
1942
1945
1948
1951
1954
1957
1960
1963
1966
1969
1972
1975
1978
1981
1984
1987
1990
1993
1996
1999
2002
2005
2008
Rai
nfa
ll(m
m)
Axis Title
jarash station rainfall

Individual Project Report
Climate Change -Mitigation and Adaptation
37(39)
220 240 260 280 300 320 340
2000s
120
140
160
180
220 240 260 280 300 320 340
70s
120
140
160
180
Appendix C Precipitation Distribution for AZB in seventies of twentieth century
And the last decade

Individual Project Report
Climate Change -Mitigation and Adaptation
38(39)
Appendix D
Geological and hydrogeological classification of the rock units in the central and northern parts of Jordan
ERA PERIOD EPOCH Series Formation Symbol Lithology Hydrogeological
Classification
CE
NO
ZO
IC
Quaternary Holocene Pleistocene
Alluvium
Fuviatile Lacst&Eolian
RC
soil, sand, gravel
tert
iary
Pale
ogene
Eocene
Balqa
W.Shallah
B5
Limestone, chalk, marl
B4/5 Aquifer
Paleocene
Rijam B4 Chert, limestone, chalk, marl
Muwaqar B3 marly limestone
B3 Aquitard
Amman B2
chert, limestone, phosphate
B2/A7 Aquifer
upper
Meastrichtian Campanian Santonian
W.Ghudran B1
chalk, marl, marly limestone
ME
SO
ZO
IC
Cre
taceous
Taronian Cenomanian
Ajloun Wadi Sir A7 Limestone, dolomite, chert
Shuieb A5,6 Limestone, marly limestone
A5/6 Aquitard
Hummar A4 Dolomite, dolomitic limestone
A4 Aquifer
Fuheis
A3
Marl, marly limestone
A3 Aquitard
Naur
A1,2
Limestone, dolomitic limestone
A1/2 A
Low
er
Albian
Kurnub
Subeihi
K2
Sand and shale ,Clay and sandy and Limestone
Kurnub Aquifer
Aptian Neocomian Berriasian
Aarda K1 Sandstone Marl and shale
Jura
ssic
Ma
lm
Tithomian Kimmeridgian Oxfordian

Individual Project Report
Climate Change -Mitigation and Adaptation
39(39)
Appendix E