climate change: 4 lectures the science - today –the climate system –historical records and...
TRANSCRIPT

Climate Change: 4 Lectures
• The Science - Today– The climate system
– Historical records and evidence of climate change
– Direct and indirect greenhouse gases and aerosols
– Key findings 2001
• Emissions Scenarios - 3/22– Climate Models
– Uncertainties
• Potential Impacts and Mitigation Strategies - 3/25
• Case Studies: China & United States of America - 3/27

The Climate System

Schematic view of the components of the global climate system (bold), their processes and interactions (thin arrows) and some aspects that maychange (bold arrows).
Climate Change 2001: The Scientific Basis; IPCC 2001


Distribution of heat and water occurs because of vertical convection currents that stir up air in the troposphere and transport heat and water from one area to another in circular, convection cells.

Global air circulation and biomes The direction of air flow and the ascent and descent of air masses in
these convective cells determine Earth’s general climatic zones.


NRC, Improving the Effectiveness of U.S. Climate Modeling, 2001

Increase in Ambient Air Temperatures
Increase in Sea-surface Temperatures
Decrease inOcean CO2 Uptake
Increase in Atmospheric CO2
Feedbacks in the climate system occur when the output from one component is input into a second component, which then generates an output altering the first component.
Example:
Climate Feedbacks

Historical Records and Evidence for
Climate Change


Direct and Indirect Greenhouse Gases
andAerosols

Data Source: C.D. Keeling and T.P. Whorf, Atmospheric CO2 Concentrations (ppmv) derived from in situ air samples collected at Mauna Loa Observatory, Hawaii, Scripps Institute of Oceanography, August 1998. A. Neftel et al, Historical CO2 Record from the Siple Station Ice Core, Physics Institute, University of Bern, Switzerland, Sept. 1994.
Atmospheric carbon dioxide (CO2) concentrations (1750 to present)
270
280
290
300
310
320
330
340
350
360
370
1750 1800 1850 1900 1950 2000
Mauna Loa (1958-present)
Siple Station (1750-)


Data Source: D.M. Etheridge et al. Concentrations of CH4 from the Law Dome (East Side, "DE08" Site) Ice Core(a), Commonwealth Scientific and Industrial Research Organisation, Aspendale, Victoria, Australia. September 1994. http://cdiac.esd.ornl.gov/ftp/trends/methane/lawdome.259. M.A.K. Khalil, R.A. Rasmussen, and F. Moraes. Journal of Geophysical Research 98:14,753-14,770. 1993. http://cdiac.esd.ornl.gov/ftp/db1007/cmeares.mon
Atmospheric methane (CH4) concentrations
800
900
1000
1100
1200
1300
1400
1500
1600
1700
1800
1840 1890 1940 1990
Law Dome (1841-1978)
Cape Meares (1979-1991)


Global warming potentials (GWPs)
• used to compare the abilities of different greenhouse gases to trap heat in the atmosphere
• based on– the radiative efficiency of each gas relative to that of CO2
• (heat-absorbing ability)
– the decay rate of each gas relative to that of CO2
• (the amount removed from the atmosphere over a given number of years)
• provides a construct for converting emissions of various gases into a common measure
– allows climate analysts to aggregate the radiative impacts of various greenhouse gases into a uniform measure denominated in carbon or CO2 equivalents
Climate Change 2001: The Scientific Basis. Summary for Policymakers; IPCC 2001


Greenhouse gas warming
Methane19%
Other Halocarbons
5%
CFC-126%
Nitrous Oxide6%
Carbon Dioxide
64%
Source: J. T. Houghton et al., eds. Climate Change 1995: The Science of Climate Change, published for the IPCC, in collaboration with WMO and UNEP
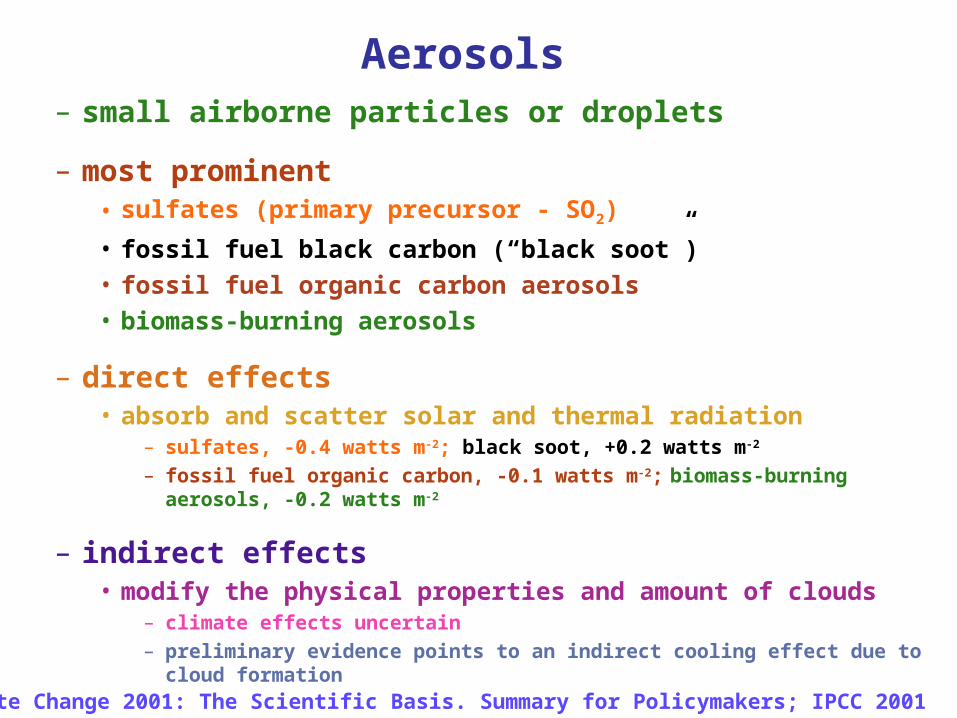
Aerosols– small airborne particles or droplets
– most prominent• sulfates (primary precursor - SO2)
• fossil fuel black carbon (“black soot”)
• fossil fuel organic carbon aerosols
• biomass-burning aerosols
– direct effects• absorb and scatter solar and thermal radiation
– sulfates, -0.4 watts m-2; black soot, +0.2 watts m-2
– fossil fuel organic carbon, -0.1 watts m-2; biomass-burning aerosols, -0.2 watts m-2
– indirect effects• modify the physical properties and amount of clouds
– climate effects uncertain
– preliminary evidence points to an indirect cooling effect due to cloud formation
Climate Change 2001: The Scientific Basis. Summary for Policymakers; IPCC 2001

Indirect greenhouse gases• influence climate indirectly through the formation of O3 and their
effects on the lifetime of CH4
– CO • t ~ 60 days so it competes for hydroxyl radicals --> affects abundance and
lifetime of CH4
– E.g. calculations indicate that 100 metric tons of CO emissions is equivalent to ~ 5 metric tons of CH4 emissions
• oxidation --> O3 formation
– Nitrogen oxides, including NO and NO2 • promote O3 formation• impact (negatively) methane and HFC concentrations in the atmosphere. • deposition of nitrogen oxides - “fertilizing the biosphere”
--> may reduce atmospheric CO2 (ecosystem N-limited)
--> may increase atmospheric CO2 (ecosystem N-saturated or poorly buffered)
– Volatile organic compounds (VOCs) • have some short-lived direct radiative-forcing properties• promote O3 formation • promote organic aerosol production
Climate Change 2001: The Scientific Basis. Summary for Policymakers; IPCC 2001


Key FindingsThird Assessment ReportIntergovernmental Panel
on Climate Change (IPCC 2001)

Key findings, Third Assessment Report International Panel on Climate Change
The global average surface temperature has increased over the 20th century by about 0.6oC.
Temperatures have risen during the past four decades in the lowest 8 kilometers of the atmosphere.
Snow cover and ice extent have decreased.
Global average sea level has risen and ocean heat content has increased.
Concentrations of atmospheric greenhouse gases and their radiative forcing have continued to increase as a result of human activities.
Climate Change 2001: The Scientific Basis. Summary for Policymakers; IPCC 2001

Key findings, Third Assessment Report International Panel on Climate Change, cont’d.
Natural factors have made small contributions to radiative forcing over the past century.
There is new and stronger evidence that most of the warming observed over the past 50 years is attributable to human activities.
Human influences will continue to change atmospheric composition throughout the 21st century.
Global average temperature and sea level are projected to rise under all IPCC SRES scenarios.
Anthropogenic climate change will persist for many centuries.
Climate Change 2001: The Scientific Basis. Summary for Policymakers; IPCC 2001
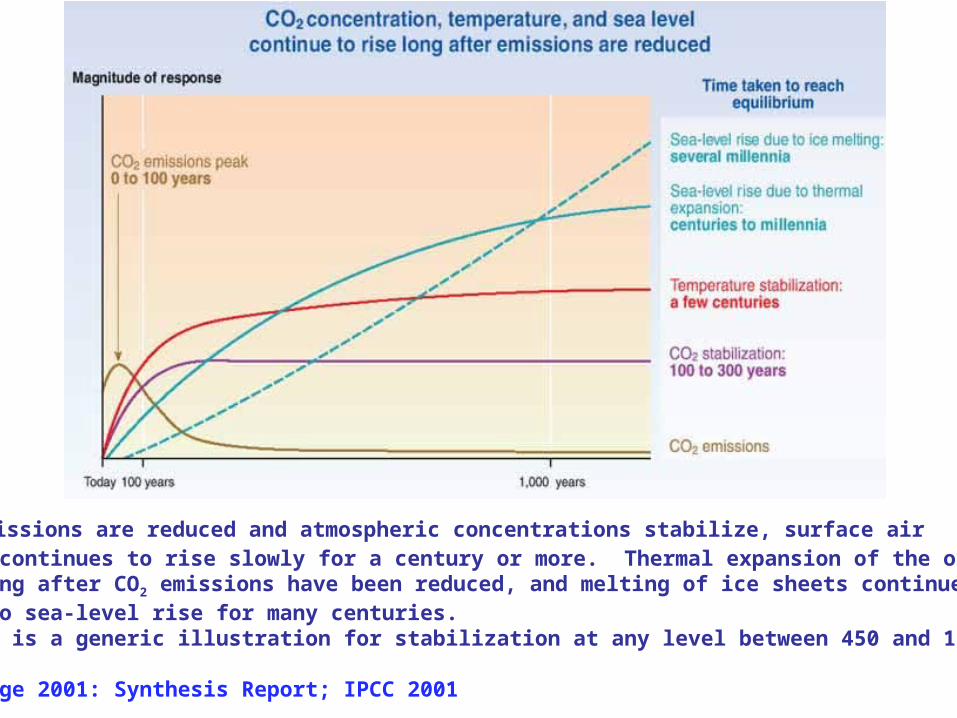
After CO2 emissions are reduced and atmospheric concentrations stabilize, surface air temperature continues to rise slowly for a century or more. Thermal expansion of the ocean continues long after CO2 emissions have been reduced, and melting of ice sheets continues tocontribute to sea-level rise for many centuries. (This figure is a generic illustration for stabilization at any level between 450 and 1,000 ppm.)
Climate Change 2001: Synthesis Report; IPCC 2001

NEXT (3/22 ):Emissions Scenarios
Climate ModelsUncertainties

Use and Climate Impact of SF6
SF6 is used for the safe transmission and distribution of electricity. • high dielectric strength, high VP, arc-quenching abilities, and lack of toxic or
corrosive effects make it an efficient and easy-to-handle electrical insulator
• used in gas-insulated substations, circuit breakers, and other electrical switchgear
SF6 is emitted into the atmosphere during equipment operation, maintenance, and SF6 recycling activities
• fugitive emissions of SF6 can escape from gas-insulated substations and switchgear through seals, especially from older equipment, during equipment installation and when equipment is opened for servicing
SF6 is a powerful greenhouse gas
• GWP: 23,900 times higher than CO2 • atmospheric lifetime: 3,200 years
SF6 Emissions Reduction Partnership for Electric Power Systems Annual Report, 2000