climate action task force final report
TRANSCRIPT
0 | P a g e City of Bellingham Climate Action Task Force Report – December 2019
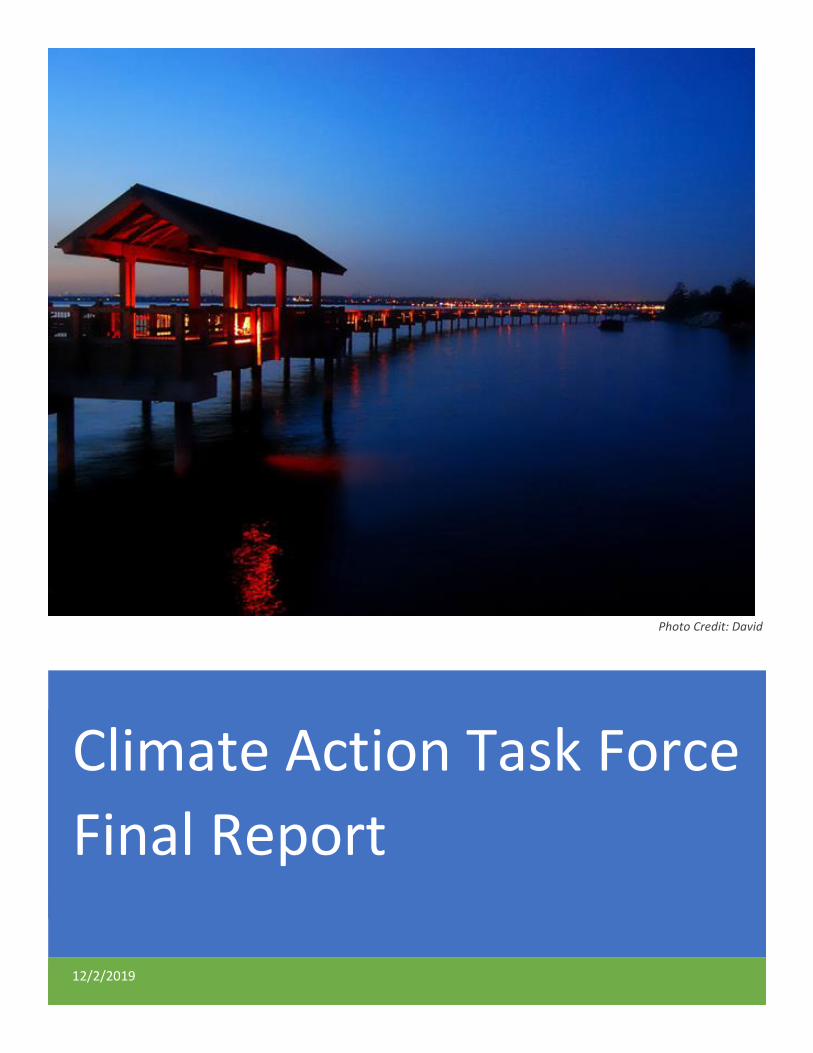
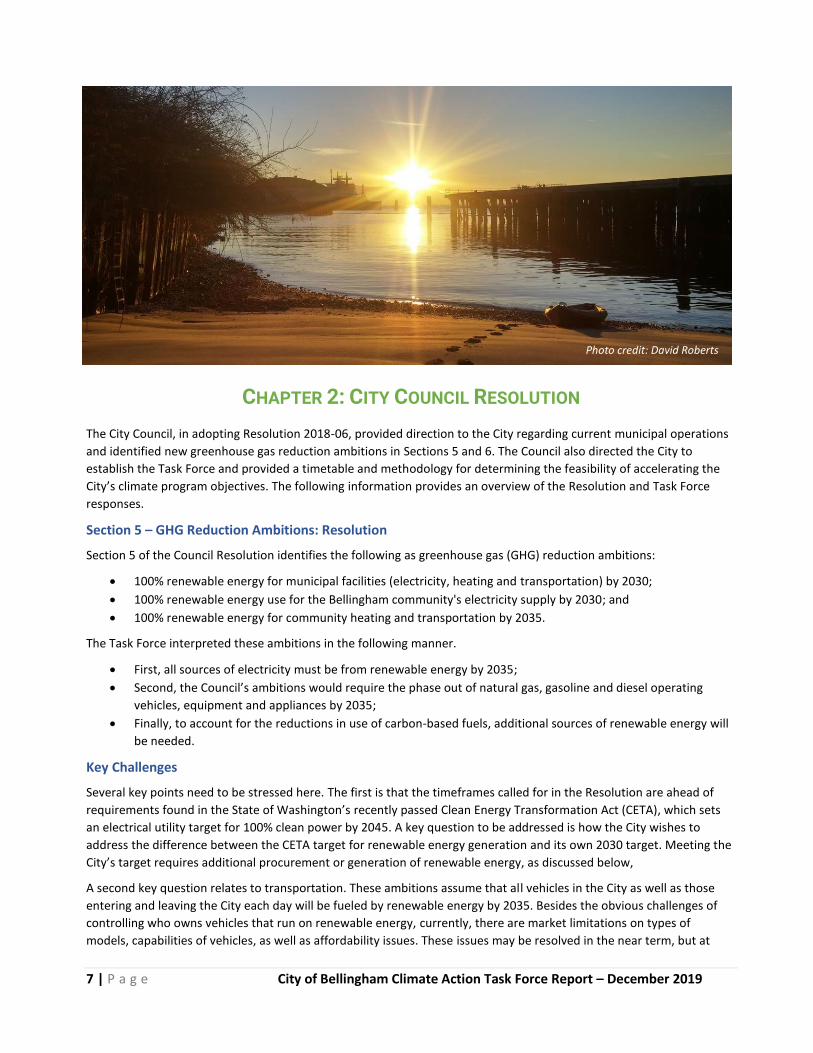
Photo Credit: David Roberts
Climate Action Task Force
Final Report
12/2/2019
1 | P a g e City of Bellingham Climate Action Task Force Report – December 2019
TABLE OF CONTENTS
Chapter 1: Introduction .......................................................................................................................... 4
Chapter 2: City Council Resolution .......................................................................................................... 7
Chapter 3: Bellingham Context ............................................................................................................. 11
Chapter 4: Buildings ............................................................................................................................. 13
BUILDINGS SECTION 1: ENERGY EFFICIENCY UPGRADES ............................................................................. 16
Measure B1: Efficiency Requirements for Owner-Occupied Residences................................................. 16
Measure B2: Rental Efficiency Requirements .......................................................................................... 19
Measure B3: Commercial Efficiency Requirements ................................................................................. 22
BUILDINGS SECTION 2: BUILDING ELECTRIFICATION ................................................................................... 26
Measure B4: Electrify Existing Buildings .................................................................................................. 26
Measure B5: Electrify New Buildings ....................................................................................................... 26
BUILDINGS SECTION 3: RENEWABLE ENERGY .............................................................................................. 32
Measure B6: Provide on-site or participate in the production of renewable energy .............................. 32
BUILDINGS SECTION 4: FINANCE AND TECHNICAL ASSISTANCE .................................................................. 38
Measure B7: Provide technical assistance and design services to support energy upgrades ................. 38
Measure B8: Create a Bellingham Clean Energy Fund ............................................................................. 39
Measure B9: Identify and promote other financing sources and mechanisms ....................................... 40
Chapter 5: Transportation .................................................................................................................... 43
SECTION 1: TRANSITION TO USING ELECTRICITY AS A FUEL FOR MOST TRANSPORTATION ....................... 46
Measure T1: Ban the operation of internal combustion engine (ICE) passenger vehicles within the Bellingham City limits by 2035 ................................................................................................................. 47
Measure T2: Encourage a statewide ban on the sale of internal combustion engine (ICE) vehicles by 2030—in concert with a coalition of other local governments in Washington State .............................. 49
Measure T3: Impose a moratorium on the approval of applications for new gas station uses .............. 50
Measure T4: Ordinance mandating that all local public transportation vehicles, both publicly and privately owned, in operation in the City of Bellingham be fully electric by 2035 .................................. 51
Measure T5: Electric Vehicle and E-Bike Group Buy Program ................................................................. 52
Measure T6: Enhance requirements for New Construction to Include Electric Vehicle Supply Equipment/Conduit in Parking Areas ....................................................................................................... 54
Measure T7: Provide Incentives for adding EV charging stations to Existing Multifamily Complex Parking Areas ............................................................................................................................................ 54
Measure T8: TNC Electrification Program and TNC Charging Stations .................................................... 55
SECTION 2: RECOMMIT TO THE CITY’S MODE SHIFT GOALS AND REIMAGINE HOW TO ACHIEVE THOSE GOALS ........................................................................................................................................................... 56
Measure T9: Fast-Track the Update of the Bike Master Plan with a Focus on Completing the Network by 2030 ..................................................................................................................................................... 57

2 | P a g e City of Bellingham Climate Action Task Force Report – December 2019
Measure T10: Prioritize Physical Bike Lane Separation ........................................................................... 57
Measure T11: More Funding for Education and Encouragement Programs Related to Active Transportation .......................................................................................................................................... 58
Measure T12: School Crossing Guard Program ........................................................................................ 59
SECTION 3: REFORM PARKING POLICIES ...................................................................................................... 61
Measure T13: Change Parking Minimums to Parking Maximums for New Development ...................... 61
Measure T14: Ordinance Requiring Unbundled Parking in all Rental Housing ........................................ 62
Measure T15: Residential Overnight Parking Permits.............................................................................. 62
Measure T16: Increase the Cost of Hourly Metered Parking and Increase Parking Ticket Fees.............. 63
Measure T17: City Employee Parking Fee ................................................................................................ 64
Measure T18: Free Parking for Electric Vehicles ...................................................................................... 64
SECTION 4: IMPLEMENTATION AND FUNDING FOR RECOMMENDATIONS ................................................. 65
Measure T19: Fundraising Effort .............................................................................................................. 65
Measure T20: Extend the Transportation Benefit District (TBD) and Dedicate a Portion of Future Funds to Implement the Approved Measures .................................................................................................... 65
Measure T21: Whatcom County Greenhouse Gas Reduction Hub .......................................................... 65
Chapter 6: Land Use ............................................................................................................................. 66
Measure L1: Maximize Urban Village (UV) Zones .................................................................................... 68
Measure L2: Increase Density in Transition/Residential Multi-Family (a.k.a. Missing Middle) Zones..... 69
Measure L3: Pilot “Pavement-to-Plazas” and “Living Streets” ................................................................ 71
Chapter 7: Energy Supply ...................................................................................................................... 73
SECTION 1: RENEWABLE ENERGY ................................................................................................................. 77
Measure E1: City and PSE Evaluate Community-Wide Green Direct ....................................................... 77
Measure E2: When Available, COB Subscribes to Green Direct Phase 3 with PSE .................................. 77
Measure E3: City Supports PSE Green Power Program for Residents and Businesses ............................ 78
Measure E4: City Assesses Community Solar Alongside Other Public Organizations - (e.g. School District and Port of Bellingham) ............................................................................................................................ 79
Measure E5: City Provides Community with Outreach and Education on the Benefits of Solar Installations .............................................................................................................................................. 79
Measure E6: Explore City-Owned Renewable Energy Generation for Municipal and Community Use .. 80
SECTION 2: EMERGING TECHNOLOGIES ....................................................................................................... 81
Measure E7: City Evaluates Future Energy Projects that Could Include Microgrids, Distributed Energy Resources (DER), and Demand Response (DR) ........................................................................................ 81
Measure E8: COB Supports PSE Adding Battery Storage as a Peaking Resource ..................................... 82
Measure E9: Evaluate Mount Baker/Tri-Cities Area Geothermal Potential............................................. 84
SECTION 3: POLICY INITIATIVES .................................................................................................................... 85
3 | P a g e City of Bellingham Climate Action Task Force Report – December 2019
Measure E10: City Revises Building Code Requirements for Rooftop Solar Installations on Commercial and Residential Buildings ......................................................................................................................... 85
Measure E11: Convene Discussion of Fire Access Pathway Requirements for Rooftop Solar ................. 85
Measure E12: City Resolution to Support Virtual Net Energy Metering for Community Solar Projects . 86
Measure E13: City Resolution to Support Property Assessed Clean Energy (PACE) Financing ................ 87
Measure E14: Evaluate Need for Increased Development of High Voltage Transmission ...................... 88
Measure E15: Conduct a Feasibility Study for City Municipal Utility District (MUD) with Mandate to Procure 100% Renewable Energy............................................................................................................. 88
Measure E16: Investigate alternative approaches of renewable energy to provide heating including ground, air and water-sourced heat pumps ............................................................................................ 91
Measure E17: Reduce or Eliminate Emissions from Large Industrial Consumers of Natural Gas ............ 92
SECTION 4: ENERGY DEMAND FROM ELECTRIFICATION .............................................................................. 94
Chapter 8: Summary of Recommendations ........................................................................................... 97
SECTION 1: METHODS: THE MARGINAL ABATEMENT COST (MAC) ........................................................... 100
SECTION 2: RESULTS ................................................................................................................................... 100
SECTION 3: DISCUSSION ............................................................................................................................. 102
SECTION 4: PROJECTING CO2e REDUCTIONS .............................................................................................. 106
Chapter 9: Conclusions ....................................................................................................................... 107
Appendix 1: Combined List of Measures .............................................................................................. 108
Appendix 2: Acronyms and Definitions ................................................................................................ 112
Appendix 3: Calculating Cost of Emissions Abatement ......................................................................... 118
Appendix 4: Climate Action Task Force Membership ........................................................................... 120
Appendix 5: References ...................................................................................................................... 121
4 | P a g e City of Bellingham Climate Action Task Force Report – December 2019
CHAPTER 1: INTRODUCTION
Cities around the country are taking bold steps to reduce their carbon footprint and to contribute in meaningful ways to
the future of the planet. Similar cities in size to Bellingham that are planning for climate change include Spokane,
Washington; Bend, Oregon; Boulder, Colorado; Burlington, Vermont; and Boise, Idaho.
The City of Bellingham has shown leadership and commitment to addressing climate change since 2005 when the City
joined the Cities for Climate Protection initiative. Since that time the City has implemented a number of actions that
have addressed the six strategies of the City’s Climate Protection Action Plan (CPAP), first adopted in 2007 and updated
in 2018.
The 2018 Climate Protection Action Plan identified many additional actions the City could take to incrementally mitigate
carbon dioxide (CO2) production over a 30-year period. The actions and time frame identified in the plan were
consistent with planning efforts by many municipalities around the world.
However, during the planning period, new information from the Intergovernmental Panel on Climate Change (IPCC)
made the case that concrete action was needed on a much shorter timeline. Community members petitioned the City
Council to review the newly adopted plan and to consider how the actions could be achieved over a timeline
commensurate with the international scientific consensus. Furthermore, there were questions regarding the adequacy
of those actions given the need for deeper reductions in CO2.
The Council agreed with these concerns and passed Resolution 2018-06 which proposed more ambitious targets for
reducing CO2 production and achieving 100% renewable energy in the City and community. It also called for the
formation of a Climate Action Plan Task Force (Task Force) made up of people from the community (See Resolution on
page 7).
Task Force Creation and Selection Process
City staff worked with the Mayor’s office to identify people from the community who met the Council criteria.
Announcements were advertised on the internet and contacts were made in the community to identify likely
candidates. Nine Task Force members were selected by the Mayor and approved by the City Council Members with
specific expertise in issues of transportation, buildings, energy supply, energy efficiency, land use, and carbon
emissions. Some members have experience with more than one of the climate mitigation issues.
The Task Force was supported by employees of the City Council and from the Public Works Department, and three City
staff members participated in the Task Force as non-voting members. The City also hired Kulshan Services to help plan
the process, facilitate the Task Force meetings and provide technical assistance.
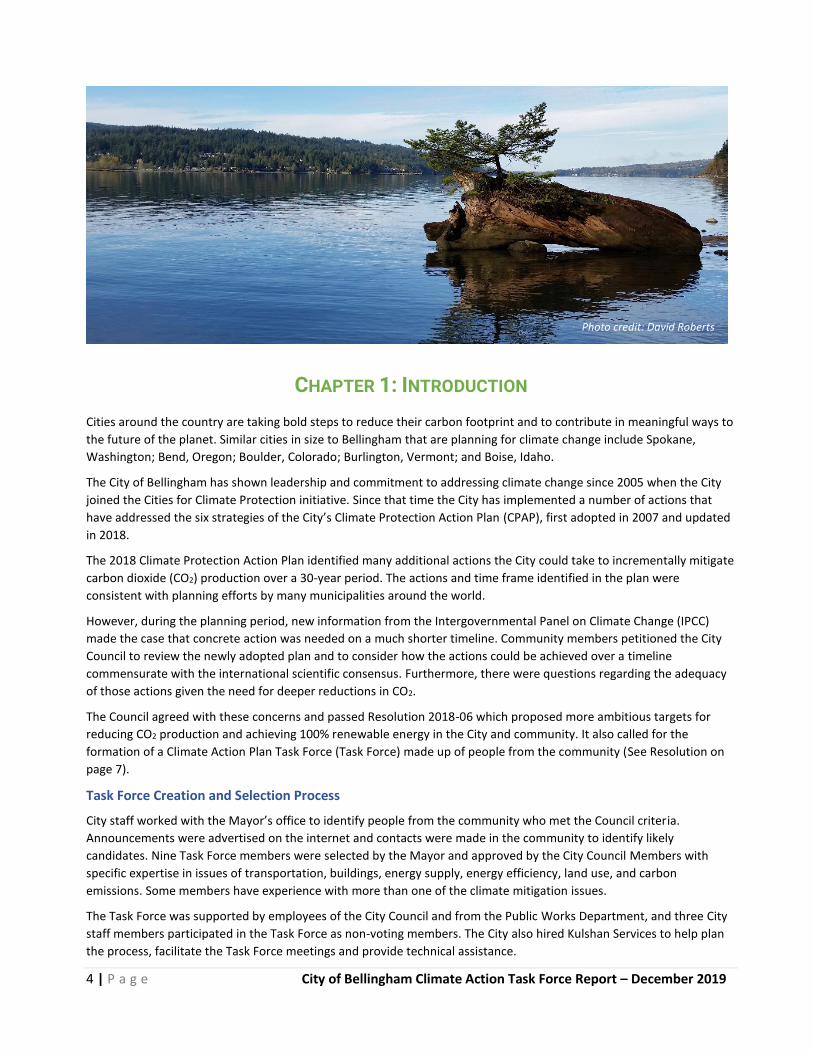
Photo credit: David Roberts

5 | P a g e City of Bellingham Climate Action Task Force Report – December 2019
Task Force Timeline
The resolution called for a report from the Task Force by the final quarter of 2019. In response, staff scheduled monthly
meetings of the Task Force starting in September of 2018 and ending in November 2019. A total of 16 meetings lasting
from two to two-and-a half hours were held over 15 months.
Initial meetings were focused on familiarization with Bellingham’s 2018 Climate Protection Action Plan, clarifying the
expectations in the Resolution, and establishing processes and expectations for the group. As a part of this effort, a
framework was developed for evaluating proposed measures (i.e. actions) using a “triple bottom line plus technology”
(TBL+) analysis as called for in the Resolution. Criteria for the TBL+ included social acceptability, environmental benefit,
cost, and the availability of technology. Several iterations of discussion finally led to an acceptable tool. However, use of
that tool required development of significant amounts of data related to proposed measures, only some of which was
available in the time frame available to the Task Force. As such, the TBL+ analysis should be considered to be an initial
identification and analysis of many issues brought forth by various measures. This framework can be used to support
additional analysis going forward as these measures are considered by the City Council.
Task Force Work Groups Formed
Starting in the Spring of 2019, the Task Force formed work groups to investigate the proposed measures more
thoroughly and to evaluate options for improving and accelerating implementation of the proposed actions using the
TBL+. Three work groups were formed:
• Buildings
• Transportation and Land Use
• Energy Supply
Each work group was chaired by two members of the Task Force and included knowledgeable experts from utilities, the
community, and around the State. The Energy Supply Work Group was composed of all members of the Task Force.
Each work group was asked to propose measures that would be most effective in achieving carbon reductions, drawn
from the 2018 Climate Protection Action Plan as well as from programs in operation in other cities. A TBL+ assessment
was completed for each measure. In addition to the TBL+ assessment of impacts calculations of cost, energy savings,
and CO2 reductions were also conducted whenever possible. These assessments and calculations established in the
resolution informed the conclusion of the overall feasibility of meeting the ambitions within the timeframe set by the
Resolution.
To help assemble and standardize the information assembled, a template was provided to each work group to guide
their information gathering and ensure consistent analysis of the measures. This template required the work groups to
identify key opportunities and challenges for each measure as derived from the TBL+ approach.
Work groups met outside of the scheduled Task Force meetings on numerous occasions through October of 2019.
Hundreds of hours of volunteer time have been contributed to this effort by the Task Force members and other
specialists to generate and analyze the recommendations that are found in Chapters 4, 5, 6 and 7.

6 | P a g e City of Bellingham Climate Action Task Force Report – December 2019
Public Input Process
Although this was a technical advisory group formed to provide specific recommendations to the City Council, the Task Force created a number of avenues to receive public input, including a form on the City web site to take written comments, and a public comment period held at the end of each Task Force meeting. A Task Force web page was created and presentations, videos, and other materials from the meetings were posted regularly. Meeting summaries and compilations of comments received were also posted regularly.
The Task Force heard a series of presentations from local or regional experts to provide information on certain technical aspects of energy and decarbonization. Some of these presentations included discussion of promising programs or activities that could help Bellingham achieve its goals. Conversely, some presentations identified measures that would be not effective locally – such as the use of very small wind turbines. Many of these presentations to the Task Force were televised on the BTV cable channels.
A Summary of The Measures
A summary of all the measures is found in Chapter 8. The measures have been organized in order of the projected impact they will have on renewable energy generation and CO2 reduction. Reductions in CO2 and marginal cost per ton of CO2 removed is also noted.
While the Task Force was challenged to set priorities, the Task Force recommends that the City Council weigh the implementation challenges against potential CO2 reduction, or total renewable energy generated, as a primary factor in deciding which measures to prioritize for the near term.
Chapter 8 is included to address the extent to which this report achieves the aspirational goals and directives of the City Council Resolution. Specifically, this chapter, to the best of our current ability, shows the degree to which the assembled measures and assumed implementation timelines will meet the objectives of 100% renewable energy and significant reductions in CO2 by 2035.
Decisions for the Future
Finally, the Task Force recognizes that all of the measures recommended will require additional analysis and scrutiny by policy makers and the public before they can be implemented. Given the time available for this effort and the volunteer nature of the Task Force, there were limits to the depth of analysis that could be completed. There will be many questions, particularly of a policy, cost and social nature. However, the foundation of the recommendations in this report is based on sound science and recommendations were based on examples derived from other communities around the world.
While many of these recommendations will initially appear as obstacles, the Task Force urges the community and its leaders to consider the opportunities associated with these changes – especially in terms of quality of life, public health, and costs of living. There are many opportunities for co-benefits if our community acts now. These changes may become imperatives and finally necessities if our community ponders the future too long.
7 | P a g e City of Bellingham Climate Action Task Force Report – December 2019
CHAPTER 2: CITY COUNCIL RESOLUTION
The City Council, in adopting Resolution 2018-06, provided direction to the City regarding current municipal operations
and identified new greenhouse gas reduction ambitions in Sections 5 and 6. The Council also directed the City to
establish the Task Force and provided a timetable and methodology for determining the feasibility of accelerating the
City’s climate program objectives. The following information provides an overview of the Resolution and Task Force
responses.
Section 5 – GHG Reduction Ambitions: Resolution
Section 5 of the Council Resolution identifies the following as greenhouse gas (GHG) reduction ambitions:
• 100% renewable energy for municipal facilities (electricity, heating and transportation) by 2030;
• 100% renewable energy use for the Bellingham community's electricity supply by 2030; and
• 100% renewable energy for community heating and transportation by 2035.
The Task Force interpreted these ambitions in the following manner.
• First, all sources of electricity must be from renewable energy by 2035;
• Second, the Council’s ambitions would require the phase out of natural gas, gasoline and diesel operating
vehicles, equipment and appliances by 2035;
• Finally, to account for the reductions in use of carbon-based fuels, additional sources of renewable energy will
be needed.
Key Challenges
Several key points need to be stressed here. The first is that the timeframes called for in the Resolution are ahead of
requirements found in the State of Washington’s recently passed Clean Energy Transformation Act (CETA), which sets
an electrical utility target for 100% clean power by 2045. A key question to be addressed is how the City wishes to
address the difference between the CETA target for renewable energy generation and its own 2030 target. Meeting the
City’s target requires additional procurement or generation of renewable energy, as discussed below,
A second key question relates to transportation. These ambitions assume that all vehicles in the City as well as those
entering and leaving the City each day will be fueled by renewable energy by 2035. Besides the obvious challenges of
controlling who owns vehicles that run on renewable energy, currently, there are market limitations on types of
models, capabilities of vehicles, as well as affordability issues. These issues may be resolved in the near term, but at
Photo credit: David Roberts
8 | P a g e City of Bellingham Climate Action Task Force Report – December 2019
present, they are a barrier. There would also be challenges controlling vehicles entering the City, and it may not be
legal or practical to do so. The report discusses phase-in options that may be appropriate given these constraints.
A third question is related to buildings. Many buildings would require electrification and energy-efficiency retrofits.
While many households will see cost savings in the long-term, current affordability issues for rental and for-sale
housing in Bellingham create substantial challenges. Without generous incentives and new approaches to long-term
financing, these efforts could raise the cost of housing. Consequently, the Task Force has identified several measures
that will mitigate or eliminate affordability issues arising from the proposed buildings measures.
The Task Force concludes that these ambitions are going to be very challenging to implement in the timeframe stated
for the reasons noted above. The speed of environmental change cannot be predicted. Advances in technology, or
modifications in national or state policy will stimulate, or perhaps necessitate change. However, with the current level
of knowledge, financial tools, and legal mechanisms, the Task Force believes it is possible to make substantial gains
toward achieving these ambitions.
Section 6 – Task Force Directives: Resolution
Section 6 of the Council Resolution provided the Task Force the following directives on how to conduct their analysis:
• Adopt a triple bottom line plus technology philosophy;
• Determine feasibility, costs and impacts of the 100% renewable energy ambitions;
• Develop 100% renewable energy targets;
• Identify funding mechanisms and develop a plan to achieve the Task Force's recommended 100% renewable targets;
• Develop accelerated greenhouse gas emissions targets for the City Council to consider for adoption;
• Identify policy considerations to attain accelerated targets;
• Deliver a final report on findings to City Council by the 4th Quarter of 2019.
In answer to these directives, the Task Force used a template to ensure that each of these directives was addressed.
The template included the TBL+ criteria to identify key opportunities and challenges to achieving the renewable energy
and CO2 reduction goals. In addition, each measure having a direct carbon reduction was assessed in terms of its
relative marginal cost based on a measure of cost per ton of CO2 removed. The analysis also determined the total
carbon abated for each measure.
Funding Mechanisms and Policy Considerations
As part of the work group discussions, funding mechanisms and policy considerations were researched and noted in the
report. Since the recommendations vary in level of detail, it was not possible to specifically quantify all the financial
resources needed to fully implement these measures. The recommendations at the end of the report suggest a path
forward for City decision makers. Finally, the ICLEI ClearPath program was used to predict the overall reductions in
GHGs associated with the cumulative implementation of the measures as proposed in Chapters 4, 5, 6, and 7 of this
report.
How the City will meet its Renewable Energy Goal
A missing factor in our analysis is identification of the specific set of options that would be required for the City to meet
its goal for 100% renewable energy by 2035. A number of measures have been proposed in Chapter 7 of this report
that if implemented would address the shortfall between the City’s ambitions and the Clean Energy Transformation Act
(CETA). These will require substantial analysis and exploration with local utilities or other organizations to identify the
most promising options. At this time, utilities are developing plans on how they will accomplish their obligations under
CETA, and this planning may also affect what options are available at the municipal level.
The Task Force believes that their cumulative knowledge, supplemented with the input from industry experts,
addresses the initial feasibility of the ambitions and goals outlined in the Resolution and outlines what is achievable by
the City between now and 2035. Additional analysis of most measures will certainly be required. The Task Force

9 | P a g e City of Bellingham Climate Action Task Force Report – December 2019
believes that most if not all the technology needed to meet the ambitions exists today. This is primarily a factor of
implementation.
The speed of change will be dictated by social concerns, market factors, and by the community’s sense of urgency. At
this time, some measures will be expensive or difficult to implement. These concerns may abate as incentives are
realized, costs are reduced, or conditions locally or around the world change.
Systemic Issues Impeding Climate Action Success
The Task Force recognizes that there are systemic economic forces that will hinder the City’s ability to meet the
2030/2035 carbon reduction ambitions but were beyond the mandate of the Task Force to address. In short, the
economy is dependent on continual growth, competition and a short-term outlook.
This results in:
• Ever-increasing consumption of goods and services, which take increased energy to harvest raw materials,
manufacture and transport. Many aspects of this supply chain have no ability to electrify in the near future.
Therefore, increasing consumption must include an ongoing carbon footprint and ever-increasing means of
generating electricity.
• An economy driven by competition. Competition in the economy can be a good thing, driving more efficient
manufacturing processes for example. But it can also be a negative when the competitive drive results in
denial of climate change facts, creates inertia for fear of losing business to other cities/nations, or is used to
justify the deliberate use of misinformation intended to derail needed action. It is cooperation at all levels of
our local, national and global community that is needed to address this issue.
• An economic system is by and large is not concerned with what the global climate will be in the future. Its focus
is on making money for shareholders this quarter, this year. That may be fine except that climate change is a
long-term issue and needs to be addressed economically and politically with a long-term vision.
The bottom line is that climate change is the result of our current economic, industrial, and political systems. It is an
open question as to whether these systems can reform themselves in time to avoid the worst consequences for our
community and so many others. Nonetheless, our community must try.
The Task Force recommends that the City openly and publicly discuss this issue and consider ways of addressing these
inherent roadblocks.
10 | P a g e City of Bellingham Climate Action Task Force Report – December 2019
Behavior Change and Energy Conservation
The Task Force recommendations proposed in this report primarily entail technological or infrastructure changes – from electrifying buildings to updating transportation infrastructure to generating more energy from renewable sources. At the same time, the Task Force recognizes that human behavior plays a critical role in creating a more energy-efficient city and meeting climate goals.
Insofar as social norms and values influence people’s behavior around energy consumption, the City of Bellingham ought to consider ways it can promote energy-conserving behaviors. This would both support the measures proposed in this report and help spread values of reducing waste and unnecessary consumption.
Local government action may include:
• Celebrating the efforts of Bellingham residents and businesses to reduce energy use, with city leaders and other trusted voices conveying information;
• Providing targeted rewards or incentives to increase commitment to energy-conserving actions;
• Highlighting, in a very visible way, the scale and impacts of Bellingham’s energy use, beginning with City operations;
• Encouraging energy conservation and climate education in Bellingham schools.
Concluding Comments
The Task Force believes that our community contribution to the climate crisis is significant and action now will provide
options in the future as our community addresses the known and unknown impacts. These impacts cannot be
discounted and must be addressed in a bold and aggressive manner. Innovative and successful measures adopted by
the City of Bellingham and the community could also inspire similar action elsewhere.
11 | P a g e City of Bellingham Climate Action Task Force Report – December 2019
CHAPTER 3: BELLINGHAM CONTEXT
Before presenting the results of the Task Force efforts, it is helpful to consider the current characteristics of the City of Bellingham. Existing conditions both help and hinder the achievement of climate action goals.
Population Data
• According to the Census Bureau, the City’s estimated population in July 2018 is 90,665, compared to 81,252 in April 2010 – an 11.6% increase.
• According to the 2017 American Community Survey (US Census.gov), 17.4% of the population represent a variety of ethnic groups.
• The Census Bureau in 2018 shows the average age of the 98225-zip code was 28.8 years old and in 98226- zip code was 36.2 years old. Citywide, those under 18 years old was 15.8%,18-64 age group was 69.4%, and the over 65 age group was 14.2%. Median age is about 31 years old.
• Approximately 15,060 students attend WWU, 11,000 attend Whatcom Community College, and 2,392 attend Bellingham Technical College. Most of these students live in Bellingham.
Geography Data
• According to ZipAtlas, the City has an area of 27.08 square miles (17,344 acres) with a density of 3,153 people per square mile. There approximately 35,300 households in Bellingham. Approximately 45% of homes are owner-occupied. Housing density is 1591 houses/condos per square mile.
• The Bellingham Parks, Recreation and Open Space Plan (2016) outlines the parks, trail systems, and open spaces that provide access to nature. Some of the trails also contribute to our transportation system. These highly valued facilities make up approximately 19.6% of the City’s land area.
Housing Data
• City-Data shows mean housing prices in 2016: all housing units: $411,089; detached houses: $434,442; townhouses or other attached units: $405,168; in 2-unit structures: $340,225; in 3-to-4-unit structures: $398,223; in 5-or-more-unit structures: $411,349; mobile homes: $85,507.
• According to Realtor.com – a resource for local and up-to-date data – the 2019 the median home sold price for Bellingham was just under $440,000.
Economy Data
• DataUSA provides data from which to calculate stats for cities. The average income of Bellingham residents is $47,886/year. Currently, 21.6% of the population lives at or below the poverty line.
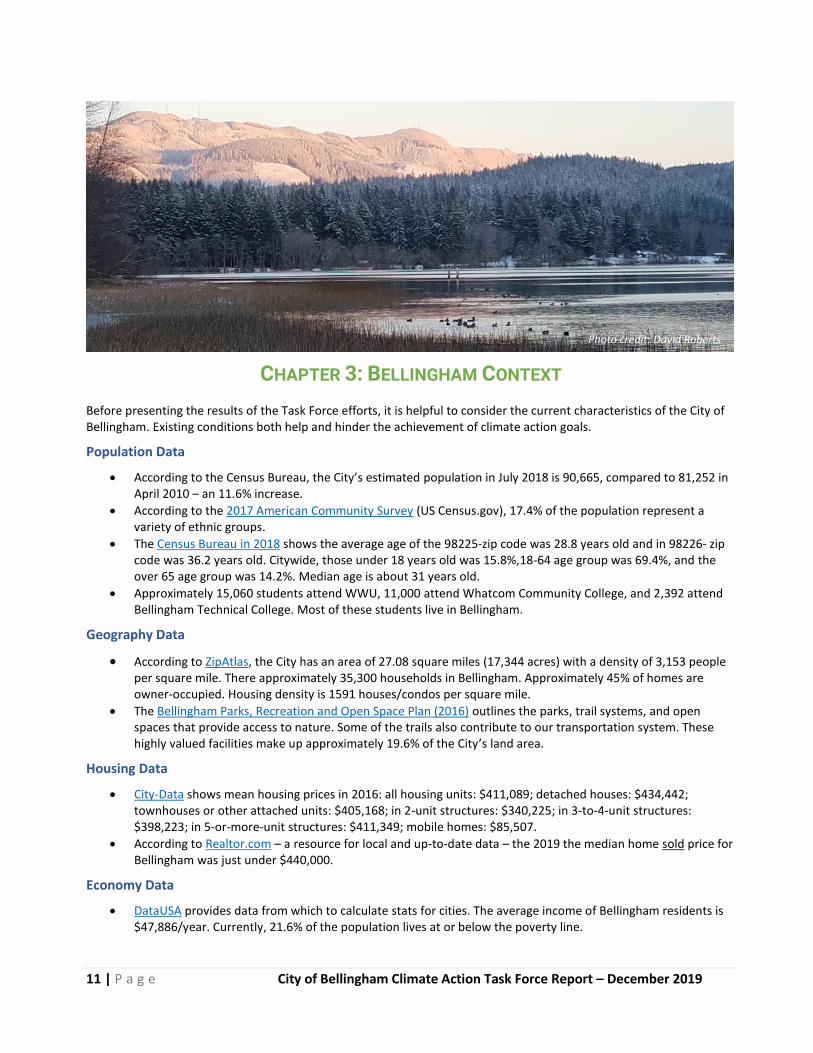
Photo credit: David Roberts
12 | P a g e City of Bellingham Climate Action Task Force Report – December 2019
• According to City-Data.com, Bellingham’s Cost of Living Index was 102.3 compared to the US at 100. Estimated median household income for Bellingham in 2016 was $47,652 compared to Washington State at $67,106.
• A little more than 5% of workers work from their home. The average Bellingham commuter take 16 minutes to
get to work. (calculated percentages using DataUSA)
Transportation Data
• Bellingham has approximately 70,600 registered vehicles. The average household has 2.13 cars. In 2017, the most common method of travel for workers in Bellingham was to drive alone (68%), while 8.79% carpooled, 8.05% walked, 5% took transit and 3.3% bicycled. (calculated percentages using DataUSA)
• Streets, parking and other vehicle-oriented facilities take up approximately 3,398 acres or about 19% of total City’s incorporated land area. (data from Chris Behee, City of Bellingham, GIS Analyst)
Energy Data
• Bellingham’s energy is supplied from two primary sources: Puget Sound Energy (PSE) and Cascade Natural (CNG).
• The City currently purchases all electrical energy for municipal operations from PSE under a Green Direct agreement so that all energy is classified as from renewable sources.
• In addition to the utilities, approximately 1,300 homes and businesses have solar generation capacity on their site or rooftop, representing 8.5 MW of electricity.
Bellingham is an amazing place to live with many natural and built environment attributes as well as a vibrant sense of community and active support for the diversity of city residents. The community has a history of responding to the challenges of our changing world.
City government has responded to the climate crisis by purchasing 100% renewable energy, beginning the transition of the City fleet to non-fossil fuel vehicles, implementing comprehensive multi-modal transportation infrastructure improvements, undertaking energy efficiency improvements to municipal buildings, adopting solar friendly building codes and initiating other municipal and community actions.
Community partners working with the support of the City and on their own have also responded to the challenge of climate change. Community organizations offer residential energy efficiency weatherization programs, support bicycle and pedestrian transportation choices, and provide all types of community education services. The energy utilities serving the city provide significant energy efficiency incentive programs, rebate opportunities and clean energy programs. Individual citizens in addition to participating in the utility efficiency programs also lead other Washington communities in their purchase of Green Power. An increasing number of residents are purchasing electric and hybrid vehicles and choosing to walk, ride or roll for transportation. They are also acting to reduce their carbon footprint and educate members of their community.
However, Bellingham is also a low-density, economically diverse community comprised of many older, energy inefficient buildings, and heavily reliant on privately-owned vehicles for transportation. Therefore, in order to reduce the city’s impact on climate and to build a more resilient city, the community will need to make investments in transportation infrastructure, building energy efficiency, and energy supply. Residents will also need to consider ways they can reduce their individual impacts regarding their home energy use, transportation choices and lifestyle changes.
The challenge to reduce greenhouse gas emissions is complex, but with the community working together to reduce emissions while ensuring all residents have access to affordable energy efficient housing, transportation choices, and renewable energy, we can meet the challenge.
13 | P a g e City of Bellingham Climate Action Task Force Report – December 2019
CHAPTER 4: BUILDINGS Clean Energy for Buildings in Bellingham
INTRODUCTION
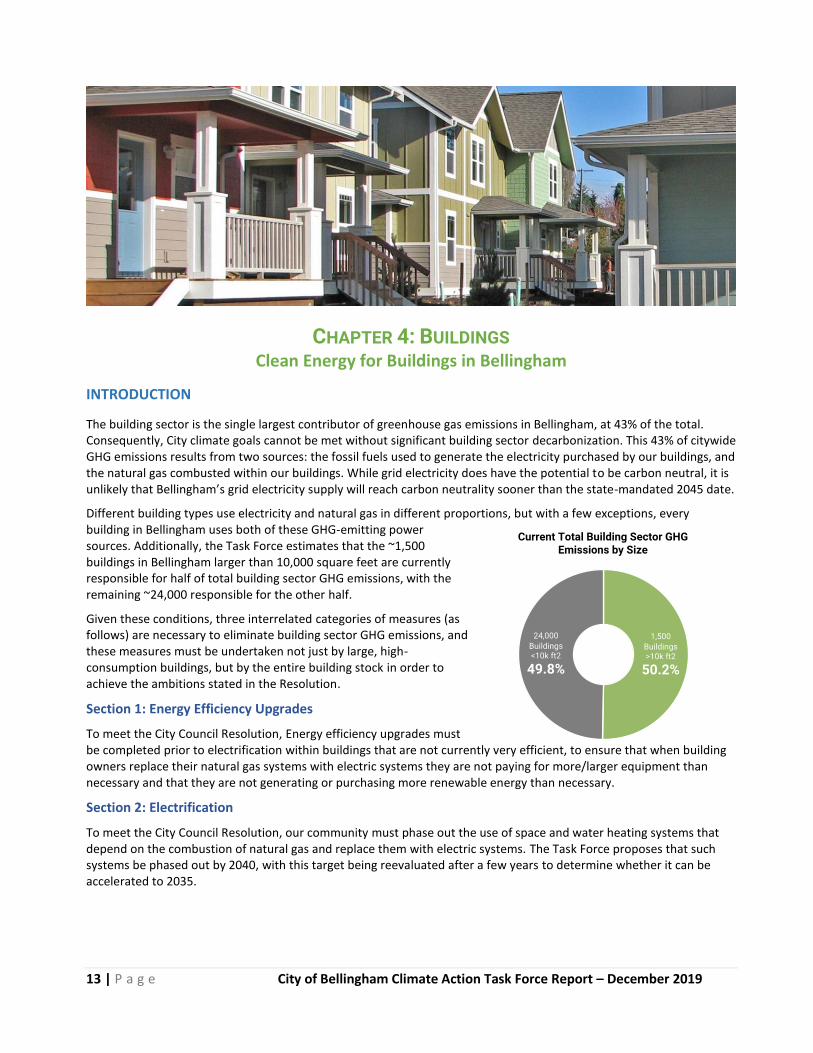
The building sector is the single largest contributor of greenhouse gas emissions in Bellingham, at 43% of the total. Consequently, City climate goals cannot be met without significant building sector decarbonization. This 43% of citywide GHG emissions results from two sources: the fossil fuels used to generate the electricity purchased by our buildings, and the natural gas combusted within our buildings. While grid electricity does have the potential to be carbon neutral, it is unlikely that Bellingham’s grid electricity supply will reach carbon neutrality sooner than the state-mandated 2045 date.
Different building types use electricity and natural gas in different proportions, but with a few exceptions, every building in Bellingham uses both of these GHG-emitting power sources. Additionally, the Task Force estimates that the ~1,500 buildings in Bellingham larger than 10,000 square feet are currently responsible for half of total building sector GHG emissions, with the remaining ~24,000 responsible for the other half.
Given these conditions, three interrelated categories of measures (as follows) are necessary to eliminate building sector GHG emissions, and these measures must be undertaken not just by large, high-consumption buildings, but by the entire building stock in order to achieve the ambitions stated in the Resolution.
Section 1: Energy Efficiency Upgrades
To meet the City Council Resolution, Energy efficiency upgrades must be completed prior to electrification within buildings that are not currently very efficient, to ensure that when building owners replace their natural gas systems with electric systems they are not paying for more/larger equipment than necessary and that they are not generating or purchasing more renewable energy than necessary.
Section 2: Electrification
To meet the City Council Resolution, our community must phase out the use of space and water heating systems that depend on the combustion of natural gas and replace them with electric systems. The Task Force proposes that such systems be phased out by 2040, with this target being reevaluated after a few years to determine whether it can be accelerated to 2035.
14 | P a g e City of Bellingham Climate Action Task Force Report – December 2019
Section 3: Renewable Energy Generation/Procurement
To meet the City Council Resolution, our buildings must generate or purchase renewable energy to meet some or all of their electricity demand so that building sector electrification doesn’t result in continued production of GHG emissions in the period before the grid reaches the state target for 100% renewables.
All three of these categories of measures must be implemented together for maximum GHG reductions and economic efficiency. Each of these measures also results in significant co-benefits, and together they will allow Bellingham to achieve a resilient, carbon-free building stock that supports increased occupant health and comfort while decreasing utility costs and generating jobs. While up-front costs of some of these measures may be significant there are also financial benefits, and financing, rebates, and incentives are available to substantially reduce costs.
The best available data on the costs of electrification in particular are primarily from analyses of cities in California. While these data reveal that “building electrification would deliver lifecycle cost savings for most home types in the study area,” the Task Force suggests that the City of Bellingham immediately commission its own study on the consumer and emissions impacts of electrifying residential and commercial buildings in Bellingham. In order to minimize the costs of this analysis and provide a common picture for our climatic region, the City should consider partnering with other municipalities around the Puget Sound to commission a joint study.
Also, before designing programs or implementing any of the efficiency, electrification and renewable energy measures laid out in this chapter, the City should conduct an economic survey that analyzes the ability of Bellingham building owners and tenants to comply with these requirements. Such a survey could reveal how many Bellingham individuals and households might have difficulty complying due to present-day costs and current levels of program support.
Taken together, these analyses could help the City design effective programs and target available resources to those needing added financial incentives or subsidies in order to comply. It is imperative that these programs be structured in a way that provide the necessary financial support to low- and moderate-income building owners and tenants. An initial set of Finance and Technical Assistance measures, which will be critical to supporting all of the measures, is also discussed below.
POSITIVE RESULTS OF THE TRANSITION
Some of the measures discussed below will require substantial changes from the status quo, while others are extensions of existing programs and activities. Although there will be transition issues for some of the measures, and substantial effort and resources will be needed to develop new programs and practices, there are also large benefits to these changes. Co-benefits of electrification, efficiency, and renewables include:
• Climate
Electrifying buildings is a clear path to addressing climate disruption and meeting the City’s climate ambitions – especially as Washington’s electrical grid gets progressively cleaner and less carbon intensive with the implementation of SB 5116.
• Accelerating use of advanced technology
Utilization of highly efficient electrical heat pump technology provides not only a lower-emission source of heating compared to gas heating systems, but also an efficient cooling function that can supplant the need for conventional air conditioning systems that are likely to become more common in Bellingham’s warming climate.
• Health
Powering homes and other buildings with electricity eliminates a significant source of indoor air pollution—carbon monoxide, formaldehyde, and other pollutants—from burning natural gas, which has been shown to increase asthma and other upper respiratory illness rates by as much as 20% and reduce indoor air quality standards below EPA outdoor air quality standards. Electric heat pumps also provide air conditioning with no additional equipment or installation costs, a significant health benefit, particularly to at-risk populations, as climate change causes increasing hotter temperatures. Finally, a growing body of evidence also demonstrates the weatherization improvements such as air sealing, insulation, and improved HVAC systems can reduce asthma triggers in the home.
15 | P a g e City of Bellingham Climate Action Task Force Report – December 2019
• Safety
Powering homes and other buildings with electricity also eliminates critical threats to public safety. In addition to reducing injuries and death caused by frequent natural gas pipeline explosions, powering buildings with electricity instead of natural gas addresses a critical consequence of natural disasters such as earthquakes: research indicates that 1 in 4 fires that occur after an earthquake are caused by damage to natural gas infrastructure and resultant gas leaks.
• Lower energy costs
More advanced energy systems, tight building envelopes, and other energy investments (e.g. solar) will result in long-term lower utility costs, helping to offset costs of investments. This should result in a reduced energy burden—the percent of household income dedicated to meeting home energy needs.
• Jobs and Economic Development
Jobs related to energy upgrades and green building will increase. Local demand for training at local institutions will go up, helping to create the infrastructure for a more advanced workforce. The local economy will be stimulated as advanced energy and green building companies grow in size to match the demand. “Clean technology” companies, tied to the building sector, will also be stimulated. This will encourage companies to expand or relocate to Bellingham. For example, ITEK Solar, now owned by the Canadian company Silfab, has received substantial local demand for its products, helping to sustain its growth and encourage its expansion of employment near the Bellingham waterfront.

16 | P a g e City of Bellingham Climate Action Task Force Report – December 2019
BUILDINGS SECTION 1: ENERGY EFFICIENCY UPGRADES
Efficiency for Owner-Occupied Homes
Electrification of space and water heating as well as transportation will result in significantly greater demand for electricity. Energy efficiency measures in existing buildings can help ease that demand and make it more practical to pursue a bold electrification pathway supported by 100% renewable energy.
There are many potential paths to reducing energy use in residential buildings, including installation of more energy efficient fixtures and appliances, utilization of new smart technologies, and occupant behavior change. But the deepest and most enduring energy savings can be achieved by addressing the building envelope—specifically, improving the thermal (insulation) and pressure (air sealing) boundaries. These types of energy efficiency retrofits, commonly referred to as weatherization, can reduce home energy use by 20-30% or more, while at the same time improving occupant comfort and enhancing indoor air quality. The Task Force recommends creation of a program that focuses mostly on older homes since these were built before the advent of modern energy codes and have the greatest need for upgrades.
Measure B1: Efficiency Requirements for Owner-Occupied Residences
At point of sale, owners of owner-occupied residential buildings built before 1990 must provide proof of past comprehensive weatherization work or, within 24 months of purchase, must undertake specified weatherization energy efficiency retrofit measures. Owner-occupied residential buildings must meet the following retrofit standards:
• Air leakage – minimum 400 CFM50 reduction or a 20% reduction, whichever is greater, based on pre- and post- blower door tests. Buildings must also meet ASHRAE 62.2 ventilation standards, with added ventilation if warranted;
• Insulation – minimum R-49 in attic, R-11 in walls and R-30 in floor (or fill available cavities).
By 2035, all owners of owner-occupied pre-1990 homes that had not been sold during the period since the enactment of legislation shall meet these requirements – either by providing proof of past comprehensive weatherization work or undertaking the required energy efficiency retrofits.
For owner-occupied buildings constructed since 1990, owners will be encouraged to complete a mid-level assessment, such as PSE’s Home Energy Assessment or a comparable service, that identifies energy savings potential in the home. If this assessment reveals significant deficiencies in insulation levels, owners will be encouraged to undertake the energy retrofits required for pre-1990 buildings.
Details and Key Considerations
Program design for this weatherization requirement must take into account project costs and household incomes of the occupants and may provide exemptions in very limited circumstances if certain standards are technically infeasible. Building owners that demonstrate technical infeasibility or excessive cost (e.g. greater than 15-year simple payback after incentives and rebates) for some portion of the required weatherization efficiency measures may seek an exemption from that portion of the requirements. These situations may include the presence of presumed asbestos-containing material (e.g. vermiculite insulation) or knob-and-tube wiring in an attic space.
Pathways for lower and moderate-income households, and exemptions:
• Households that meet low-income weatherization guidelines (below 60% AMI/200% FPL based on household
size) must complete comprehensive, no-cost weatherization work through Opportunity Council’s Low-income
Weatherization Program. If an application for Low-income Weatherization is deferred due to lack of available services or excessive repairs, then the deferral must be documented, and weatherization must be undertaken once sufficient resources for weatherization and/or home repair are available.
• Households with combined gross income above low-income weatherization guidelines but below 275% FPL (or 300% FPL or some other higher guideline) must complete comprehensive weatherization work unless unable to
access rebates, incentives and subsidies covering at least 60% of project cost.

17 | P a g e City of Bellingham Climate Action Task Force Report – December 2019
Incremental Costs
An analysis of the nearly 500 Bellingham residential weatherization projects previously completed through the Community Energy Challenge since 2010 reveals the following:
• average cost of $7,290 per project ($4,563 after rebates and incentives)
• average simple payback of 11.8 years after CEC incentives and utility rebates
• average annual energy savings of 7233 kWh equivalent per project
Financing Options
For the 500 residential Bellingham homes referenced above, owners received an average of $2,288 in incentives through the Community Energy Challenge, and $707 in utility rebates – from both PSE and CNG. (Note: Utility weatherization rebates have increased in recent years, helping to further close the cost gap. Puget Sound Cooperative Credit Union (PSCCU) provides special low-interest financing of home energy efficiency retrofits through its Energy-Smart Loan program. For low- and moderate-income families, additional rebates may be available. Additional financing options are covered in the Financial section of for this measure.)
Triple Bottom Line Assessment
Social
• Social Acceptability: Medium. Home weatherization offers a well-established path to reducing energy use
and associated carbon emissions, while also providing occupants with lower bills, better comfort, increased building durability, and a healthier indoor environment. These benefits likely make weatherization attractive or at least acceptable to most. Some homeowners may express general concern over the stipulation that energy retrofit work be completed (or evidence of past energy retrofit work submitted) within 24 months of the sale of a home. While this approach would allow for fairly measured and predictable implementation, Bellingham may want to also include a voluntary component with an enhanced incentive package for those who weatherize their homes before the point of sale.
• Social Benefit: High. The completion of energy efficiency retrofits across much of Bellingham’s housing
stock will provide significant economic growth and job opportunities for the local weatherization workforce. In addition, there are a range of other benefits that result from weatherizing homes, including:
o Improved thermal control of buildings, thereby maintaining adequate occupant comfort during the cold months and reducing the likelihood of heat stress during future climate-induced heating events.
o Enhanced indoor air quality due to ventilation improvements, reduced surface condensation during cold months, and reduced air infiltration from unhealthy sources such as crawl spaces.
o Improved building durability resulting from better moisture control.
o Reduced energy burden due to lower energy bills.
• Social Equity/Affordability: Medium. While the up-front cost of comprehensive home energy retrofits
may be high in some cases, the investment can be recouped over time through reduced energy bills. Rebates and other incentives can substantially reduce costs. Measures such as envelope sealing have a short payback period. Some houses will already be insulated to the required levels and will not have to add more. In the absence of substantial subsidies and incentives, this proposal includes exemptions to ensure that low- and moderate-income households are not unfairly burdened with the cost of meeting this requirement.
Financial
• Financial Sustainability: Medium to High. Programs to eliminate or reduce the cost for low- and
moderate-income homeowners exist, although expansion of the funding for the low-income weatherization program will be needed to sustain an expansion of this work. Utility rebate programs can also assist in cost reductions, and programs such as the Community Energy Challenge are available to reduce the cost of needed work. For higher income residents, various sources of financing are available, and the Task Force recommends
18 | P a g e City of Bellingham Climate Action Task Force Report – December 2019
that additional financial products be identified or developed. Creation of a Bellingham Clean Energy fund can also reduce costs – see Financial section addressing this measure.
Technological
• Technological Availability: High. Building science concepts are well understood and the technology to
weatherize homes is mature. Comprehensive weatherization services have been available to Bellingham homes for decades. Currently, availability of qualified contractors would be a limiting factor in achieving this scale of energy efficiency retrofits on this timetable. However, in the past local contractors have proven their ability to scale up operations in response to increased demand and available resources. In addition, the Bellingham-based Building Performance Center can provide training and certification for the weatherization workforce.
• Level of Complexity: Medium. The technology and methods to weatherize homes are not terribly complex,
though individual buildings will vary in complexity based on construction, maintenance condition, and other factors. The complexity of achieving this proposed scale of energy efficiency retrofits derives not so much from the weatherization work on individual homes, but rather from the City’s coordination and enforcement of the requirements, as well as the weatherization workforce levels required to meet the proposed goals on this timetable.
• Flexibility to Adapt to Future: High. As weatherization materials and practices improve incrementally
over time, weatherization contractors can incorporate these into their home energy retrofits.
Environmental
• CO2e Emissions Reductions: High. Bellingham homes completing weatherization improvements through
the Community Energy Challenge saved an estimated average of 7233 kWh equivalent annually, equal to 7862 lbs. – or around 3.5 metric tons – of CO2 every year. [Based on 2017 PSE grid coefficient of 1087 lbs. CO2/MWh.] This represents an average annual reduction of 25% in home energy use.
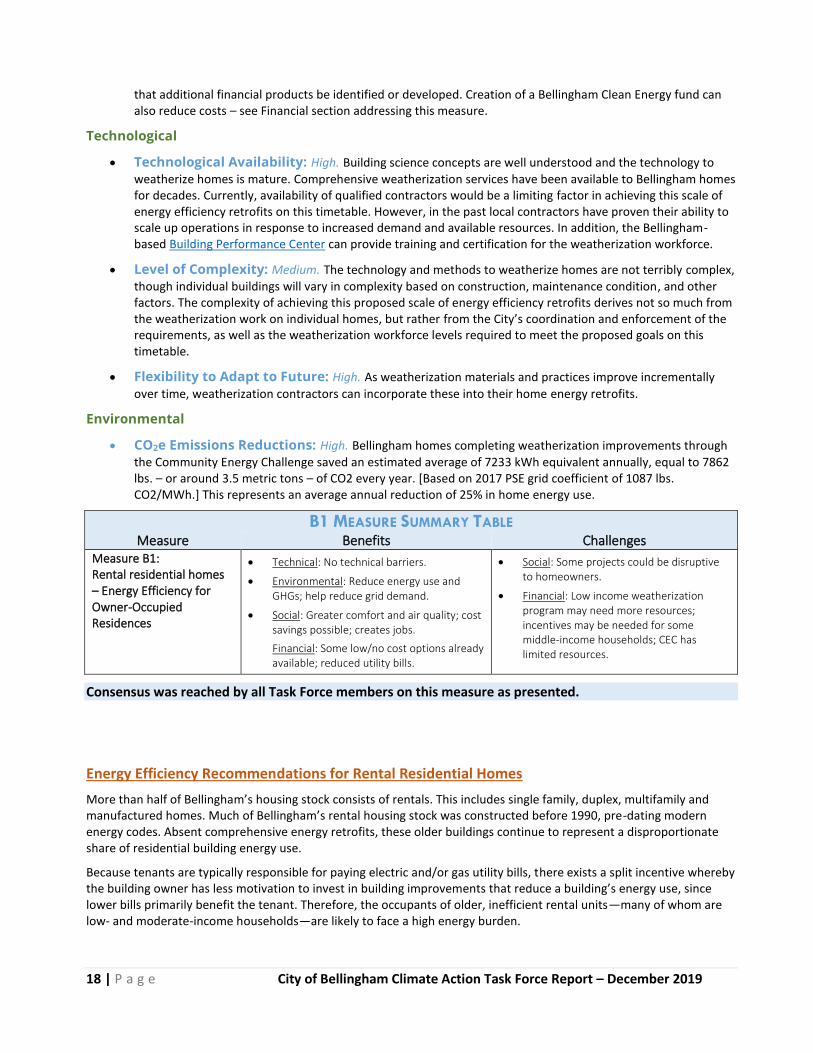
B1 MEASURE SUMMARY TABLE
Measure Benefits Challenges
Measure B1: Rental residential homes – Energy Efficiency for Owner-Occupied Residences
• Technical: No technical barriers.
• Environmental: Reduce energy use and GHGs; help reduce grid demand.
• Social: Greater comfort and air quality; cost savings possible; creates jobs.
Financial: Some low/no cost options already available; reduced utility bills.
• Social: Some projects could be disruptive to homeowners.
• Financial: Low income weatherization program may need more resources; incentives may be needed for some middle-income households; CEC has limited resources.
Consensus was reached by all Task Force members on this measure as presented.
Energy Efficiency Recommendations for Rental Residential Homes
More than half of Bellingham’s housing stock consists of rentals. This includes single family, duplex, multifamily and manufactured homes. Much of Bellingham’s rental housing stock was constructed before 1990, pre-dating modern energy codes. Absent comprehensive energy retrofits, these older buildings continue to represent a disproportionate share of residential building energy use.
Because tenants are typically responsible for paying electric and/or gas utility bills, there exists a split incentive whereby the building owner has less motivation to invest in building improvements that reduce a building’s energy use, since lower bills primarily benefit the tenant. Therefore, the occupants of older, inefficient rental units—many of whom are low- and moderate-income households—are likely to face a high energy burden.
19 | P a g e City of Bellingham Climate Action Task Force Report – December 2019
The City of Boulder, Colorado provides a useful model for energy efficiency improvements in residential rentals. Through its SmartRegs program, Boulder requires all residential rental owners to achieve a baseline of energy efficiency before receiving a license to rent. Compliance is achieved either through a prescriptive path relying on a comprehensive checklist and an inspection carried out by a qualified inspector, or through a performance path involving a Home Energy Rating System (HERS) score based on modeling by a qualified HERS rater. The SmartRegs program launched in January 2011, with a compliance deadline of December 31, 2018. As of December 2018, 99% of the properties that had been
inspected were in compliance.1
The City of Burlington, Vermont provides another approach through its municipal utility’s Time of Sale Energy Efficiency Ordinance. The ordinance requires cost-effective minimum energy efficiency standards, enforced when buildings are sold. The City also provides technical assistance and incentive packages to help property owners meet these requirements. The ordinance includes cost caps, with the required improvements not exceeding 3% of the sale price as listed on the property transfer tax return or $1,300 per rental unit, whichever is less. After this, the Ordinance only mandates the installation of measures that have a simple payback of seven years or less. Our proposal for Bellingham draws from these programs, but with a focus in particular on improving building envelope airtightness and insulation, as this provides the greatest reduction in heating use, the greatest single source of building GHG emissions.
Measure B2: Rental Efficiency Requirements
Prescriptive Path: Owners of Bellingham residential rental buildings built before 1990 must provide proof of past comprehensive weatherization work or, within 36-72 months of enacting legislation (or on the cycle of residential rental safety inspections, every three years), must undertake weatherization energy efficiency retrofits to meet the following standards:
• Air sealing – minimum air leakage reduction of 400 CFM50 or 20%, whichever is greater, based on pre- and post- blower door tests
o Must also meet ASHRAE 62.2 ventilation standards, with added ventilation if warranted
• Insulation (minimum R-49 in attic, R-11 in walls and R-30 in floor – or fill available cavity)
This energy retrofit work and associated air sealing measurements must be performed by a qualified licensed contractor.
Performance Path: Owners of residential rental buildings built before 1990 may comply with this requirement by completing some combination of weatherization energy efficiency measures that achieve a modeled minimum average of 1500 kWh equivalent energy savings per unit or a 20% reduction in energy use per unit. This pathway requires a complete energy audit and modeling performed by a certified professional using a recognized rating and modeling tool (e.g. HERS rating).
Post-1990 Rentals: For residential rentals constructed since 1990, tenants and building owners are encouraged to complete a mid-level assessment, such as PSE’s Home Energy Assessment or a comparable service, that examines energy savings potential in the home and provides no-cost/low-cost energy efficiency improvements (if warranted). If this initial assessment reveals significant deficiencies in insulation levels or obviously visible air sealing concerns, owners will be encouraged to undertake the energy retrofits required for pre-1990 buildings.
Details and Key Considerations
Pathways for lower and moderate-income households, and exemptions:
• For pre-1990 residential rental buildings that have not been previously weatherized and with households that meet low-income weatherization guidelines (below 60% AMI/200% FPL based on household size), the property owner must complete comprehensive, no-cost weatherization work within 36-72 months of enacting legislation (or on the cycle of residential rental safety inspections every three years.) If application for Low-income Weatherization is deferred due to lack of available services, then the deferral must be documented, and weatherization must be undertaken once sufficient weatherization services are again available.
NOTE: Residential rentals are eligible for no-cost low-income weatherization services if the following conditions are met:
o Household in a single-family home meets income guidelines
20 | P a g e City of Bellingham Climate Action Task Force Report – December 2019
o At least one of the two households in a duplex meets income guidelines o At least two of the three households in a triplex meet income guidelines o At least 66% of households in a fourplex or larger building meet income guidelines
• Tenants in a private rental may voluntarily disclose their income eligibility to the landlord/property owner, but such disclosure cannot be compelled.
• For low-income weatherization projects, the landlord/property owner will be required to provide some level of contribution to include, at a minimum, completion of repairs necessary to facilitate weatherization upgrades.
• Property owners that demonstrate technical infeasibility for some portion of the required weatherization efficiency measures may seek an exemption from that portion of the requirements. Likewise, building owners may seek an exemption if a professional energy auditor determines—after a comprehensive energy audit, computer modeling, and development of a list of recommended measures—that cost-effective energy savings can’t be achieved. If required energy efficiency measures do not achieve a simple payback of 15 years (after all available incentives and rebates), the energy efficiency retrofits may be scaled back to completion of the most effective measures that achieve that simple payback.
Because the tenant is responsible for electric and/or gas utility bills in most rental situations, there should be a direct benefit to the tenant in terms of lower utility costs. Residents will almost certainly save money in properties qualifying for low-income weatherization, since that program is offered free of charge. However, in market rate properties, there is also a concern that property owners would potentially raise rents to recoup the cost of the building improvements, and that those rent increases may exceed tenant utility cost savings. The program could be structured so that the increased costs from efficiency measures, after rebates or incentives, balance out with the cost savings from reduced energy use. That would allow an over to recoup costs without increasing renter costs. Or, the City could establish an incentive to property owners who pledge not to raise rent due to the energy efficiency retrofits. Or, a Green Lease program could be created that balances owner and tenant costs and benefits. Sources of incentives and financing are discussed in the Finance section, below.
Incremental Costs
Costs for energy efficiency retrofits in single family residential rentals mirror those of owner-occupied single-family homes. An analysis of the nearly 500 Bellingham residential weatherization projects previously completed through the Community Energy Challenge since 2010 reveals the following:
• average cost of $7,290 per project ($4,563 after rebates and incentives)
• average simple payback of 11.8 years after CEC incentives and utility rebates
• average annual energy savings of 7233 kWh equivalent per project
The Community Energy Challenge has coordinated and incentivized weatherization work on four multifamily properties – two in Bellingham and two in Anacortes. For those fifty units, the average weatherization cost $2,746 per unit with an annual energy savings of 1,834 kWh equivalent per unit.
For another point of comparison, as of December 31, 2018, the City of Boulder’s SmartRegs program reported that the average per unit cost of complying with their requirements was $3,022, with average rebates of $579.
Financing Options
For the 500 residential Bellingham homes referenced above (including some single-family rentals), owners received an average of:
• $2,288 in incentives through the Community Energy Challenge [Note: CEC provides more generous incentives to property owners who complete energy efficiency retrofits on rental properties. Availability of CEC incentives is limited based on program funding.]
• $707 in utility rebates from both PSE and CNG. Note: Utility weatherization rebates have recently become more generous, including Cascade Natural Gas rebates for homes heated with natural gas, and PSE incentives for weatherization in multi-family buildings.]
Low and no-cost financing programs can substantially reduce or even eliminate the cost of these efficiency investments. For example, a proposed C-PACER program holds potential for commercial property owners to finance energy efficiency retrofits at their properties. See further discussion of C-PACER and other financing possibilities in the Financial section
21 | P a g e City of Bellingham Climate Action Task Force Report – December 2019
on this measure.
Triple Bottom Line Assessment
Social
• Social Acceptability: Medium. Home weatherization offers a well-established path to reducing energy use
and associated carbon emissions while also providing occupants with lower bills, better comfort, increased building durability, and a healthier indoor environment. These benefits likely make weatherization attractive to most tenants, although some may object to the disruptions caused by the retrofit work. Some property owners of residential rentals may object to the notion of required building improvements and their associated costs. The Task Force believes these concerns can be mitigated through education on financing and incentives, and on the benefits of efficiency investments in reducing tenant turnover and maintenance costs.
• Social Benefit: High. The completion of energy efficiency retrofits across much of Bellingham’s housing
stock will provide economic growth and job opportunity for the local weatherization workforce. In addition, there are a range of co-benefits that result from weatherizing homes, including:
o Improved thermal control of buildings, thereby maintaining adequate occupant comfort during the cold months and reducing the likelihood of heat stress during future climate change-induced heating events.
o Enhanced indoor air quality due to ventilation improvements, reduced surface condensation during cold months, and reduced air infiltration from unhealthy sources such as crawl spaces.
o Improved building durability resulting from better moisture control.
o Reduced energy burden due to lower energy bills.
• Social Equity/Affordability: Medium. Energy efficiency retrofits will provide all renters in pre-1990 rentals
the benefits of lower utility bills and improved home health. Because there is legitimate concern that property owners may raise rents to recoup the costs or these upgrades, the City should establish an incentive to property owners who pledge not to raise rent due to the energy efficiency retrofits, or otherwise develop programs to reduce or eliminate cost shifting to tenants.
Financial
• Financial Sustainability: Medium to High Programs to eliminate or reduce the cost of weatherization for
low- and moderate-income units exist, although additional funding for the low-income weatherization program will be needed to sustain an expansion of weatherization work. Utility rebate programs will also assist in cost reductions and programs such as the Community Energy Challenge are available to help subsidize the cost of needed work. For market-rate units, various sources of financing are available, and the Task Force recommends that additional financial products be identified or developed. Creation of a Bellingham Clean Energy fund can also reduce costs and provide subsidies where warranted – see Financial section addressing this measure. Larger multifamily buildings may be assisted with a C-PACER financing program being contemplated at the state level.
Technological
• Technological Availability: High. Building science concepts are well understood and the technology to
weatherize homes is mature. Comprehensive weatherization services have been available to Bellingham homes for decades. Currently, availability of qualified contractors would be a limiting factor in achieving this scale of energy efficiency retrofits on this timetable. However, in the past local contractors have proven their ability to scale up operations. In addition, the Bellingham-based Building Performance Center can provide training and certification for the weatherization workforce.
• Level of Complexity: Medium. The technology and methods to weatherize homes is not complex, though
individual buildings will vary in complexity based on construction, maintenance condition and other factors. Weatherizing multifamily residential buildings offers some additional unique challenges, though the techniques

22 | P a g e City of Bellingham Climate Action Task Force Report – December 2019
are well established. The complexity of achieving this proposed scale of energy efficiency retrofits derives not so much from the weatherization work on individual homes, but rather they City’s coordination and enforcement of the requirements, as well as the weatherization workforce levels required to meet the proposed goals on this timetable.
• Flexibility to Adapt to the Future: High. As weatherization materials and practices improve
incrementally over time, weatherization contractors can incorporate these into their home energy retrofits.
Environmental
• CO2e Emissions Reductions: High. In the last few years, the Community Energy Challenge coordinated
and incentivized weatherization work on four multifamily properties – two in Bellingham and two in Anacortes. These projects saved an estimated 91,718 kWh equivalent annually across 50 total rental units, for an average annual savings of 1834 kWh equivalent per unit. That is equal to 1994 pounds – or around 0.9 metric tons – of CO2 per unit every year. [Based on 2017 PSE grid coefficient of 1087 lbs. CO2/MWh.] As of December 31, 2018, the City of Boulder’s SmartRegs program has achieved an annual savings of 3,917 mtCO2 across 22,029 compliant units.
B2 MEASURE SUMMARY TABLE
Measure Benefits Challenges
Measure B2: Rental residential homes – Energy Efficiency for Rental Residences
• Technical: No technical barriers.
• Environmental: Reduce energy use and GHGs; help reduce grid demand.
• Social: Greater comfort and air quality; cost savings possible; creates jobs.
Financial: Some low/no cost options already available; reduced utility bills
• Social: Some projects could be disruptive to renters.
• Financial: Low income weatherization program may need more resources; incentives will be needed for some units to avoid rent increases; CEC has limited resources.
Consensus was reached by all Task Force members on this measure as presented.
Energy Efficiency Recommendations for Commercial Buildings
Commercial buildings make up a substantial portion of Bellingham’s buildings by square footage and account for a significant portion of total energy use in buildings. While Bellingham’s commercial buildings hold great potential for energy efficiency improvements, the nature of the buildings and their use merit an approach that is distinct from residential energy efficiency retrofits. Because typical weatherization work on commercial buildings can be disruptive to normal business operations, our energy efficiency recommendations focus on a range of energy efficiency retrofits in lighting and other system (e.g. HVAC) upgrades.
Some cities have sought to advance energy efficiency in commercial buildings by focusing on benchmarking, auditing and reporting. Two examples of this approach include San Francisco’s non-residential existing buildings ordinance and Fort Collins’ (CO) Building Energy and Water Scoring program. While these efforts provide valuable information and contribute to shifting the marketplace toward more efficient commercial buildings, they are unlikely to result in rapid deployment of energy efficiency strategies and measures on the scale of Bellingham’s climate action ambitions.
Through its Building Performance Energy Requirements, the City of Boulder, Colorado provides an approach that is more focused on assessments and required implementation of energy efficiency measures in commercial buildings. The proposal for energy efficiency in Bellingham’s commercial buildings mirrors this policy from Boulder.
Measure B3: Commercial Efficiency Requirements
Bellingham’s commercial buildings must implement efficiency upgrades over a phased timeline. This applies to non-residential commercial and industrial buildings over 10,000 square feet, with enhanced assessments and measures for buildings over 50,000 square feet. Proposed actions include:
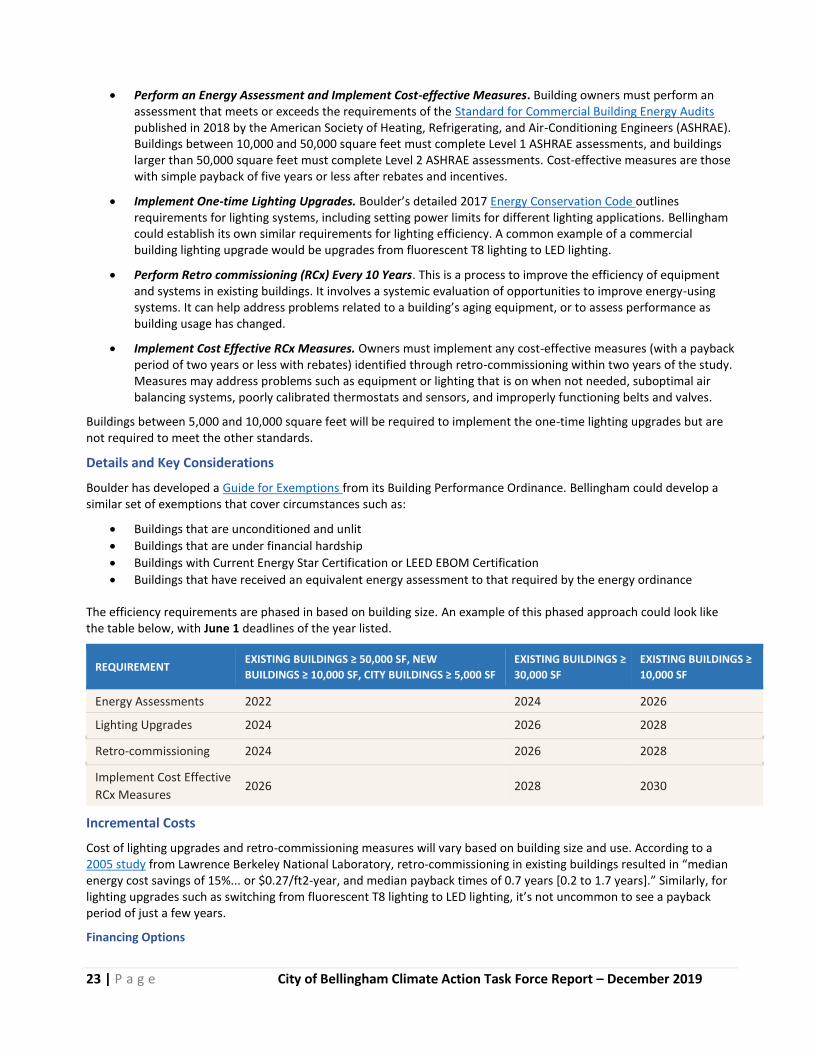
23 | P a g e City of Bellingham Climate Action Task Force Report – December 2019
• Perform an Energy Assessment and Implement Cost-effective Measures. Building owners must perform an assessment that meets or exceeds the requirements of the Standard for Commercial Building Energy Audits published in 2018 by the American Society of Heating, Refrigerating, and Air-Conditioning Engineers (ASHRAE). Buildings between 10,000 and 50,000 square feet must complete Level 1 ASHRAE assessments, and buildings larger than 50,000 square feet must complete Level 2 ASHRAE assessments. Cost-effective measures are those with simple payback of five years or less after rebates and incentives.
• Implement One-time Lighting Upgrades. Boulder’s detailed 2017 Energy Conservation Code outlines requirements for lighting systems, including setting power limits for different lighting applications. Bellingham could establish its own similar requirements for lighting efficiency. A common example of a commercial building lighting upgrade would be upgrades from fluorescent T8 lighting to LED lighting.
• Perform Retro commissioning (RCx) Every 10 Years. This is a process to improve the efficiency of equipment and systems in existing buildings. It involves a systemic evaluation of opportunities to improve energy-using systems. It can help address problems related to a building’s aging equipment, or to assess performance as building usage has changed.
• Implement Cost Effective RCx Measures. Owners must implement any cost-effective measures (with a payback period of two years or less with rebates) identified through retro-commissioning within two years of the study. Measures may address problems such as equipment or lighting that is on when not needed, suboptimal air balancing systems, poorly calibrated thermostats and sensors, and improperly functioning belts and valves.
Buildings between 5,000 and 10,000 square feet will be required to implement the one-time lighting upgrades but are not required to meet the other standards.
Details and Key Considerations
Boulder has developed a Guide for Exemptions from its Building Performance Ordinance. Bellingham could develop a similar set of exemptions that cover circumstances such as:
• Buildings that are unconditioned and unlit
• Buildings that are under financial hardship
• Buildings with Current Energy Star Certification or LEED EBOM Certification
• Buildings that have received an equivalent energy assessment to that required by the energy ordinance
The efficiency requirements are phased in based on building size. An example of this phased approach could look like the table below, with June 1 deadlines of the year listed.
REQUIREMENT EXISTING BUILDINGS ≥ 50,000 SF, NEW
BUILDINGS ≥ 10,000 SF, CITY BUILDINGS ≥ 5,000 SF
EXISTING BUILDINGS ≥
30,000 SF
EXISTING BUILDINGS ≥
10,000 SF
Energy Assessments 2022 2024 2026
Lighting Upgrades 2024 2026 2028
Retro-commissioning 2024 2026 2028
Implement Cost Effective
RCx Measures 2026 2028 2030
Incremental Costs
Cost of lighting upgrades and retro-commissioning measures will vary based on building size and use. According to a 2005 study from Lawrence Berkeley National Laboratory, retro-commissioning in existing buildings resulted in “median energy cost savings of 15%... or $0.27/ft2-year, and median payback times of 0.7 years [0.2 to 1.7 years].” Similarly, for lighting upgrades such as switching from fluorescent T8 lighting to LED lighting, it’s not uncommon to see a payback period of just a few years.
Financing Options
24 | P a g e City of Bellingham Climate Action Task Force Report – December 2019
Rebates for lighting upgrades may be available through Puget Sound Energy. For all energy upgrades in commercial buildings, Commercial Property Assessed Clean Energy and Resilience (C-PACER) could, if enacted by the Washington State Legislature and implemented by Whatcom County, provide an attractive source of financing for commercial property energy efficiency improvements. For more details, see the Financial section for this measure.
Triple Bottom Line Assessment
Social
• Social Acceptability: Medium to high. The energy and operational cost saving benefits of this proposal would likely make these commercial building energy efficiency measures attractive or at least acceptable to most. Some commercial property owners may object to the notion of required building improvements and their associated costs.
• Social Benefit: High. In concert with energy efficiency requirements for residential buildings, these commercial building measures would make a significant dent in Bellingham’s overall energy consumption. They also have the potential to improve the comfort and indoor environment for workers in these buildings. In addition, each step of the commercial building energy efficiency requirements would offer economic activity and employment opportunity.
• Social Equity/Affordability: High. The requirements for commercial buildings are based on building size (excluding buildings smaller than 5000 square feet), are phased in over time starting with larger buildings, and generally have a very favorable payback.
Financial
• Financial Sustainability: Medium to High. Commercial building upgrades phased in over a defined period of time can coincide with regular maintenance cycles and also produce costs reductions via lower energy and maintenance costs. Utility programs are available to assist with rebates and the management of projects. Specialized finance products are available for commercial buildings, and additional programs, such as C-PACER, are being contemplated at the state level. Many projects have a short payback.
Technological
• Technological Availability: High. Energy efficient lighting and retro-commissioning technologies and strategies are well established.
• Level of Complexity: Medium. Commercial building energy assessments and retro-commissioning require specially trained professionals. Individual commercial buildings may prove more complex to address due to specific systems, size, and building use.
• Flexibility to Adapt to the Future: High. Aside from the one-time lighting upgrades, this proposal is not prescriptive. The retro-commissioning involves a customized building analysis and focuses on implementation of RCx measures that pay back over a short time period. Therefore, measures can be adapted and improved as technology evolves.
Environmental
• CO2e Emissions Reductions: Medium to High. Retro-commissioning results in an average energy savings of around 16%. As an example of emission reductions from lighting upgrades, switching from a 32-watt fluorescent to a 17-watt T8 LED can provide comparable performance and lumens while achieving a nearly 50% reduction in energy use and associated CO2 emissions.
25 | P a g e City of Bellingham Climate Action Task Force Report – December 2019
B3 MEASURE SUMMARY TABLE
Measure Benefits Challenges
Measure B3: Rental residential homes – Energy Efficiency for Commercial Properties
• Technical: No technical barriers.
• Environmental: Reduce energy use and GHGs; help reduce grid demand.
• Social: Greater comfort and air quality; cost savings possible; creates jobs.
• Financial: Upgrades during periodic maintenance cycles reduce up-front costs; many projects have short payback; reduced utility bills; utilities have commercial energy conservation programs.
• Social: Some projects could be disruptive to commercial businesses.
• Financial: CEC has limited resources.
Consensus was reached by all Task Force members on this measure as presented.
According to our local 2015 emissions inventory, industrial energy accounts for 23% of all community greenhouse gas emissions.1 Much of this is due to industrial processes, with the remainder resulting from more common commercial needs such as space and water heating. Industrial buildings built with conventional construction and with substantial indoor heating needs could fall under the commercial program discussed here—including measures to improve insulation, or retrofits such as lighting upgrades. However, for many of Bellingham’s industrial buildings, most of the energy used is the result of industrial processes such as manufacturing, storage, and packaging. Industrial processes vary substantially and there is no standardized set of efficiency measures that would be appropriate across industry types. Instead, efficiency in this sector relies on customized process engineering analysis to identify activities that can reduce energy use and costs. For example, industrial efficiency activities may involve upgrading electric motors to incorporate the most efficient models or reconfiguring industrial processes to reduce steps or substitute in more efficient equipment.
Puget Sound Energy’s Industrial System Optimization Program provides specialized engineering analysis of industrial processes and identification of a set of modifications to improve efficiency. The program results in completion of a set of low- and no-cost measures during the initial assessment, provides a list of other low-cost items that can be completed, and provides recommendations on a set of capital project options for more extensive savings. Program participants may also choose to install performance tracking hardware or software to help them maintain their energy improvements. The program can be applied at the entire site or focus on a smaller set of industrial processes. Incentives are available, at the lesser of:
• “$0.05 per verified kWh and/or $0.80/therm saved, or;
• A percentage of the total of all eligible costs related to the installation of performance tracking systems (PTS) and the implementation of action items completed at your business site.”
Locally, some businesses have undertaken substantial efficiency efforts, such as Bellingham Cold Storage (BCS). BCS has, according to the company, reduced refrigeration energy consumption by 4.8 million kWh/yr., with another 800,000 kWh/yr. saved from lighting upgrades. More recently, BCS is adding a new roof to one of its warehouses that “…will add an additional 4 inches of foam-board insulation, which will help reduce heat loss and thus lessen necessary equipment runtime. Another project is adding speed doors to a couple of warehouses; with the doors able to open and close faster, less heat is able to enter those buildings. Energy-efficient LED lighting is being installed, too, in yet another ongoing energy-saving project.”2 For many companies, no downsides exist for these efforts, as they can reduce energy use and bills, result in process improvements, and lower maintenance needs.
1. City of Bellingham, “Climate Action Protection Plan,” p. 35, https://www.cob.org/Documents/pw/environment/Climate%20Protection%20Action%20Plan%202018%20Update.pdf
2. BCS News, “Sustainability Practices in the Cold Storage Industry,” September 17, 2019, https://news.bellcold.com/sustainability-practices-in-the-cold-storage-industry/
A Note on Industrial Energy Efficiency
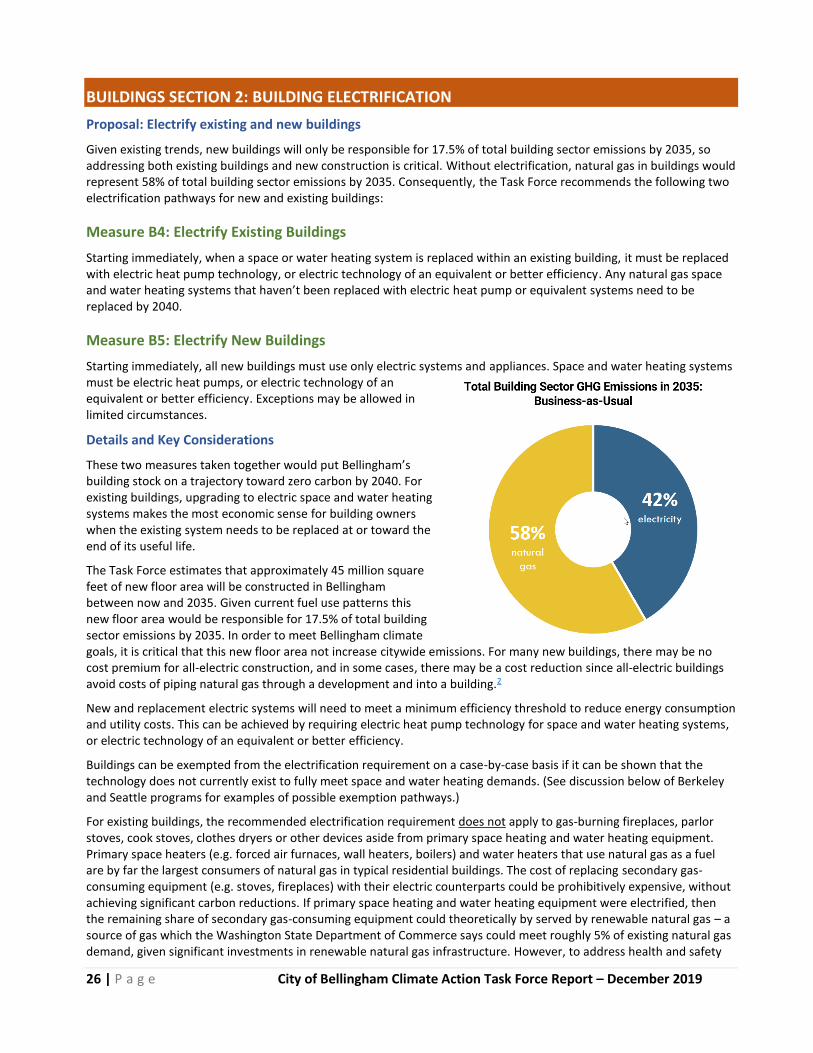
26 | P a g e City of Bellingham Climate Action Task Force Report – December 2019
BUILDINGS SECTION 2: BUILDING ELECTRIFICATION
Proposal: Electrify existing and new buildings
Given existing trends, new buildings will only be responsible for 17.5% of total building sector emissions by 2035, so addressing both existing buildings and new construction is critical. Without electrification, natural gas in buildings would represent 58% of total building sector emissions by 2035. Consequently, the Task Force recommends the following two electrification pathways for new and existing buildings:
Measure B4: Electrify Existing Buildings
Starting immediately, when a space or water heating system is replaced within an existing building, it must be replaced with electric heat pump technology, or electric technology of an equivalent or better efficiency. Any natural gas space and water heating systems that haven’t been replaced with electric heat pump or equivalent systems need to be replaced by 2040.
Measure B5: Electrify New Buildings
Starting immediately, all new buildings must use only electric systems and appliances. Space and water heating systems must be electric heat pumps, or electric technology of an equivalent or better efficiency. Exceptions may be allowed in limited circumstances.
Details and Key Considerations
These two measures taken together would put Bellingham’s building stock on a trajectory toward zero carbon by 2040. For existing buildings, upgrading to electric space and water heating systems makes the most economic sense for building owners when the existing system needs to be replaced at or toward the end of its useful life.
The Task Force estimates that approximately 45 million square feet of new floor area will be constructed in Bellingham between now and 2035. Given current fuel use patterns this new floor area would be responsible for 17.5% of total building sector emissions by 2035. In order to meet Bellingham climate goals, it is critical that this new floor area not increase citywide emissions. For many new buildings, there may be no cost premium for all-electric construction, and in some cases, there may be a cost reduction since all-electric buildings avoid costs of piping natural gas through a development and into a building.2
New and replacement electric systems will need to meet a minimum efficiency threshold to reduce energy consumption and utility costs. This can be achieved by requiring electric heat pump technology for space and water heating systems, or electric technology of an equivalent or better efficiency.
Buildings can be exempted from the electrification requirement on a case-by-case basis if it can be shown that the technology does not currently exist to fully meet space and water heating demands. (See discussion below of Berkeley and Seattle programs for examples of possible exemption pathways.)
For existing buildings, the recommended electrification requirement does not apply to gas-burning fireplaces, parlor stoves, cook stoves, clothes dryers or other devices aside from primary space heating and water heating equipment. Primary space heaters (e.g. forced air furnaces, wall heaters, boilers) and water heaters that use natural gas as a fuel are by far the largest consumers of natural gas in typical residential buildings. The cost of replacing secondary gas-consuming equipment (e.g. stoves, fireplaces) with their electric counterparts could be prohibitively expensive, without achieving significant carbon reductions. If primary space heating and water heating equipment were electrified, then the remaining share of secondary gas-consuming equipment could theoretically by served by renewable natural gas – a source of gas which the Washington State Department of Commerce says could meet roughly 5% of existing natural gas demand, given significant investments in renewable natural gas infrastructure. However, to address health and safety

27 | P a g e City of Bellingham Climate Action Task Force Report – December 2019
concerns associated with natural gas combustion, building owners should be supported in fully electrifying their buildings.
The electrification requirements for new buildings would take effect immediately. For existing buildings, the average life of a space or water heating system is 20 years, although this can vary greatly. If a point-of-replacement electrification measure was enacted and enforced starting in 2020, a significant portion of Bellingham’s building stock would be electrified by 2035, assuming that approximately 5% of equipment is replaced per year. However, it is likely that some residual of buildings would still be using natural gas equipment after 20 years. Given this, putting a mandatory electrification date, such as 2040, into the requirement would allow most of the building stock to electrify at point-of-replacement while ensuring that residual gas space and water heating equipment would be electrified by no later than that date. The Task Force recommends that this target date be reevaluated periodically. If the relative cost of electric systems continues to drop and market acceptance continues to increase – or if additional financial resources for conversion can be identified – the date could be adjusted forward to hit the preferred 2035 target.
Benefits of the transition
Electric heat pump space and water heating systems provide the same, if not greater, occupant comfort but are much more efficient than their natural gas counterparts, resulting in energy savings and, when coupled with efficiency measures or on-site solar, reduction in utility bills. Electric heat pumps also provide cooling with no additional system requirements, a potentially life-saving benefit for our most at-risk populations as our community faces increasingly hot summers. Also, electric systems eliminate the myriad health issues associated with combusting natural gas within our buildings.
Key Actions
Key actions needed to accelerate this measure include a citywide or regional study of the total costs to the consumer so that adequate funding and financing can be created or identified to offset costs when affordability issues arise. As discussed in the Financial section addressing this measure, creation of a technical assistance program in Bellingham, led by the City but in cooperation with energy contractors and community energy service organizations, will create a robust network of support to reduce costs and accelerate uptake of this measure. Additionally, targeted owner, builder, and contractor education about the requirements, and on the numerous benefits associated with the upgrades including improved indoor air quality, the potential for reduced utility bills, and increased community safety and resilience is critical.
Incremental Costs
For existing buildings, the cost of electric equipment needs to be compared with replacement costs for similar gas equipment. The actual costs to owners will be the difference between new electric equipment and equivalent new gas equipment (the incremental cost). While further study is required to determine the region-specific incremental costs for all buildings types, the best currently available data from three studies of the Bay Area in California demonstrate that the upfront incremental costs of space and water heating system electrification at the time of equipment replacement for an average single family home range from negative $500 (a cost savings) to $11,100, and that the average utility bill savings from switching to electric space and water heating equipment range from $8,000 to $12,600 over 20 years, the typical life of a space or water heating system. These same studies found that new all electric homes results in an upfront cost savings of $3,000 to $10,000 as compared to a mixed fuel new home, though this did assume that the new construction included air conditioning. 3
In addition to these studies, local space heating equipment cost data from installed projects in Bellingham was compiled in the next tables below.
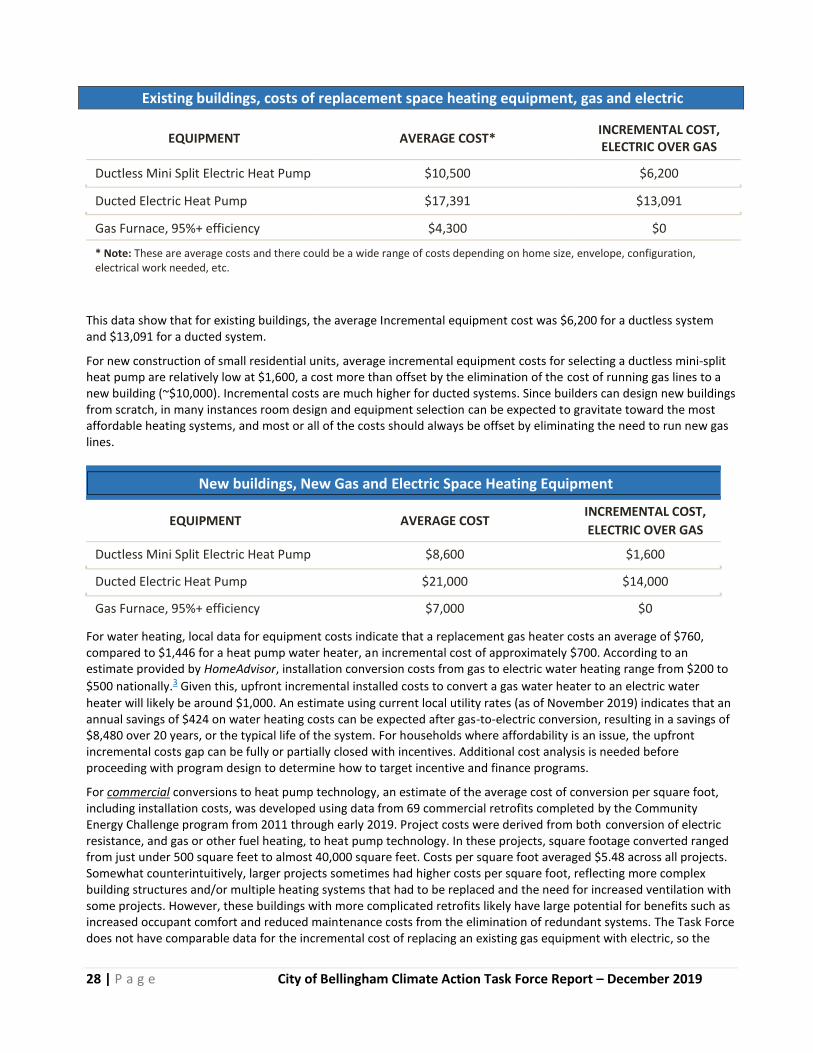
28 | P a g e City of Bellingham Climate Action Task Force Report – December 2019
Existing buildings, costs of replacement space heating equipment, gas and electric
This data show that for existing buildings, the average Incremental equipment cost was $6,200 for a ductless system and $13,091 for a ducted system.
For new construction of small residential units, average incremental equipment costs for selecting a ductless mini-split heat pump are relatively low at $1,600, a cost more than offset by the elimination of the cost of running gas lines to a new building (~$10,000). Incremental costs are much higher for ducted systems. Since builders can design new buildings from scratch, in many instances room design and equipment selection can be expected to gravitate toward the most affordable heating systems, and most or all of the costs should always be offset by eliminating the need to run new gas lines.
New buildings, New Gas and Electric Space Heating Equipment
EQUIPMENT AVERAGE COST INCREMENTAL COST,
ELECTRIC OVER GAS
Ductless Mini Split Electric Heat Pump $8,600 $1,600
Ducted Electric Heat Pump $21,000 $14,000
Gas Furnace, 95%+ efficiency $7,000 $0
For water heating, local data for equipment costs indicate that a replacement gas heater costs an average of $760, compared to $1,446 for a heat pump water heater, an incremental cost of approximately $700. According to an estimate provided by HomeAdvisor, installation conversion costs from gas to electric water heating range from $200 to
$500 nationally.3 Given this, upfront incremental installed costs to convert a gas water heater to an electric water
heater will likely be around $1,000. An estimate using current local utility rates (as of November 2019) indicates that an annual savings of $424 on water heating costs can be expected after gas-to-electric conversion, resulting in a savings of $8,480 over 20 years, or the typical life of the system. For households where affordability is an issue, the upfront incremental costs gap can be fully or partially closed with incentives. Additional cost analysis is needed before proceeding with program design to determine how to target incentive and finance programs.
For commercial conversions to heat pump technology, an estimate of the average cost of conversion per square foot, including installation costs, was developed using data from 69 commercial retrofits completed by the Community Energy Challenge program from 2011 through early 2019. Project costs were derived from both conversion of electric resistance, and gas or other fuel heating, to heat pump technology. In these projects, square footage converted ranged from just under 500 square feet to almost 40,000 square feet. Costs per square foot averaged $5.48 across all projects. Somewhat counterintuitively, larger projects sometimes had higher costs per square foot, reflecting more complex building structures and/or multiple heating systems that had to be replaced and the need for increased ventilation with some projects. However, these buildings with more complicated retrofits likely have large potential for benefits such as increased occupant comfort and reduced maintenance costs from the elimination of redundant systems. The Task Force does not have comparable data for the incremental cost of replacing an existing gas equipment with electric, so the
EQUIPMENT AVERAGE COST* INCREMENTAL COST, ELECTRIC OVER GAS
Ductless Mini Split Electric Heat Pump $10,500 $6,200
Ducted Electric Heat Pump $17,391 $13,091
Gas Furnace, 95%+ efficiency $4,300 $0
* Note: These are average costs and there could be a wide range of costs depending on home size, envelope, configuration, electrical work needed, etc.

29 | P a g e City of Bellingham Climate Action Task Force Report – December 2019
incremental per square foot cost would be less than the estimate above. Additional cost analysis is needed before proceeding with program design.
The type of study recommended above will more accurately determine incremental costs and support the development of a program to include direct subsidies and low-cost financing resources to reduce these costs for existing buildings. This program can be modeled on programs elsewhere that take this approach, including Opalco Energy on Orcas Island, which provides low-cost on-bill financing for purchase of ductless heat pumps and heat pump water heaters and Boulder County’s Comfort 365 Program, which offers technical assistance and rebate assistance to homeowners who are converting to heat pumps. Additionally, the establishment of a bulk purchasing program, which could include negotiated discounts with certain manufacturers, could accelerate adoption and help offset any incremental costs that owners face. Despite this, some buildings facing extraordinary costs may need to be provided with an alternative compliance pathway, or in extreme cases, an exemption.
Items for Further Analysis
Before designing and implementing these measures, a legal analysis is needed to clarify the City’s powers to restrict access to natural gas appliances and equipment and ability to require conversions. As an example of one approach for new construction, Berkeley grounded its new requirements in its general municipal powers to regulate the health and
Many states and jurisdictions have or are considering stringent decarbonization requirements for new
construction. A program to require all-electric new construction is being implemented in Berkeley, CA. This
program prohibits hookups of natural gas in new developments and buildings under a phase-in schedule that
considers technological feasibility. The City has determined that low-rise residential buildings will be covered
starting in January 2020. For medium and high-rise residential construction, the requirement kicks in after an
analysis is completed by the California Energy Commission certifying a baseline minimum energy efficiency
standard for water and space heating equipment, a certification also expected in 2020. The remaining building
types are automatically added as the underlying technology needed to run them is certified. The City allows for
certain projects to be exempted if they are deemed not physically feasible to install. The measure is expected to
save developers money in residential development, since a recent California Codes and Standards Program study
indicated that it cost an average of $6000 per building unit to extend natural gas infrastructure through a
development and into a building.
Menlo Park, CA, has adopted a program similar to Berkeley’s, with the exception that small residential buildings
will be allowed to have gas stoves as long as the homes are wired and ready for electric stoves in the future.
The City of Seattle is contemplating a similar program that would prohibit new gas hook-ups in the City. The
proposed legislation allows exceptions in cases where it is currently technically infeasible to substitute electric for
gas. That exception decision is delegated to the City’s Planning Director. The first draft of the legislation calls for
“… temporary waivers or other relief that apply to the installation of certain equipment and appliances, such as
natural gas-powered commercial cooking appliances, and minimally necessary gas piping systems, for a period of
one year from July 1, 2020.” Extensions of this exception capacity would be allowed “should circumstances
warrant.” Waivers are only allowed under “…circumstances where suitable alternative electric appliances that
meet performance standards are unavailable.”3
1 Elana Shao, “Bay Area Cities Poised to follow Berkeley’s natural gas ban, San Francisco Chronicle, August
19, 2019, https://www.sfchronicle.com/business/amp/Bay-Area-cities-poised-to-follow-Berkeley-s-
14342117.php 2 Maggie Angst, “Natural gas soon to be outlawed in almost all new Menlo Park buildings,” Mercury News,
August 28, 2019, https://www.mercurynews.com/2019/08/28/menlo-park-opts-for-a-natural-gas-ban-
almost-as-restrictive-as-berkeley/ 3 City of Seattle, draft legislation, “An Ordinance relating to prohibiting natural gas systems in new
buildings,” November 13, 2018.
Policy Precedents: Berkeley, Menlo Park, and Seattle
30 | P a g e City of Bellingham Climate Action Task Force Report – December 2019
safety of buildings and tied its regulations to the initial permitting process. For new buildings, certain building code changes may be needed to ensure that equipment efficiency standards are implemented. Stretch codes may be one pathway to this, but this topic will require additional research. Program design will need to take into account the differential costs of various systems, available financing and incentives, ability to pay, and time of payback for the various systems. The design of electrification programs must take into account impacts on affordability and equity for renters and owners and will need to provide incentives and financing as necessary.
Triple Bottom Line Assessment
While there are many benefits of electrification there are also costs associated with the transition away from fossil fuels. For new buildings, electrification may be cost-neutral. For existing buildings, there may be a net up-front financial cost. For both new and existing buildings, the health benefits of electrification, such as cleaner indoor air, occur immediately. For some retrofits, additional resources will be necessary to mitigate any cost burdens associated with the transition away from fossil fuels. Members of the Buildings Working Group have proceeded under the following principles when examining the community costs and benefits of the transition:
• Acknowledge both the up-front implementation costs and long-term economic, social, and health benefits of policies to meet the City’s accelerated climate action goals;
• Provide clear implementation timelines and identify adequate subsidies and/or financing options so that building owners can reasonably comply with policy requirements;
• Ensure low- and moderate-income households, whether renters or owners, are not unfairly burdened with costs related to compliance. This entails providing appropriate exemptions as well as access to programs (e.g. energy assistance, low-income weatherization, CEC) that reduce energy burdens.
With these principles in mind, the following represents a summary of a qualitative and quantitative assessment of the social, financial, technological, and environmental benefits associated with building electrification. The Task Force applies these same principles to subsequent measures. Technical assistance and finance measures, discussed later in this chapter, are assumed to be in place to ease any financial burdens of the transition.
Social
• Social Acceptability: Medium. As with any change in standard practices in society, there will be some
opposition to these changes. There are misconceptions about the affordability and comfort of electric space and water heating compared to natural gas. Some consumers, and even some HVAC contractors, may not be familiar with current technologies, how they operate, and their efficiencies. Many individuals think of inefficient electric baseboard space heating systems when conceiving of electric heat, or the old and expensive technology for electric water heating. Modern heat pump space and water heating incorporates state-of-the-art technology with extremely high efficiencies and long product life. Owners of new buildings with commercial kitchens may be concerned about not having a gas stove option. On the positive side, innovative electric equipment such as induction stoves can replicate the performance of gas stoves while eliminating the need for gas infrastructure. Education of the general public, and cooperative outreach to the subset of contractors who are less familiar with new technology, may help to accelerate adoption.
• Social Benefit: High. There are essentially no downsides to this measure from a social benefit standpoint.
While there will be some transition issue, the efficiency and quality of modern electrical systems will produce the same heating and other benefits while improving consumer health and achieving other social benefits. Immediate positive results include improved indoor air quality and enhanced safety in buildings.
• Social Equity/Affordability: Medium to High. The incremental costs for replacing existing gas heating
systems with electric heating systems are lowest when equipment reaches the end of its useful life. When coupled with the other proposed measures (renewable energy and energy efficiency) utility costs may go down, which benefits low-income homeowners and tenants most. Adding rebates or other financial support for low-income residents to reduce or eliminate any incremental costs will be a critical component in ensuring affordability and equity. Owners of detached or small apartment rental structures may pass some of the increased costs on to tenants. Program design will need to take this into account, and subsidies and financing programs will need to be targeted at rental properties to ensure that energy investments do not result in rent increases.

31 | P a g e City of Bellingham Climate Action Task Force Report – December 2019
Financial
• Financial Sustainability: Medium to high. In many cases there will be incremental costs where equipment
is being replaced. New buildings can be designed to reduce or eliminate this increment. As installation of heat pump equipment further penetrates the market and becomes standard practice, costs will likely drop. Additional resources will need to be identified to support the transition and assist low income households—see Financial section addressing this measure. Financial sustainability is impeded somewhat because utility rebates for conversion of gas to electric are currently not available.
Technological
• Technological Availability: High. The technology exists today to meet space and water heating demands
for most buildings. Many new large residential and commercial buildings are already being built with all-electric equipment (see list of buildings in the Seattle area, below). Recent data from King County indicate that two-thirds of new homes are being built with electric heating.4 Some commercial buildings with specialized equipment (e.g. laboratories, swimming pools) may not be able to comply with all electrification measures today, although equipment technology is improving rapidly and one would expect the technology to meet demand within 20 years or less.
• Level of Complexity: Low to Medium. The technology exists for most functions and is well proven and
understood, though perhaps not by all builders/contractors. Some education may be required but learning how to meet this demand would future-proof contractors and equipment installers, helping to increase local economic resilience.
• Flexibility to Adapt to Future: High. There are no barriers to technological adaptation present with this
measure, and technological changes will make this measure easier and cheaper to implement.
Environmental
• CO2e Emissions Reductions: High. This measure will result in dramatic and easily measurable emissions
reductions. Undertaken alone the emissions reductions from this measure will be large, sustained, and continually increasing as the electricity grid trends toward carbon neutrality. Undertaken with the other proposed measures, the emissions reductions will be even more dramatic. Electrification also significantly increases community resiliency.
B4, B5 MEASURE SUMMARY TABLE Measure Benefits Challenges
Measure B4: Building electrification – Electrify water and space heating in existing buildings with heat pump or equivalent technology at point of equipment replacement
• Technical: Technology is available with few exceptions; likely 100% applicable before 2035
• Environmental: Poses largest impact on GHG within building sector.
• Social: Health benefits; high performance/high efficiency.
• Financial: Capital costs low at point of replacement, with some exceptions; financing/incentives can fill gap.
• Social: Consumers/some contractors may not be familiar with technology.
• Financial: Funding and finance will be required to reduce costs for some populations or types of equipment; utility rebates for conversion often not available.
Measure B5: Building electrification – Electrify new buildings at time of construction using heat pump or equivalent technology for all space and water heating systems
• Technical: Technology available with few exceptions; likely 100% before 2035.
• Environmental: Will save 18% of GHG emissions by 2035.
• Social: Health benefits; high performance/high efficiency.
• Financial: Often no net increase in costs.
• Technical: Some specialized applications may require exceptions.
• Social: Some consumers may not want electric equipment – e.g. stoves. Education is needed on performance of equipment.
Consensus was not reached by the Task Force on this measure with PSE being the dissenting vote. PSE’s comments are as follows:
PSE voted ‘no’ to this Buildings Work Group natural gas fuel switching measure because the Task Force has not completed the required feasibility, cost and impact analyses necessary to even contemplate the recommendations. The
32 | P a g e City of Bellingham Climate Action Task Force Report – December 2019
recommendation from the Task Force should be to conduct the analyses that will inform its understanding of the feasibility, costs and impacts for customers, the energy delivery systems, and the environment.
BUILDINGS SECTION 3: RENEWABLE ENERGY
Measure B6: Provide on-site or participate in the production of renewable energy
Even with the electrification measures recommended above, to close the gap between the clean energy available on the grid and Bellingham’s clean energy targets, the building sector must contribute to an increase in the production of
renewable energy. By 2035, all buildings (existing and new) must choose and implement at least one of the three
following renewable energy options:
1. Rooftop solar Install solar PV on at least 50% of the area of a solar-ready roof and/or an equivalent on-site area, as determined by a qualified solar installer;
2. Community Solar Buy into a local community solar project, purchasing enough to meet at least 50% of building energy demand;
3. Solar program Sign up for PSE Green Direct (or equivalent program). A program will need to be structured to offer renewable power at no cost premium to residents below 60% Area Median Income (AMI) or 200% Federal Poverty Level (FPL) based on household size.
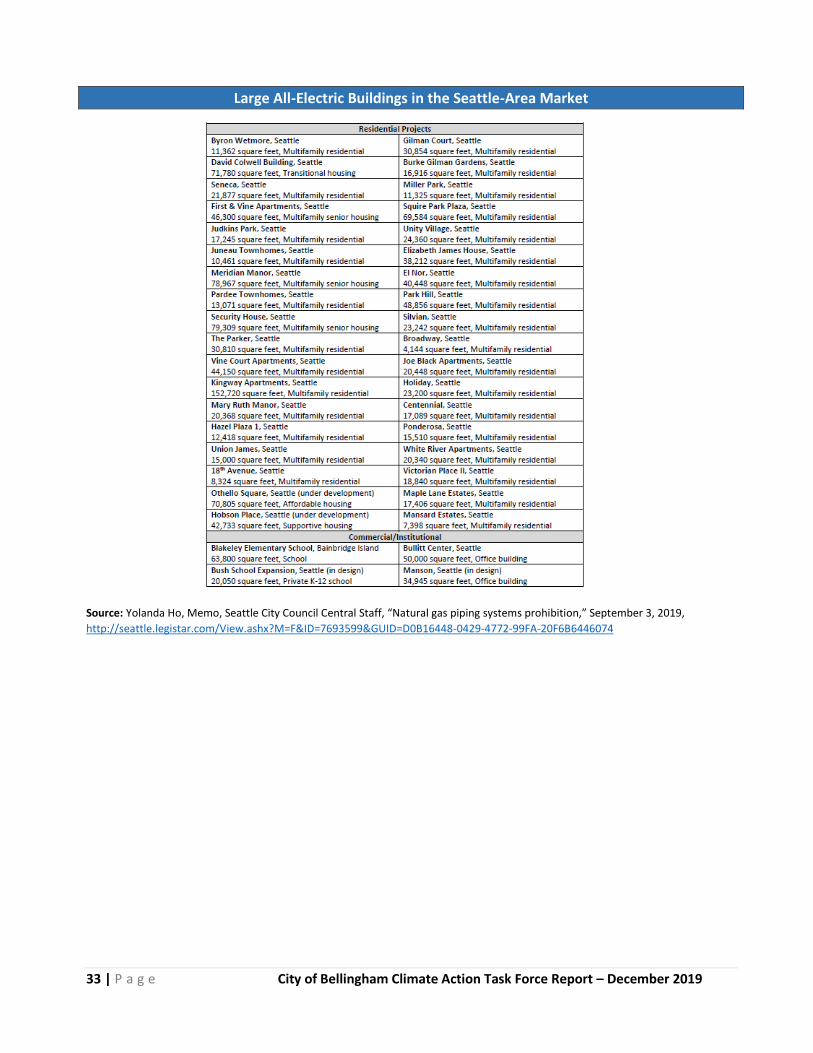
33 | P a g e City of Bellingham Climate Action Task Force Report – December 2019
Large All-Electric Buildings in the Seattle-Area Market
Source: Yolanda Ho, Memo, Seattle City Council Central Staff, “Natural gas piping systems prohibition,” September 3, 2019,
http://seattle.legistar.com/View.ashx?M=F&ID=7693599&GUID=D0B16448-0429-4772-99FA-20F6B6446074

34 | P a g e City of Bellingham Climate Action Task Force Report – December 2019
Details and Key Considerations
Coupling a renewable energy measure with a building sector electrification requirement is critical for two reasons. First, electrification without renewable energy, implemented before the grid achieves carbon neutrality, will still result in a substantial amount of carbon emissions. Second, widespread building sector electrification will significantly increase electricity demand, and it is important to offset that demand increase with the addition of new renewable energy sources to the electricity grid.
Each of the above renewable energy choices offers different benefits to residents:
• On-site solar reduces or eliminates utility costs. While upfront costs are higher for this option than the other two, on-site solar has a typical return-on-investment of 5 to 10 years, after which monthly costs are lowered on a net basis for the life of the system. Also, low-interest financing options are currently available that reduce or eliminate upfront costs, with typical monthly payments close to or less than electric utility costs before the addition of on-site solar. A Bellingham program could be structured to add in additional rebates for lower income households.
• Depending on how a program is structured, community solar requires a small, or no upfront cost and a minimal (or negative) electricity cost premium. During the design of a program, the City, PSE, and any other partners in a community solar program should look into the potential of creating a version of community solar that can benefit low income residents, either directly by reducing their bills, or indirectly by providing additional revenues to low income housing providers. (See, for example, a program developed by the Denver Housing Authority).
• Currently Green Direct is only offered to commercial customers in Bellingham, and the Task Force proposes that a version of this program be made available to all customers. Green Direct and Green Power, the current PSE customer offerings, come with a small cost premium.
o The Task Force proposes that the City work with PSE to create a version of Green Direct that can be offered at no cost premium for at least low-income residents (residents below 60% Area Median Income (AMI) or 200% Federal Poverty Level based on household size), and ideally for all residents. Green Direct (unlike Green Power) guarantees the addition of new renewable energy to the electricity grid, which is why the Task Force believes that expanding this program is critical to meeting both Bellingham climate goals and PSE renewable energy goals.
o The Task Force also recommends that a new communitywide version of Green Direct be an opt-out program. Participating in Green Direct would require no effort and have a minimal cost premium for many residents and would be provided at no additional cost for low income residents. The opt-out nature of the program would guarantee immediate participation by a large swath of the building sector.
There are no barriers to implementing this measure within the 2035 timeline, and it could easily be implemented on a more aggressive timeline such as by 2025 or 2030. The City should work with PSE and/or other community partners to develop and structure programs to support all three of these options, with a goal of putting this requirement in place as soon as possible.
Benefits of the transition
On-site renewable energy generation can increase building and grid resiliency, an important consideration in the face of increasingly extreme weather conditions and more frequent natural disasters. On-site energy generation coupled with electrification can also result in the reduction or elimination of annual energy costs, a particularly significant benefit to low income building occupants since utility bills can represent a significant proportion of total annual income. Community solar or subsidized on-site options can facilitate energy democracy and support lower income and at-risk communities in accessing affordable and reliable energy.
The Bellingham building sector can also support and potentially increase the speed of PSE’s transition to 100% renewable energy by adding renewable energy to the grid through both on-site generation and off-site procurement. Furthermore, because this measure supports the electricity grid in decreasing its emissions intensity, it will also result in reduced GHG emissions from our City’s transportation and industry sectors.
35 | P a g e City of Bellingham Climate Action Task Force Report – December 2019
Key Actions
The City will need to engage with PSE or other providers to design a program that is opt-out rather than opt-in, and that is premium-free, at least for low income residents. Discussions with the Washington Utilities and Transportation Commission (UTC) to ensure that a new program complies with regulations will also be necessary. Additional work will also be needed to create a community solar program that is easy to understand and participate in. A community solar program recently implemented by the Snohomish PUD may hold some lessons for program design. Additionally, owner/tenant education about the renewable energy requirements, about financing options for on-site solar energy, and about the various benefits to residents associated with each choice will accelerate the adoption of this measure. The City and its partners on this effort will also need to create educational materials that clearly communicate available options and provide clear information on how to participate in them. Additional “solarize” campaigns for rooftop solar may help with uptake.
Incremental Costs
This measure includes three distinct pathways, each with their own characteristics. While all three rely on renewable energy generation, they are structured quite differently and have different costs. Solar costs have declined steadily for all types of systems, and similar cost reductions in utility-scale wind generation have occurred, which has the potential to reduce costs for all three options. Various market-based loan products are available for on-site solar purchases by consumers and businesses. The cost of rooftop solar is affected by many factors, including the size of the array and who the purchaser is. Taxed entities (individuals and businesses) can deduct 30% of the costs of the purchase price of the array against federal taxes. However, in the absence of Congressional action, the credit will begin ramping down, dropping to 26% in 2020, and to 22% in 2021. In 2022, credits drop to 10%, and will only be available for commercial installations.
Commercial installations can take advantage of accelerated depreciation tax benefits, and Washington has eliminated sales tax for many installations. State energy production incentives have in the recent past reduced long-term costs and ensured a relatively short simple payoff for arrays, but those incentives have mostly been drawn down and are not available for many consumers. Simple payoffs for systems in Bellingham have been around 5 years in recent years but may be increasing as price supports dwindle.
Other factors, such as whether an array is unobstructed and can use less expensive central inverters, or requires more expensive string inverters, also impact costs. As such, on-site solar costs must be evaluated on a case-by-case basis. Local solar installers and programs are very experienced at evaluating the various factors that impact costs (production estimates, amount of energy to be offset, available rebates and incentives, etc.). In addition, the City of Bellingham has created a streamlined solar permitting program that reduces design costs and speeds permitting. It is critical to note, however, that the proposed measure also includes two off-site options to provide owners with the most flexibility.
Since the specific programs for off-site solar (community solar and solar/wind share program such as Green Direct), have not been created yet, it is impossible to provide specific cost estimates for these alternatives. However, both of these programs have strong precedents (there are Washington state community solar programs in operation, and PSE offers its Green Direct product to municipal entities), and the ability of the City, PSE, and/or other community partners to develop these alternatives is very promising. Also, utility scale wind, and the larger solar arrays that could result from either community solar or as part of a Green Direct program, are among the lowest cost energy alternatives available on the market today. As such, these off-site products should be able to be offered at an attractive price.
Triple Bottom Line Assessment
Social
• Social Acceptability: Medium to High. Renewable energy, particularly on-site solar, is a familiar concept
and is viewed positively by a large swath of the community. A number of local campaigns to support direct installs of solar in Bellingham has been popular and successful, and resident participation in renewable energy credit programs have also been high. Currently, Bellingham leads on a per capita basis for solar installations and participation in Green Power within PSE’s service territory. At the same time, many who don’t already have on-site solar would like to install it but view it as too expensive and are less familiar with other renewable energy options such as community solar or Green Direct. Education will be needed to clarify all the options.
36 | P a g e City of Bellingham Climate Action Task Force Report – December 2019
In some cases, on-site solar installs will not be possible because of site constraints or other issues. Rarely, some commercial roofs may not be engineered to take the additional weight of the panels. Such property owners will be able to select an option that does not require an on-site solar install.
• Social Benefit: High. There are essentially no downsides to this measure from a social benefit standpoint,
especially if implemented as proposed thereby reducing/eliminating upfront costs and cost premiums for many residents. Job creation potential in local solar manufacturing and solar installation and is also high. Since the state’s largest solar panel manufacturer is located in Bellingham, increasing local solar installs will translate into more local jobs.
• Social Equity/Affordability: High. If implemented as proposed, this measure presents manageable
affordability concerns as it provides a choice to low income residents with no cost premium and offers all residents options for implementing renewable energy options, with some options reducing utility costs. However, exemptions may be needed for low income households if a no-cost product cannot be developed. For buildings with limited area for on-site renewable energy generation, the ability to procure off-site renewable energy instead of depending on on-site renewable energy to meet the renewable energy requirement is key.
Financial
• Financial Sustainability: High. Since building owners can choose the pathway to renewable energy,
they can select the method most suitable to their situation. Private financing is available to support the installation of on-site solar, and PSE already offers programs similar to those proposed for Option 3. Additional design work on a community solar program will be needed to create a structure that is affordable and works within utility, state, and federal guidelines. The implementation of this measure has the potential for a significant increase in local renewable energy jobs and businesses, improving local economic resilience.
Technological
• Technological Availability: High. All necessary technology for on-site and community solar exists, is
proven, and has seen dramatic annual improvements in efficiency coupled with annual reductions in cost. PSE may face barriers in meeting increased renewable energy demand if there is rapid uptake in Green Direct or a similar program. These are the same barriers that the company will face in meeting state mandated carbon neutrality by 2045. On the positive side, Bellingham may be able to work with the utility to create pilots that can later be scaled throughout their service territory.
• Level of Complexity: Low. All of the proposed renewable energy choices are technologically simple to
implement, and in fact significant expertise already exists within our community. For community solar, or if a local array is built to supply Green Direct, local infrastructure improvements may be needed to ensure that new power generation can be managed within the grid.
• Flexibility to Adapt to Future: High. There are no barriers to future technological adaptation present
with this measure and future technological updates will likely make this measure increasingly cheaper to implement. A key benefit of this measure is its natural tie to battery storage. While building-scale storage technology is still relatively expensive, it has also seen steady annual improvements coupled with annual reductions in cost. Once building-scale storage is implementable at scale, the community resilience and energy democracy benefits offered by renewable energy will be compounded.
Environmental
• CO2e Emissions Reductions: High. This measure will result in dramatic and easily measurable emissions
reductions as it will help transition much of our City’s energy supply from fossil fuel emitting sources to carbon free sources. Undertaken with the other proposed measures, the emissions reductions will be even more dramatic. Furthermore, as this measure helps reduce emissions intensity in the electricity grid, it will contribute to further reductions in GHG emissions in our City’s transportation and industry sectors.

37 | P a g e City of Bellingham Climate Action Task Force Report – December 2019
B6 MEASURE SUMMARY TABLE
Measure Benefits Challenges
Measure B6: Renewable Energy – Buildings generate or purchase renewable energy
• Technical: No technical barriers.
• Environmental: Will offset fossil fuel component of grid energy.
• Social: Will generate local jobs; may reduce energy bills.
Financial: Low or no cost options will be available; solar purchases reduce energy bills.
• Technical: Community solar/renewable energy credit options require program design.
• Social: People may not be familiar with options.
• Financial: Depending on how programs are structured, subsidies may be required for certain populations. Shrinking state subsidies may make onsite solar less desirable.
Consensus was not reached by the Task Force on this measure with PSE being the dissenting vote. PSE’s comments are as follows: PSE voted no to the required participation in a solar program because this measure needs additional analyses of feasibility, costs and impacts, including a more thorough review of PSE’s customer renewable offerings, how much electric demand increase as the heating load shifts, and how much demand can be reliably met with solar.

38 | P a g e City of Bellingham Climate Action Task Force Report – December 2019
BUILDINGS SECTION 4: FINANCE AND TECHNICAL ASSISTANCE
In order to rapidly accelerate the transition from current patterns of energy use to carbon-free buildings, an array of incentives, financing options, and other forms of assistance will be necessary. In order to accomplish this, the Buildings Working Group recommends that the City adopt the three broad measures listed below. Each recommendation is paired with some discussion of possible ways to structure the measure. These measures are “secondary” measures – they support the efficiency, electrification, and renewables measures above but are not themselves directly associated with a specific quantity of carbon reduction.
The Buildings Working Group recommends that these options be packaged together as a financing and technical assistance “toolkit” to support energy investments. As part of this, the Task Force recommends that the City create a web-based platform with information on supported energy measures alongside available assistance to accomplish these measures. This should include information on all applicable financing, rebates, and other forms of assistance, and also include information on existing programs such as low-income weatherization. Recommended programs and types of assistance are outlined below.
Measure B7: Provide technical assistance and design services to support energy upgrades
Technical assistance can be a component in reducing the cost of upgrades and fully leveraging the expertise in the community. The goal of this service is to create a proactive support network to ensure that residents and commercial customers receive immediate targeted assistance to help them with energy upgrades regardless of the complexity of their project. In part, this could be modeled on similar programs elsewhere, include Boulder County’s Comfort 365 program, which helps residents explore “…options for heating and cooling (AC) with renewable energy, connect with
contractors, evaluate bids, and get access to any and all rebates…5
Recommendations include the following:
• Add Green Building expertise. The City should hire a Green Building specialist and/or should cross-train
all of its building permit center staff to support a program that orients, educates, and directs all customers appropriate for energy work to knowledgeable resources.
• Provide basic design assistance. Preliminary design assistance for energy projects can reduce the total
cost of upgrades. For simple projects, quick orientation to preferred technologies and direct referrals by the City to knowledgeable contractors could occur. In addition, the City could make a set of standard engineering specifications available to help guide initial design work for systems using off-the-shelf technology and simple installation.
• Provide advanced design assistance. For more complex residential or commercial energy projects, up-
front screening regarding assistance needs could occur at the City building department, followed by referral to energy specialist contractors, or for more complex projects, to the Community Energy Challenge (CEC). For specified energy projects with substantial upfront costs but large carbon benefits, subsidies could be made available to reduce cost of project design.
• Expedite and reduce costs of permitting. The City should adopt expedited permitting for
electrification and efficiency projects meeting the City’s specifications and should consider eliminating or reducing any separate permitting fees for these projects.
• Identify financing and incentives. Technical assistance should be combined with information on
available financing mechanisms, incentives, and rebates to ensure that financial barriers do not preclude rapid upgrades. See information on financing mechanisms below. [Note that in some cases, rebate programs through utilities and local organizations significantly reduce retrofit project costs to the point that projects do not need additional financing].

39 | P a g e City of Bellingham Climate Action Task Force Report – December 2019
B7 MEASURE SUMMARY TABLE
Measure Benefits Challenges
Measure B7: Financing – Create a technical assistance program
• Technical: n/a
• Environmental: This measure supports other measures; no direct impact.
• Social: Fills knowledge and assistance gap to support social acceptance of electrification and renewable goals.
• Financial: Reduces costs and barriers to electrification and renewable goals.
• Social: Will require reorganization of some City activities; high need for City/community/contractor education.
• Financial: Expanded capacity will require City commitment.
Consensus was reached by all Task Force members on this measure as presented.
Measure B8: Create a Bellingham Clean Energy Fund
The Buildings Working Group recommends that the City of Bellingham provide financial resources to catalyze and support rapid investments in energy upgrades. Resources are needed to reduce or eliminate costs for lower income families, provide incentives to early adopters of carbon-reducing technologies, and reduce costs of investments that have high up-front costs but large long-term carbon reductions. A key tool will be a Bellingham Clean Energy Fund (CEF), capitalized with funds from a variety of possible sources. Money from the CEF can supplement assistance available from outside sources, such as state or federal financing programs, commercial energy loans, and utility rebates. Local funds also provide for maximum flexibility in program design and enhance local control. Money in a CEF could also be used to leverage other funds—for example, when grant programs require a local match.
Possible funding sources for initial capitalization of a fund, and its ongoing operations, include:
• State grants. The State Department of Commerce has a Clean Energy Fund that supports clean energy projects in various ways across the state. This fund has provided assistance to private clean energy financing programs operating in the state. Continued monitoring of opportunities for grants from the Clean Energy fund is warranted.
• National philanthropy. While external grants cannot be assumed, a number of leading cities have received grant funding to catalyze programs that can act as national models. For example, Fort Collins, CO received a $1 million grant from the Bloomberg Foundation to set up a program for energy investment “EPIC” loans using on-bill financing.
• Community philanthropy. Our local community foundation, the Whatcom Community Foundation, is working to raise $5 million to create a revolving fund that reduces the cost of financing for low income housing projects. The City could canvass local philanthropic foundations or individuals to assess interest in and feasibility of providing financial support for carbon reduction projects.
• Increase the City gas utility tax. The current Bellingham gas utility tax is set at 6%. Under state law, a municipality can raise the rate with a public vote. To establish a steady baseline of funding for
The City of Boulder, Colorado created a Climate
Action Plan (CAP) tax in 2006 to help pay for
projects that increase energy efficiency and reduce
carbon emissions. The CAP was first approved by
voters in 2006 and was renewed in 2015. The tax is
levied on electricity consumption, as the city’s
electricity is heavily reliant on coal, and projects
funded by the tax help reduce coal use. The tax is
applied to residential, commercial, and industrial
accounts. Electricity from renewable sources is
exempt from the tax. The tax currently generates
close to $2 million per year.
Projects that are supported by the fund vary, but
recent projects have included commercial energy
efficiency measures, and support for rental owners
who are investing in energy efficiency under the
City’ Smart Regs program. Climate outreach and
programs to encourage electric vehicles are also
funded. Average costs per resident of the tax are
$21 per year. Projects paid for by the CAP have
their performance tracked quantitatively to ensure
progress and effective use of the funds.
Policy Precedent: City of Boulder Climate Action Plan Tax
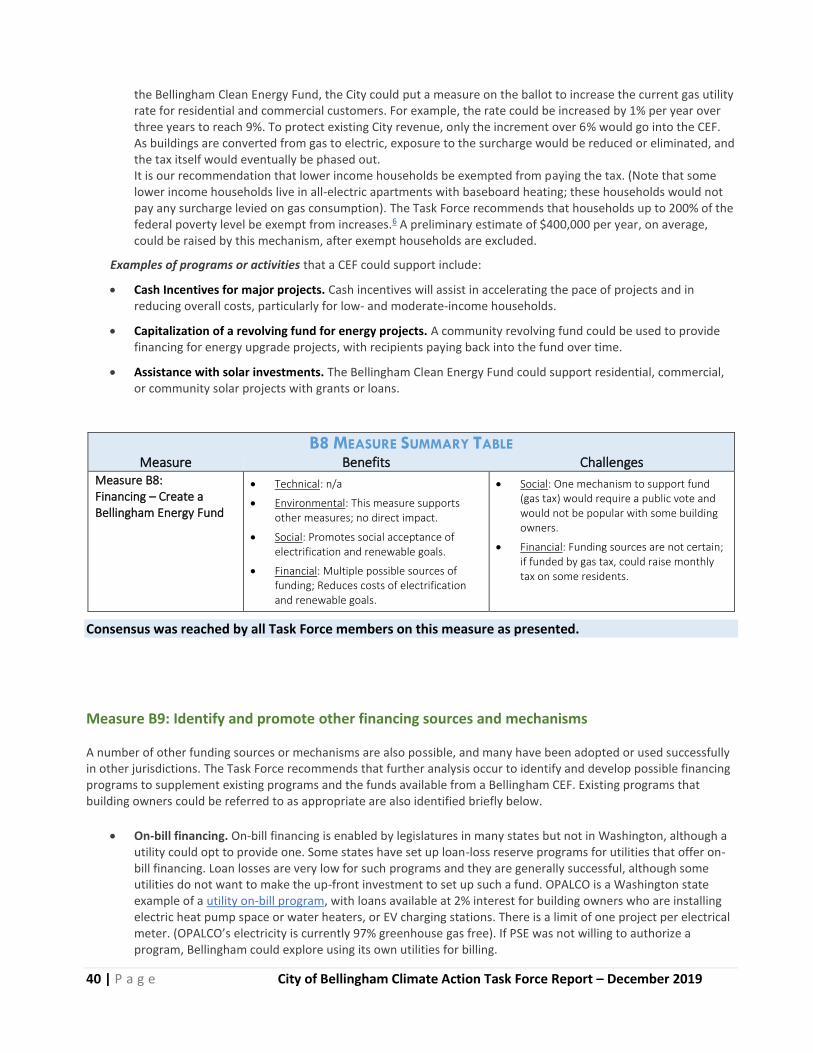
40 | P a g e City of Bellingham Climate Action Task Force Report – December 2019
the Bellingham Clean Energy Fund, the City could put a measure on the ballot to increase the current gas utility rate for residential and commercial customers. For example, the rate could be increased by 1% per year over three years to reach 9%. To protect existing City revenue, only the increment over 6% would go into the CEF. As buildings are converted from gas to electric, exposure to the surcharge would be reduced or eliminated, and the tax itself would eventually be phased out. It is our recommendation that lower income households be exempted from paying the tax. (Note that some lower income households live in all-electric apartments with baseboard heating; these households would not pay any surcharge levied on gas consumption). The Task Force recommends that households up to 200% of the federal poverty level be exempt from increases.6 A preliminary estimate of $400,000 per year, on average, could be raised by this mechanism, after exempt households are excluded.
Examples of programs or activities that a CEF could support include:
• Cash Incentives for major projects. Cash incentives will assist in accelerating the pace of projects and in reducing overall costs, particularly for low- and moderate-income households.
• Capitalization of a revolving fund for energy projects. A community revolving fund could be used to provide financing for energy upgrade projects, with recipients paying back into the fund over time.
• Assistance with solar investments. The Bellingham Clean Energy Fund could support residential, commercial, or community solar projects with grants or loans.
B8 MEASURE SUMMARY TABLE
Measure Benefits Challenges
Measure B8: Financing – Create a Bellingham Energy Fund
• Technical: n/a
• Environmental: This measure supports other measures; no direct impact.
• Social: Promotes social acceptance of electrification and renewable goals.
• Financial: Multiple possible sources of funding; Reduces costs of electrification and renewable goals.
• Social: One mechanism to support fund (gas tax) would require a public vote and would not be popular with some building owners.
• Financial: Funding sources are not certain; if funded by gas tax, could raise monthly tax on some residents.
Consensus was reached by all Task Force members on this measure as presented.
Measure B9: Identify and promote other financing sources and mechanisms
A number of other funding sources or mechanisms are also possible, and many have been adopted or used successfully in other jurisdictions. The Task Force recommends that further analysis occur to identify and develop possible financing programs to supplement existing programs and the funds available from a Bellingham CEF. Existing programs that building owners could be referred to as appropriate are also identified briefly below.
• On-bill financing. On-bill financing is enabled by legislatures in many states but not in Washington, although a utility could opt to provide one. Some states have set up loan-loss reserve programs for utilities that offer on-bill financing. Loan losses are very low for such programs and they are generally successful, although some utilities do not want to make the up-front investment to set up such a fund. OPALCO is a Washington state example of a utility on-bill program, with loans available at 2% interest for building owners who are installing electric heat pump space or water heaters, or EV charging stations. There is a limit of one project per electrical meter. (OPALCO’s electricity is currently 97% greenhouse gas free). If PSE was not willing to authorize a program, Bellingham could explore using its own utilities for billing.
41 | P a g e City of Bellingham Climate Action Task Force Report – December 2019
• Incentives tied to tax credits. Alternately, incentives could be tied to specific targeted projects and funded as a tax credit. For example, a Berkeley seismic retrofit program allows residential owners doing seismic upgrade projects a dollar-for-dollar credit against a 1.5% real estate transfer tax. The program pays for up to one-third of the project cost, and work must be completed within one year of sale. Berkeley is considering expanding this program to cover energy projects as well. If a Bellingham program were structured similarly, this would mean a credit against Real Estate Excise Tax (REET). A program could help fund conversions from gas to electric heating, and building envelope efficiency projects, that occur at or near a point of sale.
• PACE (Property Assessed Clean Energy) loans. Some states (30+) have created financing mechanisms whereby loans for energy upgrades can be secured against the value of real property, allowing loans to be made at the lowest interest and often structured to allow property owners to pay back loans via property tax assessments. For some projects resulting in major efficiency improvements, energy saved can equal the amount of the loan, resulting in no increase in monthly outlays to the owner. Although there have been some concerns that PACE programs may run afoul of the Washington Constitution, a recent legal analysis indicated that a program modeled on one operating in Texas could pass legal muster.7 An effort is currently underway to create a Washington program (C-PACER – Commercial Property Assessed Clean Energy and Resilience), centered on commercial properties, including multifamily. If successful, this effort could result in another available financing tool for local efficiency, renewable, and electrification projects. Proposed legislation for PACER puts Counties in charge of authorizing a local program, so the City would need to work with Whatcom County before publicizing such a program.
• Private Finance. For upgrades that occur after the sale of a home or other property, long-term mortgage financing may offer the best interest rate and ability to pay back the investment over an extended period of time. For example, the Federal 203k Mortgage program is a key tool to support point-of-sale requirements for energy upgrades. These are available for detached homes and for attached homes with up to 4 units. A “streamline” version of the program allows borrowers to borrow up to $35,000 for total project costs (including a contingency buffer of 15% of project costs). The streamline loan is likely to cover most of the costs of efficiency or electrification projects in Bellingham and is quicker and easier to navigate than the standard 203k program. Credit scores necessary for this type of loan (at 640 or higher) may be higher than scores required for standard loans.
For number of defined projects, specific loan programs are currently available from area banks or credit unions. For example, Puget Sound Cooperative Credit Union offers “Energy-Smart Loans” for solar, efficiency, and gas conversion projects. Puget Sound Energy also maintains a financing web page that compiles information on available loans for residential or commercial energy projects. A technical assistance program should monitor the availability of such private loans and provide information on them to building owners as appropriate.
• State Programs. The Washington State Housing Finance Commission offers loans program for the purchase of energy efficient homes, or upgrades for multifamily and nonprofit buildings. An Energy Spark home loan program provides an interest rate buy-down for the purchase of a new home that exceeds code by at least 15%, or an existing home that has been upgraded to be at least 10% more efficient. New construction homes can meet standards such as LEED silver or better or Built Green® with at least a 3 Star rating or better. Sustainable Energy Trust loans can be made for up to $1 million for construction of high efficiency single family homes, and for energy and water efficiency upgrades of multifamily and non-profit buildings. Loans are available for energy projects such as community solar arrays.
Areas for Further Analysis
Regarding financing, it would necessary to identify any legal restrictions on expenditures for an energy fund created under City control. For example, lending as opposed to grants might be treated differently, and the City may have difficulty serving as the sole backstop for a loan program. Programs to assist low income households might have more flexibility in their design than programs designed to assist those with more income. Another option would be to set up a fund outside of direct city control to support energy investments, using non-City revenues.
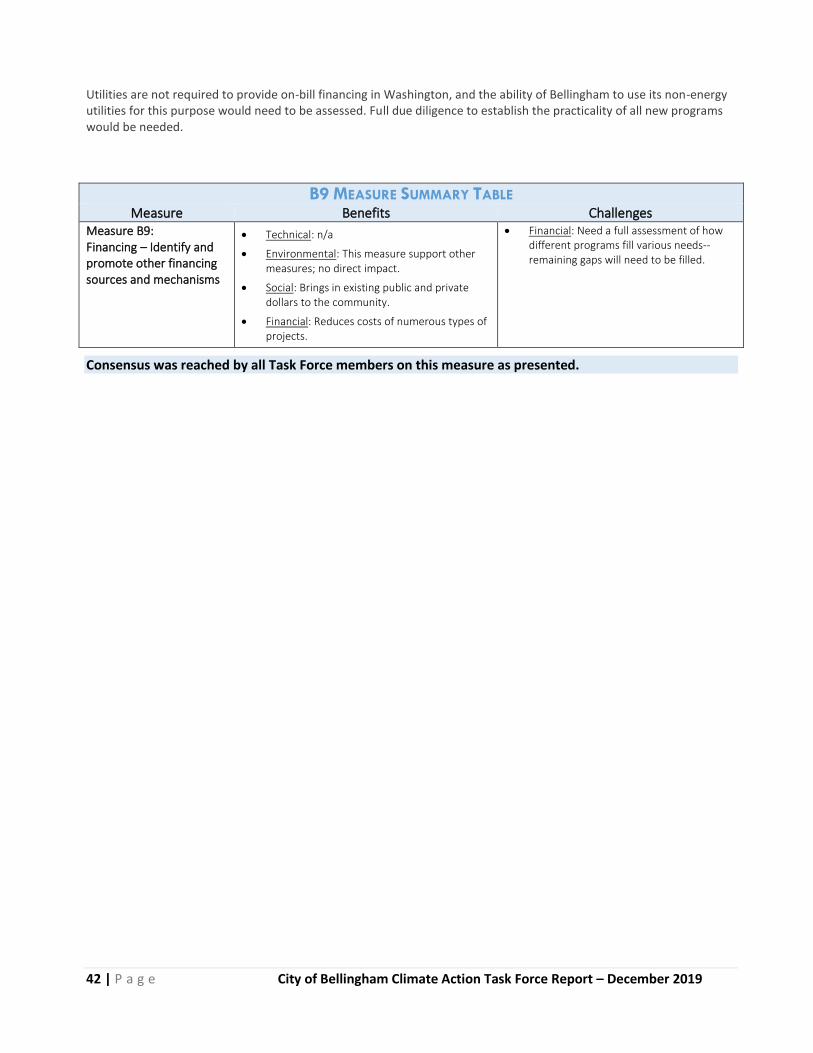
42 | P a g e City of Bellingham Climate Action Task Force Report – December 2019
Utilities are not required to provide on-bill financing in Washington, and the ability of Bellingham to use its non-energy utilities for this purpose would need to be assessed. Full due diligence to establish the practicality of all new programs would be needed.
B9 MEASURE SUMMARY TABLE
Measure Benefits Challenges
Measure B9: Financing – Identify and promote other financing sources and mechanisms
• Technical: n/a
• Environmental: This measure support other measures; no direct impact.
• Social: Brings in existing public and private dollars to the community.
• Financial: Reduces costs of numerous types of projects.
• Financial: Need a full assessment of how different programs fill various needs-- remaining gaps will need to be filled.
Consensus was reached by all Task Force members on this measure as presented.

43 | P a g e City of Bellingham Climate Action Task Force Report – December 2019
CHAPTER 5: TRANSPORTATION
INTRODUCTION
The Transportation and Land Use Work Group was formed to develop measures for meeting the community transportation goal set by Council Resolution No. 2018-06: 100% renewable energy for community transportation by 2035. Transportation and land use issues influence and impact each other; however, the two topics are presented in two separate chapters in this report. This report identifies the measures necessary to achieve the ambitious target set forth by the Council Resolution No. 2018-06.
The Task Force recognizes that a completely greenhouse gas-free society is not attainable. For purposes of this report, the Task Force is not looking at “embedded carbon” sources arising from the creation of goods and materials consumed in or created in Bellingham. Nonetheless our community can make great strides in meeting the 2035 City Council Resolution goal with strong leadership and vocal public support.
The Transportation and Land Use Work Group believes that meeting the City’s goal for a 100% renewable energy-powered transportation sector can best be accomplished by taking a multifaceted approach. This entails undertaking actions with both a short term and longer-term vision and utilizing both policy “carrots” (e.g., incentives) and “sticks” (e.g., regulations).
The following chart shows the dominant effect of transitioning to electric vehicles compared to three strong mode share change strategies. The bottom line is simple; to even come close to meeting the City Council’s ambition of having a zero-carbon transportation system by 2035 internal combustion engines must be phased out.
Photo credit: David Roberts

44 | P a g e City of Bellingham Climate Action Task Force Report – December 2019
Projected Growth and Emissions Under Various Scenarios (metric tons CO2)
None of the measures recommended here require new technologies. The technologies exist; no inventions are necessary. This points to the incredibly important role of policy, deployment, and focused execution.
Our recommendations are presented as measures and fall under the following five categories, and also involve tracking outcomes. A number of the measures have ties to more than one category.
1. Transition to Using Electricity as a Fuel for Most Transportation 2. Re-commit to Meeting the City’s Existing Mode Shift Goals 3. Reform City Parking Policies 4. Revise Land Use Policies 5. Provide an Ongoing Financial Stream to Implement A. B. and C.—Utilizing both Public and Private Sources
NOTE: One tension to note is that while transitioning to electricity as a transportation fuel is a direct way to achieve greenhouse gas reductions, simply converting our existing transportation system to a new fuel fails to acknowledge the many ways that our current transportation system is socially unjust.
Our current economic system perpetuates inequities that disproportionately impact certain disadvantaged populations, and this is certainly true when it comes to transportation. In terms of social equity, those with the most accumulated wealth have disproportionate influence over where tax resources get spent.
Simply converting our existing transportation system to a new fuel fails to acknowledge the many ways that our current
transportation system is socially unjust. The next figure elaborates more on the social and financial impacts of car
dependency.
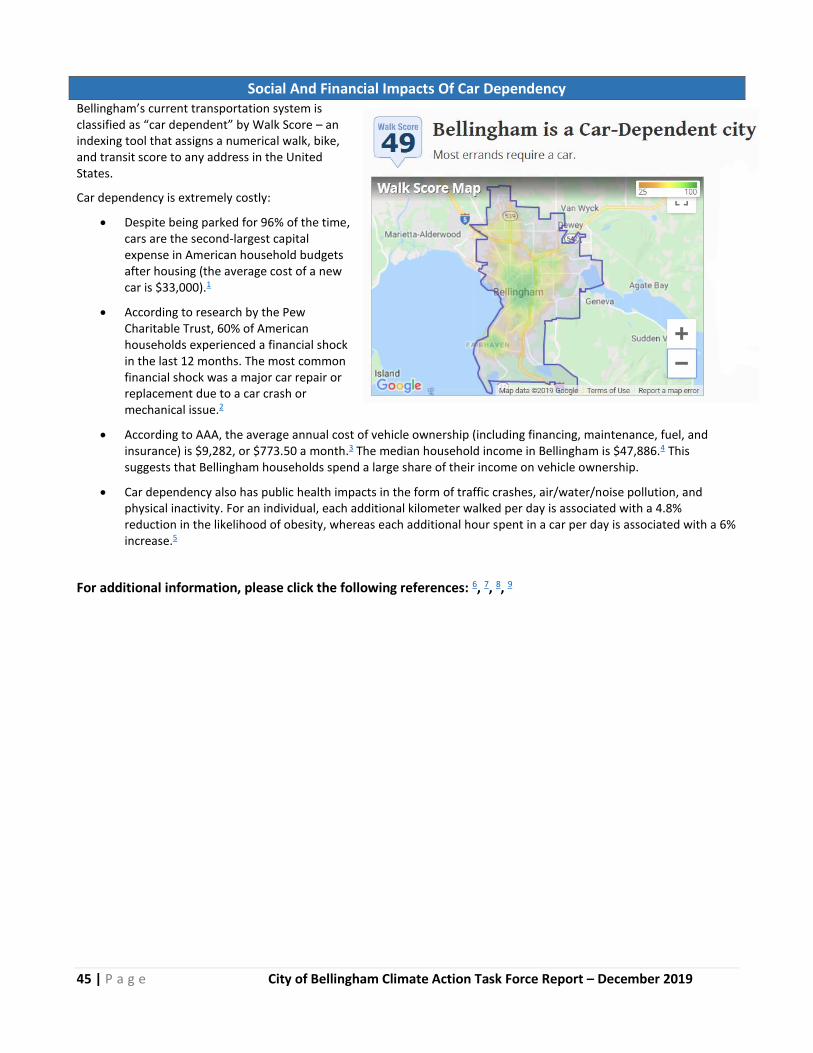
45 | P a g e City of Bellingham Climate Action Task Force Report – December 2019
Social And Financial Impacts Of Car Dependency Bellingham’s current transportation system is classified as “car dependent” by Walk Score – an indexing tool that assigns a numerical walk, bike, and transit score to any address in the United States.
Car dependency is extremely costly:
• Despite being parked for 96% of the time, cars are the second-largest capital expense in American household budgets after housing (the average cost of a new car is $33,000).1
• According to research by the Pew Charitable Trust, 60% of American households experienced a financial shock in the last 12 months. The most common financial shock was a major car repair or replacement due to a car crash or mechanical issue.2
• According to AAA, the average annual cost of vehicle ownership (including financing, maintenance, fuel, and insurance) is $9,282, or $773.50 a month.3 The median household income in Bellingham is $47,886.4 This suggests that Bellingham households spend a large share of their income on vehicle ownership.
• Car dependency also has public health impacts in the form of traffic crashes, air/water/noise pollution, and physical inactivity. For an individual, each additional kilometer walked per day is associated with a 4.8% reduction in the likelihood of obesity, whereas each additional hour spent in a car per day is associated with a 6% increase.5
For additional information, please click the following references: 6, 7, 8, 9
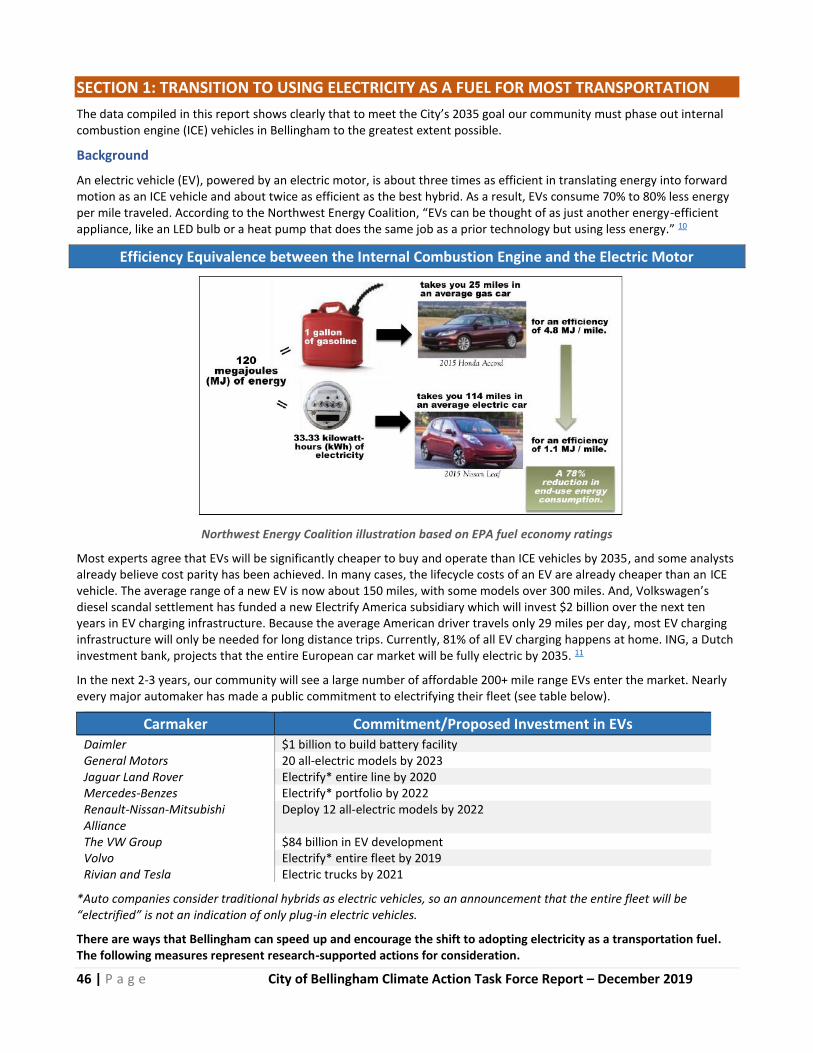
46 | P a g e City of Bellingham Climate Action Task Force Report – December 2019
SECTION 1: TRANSITION TO USING ELECTRICITY AS A FUEL FOR MOST TRANSPORTATION
The data compiled in this report shows clearly that to meet the City’s 2035 goal our community must phase out internal combustion engine (ICE) vehicles in Bellingham to the greatest extent possible.
Background
An electric vehicle (EV), powered by an electric motor, is about three times as efficient in translating energy into forward motion as an ICE vehicle and about twice as efficient as the best hybrid. As a result, EVs consume 70% to 80% less energy per mile traveled. According to the Northwest Energy Coalition, “EVs can be thought of as just another energy-efficient appliance, like an LED bulb or a heat pump that does the same job as a prior technology but using less energy.” 10
Efficiency Equivalence between the Internal Combustion Engine and the Electric Motor
Northwest Energy Coalition illustration based on EPA fuel economy ratings
Most experts agree that EVs will be significantly cheaper to buy and operate than ICE vehicles by 2035, and some analysts already believe cost parity has been achieved. In many cases, the lifecycle costs of an EV are already cheaper than an ICE vehicle. The average range of a new EV is now about 150 miles, with some models over 300 miles. And, Volkswagen’s diesel scandal settlement has funded a new Electrify America subsidiary which will invest $2 billion over the next ten years in EV charging infrastructure. Because the average American driver travels only 29 miles per day, most EV charging infrastructure will only be needed for long distance trips. Currently, 81% of all EV charging happens at home. ING, a Dutch investment bank, projects that the entire European car market will be fully electric by 2035. 11
In the next 2-3 years, our community will see a large number of affordable 200+ mile range EVs enter the market. Nearly every major automaker has made a public commitment to electrifying their fleet (see table below).
Carmaker Commitment/Proposed Investment in EVs Daimler $1 billion to build battery facility General Motors 20 all-electric models by 2023 Jaguar Land Rover Electrify* entire line by 2020 Mercedes-Benzes Electrify* portfolio by 2022 Renault-Nissan-Mitsubishi Alliance
Deploy 12 all-electric models by 2022
The VW Group $84 billion in EV development Volvo Electrify* entire fleet by 2019 Rivian and Tesla Electric trucks by 2021
*Auto companies consider traditional hybrids as electric vehicles, so an announcement that the entire fleet will be “electrified” is not an indication of only plug-in electric vehicles.
There are ways that Bellingham can speed up and encourage the shift to adopting electricity as a transportation fuel. The following measures represent research-supported actions for consideration.
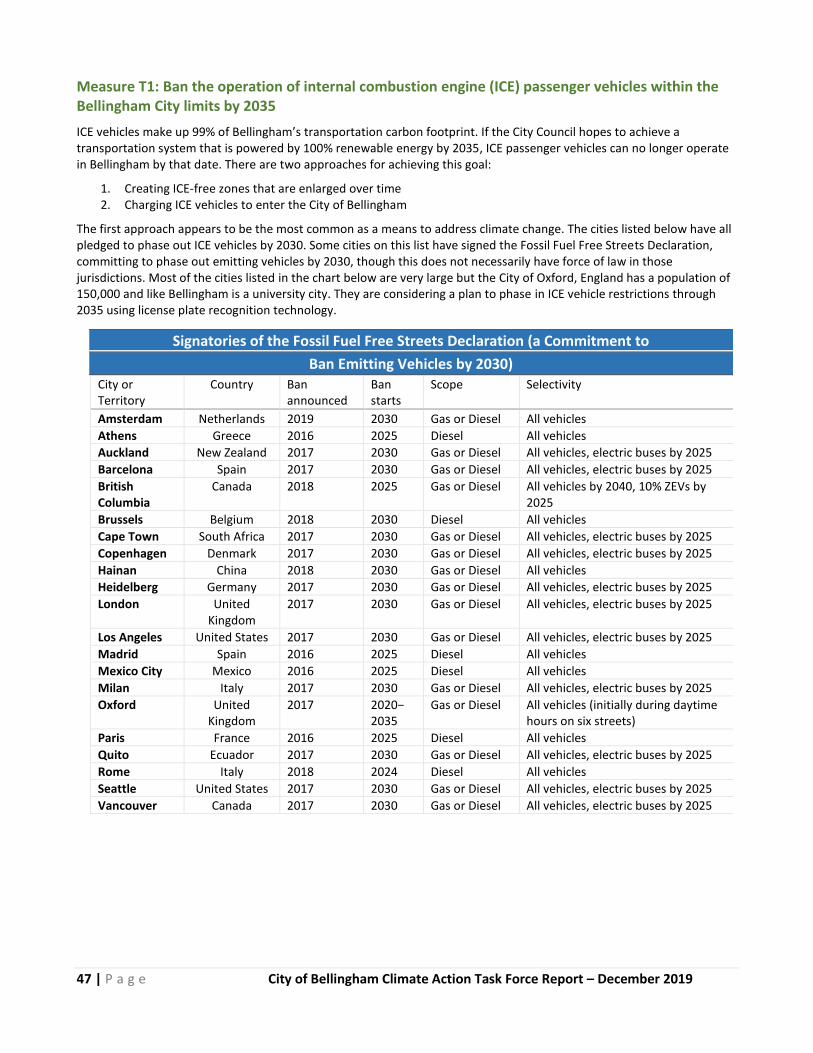
47 | P a g e City of Bellingham Climate Action Task Force Report – December 2019
Measure T1: Ban the operation of internal combustion engine (ICE) passenger vehicles within the Bellingham City limits by 2035
ICE vehicles make up 99% of Bellingham’s transportation carbon footprint. If the City Council hopes to achieve a transportation system that is powered by 100% renewable energy by 2035, ICE passenger vehicles can no longer operate in Bellingham by that date. There are two approaches for achieving this goal:
1. Creating ICE-free zones that are enlarged over time 2. Charging ICE vehicles to enter the City of Bellingham
The first approach appears to be the most common as a means to address climate change. The cities listed below have all pledged to phase out ICE vehicles by 2030. Some cities on this list have signed the Fossil Fuel Free Streets Declaration, committing to phase out emitting vehicles by 2030, though this does not necessarily have force of law in those jurisdictions. Most of the cities listed in the chart below are very large but the City of Oxford, England has a population of 150,000 and like Bellingham is a university city. They are considering a plan to phase in ICE vehicle restrictions through 2035 using license plate recognition technology.
Signatories of the Fossil Fuel Free Streets Declaration (a Commitment to
Ban Emitting Vehicles by 2030) City or Territory
Country Ban announced
Ban starts
Scope Selectivity
Amsterdam Netherlands 2019 2030 Gas or Diesel All vehicles
Athens Greece 2016 2025 Diesel All vehicles
Auckland New Zealand 2017 2030 Gas or Diesel All vehicles, electric buses by 2025
Barcelona Spain 2017 2030 Gas or Diesel All vehicles, electric buses by 2025
British Columbia
Canada 2018 2025 Gas or Diesel All vehicles by 2040, 10% ZEVs by 2025
Brussels Belgium 2018 2030 Diesel All vehicles
Cape Town South Africa 2017 2030 Gas or Diesel All vehicles, electric buses by 2025
Copenhagen Denmark 2017 2030 Gas or Diesel All vehicles, electric buses by 2025
Hainan China 2018 2030 Gas or Diesel All vehicles
Heidelberg Germany 2017 2030 Gas or Diesel All vehicles, electric buses by 2025
London United Kingdom
2017 2030 Gas or Diesel All vehicles, electric buses by 2025
Los Angeles United States 2017 2030 Gas or Diesel All vehicles, electric buses by 2025
Madrid Spain 2016 2025 Diesel All vehicles
Mexico City Mexico 2016 2025 Diesel All vehicles
Milan Italy 2017 2030 Gas or Diesel All vehicles, electric buses by 2025
Oxford United Kingdom
2017 2020− 2035
Gas or Diesel All vehicles (initially during daytime hours on six streets)
Paris France 2016 2025 Diesel All vehicles
Quito Ecuador 2017 2030 Gas or Diesel All vehicles, electric buses by 2025
Rome Italy 2018 2024 Diesel All vehicles
Seattle United States 2017 2030 Gas or Diesel All vehicles, electric buses by 2025
Vancouver Canada 2017 2030 Gas or Diesel All vehicles, electric buses by 2025
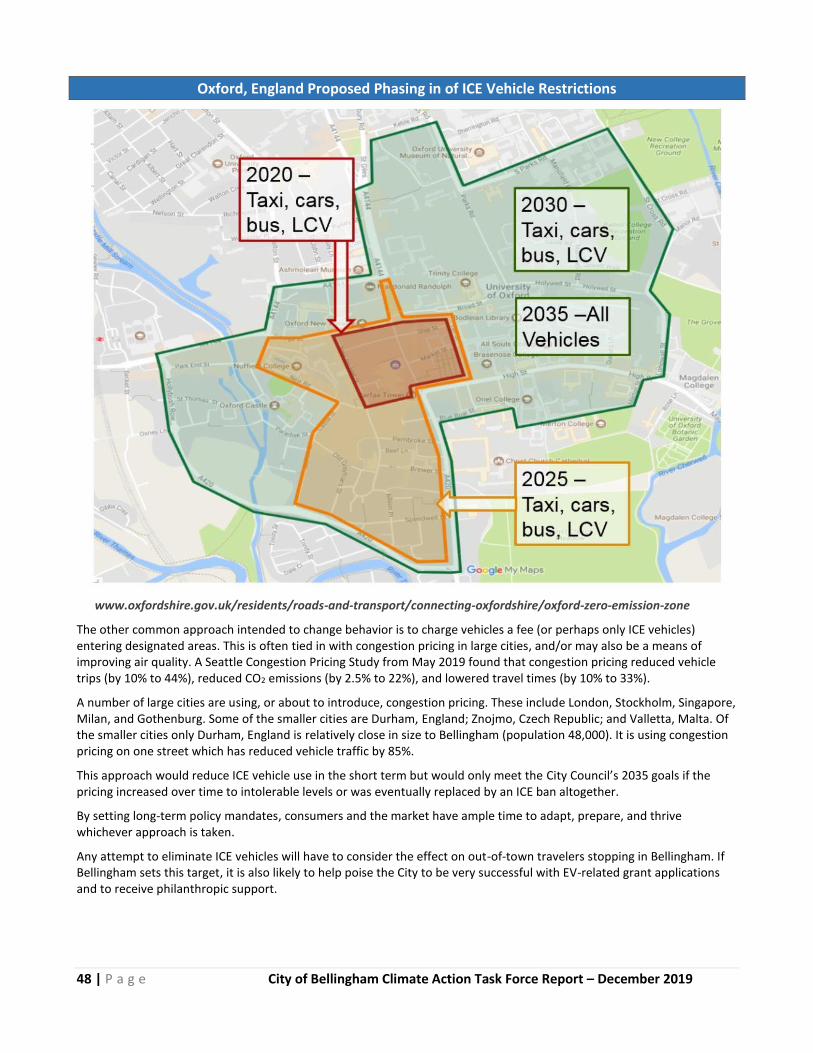
48 | P a g e City of Bellingham Climate Action Task Force Report – December 2019
Oxford, England Proposed Phasing in of ICE Vehicle Restrictions
www.oxfordshire.gov.uk/residents/roads-and-transport/connecting-oxfordshire/oxford-zero-emission-zone
The other common approach intended to change behavior is to charge vehicles a fee (or perhaps only ICE vehicles) entering designated areas. This is often tied in with congestion pricing in large cities, and/or may also be a means of improving air quality. A Seattle Congestion Pricing Study from May 2019 found that congestion pricing reduced vehicle trips (by 10% to 44%), reduced CO2 emissions (by 2.5% to 22%), and lowered travel times (by 10% to 33%).
A number of large cities are using, or about to introduce, congestion pricing. These include London, Stockholm, Singapore, Milan, and Gothenburg. Some of the smaller cities are Durham, England; Znojmo, Czech Republic; and Valletta, Malta. Of the smaller cities only Durham, England is relatively close in size to Bellingham (population 48,000). It is using congestion pricing on one street which has reduced vehicle traffic by 85%.
This approach would reduce ICE vehicle use in the short term but would only meet the City Council’s 2035 goals if the pricing increased over time to intolerable levels or was eventually replaced by an ICE ban altogether.
By setting long-term policy mandates, consumers and the market have ample time to adapt, prepare, and thrive whichever approach is taken.
Any attempt to eliminate ICE vehicles will have to consider the effect on out-of-town travelers stopping in Bellingham. If Bellingham sets this target, it is also likely to help poise the City to be very successful with EV-related grant applications and to receive philanthropic support.
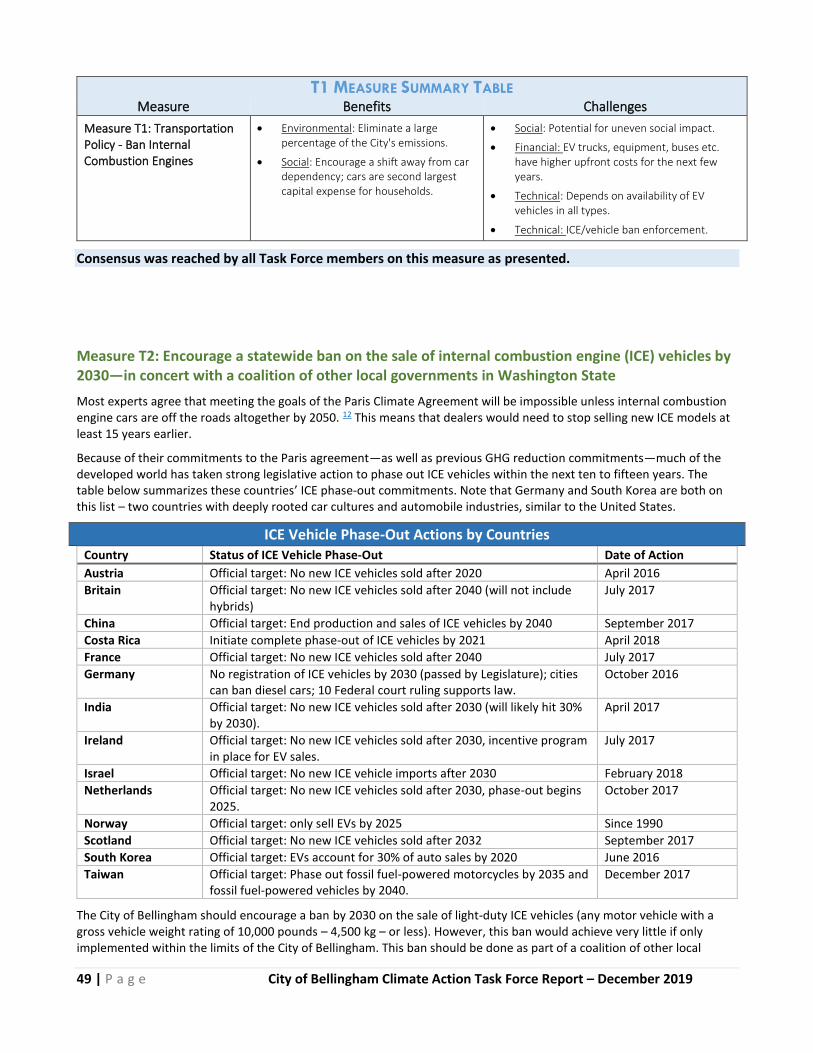
49 | P a g e City of Bellingham Climate Action Task Force Report – December 2019
T1 MEASURE SUMMARY TABLE
Measure Benefits Challenges
Measure T1: Transportation Policy - Ban Internal Combustion Engines
• Environmental: Eliminate a large percentage of the City's emissions.
• Social: Encourage a shift away from car dependency; cars are second largest capital expense for households.
• Social: Potential for uneven social impact.
• Financial: EV trucks, equipment, buses etc. have higher upfront costs for the next few years.
• Technical: Depends on availability of EV vehicles in all types.
• Technical: ICE/vehicle ban enforcement.
Consensus was reached by all Task Force members on this measure as presented.
Measure T2: Encourage a statewide ban on the sale of internal combustion engine (ICE) vehicles by 2030—in concert with a coalition of other local governments in Washington State
Most experts agree that meeting the goals of the Paris Climate Agreement will be impossible unless internal combustion engine cars are off the roads altogether by 2050. 12 This means that dealers would need to stop selling new ICE models at least 15 years earlier.
Because of their commitments to the Paris agreement—as well as previous GHG reduction commitments—much of the developed world has taken strong legislative action to phase out ICE vehicles within the next ten to fifteen years. The table below summarizes these countries’ ICE phase-out commitments. Note that Germany and South Korea are both on this list – two countries with deeply rooted car cultures and automobile industries, similar to the United States.
ICE Vehicle Phase-Out Actions by Countries Country Status of ICE Vehicle Phase-Out Date of Action
Austria Official target: No new ICE vehicles sold after 2020 April 2016
Britain Official target: No new ICE vehicles sold after 2040 (will not include hybrids)
July 2017
China Official target: End production and sales of ICE vehicles by 2040 September 2017
Costa Rica Initiate complete phase-out of ICE vehicles by 2021 April 2018
France Official target: No new ICE vehicles sold after 2040 July 2017
Germany No registration of ICE vehicles by 2030 (passed by Legislature); cities can ban diesel cars; 10 Federal court ruling supports law.
October 2016
India Official target: No new ICE vehicles sold after 2030 (will likely hit 30% by 2030).
April 2017
Ireland Official target: No new ICE vehicles sold after 2030, incentive program in place for EV sales.
July 2017
Israel Official target: No new ICE vehicle imports after 2030 February 2018
Netherlands Official target: No new ICE vehicles sold after 2030, phase-out begins 2025.
October 2017
Norway Official target: only sell EVs by 2025 Since 1990
Scotland Official target: No new ICE vehicles sold after 2032 September 2017
South Korea Official target: EVs account for 30% of auto sales by 2020 June 2016
Taiwan Official target: Phase out fossil fuel-powered motorcycles by 2035 and fossil fuel-powered vehicles by 2040.
December 2017
The City of Bellingham should encourage a ban by 2030 on the sale of light-duty ICE vehicles (any motor vehicle with a gross vehicle weight rating of 10,000 pounds – 4,500 kg – or less). However, this ban would achieve very little if only implemented within the limits of the City of Bellingham. This ban should be done as part of a coalition of other local

50 | P a g e City of Bellingham Climate Action Task Force Report – December 2019
governments that work to pass a statewide ban on the sale of ICE vehicles. Local governments with 100% renewables goals influenced state lawmakers when they were considering the Clean Electricity Bill. The Task Force believes local governments acting in concert on an ICE ban would be very effective at increasing the rate of adoption of electric vehicles statewide.
The Transportation and Land Use Work Group consulted representatives at statewide environmental organizations about this coalition approach and there was both affirmation that this approach could be successful, as well as interest in supporting an effort like this.
One of the benefits of a statewide ICE phase-out would be an increase in the availability of EV models in our state, and likely much before the full phase-out. Currently, there are 44 different EV make/model cars available in the US. However, most of these models are only available in the eight states that have Zero Emission Vehicle (ZEV) mandates. Here in Bellingham, only 4 or 5 EV models are routinely available.
The Task Force recognizes that this measure is a longer-term strategy.
T2 MEASURE SUMMARY TABLE
Measure Benefits Challenges
Measure T2: Transportation Policy - Ban Sale of Light Duty Internal Combustion Engines
• Environmental: Eliminate ICE emissions from light duty vehicles.
• Social: will increase the number of EV models available to residents.
• Social: Potential for uneven social impact.
• Technical: Depends on availability of EV vehicles.
Consensus was reached by all Task Force members on this measure as presented.
Measure T3: Impose a moratorium on the approval of applications for new gas station uses
If the City of Bellingham is phasing out the use of fossil fuels in all sectors, the City Council should impose a moratorium on the approval of applications for new gas stations. As the cost of lithium ion batteries drops and electricity becomes the primary transportation fuel, gas stations will become vacant; converting vacant gas stations to other land uses is costly. (Remediation costs vary dramatically from $25,000 to over $1,000,000 depending on the circumstances of the site).
The City of Petaluma – due to public activism against a proposed Safeway gas station development – recently imposed a moratorium on the approval of applications for new gas station uses and is currently exploring an update to their entire code that would prohibit new fossil fuel stations in all zones. 13
T3 MEASURE SUMMARY TABLE
Measure Benefits Challenges
Measure T3: Transportation Policy -New Gas Station Moratorium
• Financial: May stimulate EV charging infrastructure investment.
• Financial: Avoided costs.
• Environmental: Reduce ICE emissions.
• Social: Potential for uneven social impact.
• Financial: Impact to private enterprise.
High remediation costs already deter developers from investing in former gasoline retailer sites; these properties often remain vacant for many years.

51 | P a g e City of Bellingham Climate Action Task Force Report – December 2019
Consensus was reached by all Task Force members on this measure as presented.
Measure T4: Ordinance mandating that all local public transportation vehicles, both publicly and privately owned, in operation in the City of Bellingham be fully electric by 2035
The role of traditional public transportation agencies like WTA is in flux. Ridership nationwide is down substantially in the last few years and WTA is no exception. The major reasons most often cited are an increase in personal auto use; a strong economy; the growth in people working from home; and the introduction of Transportation Network Companies (TNC’s).
A recent paper submitted to the Transportation Research Board (TRB) titled “Understanding the Recent Transit Ridership Decline in Major US Cities: Service Cuts or Emerging Modes?” suggests that for each year after TNC’s enter a market, bus ridership can be expected to decrease by 1.7%. Also, this TNC effect builds with each passing year.
The figure below shows the changes in WTA’s ridership since 2005 as measured by passenger miles along with revenue miles of the fixed route buses in service and the net CO2 emissions of the fixed route fleet (emissions generated minus emissions saved).
With ridership falling in recent years and the amount of service provided increasing, WTA’s net CO2 emissions have shot up. Again, this is a national trend.
Change in Passenger Miles, Revenue Miles and Net CO2 emissions since 2005
For purposes of this report, it can be assumed that the 10-15-year future will look similar to the present with scheduled fixed routes and the paratransit service that mirrors it being the dominant modes of service.
WTA will be receiving their first two fixed route electric buses in 2020. Given that fixed route buses have a minimum 12-year lifespan for federal funding WTA could have its entire fleet fully electric by 2035. As the public transportation provider for Whatcom County with a strong environmental ethic this should be attainable. One challenge for WTA is the electrification of their fleet of paratransit buses (the small buses that serve elderly and disabled riders who can’t access the fixed route buses). Electric paratransit buses aren’t yet available. The bigger challenge however is funding.
Electric fixed route buses cost about twice that of a diesel bus. Fortunately, most, if not all, of the added expense is recovered over time with reduced maintenance and fueling costs. For WTA to replace its full fleet of fixed route diesel
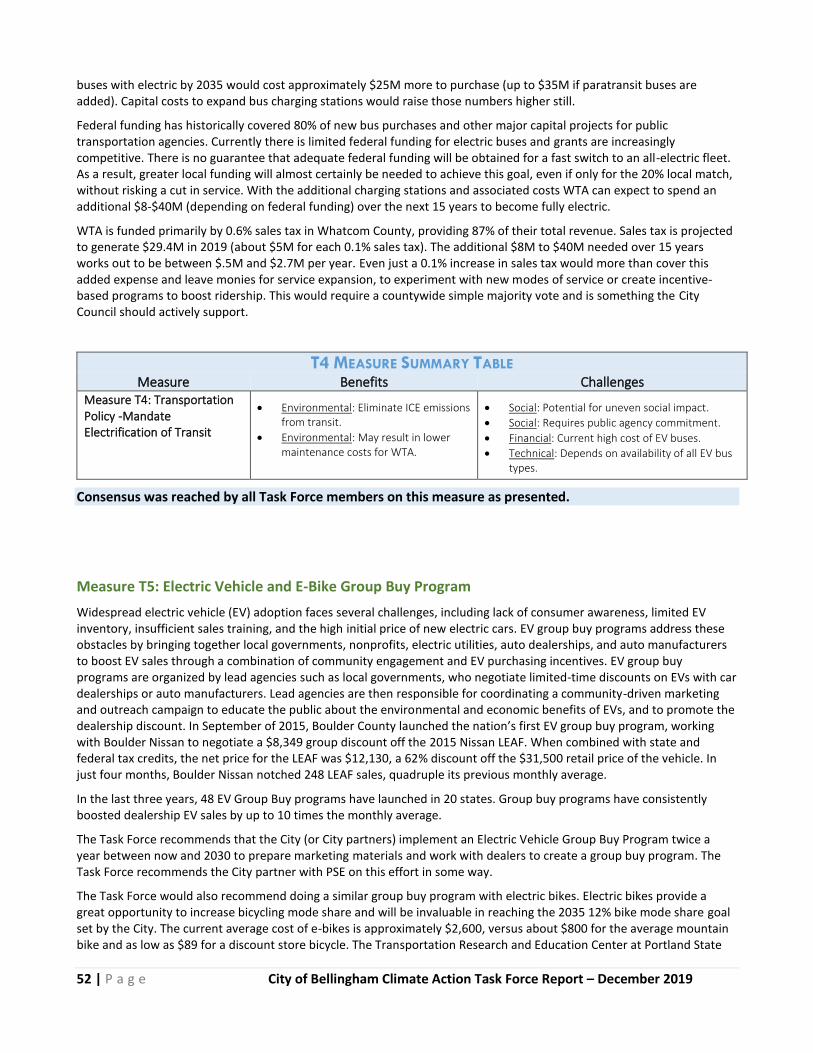
52 | P a g e City of Bellingham Climate Action Task Force Report – December 2019
buses with electric by 2035 would cost approximately $25M more to purchase (up to $35M if paratransit buses are added). Capital costs to expand bus charging stations would raise those numbers higher still.
Federal funding has historically covered 80% of new bus purchases and other major capital projects for public transportation agencies. Currently there is limited federal funding for electric buses and grants are increasingly competitive. There is no guarantee that adequate federal funding will be obtained for a fast switch to an all-electric fleet. As a result, greater local funding will almost certainly be needed to achieve this goal, even if only for the 20% local match, without risking a cut in service. With the additional charging stations and associated costs WTA can expect to spend an additional $8-$40M (depending on federal funding) over the next 15 years to become fully electric.
WTA is funded primarily by 0.6% sales tax in Whatcom County, providing 87% of their total revenue. Sales tax is projected to generate $29.4M in 2019 (about $5M for each 0.1% sales tax). The additional $8M to $40M needed over 15 years works out to be between $.5M and $2.7M per year. Even just a 0.1% increase in sales tax would more than cover this added expense and leave monies for service expansion, to experiment with new modes of service or create incentive-based programs to boost ridership. This would require a countywide simple majority vote and is something the City Council should actively support.
T4 MEASURE SUMMARY TABLE
Measure Benefits Challenges
Measure T4: Transportation Policy -Mandate Electrification of Transit
• Environmental: Eliminate ICE emissions from transit.
• Environmental: May result in lower maintenance costs for WTA.
• Social: Potential for uneven social impact.
• Social: Requires public agency commitment.
• Financial: Current high cost of EV buses.
• Technical: Depends on availability of all EV bus types.
Consensus was reached by all Task Force members on this measure as presented.
Measure T5: Electric Vehicle and E-Bike Group Buy Program
Widespread electric vehicle (EV) adoption faces several challenges, including lack of consumer awareness, limited EV inventory, insufficient sales training, and the high initial price of new electric cars. EV group buy programs address these obstacles by bringing together local governments, nonprofits, electric utilities, auto dealerships, and auto manufacturers to boost EV sales through a combination of community engagement and EV purchasing incentives. EV group buy programs are organized by lead agencies such as local governments, who negotiate limited-time discounts on EVs with car dealerships or auto manufacturers. Lead agencies are then responsible for coordinating a community-driven marketing and outreach campaign to educate the public about the environmental and economic benefits of EVs, and to promote the dealership discount. In September of 2015, Boulder County launched the nation’s first EV group buy program, working with Boulder Nissan to negotiate a $8,349 group discount off the 2015 Nissan LEAF. When combined with state and federal tax credits, the net price for the LEAF was $12,130, a 62% discount off the $31,500 retail price of the vehicle. In just four months, Boulder Nissan notched 248 LEAF sales, quadruple its previous monthly average.
In the last three years, 48 EV Group Buy programs have launched in 20 states. Group buy programs have consistently boosted dealership EV sales by up to 10 times the monthly average.
The Task Force recommends that the City (or City partners) implement an Electric Vehicle Group Buy Program twice a year between now and 2030 to prepare marketing materials and work with dealers to create a group buy program. The Task Force recommends the City partner with PSE on this effort in some way.
The Task Force would also recommend doing a similar group buy program with electric bikes. Electric bikes provide a great opportunity to increase bicycling mode share and will be invaluable in reaching the 2035 12% bike mode share goal set by the City. The current average cost of e-bikes is approximately $2,600, versus about $800 for the average mountain bike and as low as $89 for a discount store bicycle. The Transportation Research and Education Center at Portland State

53 | P a g e City of Bellingham Climate Action Task Force Report – December 2019
University recently put out a paper showing the different incentive programs available in the U.S. and around the world. According to a National Electric Bike Owner Survey, “Before the advent of e-bikes people would have used their cars for trips of five miles and more, but the range seems to have been extended by 80% on e-bikes.”
As with automobiles, the City could choose to initiate a group buy discount program. Other options include working with vendors to provide discounts, government or utility subsidies, and employer-based incentives. As an example, Thompson River University in Kamloops, British Columbia provides a 10% discount for employees to purchase an e-bike along with automatic payroll deductions. The Colorado Energy office prepared a detailed handbook for how to run an EV Group Buy Program.
Comparison of monthly sales from before vs during the programs
Brown = monthly sales before the program, green = monthly sales during the program Source: SWEEP, Electric Vehicle Group Buy Programs: Handbook & Case Studies
https://forthmobility.org/storage/app/media/Documents/Forth-Utility-White-Paper.pdf
T5 MEASURE SUMMARY TABLE
Measure Benefits Challenges
Measure T5: Transportation Policy -Transportation Electrification Programs
• Social: Increases EV availability for all.
• Environmental: Eliminates emissions vehicle by vehicle.
• Technical: Exists for most passenger vehicle types.
• Social: Engages car dealerships in transition to electrification.
• Financial: To be effective, needs to do Group Buy Programs for an adequate selection of EV vehicles.
• Technical: Underdeveloped for most truck and equipment types.
• Social: Like solarize programs, uptake is likely to come from upper middle-class households primarily.
Consensus was reached by all Task Force members on this measure as presented.

54 | P a g e City of Bellingham Climate Action Task Force Report – December 2019
Measure T6: Enhance requirements for New Construction to Include Electric Vehicle Supply Equipment/Conduit in Parking Areas
This recommendation is to add to the State Building Code as applied in Bellingham a requirement that new commercial, and multi-unit residential buildings install one EV charging station for each 5 stalls of new parking.
Approximately half of all vehicles in the U.S. belong to residents of single-family or duplex homes with access to a dedicated off-street parking space, such as a garage or driveway, which could be used for overnight EV charging. The other half of vehicles today do not have reliable access to a dedicated off-street parking space at a residence, so the EV market needs to move beyond single-family detached homes and expand charging access to multi-family unit dwellings, workplaces, and commercial properties. EV-ready building codes support this expansion and can save consumers thousands in installation costs.
EV-ready building codes are one of the most effective and low-cost strategies for states and local governments to encourage consumers to buy or lease electric vehicles. Washington State Building Code includes electric vehicle (EV) charging infrastructure requirements for office, hotel, and apartment uses. This applies to new buildings where the parking lot has at least 20 stalls. Of the total parking stalls, 5% need to be set up with EV charging infrastructure.
The actual charging stations do not need to be installed at the time of the build, but the electrical panel service capacity and raceways need to be installed so charging stations can be easily installed at a later date without major modifications to the building and/or site.
The electrical room needs to be designed to accommodate the future installation of EV charging stations at 20% of the total parking stalls. Again, this is so that charging stations can be easily installed at a later date without requiring major modifications to the building.
T6 MEASURE SUMMARY TABLE
Measure Benefits Challenges
Measure T6: Transportation Policy -Revise Building Code to require additional charging stations in new construction.
• Social: Supports EV ownership in multi-unit housing and businesses.
• Social: Creates a building amenity.
• Financial: Incurs minimal cost.
• Technical: Adding fast chargers may require upgrading of electrical infrastructure, and this has cost implications.
Consensus was reached by all Task Force members on this measure as presented.
Measure T7: Provide Incentives for adding EV charging stations to Existing Multifamily Complex Parking Areas
Some cities are incentivizing electric vehicle charging stations in multifamily complexes
EV Charging Station in Bellingham's Commercial St. Parking Garage

55 | P a g e City of Bellingham Climate Action Task Force Report – December 2019
The group “Plug-in NC” has put together a booklet titled Multifamily Housing Charging Station Installation Handbook. It could prove useful for determining how best to incentivize multifamily complex property owners to retrofit a portion of their available parking for EV charging.
In many cases a simple education effort for multifamily property managers might be enough. They can offer “Level 1 EV Charging” as an amenity to their tenants if they have 110 or 220 outlets in their parking garages.
T7 MEASURE SUMMARY TABLE
Measure Benefits Challenges
Measure T7: Transportation Policy -Promote and support adding EV charging stations in existing buildings.
• Social: Supports EV ownership in multi-unit housing and businesses.
• Social: Creates a building amenity.
• Financial: Incurs minimal cost.
• Social: Condominium buildings should be included but may present special issues as residents must agree to the change.
Consensus was reached by all Task Force members on this measure as presented.
Measure T8: TNC Electrification Program and TNC Charging Stations
Transportation-on-demand is a growing expectation for those without a vehicle or those who choose not to drive. local Transportation Network Companies (TNC’s), using data and knowledge from the transit industry, could create a shared ride program to provide more transportation choices. There is no need to duplicate WTA’s excellent service, but WTA cannot connect all origins and destinations in a timely manner. Since most TNC vehicles are currently ICE vehicles, the City in partnership with PSE and others should incentivize TNC drivers to transition to EVs. One incentive could be to install EV charging stations solely for TNC use. Additional support could be through promotion and public education of transit coordination opportunities.
T8 MEASURE SUMMARY TABLE
Measure Benefits Challenges
Measure T8: Transportation Policy -Support adding EV charging to incentivize TNC transition to electric vehicles.
• Social: Supports EV ownership for TNCs
• Social: Each ride in an EV TNC is an educational opportunity for passengers to learn about EVs (cheapest “ride and drive”).
• Social: There are siting challenges.
• Social: Challenging to enforce TNC-only charging.
Consensus was reached by all Task Force members on this measure as presented.

56 | P a g e City of Bellingham Climate Action Task Force Report – December 2019
SECTION 2: RECOMMIT TO THE CITY’S MODE SHIFT GOALS AND REIMAGINE HOW TO ACHIEVE THOSE GOALS
Background: In 2006, Bellingham adopted long-term transportation mode shift goals, which were updated and readopted in the 2016 Bellingham Comprehensive Plan.
Historic (2000-2014) and Long-Term (2016-2036) Transportation Mode Shift Goals
The data shows that single occupant vehicle commuting in the 2010-2014 period actually went up slightly compared to the 2005-2009 period – in spite of major initiatives undertaken by City staff. In recent years the City has made great progress in building out pedestrian and bicycle infrastructure. However, much more remains to be done but is limited by finances and staff time. In the 2016 update to the transportation element of the City’s Comprehensive Plan, more aggressive mode share targets were set. By 2036 the target for the percent of trips operated by single occupant vehicles is 50% – 117 percentage points below the current 67%. The greatest non-auto mode share increase is expected to be bicycling (from 4% to 12%). However, it can be assumed that more and more trips to be completed with “micro-mobility” devices (e.g., shared e-scooters) – which were not widely commercially available when the Comprehensive Plan was completed. Transit and pedestrian mode shares are also expected to see major increases.
For many decades in the United States, and in Bellingham, the modal hierarchy (see graphic to the right) was flipped the other way; cities were designed to accommodate single occupancy vehicles. However, in 2016, the City adopted a Complete Network Ordinance stating that priority would be placed on the most vulnerable user groups, as illustrated in the transportation modal hierarchy to the right.
This graphic illustrates the historic transportation mode share trends for work trips in Bellingham from 2000 through 2016 based on American Community Survey data published by the U.S. Census Bureau.
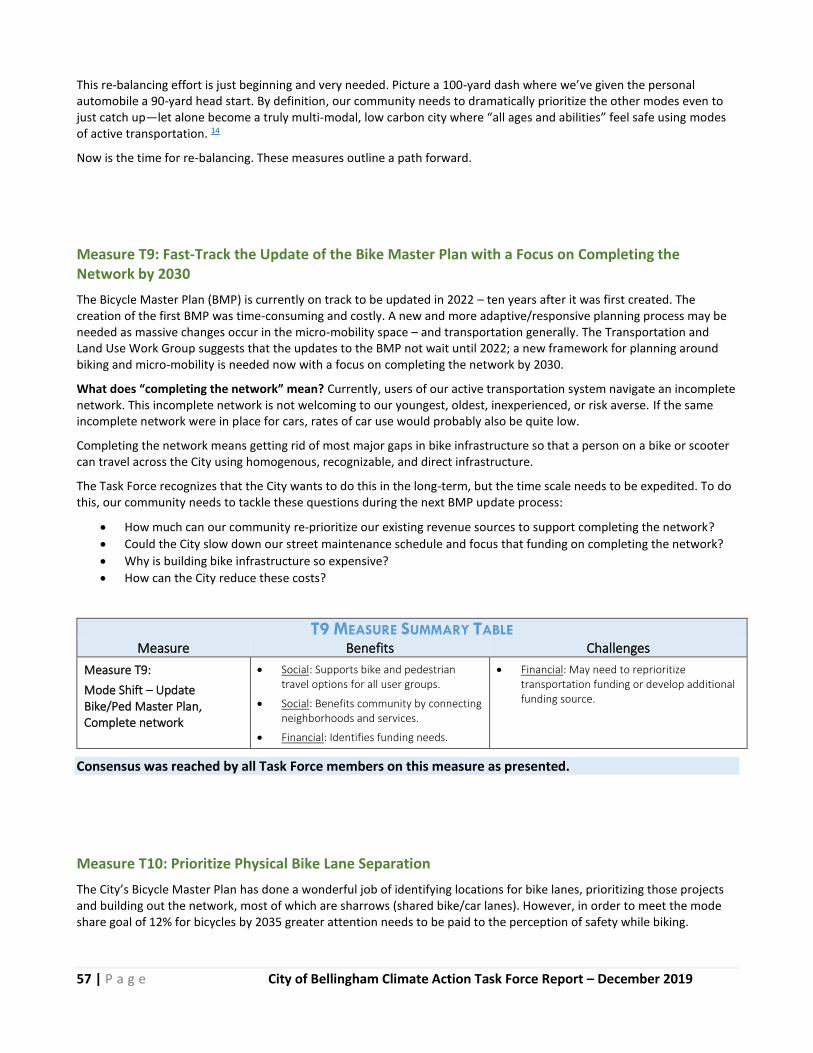
57 | P a g e City of Bellingham Climate Action Task Force Report – December 2019
This re-balancing effort is just beginning and very needed. Picture a 100-yard dash where we’ve given the personal automobile a 90-yard head start. By definition, our community needs to dramatically prioritize the other modes even to just catch up—let alone become a truly multi-modal, low carbon city where “all ages and abilities” feel safe using modes of active transportation. 14
Now is the time for re-balancing. These measures outline a path forward.
Measure T9: Fast-Track the Update of the Bike Master Plan with a Focus on Completing the Network by 2030
The Bicycle Master Plan (BMP) is currently on track to be updated in 2022 – ten years after it was first created. The creation of the first BMP was time-consuming and costly. A new and more adaptive/responsive planning process may be needed as massive changes occur in the micro-mobility space – and transportation generally. The Transportation and Land Use Work Group suggests that the updates to the BMP not wait until 2022; a new framework for planning around biking and micro-mobility is needed now with a focus on completing the network by 2030.
What does “completing the network” mean? Currently, users of our active transportation system navigate an incomplete network. This incomplete network is not welcoming to our youngest, oldest, inexperienced, or risk averse. If the same incomplete network were in place for cars, rates of car use would probably also be quite low.
Completing the network means getting rid of most major gaps in bike infrastructure so that a person on a bike or scooter can travel across the City using homogenous, recognizable, and direct infrastructure.
The Task Force recognizes that the City wants to do this in the long-term, but the time scale needs to be expedited. To do this, our community needs to tackle these questions during the next BMP update process:
• How much can our community re-prioritize our existing revenue sources to support completing the network?
• Could the City slow down our street maintenance schedule and focus that funding on completing the network?
• Why is building bike infrastructure so expensive?
• How can the City reduce these costs?
T9 MEASURE SUMMARY TABLE
Measure Benefits Challenges
Measure T9:
Mode Shift – Update Bike/Ped Master Plan, Complete network
• Social: Supports bike and pedestrian travel options for all user groups.
• Social: Benefits community by connecting neighborhoods and services.
• Financial: Identifies funding needs.
• Financial: May need to reprioritize transportation funding or develop additional funding source.
Consensus was reached by all Task Force members on this measure as presented.
Measure T10: Prioritize Physical Bike Lane Separation
The City’s Bicycle Master Plan has done a wonderful job of identifying locations for bike lanes, prioritizing those projects and building out the network, most of which are sharrows (shared bike/car lanes). However, in order to meet the mode share goal of 12% for bicycles by 2035 greater attention needs to be paid to the perception of safety while biking.
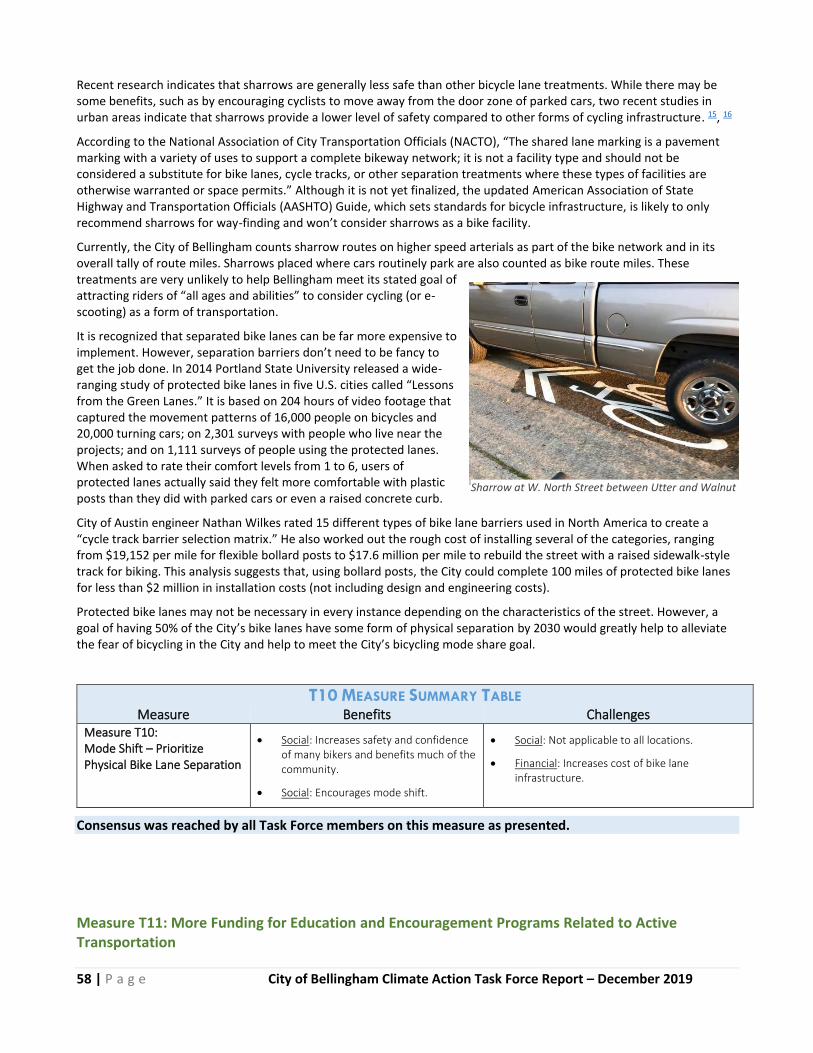
58 | P a g e City of Bellingham Climate Action Task Force Report – December 2019
Recent research indicates that sharrows are generally less safe than other bicycle lane treatments. While there may be some benefits, such as by encouraging cyclists to move away from the door zone of parked cars, two recent studies in urban areas indicate that sharrows provide a lower level of safety compared to other forms of cycling infrastructure. 15, 16
According to the National Association of City Transportation Officials (NACTO), “The shared lane marking is a pavement marking with a variety of uses to support a complete bikeway network; it is not a facility type and should not be considered a substitute for bike lanes, cycle tracks, or other separation treatments where these types of facilities are otherwise warranted or space permits.” Although it is not yet finalized, the updated American Association of State Highway and Transportation Officials (AASHTO) Guide, which sets standards for bicycle infrastructure, is likely to only recommend sharrows for way-finding and won’t consider sharrows as a bike facility.
Currently, the City of Bellingham counts sharrow routes on higher speed arterials as part of the bike network and in its overall tally of route miles. Sharrows placed where cars routinely park are also counted as bike route miles. These treatments are very unlikely to help Bellingham meet its stated goal of attracting riders of “all ages and abilities” to consider cycling (or e-scooting) as a form of transportation.
It is recognized that separated bike lanes can be far more expensive to implement. However, separation barriers don’t need to be fancy to get the job done. In 2014 Portland State University released a wide-ranging study of protected bike lanes in five U.S. cities called “Lessons from the Green Lanes.” It is based on 204 hours of video footage that captured the movement patterns of 16,000 people on bicycles and 20,000 turning cars; on 2,301 surveys with people who live near the projects; and on 1,111 surveys of people using the protected lanes. When asked to rate their comfort levels from 1 to 6, users of protected lanes actually said they felt more comfortable with plastic posts than they did with parked cars or even a raised concrete curb.
City of Austin engineer Nathan Wilkes rated 15 different types of bike lane barriers used in North America to create a “cycle track barrier selection matrix.” He also worked out the rough cost of installing several of the categories, ranging from $19,152 per mile for flexible bollard posts to $17.6 million per mile to rebuild the street with a raised sidewalk-style track for biking. This analysis suggests that, using bollard posts, the City could complete 100 miles of protected bike lanes for less than $2 million in installation costs (not including design and engineering costs).
Protected bike lanes may not be necessary in every instance depending on the characteristics of the street. However, a goal of having 50% of the City’s bike lanes have some form of physical separation by 2030 would greatly help to alleviate the fear of bicycling in the City and help to meet the City’s bicycling mode share goal.
T10 MEASURE SUMMARY TABLE
Measure Benefits Challenges
Measure T10: Mode Shift – Prioritize Physical Bike Lane Separation
• Social: Increases safety and confidence of many bikers and benefits much of the community.
• Social: Encourages mode shift.
• Social: Not applicable to all locations.
• Financial: Increases cost of bike lane infrastructure.
Consensus was reached by all Task Force members on this measure as presented.
Measure T11: More Funding for Education and Encouragement Programs Related to Active Transportation
Sharrow at W. North Street between Utter and Walnut
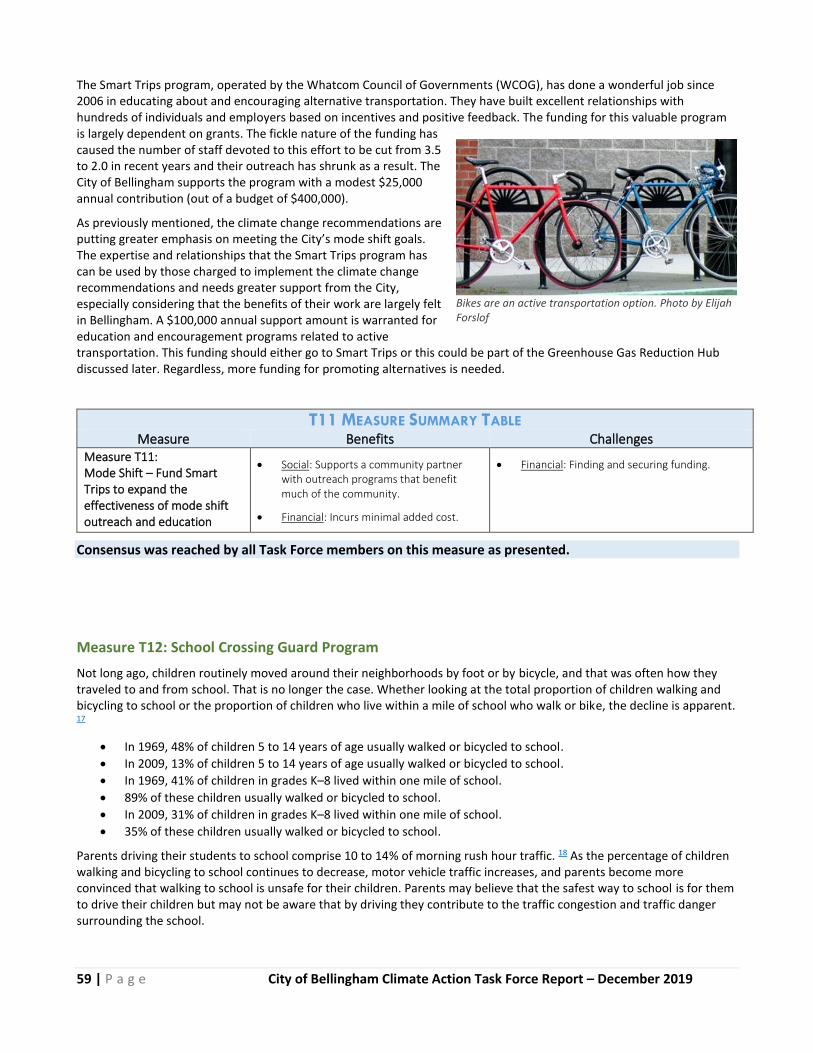
59 | P a g e City of Bellingham Climate Action Task Force Report – December 2019
The Smart Trips program, operated by the Whatcom Council of Governments (WCOG), has done a wonderful job since 2006 in educating about and encouraging alternative transportation. They have built excellent relationships with hundreds of individuals and employers based on incentives and positive feedback. The funding for this valuable program is largely dependent on grants. The fickle nature of the funding has caused the number of staff devoted to this effort to be cut from 3.5 to 2.0 in recent years and their outreach has shrunk as a result. The City of Bellingham supports the program with a modest $25,000 annual contribution (out of a budget of $400,000).
As previously mentioned, the climate change recommendations are putting greater emphasis on meeting the City’s mode shift goals. The expertise and relationships that the Smart Trips program has can be used by those charged to implement the climate change recommendations and needs greater support from the City, especially considering that the benefits of their work are largely felt in Bellingham. A $100,000 annual support amount is warranted for education and encouragement programs related to active transportation. This funding should either go to Smart Trips or this could be part of the Greenhouse Gas Reduction Hub discussed later. Regardless, more funding for promoting alternatives is needed.
T11 MEASURE SUMMARY TABLE
Measure Benefits Challenges
Measure T11: Mode Shift – Fund Smart Trips to expand the effectiveness of mode shift outreach and education
• Social: Supports a community partner with outreach programs that benefit much of the community.
• Financial: Incurs minimal added cost.
• Financial: Finding and securing funding.
Consensus was reached by all Task Force members on this measure as presented.
Measure T12: School Crossing Guard Program
Not long ago, children routinely moved around their neighborhoods by foot or by bicycle, and that was often how they traveled to and from school. That is no longer the case. Whether looking at the total proportion of children walking and bicycling to school or the proportion of children who live within a mile of school who walk or bike, the decline is apparent. 17
• In 1969, 48% of children 5 to 14 years of age usually walked or bicycled to school.
• In 2009, 13% of children 5 to 14 years of age usually walked or bicycled to school.
• In 1969, 41% of children in grades K–8 lived within one mile of school.
• 89% of these children usually walked or bicycled to school.
• In 2009, 31% of children in grades K–8 lived within one mile of school.
• 35% of these children usually walked or bicycled to school.
Parents driving their students to school comprise 10 to 14% of morning rush hour traffic. 18 As the percentage of children walking and bicycling to school continues to decrease, motor vehicle traffic increases, and parents become more convinced that walking to school is unsafe for their children. Parents may believe that the safest way to school is for them to drive their children but may not be aware that by driving they contribute to the traffic congestion and traffic danger surrounding the school.
Bikes are an active transportation option. Photo by Elijah Forslof
.
60 | P a g e City of Bellingham Climate Action Task Force Report – December 2019
Crossing guard programs have been showed to increase walking and biking – sometimes quite dramatically. Additionally, there is funding for such programs; the 2019-2021 Washington Safe Routes to School grant fund is $99,000,000.
The City should work closely with Bellingham Public Schools along with students and parents to include a crossing guard program as part of Safe Routes to School programs. A Bellingham Public Schools representative working on Safe Routes to School participated in one Transportation and Land Use Work Group meeting; more collaboration and technical assistance from the City could be helpful to the school district. Some Bellingham schools have had success developing parent-led walking and biking promotion programs, but not all schools have equal levels of volunteer support from parents.
Additionally, the Transportation and Land Use Work Group found examples of other school districts that require permits (e.g., a sticker placed in the corner of the windshield) for parents who want to regularly drop-off or pick-up their child. Permitting schemes are done in a range of ways. In one example, annual pricing was roughly $40 for one permit and $45 for a dual permit. Permitting could be done on a sliding scale. This permitting system could be used to directly fund the crossing guard program – while also encouraging transit, walking, and biking.
T12 MEASURE SUMMARY TABLE
Measure Benefits Challenges
Measure T12: Mode Shift – Partner with School District to develop Crossing Guard Program
• Social: Builds on current programs to provide safe biking and walking routes to neighborhood schools.
• Financial: Incurs minimal added cost.
• Financial: New program will need funding mechanism, such as a “drop off, pick up” permit program.
• Technical: Bellingham Public Schools may not support.
Consensus was reached by all Task Force members on this measure as presented.

61 | P a g e City of Bellingham Climate Action Task Force Report – December 2019
SECTION 3: REFORM PARKING POLICIES
Many cities across the United States are reforming their parking policies to make them more economically productive and socially just—while also using parking policy as a way to encourage low-carbon transportation and development patterns.
Car parking covers an astonishing percentage of urban land area. There are about 2 billion parking spots in the United States for roughly 250 million cars. The area of parking per car in the United States is thus larger than the area of housing per human. 19 Unlike housing, parking is currently free for about 99% of all car trips made in the United States.
As UCLA Urban Planning Professor Donald Shoup has famously stated: “It's unfair to have cities where parking is free for cars and housing is expensive for people.” Many of our current parking policies contribute to increased VMT, encourage sprawl, raise housing costs, degrade urban design, interfere with active transportation infrastructure, damage the economy, and penalize everyone who cannot afford a car. These measures aim to modernize and reform our parking policies—producing GHG reductions as well as a host of other benefits.
Measure T13: Change Parking Minimums to Parking Maximums for New Development
Parking minimums encourage car use and car dependency. According to research by Western Washington University student, Stanley Roper: “The Bellingham Municipal Code outlines the minimum parking space requirements landowners follow when constructing or updating buildings. Different use types dictate the minimum spaces required: residential parking requirements consider the number of units in a multi-family dwelling, while a commercial plot considers square footage open to the public. The 2016 Bellingham Comprehensive Plan acknowledges the limitations of these requirements several times in its Land Use, Community Design, and Multimodal Transportation chapters, suggesting a review of parking standards to reduce impact on urban form.” The Task Force suggests replacing parking minimums with parking maximums.
Parking minimums incentivize lower density development, which in turn increases the distances between destinations and makes it necessary to drive further distances.viii The image to the right shows a new housing development on E. Bakerview Road; the parking lot covers more area than the housing structure.
Removing minimum parking requirements could allow infill development on small properties which would otherwise be difficult to develop due to required parking. Increased density has been shown to reduce Vehicle Miles Traveled (VMT) and hence carbon emissions. The City would gain tax revenue when development occurs where there is now only surface parking. Furthermore, many experts are projecting steep declines in personal car ownership in the next 10 years as our community transitions to “transportation as a service.” By continuing to enforce parking minimums, the City runs the risk of requiring that developers provide an asset that may not be needed in the near future.
Removing parking minimums also could improve housing affordability in Bellingham. Construction is more affordable with fewer car parking spaces. A single parking stall can add up to $50,000 to total project costs for new construction. 20 One study found that parking minimums increase the cost of new housing by between 12% and 25%.
Lewiston, Maine—population 36,000--is launching a parking reform effort, including outreach and education.
A new development on E. Bakerview. Parking requirements cause cities to sprawl. Sprawl increases Vehicle Miles Traveled (VMT).
62 | P a g e City of Bellingham Climate Action Task Force Report – December 2019
T13 MEASURE SUMMARY TABLE Measure Benefits Challenges
Measure T13: Parking Policy – Parking Maximums
• Social – Cost savings from construction could be passed on to renters in form of lower rent.
• Social – Provides opportunity for highest and best land use.
• Social – Reduces spaces for car storage.
• Financial – Increases tax base.
• Social – May impact low income commuters until alternative transit modes are improved.
• Social: Development may slow down if developers believe it hinders occupancy.
Consensus was reached by all Task Force members on this measure as presented.
Measure T14: Ordinance Requiring Unbundled Parking in all Rental Housing
The cost of housing and the cost of parking a car should be separated—or “unbundled.”
Currently, 15% of renter households across Oregon and Washington own zero cars. 21 However, most of these renters pay for the cost of parking facilities in their rent.
By unbundling parking, the cost of vehicle storage would be made explicit. Separating or unbundling the two costs can lead to lower housing costs for households without cars since they would no longer be forced to pay for an amenity that they do not use. Furthermore, according to peer-reviewed research conducted at UCLA, unbundling parking could reduce VMT quite significantly because it would encourage more renters to live car-free or car-light lifestyles.
According to the research: “The presence of bundled parking is associated with a 27% increase in vehicle miles traveled. Bundled households drive approximately 3,800 miles more, spend nearly $580 more on gasoline, and emit 14.47 more metric tons of carbon dioxide per year. Bundled parking is also negatively correlated to transit use, and households with unbundled parking are significantly more likely to be frequent transit users. This provides further evidence for the already strong case against parking requirements.” 22
One of the concerns about unbundling parking is that renters will choose to not pay for parking and then park their cars on residential streets. This can be resolved with a car-free lease as well as a residential parking program described in the next measure.
T14 MEASURE SUMMARY TABLE Measure Benefits Challenges
Measure T14: Parking Policy – Unbundled Parking
• Social: Parking users will pay for parking.
• Social/Financial: Reduces housing costs for some households.
• Social: Existing parking may be made available for off-street public parking.
• Social: This will change existing structure of rental agreements.
Consensus was reached by all Task Force members on this measure as presented.
Measure T15: Residential Overnight Parking Permits

63 | P a g e City of Bellingham Climate Action Task Force Report – December 2019
Homeowners have property rights, but those do not extend into the public street. The City of Bellingham determines the best use for the street, and in many cases, that may be parking. In other cases, it may be for travel lanes or for fire-hydrant access, in which case on-street parking is prohibited. The property owner does not determine the best use of the street.
However, the root cause of most neighborhood parking disputes is fear of competition. People want “their” spot. Residential overnight parking permits work by restricting who may store a vehicle on the street overnight to only the people that live on that street or in that neighborhood. People who live on that street may obtain a permit for an annual fee.
An average parking space takes up about 180 square feet. The City should determine an annual price that is fair given the cost of land in our City. In Seattle, the current fee for a residential parking zone decal is $65 per vehicle. Guest permits, which can be transferred from vehicle to vehicle, cost $30. 23
Assuming that this measure was rolled out along with unbundling parking, residents that signed car-free leases in new buildings would be denied permit requests.
A similar program already exists in Bellingham for residents of the Downtown Business District.
T15 MEASURE SUMMARY TABLE Measure Benefits Challenges
Measure T15: Parking Policy – Unmetered On-street Parking Permit Fee
• Social: This will reduce fears about parking “competition” resulting from previous measures.
• Financial: Permit fees could pay for other mode shift programs.
• Social: Residential parking behavior will be disrupted.
• Financial: Cost of enforcement will be a challenge.
Consensus was reached by all Task Force members on this measure as presented.
Measure T16: Increase the Cost of Hourly Metered Parking and Increase Parking Ticket Fees
The City has a current metered parking program in Downtown. Most meters cost 75¢ per hour with a two-hour limit. On the outskirts of downtown, meters cost 25¢ per hour and have an 8-hour limit. These rates are too low. Consider this:
• A couple travels to Downtown Bellingham in a car. Direct transportation cost (assuming a 2-hour visit): $1.50
• A couple travels to Downtown Bellingham by taking the bus. Direct transportation cost: $4.00
Price signals have a very strong influence on travel behavior. Increasing the cost of parking downtown to equal or exceed the cost of bussing downtown would increase transit ridership and decrease VMT/emissions. Increased revenue from the revised downtown parking program should be reinvested in visible improvements on metered streets.
The cost of processing parking tickets exceeds the cost of a parking ticket (parking tickets are $17 and the cost to the City to issue and process a parking ticket is about $23). Parking ticket fees should be increased to at least be revenue neutral.
T16 MEASURE SUMMARY TABLE Measure Benefits Challenges
Measure T16: Parking Policy – Metered Parking Revenue
• Social: Parking users will pay for parking.
• Financial: Revenue will pay for parking services and may be used to support other transportation programs.
• Social: Residential parking behavior will be disrupted.
64 | P a g e City of Bellingham Climate Action Task Force Report – December 2019
• Social: May impact low-income commuters until alternative transit modes are improved.
Consensus was reached by all Task Force members on this measure as presented.
Measure T17: City Employee Parking Fee
If the City is to make parking rates better reflect actual costs and incentivize alternatives it must lead by example.
The City’s internal parking policies for employees should reflect best practices (e.g., a pay per day parking system)—to encourage low-carbon mode shift. As it is now staff that do not drive miss out on a free benefit.
T17 MEASURE SUMMARY TABLE Measure Benefits Challenges
Measure T17: Parking Policy – City Employee Parking
• Social: Provides an example for other community employers.
• Social: Encourages mode shift.
• Financial: Incurs minimal added cost.
• Social: Some employees may need accommodation.
Consensus was reached by all Task Force members on this measure as presented.
Measure T18: Free Parking for Electric Vehicles
The use of electric vehicles needs to be encouraged wherever possible. Allowing electric vehicles to park for free sends a strong signal about Bellingham’s priorities. Since parking is never actually free, parking fees for electric vehicles would be gradually reinstated as their use increases.
T18 MEASURE SUMMARY TABLE Measure Benefits Challenges
Measure T18: Parking Policy – Free Parking
• Social: Provides an incentive for EV use.
• Financial: Some lost parking revenue in the short term.
• Social: Primarily benefits higher income EV owning drivers.
Consensus was reached by all Task Force members on this measure as presented.

65 | P a g e City of Bellingham Climate Action Task Force Report – December 2019
SECTION 4: IMPLEMENTATION AND FUNDING FOR RECOMMENDATIONS
Measure T19: Fundraising Effort
Bellingham could attract private funding to do this work. Many foundations and philanthropic funds working on climate efforts are sunsetting. The City of Bellingham should hire a full-time grant writer/fundraiser to develop a fund to do this work. Partnerships with local banks and Community Development Financial Institutions (CFDIs) could also be a possibility for funding certain measures – like the group-buy.
Consensus was reached by all Task Force members on this measure as presented.
Measure T20: Extend the Transportation Benefit District (TBD) and Dedicate a Portion of Future Funds to Implement the Approved Measures
Transportation Benefit Districts (TBDs) are separate legal entities that are created by cities or counties under Chapter 36.73 RCW for the purpose of financing their transportation improvements. The TBD was established in 2010 during the last recession to better fund street maintenance, bicycle and pedestrian improvements and provide temporary funding for WTA to restore Sunday bus service. It added 0.2% to the sales tax in the city and expires in 2020. For the TBD to be continued a citywide vote is required (it passed with 58% yes in 2010).
The city does not have an adequate street maintenance fund without the TBD. In addition, the need to continue to build out pedestrian and bicycling improvements is entirely consistent with the Climate Change goals. Therefore, it is hoped that the TBD will be brought up for a new vote in 2020. Much of the TBD funding already goes to building out pedestrian and bicycling infrastructure and should be continued. However, some portion could also be set aside for funding staffing of the Greenhouse Gas Reduction Hub.
Consensus was reached by all Task Force members on this measure as presented.
Measure T21: Whatcom County Greenhouse Gas Reduction Hub
The City of Bellingham does not have adequate staff to implement these measures. The Task Force proposes creating a new position reporting directly to the Mayor (or a broader entity if other jurisdictions/ agencies are involved) whose function is to implement the transportation Climate Action Task Force recommendations approved by the City Council. In addition, this new position would coordinate closely with Whatcom County, WTA, WWU and others that are also working on reducing transportation-related GHG emissions. The Task Force suggests that the newly formed position work closely with private Transportation Network Companies (such as Uber and Lyft), private micro-mobility operators, private bus coaches (e.g., Bolt/Greyhound), and other private sector companies along with the public sector entities mentioned above.
Consensus was reached by all Task Force members on this measure as presented.
For additional information, please click on the following references: 24, 25, 26, 27

66 | P a g e City of Bellingham Climate Action Task Force Report – December 2019
CHAPTER 6: LAND USE
INTRODUCTION
The Transportation and Land Use Work Group addressed the related issues of land use and researched best practices in residential family zoning, urban villages, and Smart Growth as they apply to mitigating climate change.
The most recent IPCC report in August 2019, Climate Change and Land, contains extensive insight into how our stewardship of land impacts the environment. Deforestation, unsustainable agricultural practices, drought, and rising temperatures are interconnected, the report shows—and rapid, large-scale change is essential to preventing the worst impacts of the climate crisis.
The report also makes clear that living within our means doesn’t just mean cutting carbon emissions. Humans have to change how we oversee, develop, and interact with land. And part of that effort can start with cities, and specifically with the way cities encourage or discourage density and affordable housing.
The IPCC Report in August 2019 indicates that mutually supportive climate and land policies have the potential to save resources, amplify social resilience, support ecological restoration, and foster engagement and collaboration between multiple stakeholders. Delaying climate mitigation and adaptation responses across sectors would lead to increasingly negative impacts on land and reduce the prospect of sustainable development.
The Report goes on to make a case for sustainability “coupled with early action offers the best chances to tackle climate change.”
The focus of the Transportation and Land Use Work Group was on how to simultaneously increase compact development and livability as one way to mitigate climate change. The City can allow for opportunities to increase housing density and residential multi-family housing options as well as provide for compact, transit-oriented, walkable, bicycle-friendly land use that can increase the mix of available and affordable housing and transportation choices. These concepts tie in well with climate action planning because if land use impacts people so they are driving less and have access to public transportation, it also reduces the effects on our climate.
Smart growth zoning concentrates growth in compact, walkable urban centers to avoid sprawl. It also advocates for neighborhood schools, complete streets, and mixed-use development with a range of housing choices.
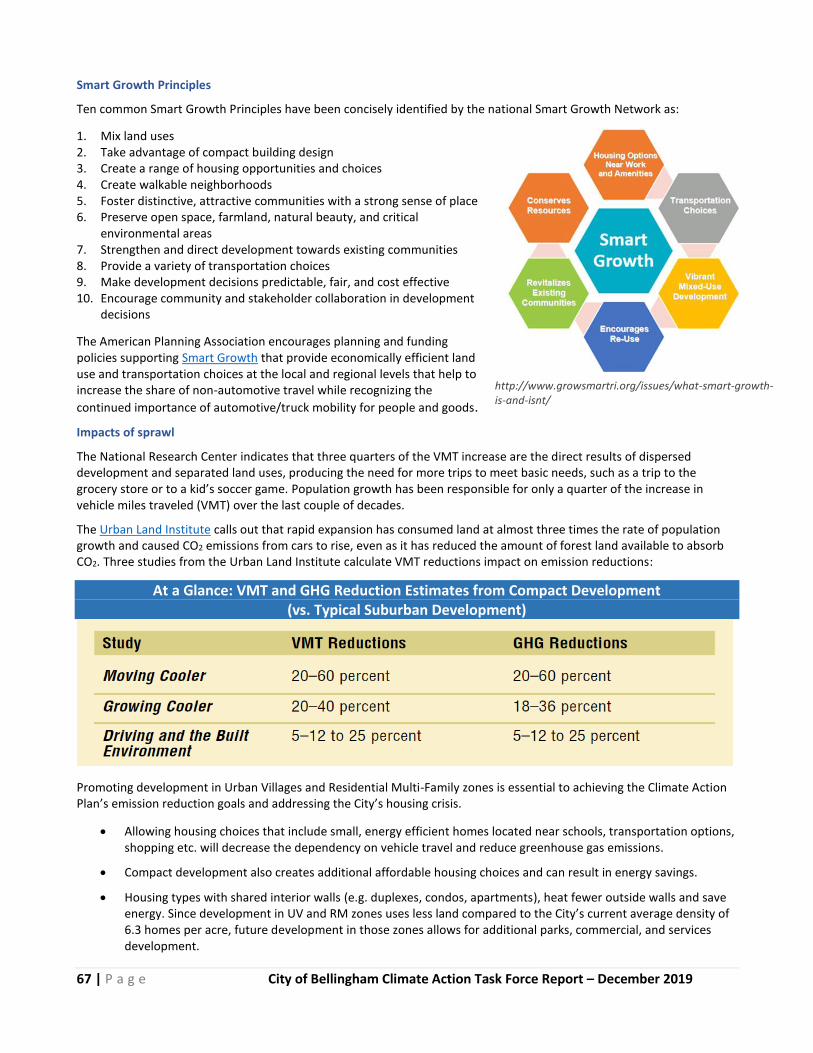
67 | P a g e City of Bellingham Climate Action Task Force Report – December 2019
Smart Growth Principles
Ten common Smart Growth Principles have been concisely identified by the national Smart Growth Network as:
1. Mix land uses 2. Take advantage of compact building design 3. Create a range of housing opportunities and choices 4. Create walkable neighborhoods 5. Foster distinctive, attractive communities with a strong sense of place 6. Preserve open space, farmland, natural beauty, and critical
environmental areas 7. Strengthen and direct development towards existing communities 8. Provide a variety of transportation choices 9. Make development decisions predictable, fair, and cost effective 10. Encourage community and stakeholder collaboration in development
decisions
The American Planning Association encourages planning and funding policies supporting Smart Growth that provide economically efficient land use and transportation choices at the local and regional levels that help to increase the share of non-automotive travel while recognizing the
continued importance of automotive/truck mobility for people and goods.
Impacts of sprawl
The National Research Center indicates that three quarters of the VMT increase are the direct results of dispersed development and separated land uses, producing the need for more trips to meet basic needs, such as a trip to the grocery store or to a kid’s soccer game. Population growth has been responsible for only a quarter of the increase in vehicle miles traveled (VMT) over the last couple of decades.
The Urban Land Institute calls out that rapid expansion has consumed land at almost three times the rate of population growth and caused CO2 emissions from cars to rise, even as it has reduced the amount of forest land available to absorb CO2. Three studies from the Urban Land Institute calculate VMT reductions impact on emission reductions:
At a Glance: VMT and GHG Reduction Estimates from Compact Development (vs. Typical Suburban Development)
Promoting development in Urban Villages and Residential Multi-Family zones is essential to achieving the Climate Action Plan’s emission reduction goals and addressing the City’s housing crisis.
• Allowing housing choices that include small, energy efficient homes located near schools, transportation options, shopping etc. will decrease the dependency on vehicle travel and reduce greenhouse gas emissions.
• Compact development also creates additional affordable housing choices and can result in energy savings.
• Housing types with shared interior walls (e.g. duplexes, condos, apartments), heat fewer outside walls and save energy. Since development in UV and RM zones uses less land compared to the City’s current average density of 6.3 homes per acre, future development in those zones allows for additional parks, commercial, and services development.
http://www.growsmartri.org/issues/what-smart-growth-is-and-isnt/
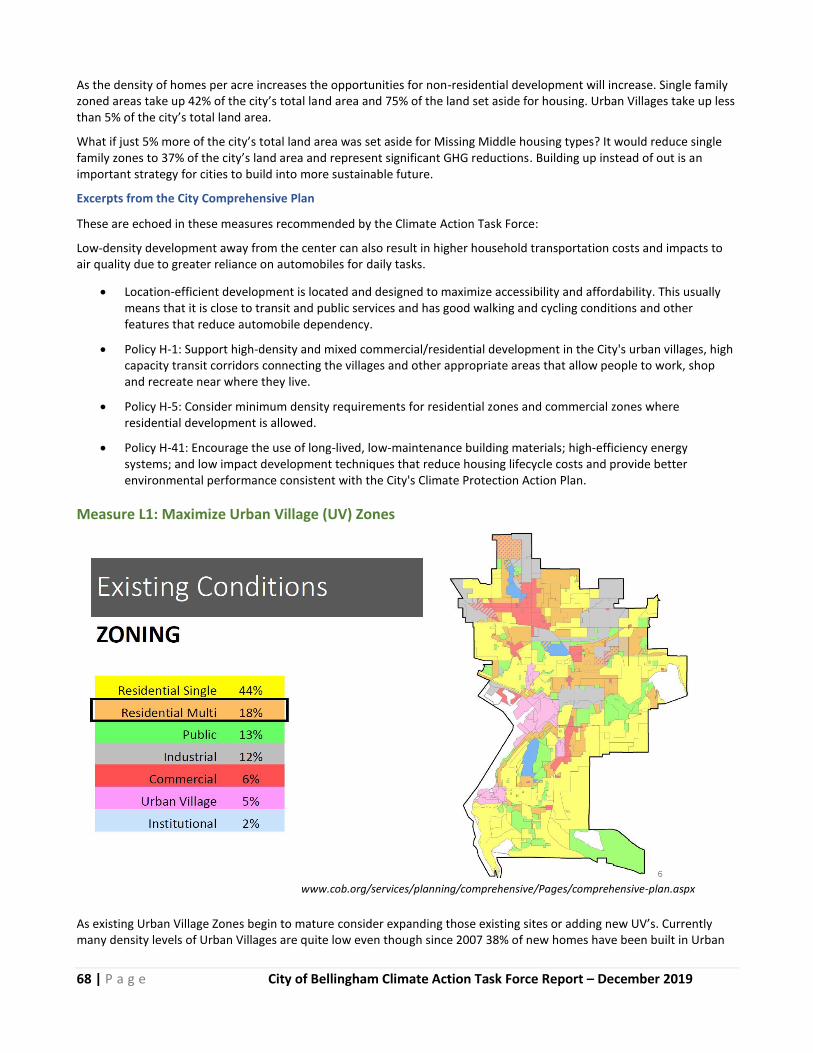
68 | P a g e City of Bellingham Climate Action Task Force Report – December 2019
As the density of homes per acre increases the opportunities for non-residential development will increase. Single family zoned areas take up 42% of the city’s total land area and 75% of the land set aside for housing. Urban Villages take up less than 5% of the city’s total land area.
What if just 5% more of the city’s total land area was set aside for Missing Middle housing types? It would reduce single family zones to 37% of the city’s land area and represent significant GHG reductions. Building up instead of out is an important strategy for cities to build into more sustainable future.
Excerpts from the City Comprehensive Plan
These are echoed in these measures recommended by the Climate Action Task Force:
Low-density development away from the center can also result in higher household transportation costs and impacts to air quality due to greater reliance on automobiles for daily tasks.
• Location-efficient development is located and designed to maximize accessibility and affordability. This usually means that it is close to transit and public services and has good walking and cycling conditions and other features that reduce automobile dependency.
• Policy H-1: Support high-density and mixed commercial/residential development in the City's urban villages, high capacity transit corridors connecting the villages and other appropriate areas that allow people to work, shop and recreate near where they live.
• Policy H-5: Consider minimum density requirements for residential zones and commercial zones where residential development is allowed.
• Policy H-41: Encourage the use of long-lived, low-maintenance building materials; high-efficiency energy systems; and low impact development techniques that reduce housing lifecycle costs and provide better environmental performance consistent with the City's Climate Protection Action Plan.
Measure L1: Maximize Urban Village (UV) Zones
As existing Urban Village Zones begin to mature consider expanding those existing sites or adding new UV’s. Currently many density levels of Urban Villages are quite low even though since 2007 38% of new homes have been built in Urban
www.cob.org/services/planning/comprehensive/Pages/comprehensive-plan.aspx
69 | P a g e City of Bellingham Climate Action Task Force Report – December 2019
Villages. In order to increase the use of UV zones the Task Force supports minimum density requirements and incentives such as increasing the Floor Area Ratio (FAR) to allow more residential units.
It may be cross-purposes for the City to prematurely expand existing UV’s and/or increase density as there is limited annual adsorption and construction capacity in our market and limited supporting public infrastructure funding available. However, as existing UV begin to mature, the expansion of existing sites and/or the establishment of other UV’s should be considered.
L1 MEASURE SUMMARY TABLE Measure Benefits Challenges
Measure L1: Maximize Urban Village (UV) Zones
• Social: Increasing density decreases VMT, attracts services and jobs, provides affordable housing and supports public health.
• Social: Compact development reduces the cost of municipal services
• Environmental: 20% - 60% reduction in GHG emissions
• Social: Consistent with 2016 Comp Plan City Council directives.
• Social: Supported by multiple, diverse organizations in Whatcom Housing Alliance
• Social: May impact other zoning designations
• Social: Would require public education to alleviate fear of change and dispel myths.
• Social: Would provide incentives such as reducing parking requirements, FAR bonuses.
• Social: May be opposed by nearby residences.
Consensus was reached by all Task Force members on this measure as presented.
Measure L2: Increase Density in Transition/Residential Multi-Family (a.k.a. Missing Middle) Zones
The City’s Comprehensive Plan, Land Use Chapter refers to Residential Multi-Family zones as “intended for areas that are
able to support higher concentrations of people, while encouraging a desirable living environment within and adjacent to
these districts. This zoning also provides a compatible mixture of residential housing types, typical accessory uses, public
and semi-public uses, office uses and limited neighborhood commercial uses in appropriate areas.”
Many refer to this density level as ‘Middle or Missing Middle’ because it is relatively rare in our cities and towns. This level
of density, design and character can fit very well in transition zones between Downtown/Urban Villages and less dense
residential single detached areas. This is the kind of development that will result in a 20% reduction in GHG emissions.
However, current regulations do not facilitate development at the allowed density in many of the RM zones. Those RM
designated areas are being built out with uses other than the multi residential use anticipated by the zoning. Only 31% of
RM Zones are used for residential multi housing. Single detached housing occupies 25% of RM zoned land area. This
underutilization trend could be slowed and perhaps reversed by adopting regulatory changes proposed by the Climate
Action Task Force Transportation and Land Use Work Group and also recently included in a City Planning Department
presentation to City Council.

70 | P a g e City of Bellingham Climate Action Task Force Report – December 2019
The Task Force therefore supports:
1) Establishing minimum densities for RM zones to ensure that development is focused on providing compact housing;
2) Providing density bonuses for projects in “efficient locations” close to transit, shopping, schools and parks;
3) Simplifying and standardizing the zoning rules of the RM areas to allow maximum density development within each RM; and
4) Adding housing types to the Infill Housing Toolkit and allowing use of the Infill Toolkit in all RM zones. Additional changes may also be needed to realize the intended development densities of the RM zones.
The Urban Village Status Report published in November 2018, provides information about the City of Bellingham’s urban villages which together comprise 3.8% of the city’s total land area.
Asterisks indicate Urban Villages. Residential Multi zones close to parks, schools, WTA Go Lines and grocery stores are
efficient locations should get a density bonus and may need other incentives/requirements to reach desired built density
goals.
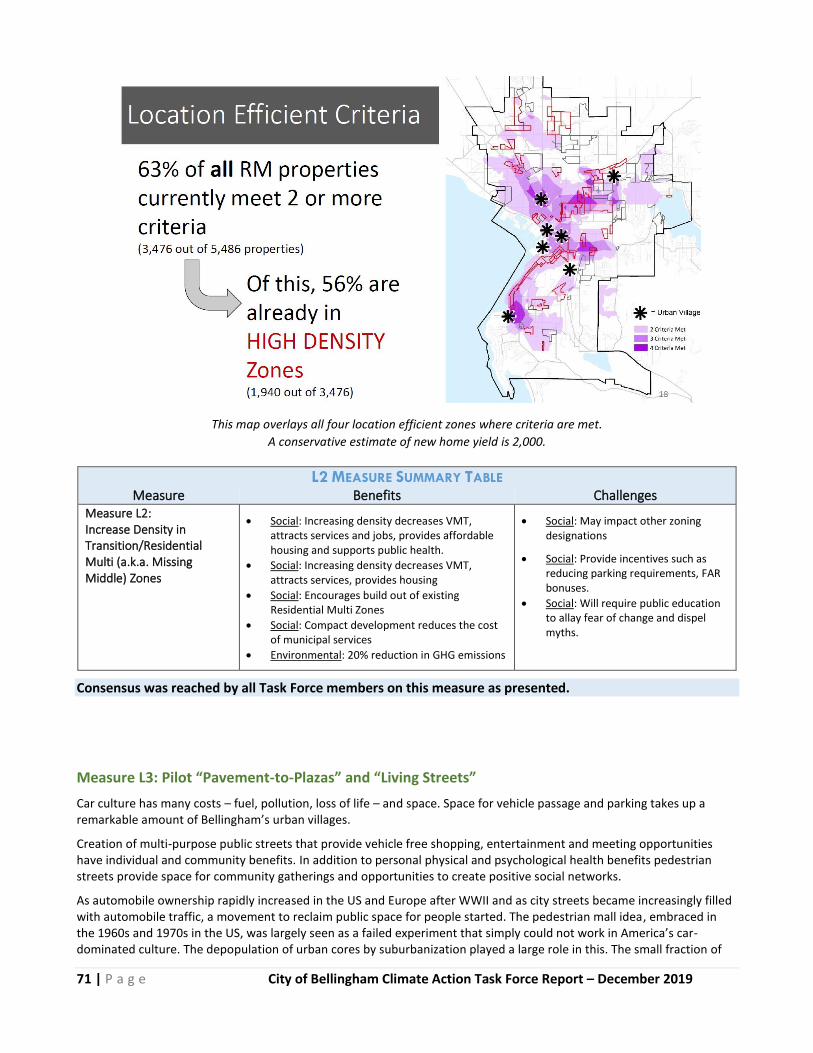
71 | P a g e City of Bellingham Climate Action Task Force Report – December 2019
This map overlays all four location efficient zones where criteria are met.
A conservative estimate of new home yield is 2,000.
L2 MEASURE SUMMARY TABLE Measure Benefits Challenges
Measure L2: Increase Density in Transition/Residential Multi (a.k.a. Missing Middle) Zones
• Social: Increasing density decreases VMT, attracts services and jobs, provides affordable housing and supports public health.
• Social: Increasing density decreases VMT, attracts services, provides housing
• Social: Encourages build out of existing Residential Multi Zones
• Social: Compact development reduces the cost of municipal services
• Environmental: 20% reduction in GHG emissions
• Social: May impact other zoning designations
• Social: Provide incentives such as reducing parking requirements, FAR bonuses.
• Social: Will require public education to allay fear of change and dispel myths.
Consensus was reached by all Task Force members on this measure as presented.
Measure L3: Pilot “Pavement-to-Plazas” and “Living Streets”
Car culture has many costs – fuel, pollution, loss of life – and space. Space for vehicle passage and parking takes up a remarkable amount of Bellingham’s urban villages.
Creation of multi-purpose public streets that provide vehicle free shopping, entertainment and meeting opportunities have individual and community benefits. In addition to personal physical and psychological health benefits pedestrian streets provide space for community gatherings and opportunities to create positive social networks.
As automobile ownership rapidly increased in the US and Europe after WWII and as city streets became increasingly filled with automobile traffic, a movement to reclaim public space for people started. The pedestrian mall idea, embraced in the 1960s and 1970s in the US, was largely seen as a failed experiment that simply could not work in America’s car-dominated culture. The depopulation of urban cores by suburbanization played a large role in this. The small fraction of

72 | P a g e City of Bellingham Climate Action Task Force Report – December 2019
pedestrian malls that remained operational in the US have experienced long-term success because of adding a mix of uses including restaurants, entertainment venues and, most importantly, residential properties.
Today, pedestrian malls—or plazas—are on the rise again. Many studies show that “Millennials” and the baby-boomer generation increasingly want to live in compact, walkable communities that offer easy access to services and are thus moving back into downtown business districts.
There are a range of studies showing that heavily restricting or eliminating car traffic to create a plaza or “place” has been associated with an increase in retail sales. Project for Public Spaces provides many examples of cities that have reclaimed street space for vibrant public spaces. Less noise and air pollution, a pleasant pedestrian environment with its health benefits and other amenities like sidewalk cafes, fountains, play structures, or street furniture helps create an area that becomes an attraction.
The Navigating Main Streets as Places Toolkit, provides, "a powerful vision for a street [that] is rooted in the power of all its people. By taking the time to humbly communicate, evaluate, and co-create visions together, our streets can become powerful places to be, to move through, and to build our community's life around."
In order to help demonstrate how reclaiming space currently dedicated to cars can benefit our community, the City should accept applications from local business groups and neighborhood associations to temporarily close streets down to car traffic for several weeks or even a season. Closed streets can be used as temporary plazas or “living streets.” As these pilots advance awareness of the benefits of car-free spaces – the City should work with local businesses and the Downtown Bellingham Partnership to close Railroad Avenue in downtown to car-traffic permanently.
L3 MEASURE SUMMARY TABLE Measure Benefits Challenges
Measure L3: Pilot “Pavement-to-Plazas” and “Living Streets”
• Social: More public space to be enjoyed by more people.
• Financial: Increased retail sales and economic activity.
• Financial: Increased property values
• Environmental: More shopping and entertainment by foot, less VMT
• Social: Public education, fear of change and dispelling myths.
• Financial: Public infrastructure costs
Consensus was reached by all Task Force members on this measure as presented.
Pearl Street Mall Photo credit: YourBoulder.com
73 | P a g e City of Bellingham Climate Action Task Force Report – December 2019
CHAPTER 7: ENERGY SUPPLY
INTRODUCTION
The Energy Supply Work Group was organized to include all members of the Task Force in order to utilize the full range of their expertise in the discussion and construction of the energy supply recommendations. That input was useful in identifying energy supply measures that can displace the remaining fossil fuel use in the City’s energy supply and help implement some of the measures developed by the other work groups.
The Energy Supply Work Group also met with staff and consulted with community and regional resources to gain information on energy supply issues, including suggestions for measures to include in this report. Several of the measures from those initial discussions were identified as existing Transportation or Building Work Group measures and were shifted to those chapters written by those work groups.
Bellingham’s electricity and natural gas supply is provided by Puget Sound Energy (PSE) and Cascade Natural Gas (CNG). In 2018, PSE provided approximately 734,626 MWh of electricity. CNG provided 4,868,919 dekatherms of natural gas from June 2018 through May 2019 for the reported “Bellingham Gateway”, which includes more than just Bellingham.
Bellingham has over 1,300 residential and business installed solar arrays that represent 8.5 MW of electricity. PSE and CNG are winter peaking utilities, with peak loads about two times the average annual energy demand. PSE and CNG winter peaks are of limited duration, driven by cold weather and thus generally coincide and are predictable. Electric water heaters, and gas and electric space heating and large appliances are the largest contributors to peak loads. Utilities like PSE are required by the North American Electric Reliability Corporation (NERC) to plan the electric power system to ensure the power system equipment does not overload and no voltage violations occur at peak load conditions.
Bellingham citizens have demonstrated a commitment to renewable energy by participating in PSE’s Green Power program, with over 6,100 residents and businesses enrolled. The City of Bellingham began purchasing Renewable Energy Credits in 2005 to offset all municipal emissions from electricity and is now an early adopter of PSE’s Green Direct Program which provides the City with 100% renewable energy from new dedicated wind and solar resources. The Port of Bellingham, Whatcom County and Western Washington University are also Green Direct participants.
The Energy Supply Work Group considered several issues while developing the Energy Supply Measures. The Washington State Legislature passed the Clean Energy Transformation Act (CETA) which requires Washington State electric utilities to reach 100% renewable energy by 2045 and is PSE’s stated pathway to 100% clean electricity. Conversely, the City Council has a stated ambition of reaching 100% renewable energy for all sectors by 2035.
Additional issues for consideration include: the existing electricity demand, anticipated increase in demand with electrification, existing renewable energy capacity, and pathways to meet the City resolution’s 100% ambition.
The Energy Supply Work Group identified several issues and opportunities regarding natural gas vs. clean energy:
Photo credit: Itek Energy, now Silfab Solar
74 | P a g e City of Bellingham Climate Action Task Force Report – December 2019
• Wind and solar have lower Net Capacity Factors (NCF; amount of kW or MW delivered on average versus the total plant capacity at full output, due to resource fluctuation) relative to gas combined cycle generation. Capacity factors are: fossil fuels 95%, hydro 55%, wind 30%-50%, and solar 20%-30%. The NCF is factored into the economics of each individual project. At the utility-scale, wind and solar are competitive with fossil fuel sources of generation.
• Combined with energy storage, wind and solar energy are dispatchable on-demand resources providing both firm and flexible electricity.
• Natural gas (98% methane) is a fossil fuel with a carbon footprint 40% greater than coal due to methane and carbon dioxide emissions across the supply chain.
• While dollar-for-dollar renewable energy may be cheaper than natural gas fired energy dollar-for-dollar, the capital costs associated with the development of any new energy resource must also be considered. Northwest utilities balance the need for more renewable resources and the need for reliable natural gas fired electricity generation. Both are currently considered necessary for reliability. Presently, depending on individual project details, there are limited commercially viable energy resource options that could be employed to reduce and manage loads.
• PSE’s pathway to 100% clean energy by 2045 is the Clean Energy Transformation Act (CETA).
Wind and solar when paired with energy storage are – from an economic, engineering, and environmental perspective – increasingly competitive with natural gas generation.
Additional contributions to renewable energy supply will come from demand-side resources, i.e. energy efficiency, demand response, energy storage, PV and EV, aggregate Distributed Energy Resources (DERs) and “Microgrids.” A report released in October 2019, “The Harmonious Grid: The Northwest Electric System and The Embrace of Customer-Side Resources,” from the NW Energy Coalition, is instructive in this regard:
“Experts who study the challenge the Northwest faces are concluding that both supply-side and customer-side clean energy resources will be required to do the job. The Northwest Power and Conservation Council (NPCC) expects customer-side resources, including energy efficiency, demand response (DR), direct load control (DLC), distributed generation (DG), more sophisticated system management and control platforms, and storage, to meet nearly all of regional load growth over the next twenty years.”
One example of the competitiveness of large-scale renewables is from Colorado, with Xcel Energy’s All Source Solicitation RFP from December 2018 showing solar and wind at or below the operating cost of gas generation. It also shows that wind and solar can be cost competitive and – when coupled with energy storage – can be reliable resources equivalent to gas generation. The Task Force recognizes that the costs of energy and the economics of renewable energy projects are different in different regions of the country.
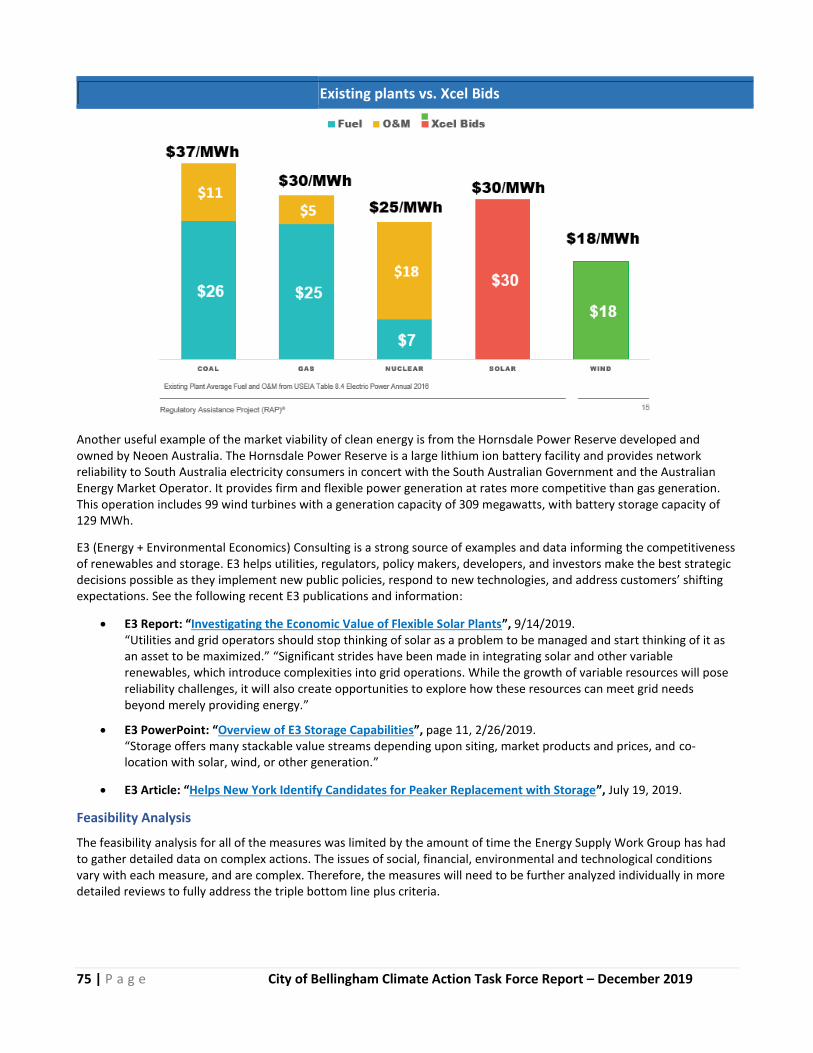
75 | P a g e City of Bellingham Climate Action Task Force Report – December 2019
Existing plants vs. Xcel Bids
Another useful example of the market viability of clean energy is from the Hornsdale Power Reserve developed and owned by Neoen Australia. The Hornsdale Power Reserve is a large lithium ion battery facility and provides network reliability to South Australia electricity consumers in concert with the South Australian Government and the Australian Energy Market Operator. It provides firm and flexible power generation at rates more competitive than gas generation. This operation includes 99 wind turbines with a generation capacity of 309 megawatts, with battery storage capacity of 129 MWh.
E3 (Energy + Environmental Economics) Consulting is a strong source of examples and data informing the competitiveness of renewables and storage. E3 helps utilities, regulators, policy makers, developers, and investors make the best strategic decisions possible as they implement new public policies, respond to new technologies, and address customers’ shifting expectations. See the following recent E3 publications and information:
• E3 Report: “Investigating the Economic Value of Flexible Solar Plants”, 9/14/2019. “Utilities and grid operators should stop thinking of solar as a problem to be managed and start thinking of it as an asset to be maximized.” “Significant strides have been made in integrating solar and other variable renewables, which introduce complexities into grid operations. While the growth of variable resources will pose reliability challenges, it will also create opportunities to explore how these resources can meet grid needs beyond merely providing energy.”
• E3 PowerPoint: “Overview of E3 Storage Capabilities”, page 11, 2/26/2019. “Storage offers many stackable value streams depending upon siting, market products and prices, and co-location with solar, wind, or other generation.”
• E3 Article: “Helps New York Identify Candidates for Peaker Replacement with Storage”, July 19, 2019.
Feasibility Analysis
The feasibility analysis for all of the measures was limited by the amount of time the Energy Supply Work Group has had to gather detailed data on complex actions. The issues of social, financial, environmental and technological conditions vary with each measure, and are complex. Therefore, the measures will need to be further analyzed individually in more detailed reviews to fully address the triple bottom line plus criteria.

76 | P a g e City of Bellingham Climate Action Task Force Report – December 2019
Cost Analysis
This analysis was not completed for all measures, as applying cost estimates to these complex options and quickly changing technologies at this stage of review would not be appropriate. Although implementation costs may be more apparent and quantifiable for some measures once project assumptions are finalized, additional analysis needed to research the triple bottom line plus criteria are a much more complex undertaking. This would include analysis that compares both upfront and long-term costs with immediate and long-term benefits. This analysis will require significant time and resources to produce meaningful evaluations. This is especially true because some of the measures below could in fact be substitutes for one another, with some measures only being considered after others are analyzed and ruled out.
Impact Analysis
More work will be needed to provide detailed assessments of the impacts of these recommendations. However, the tables that are included with the description of each measure list the benefits and challenges of each measure. The information is tagged with triple bottom line plus indicators, Social, Financial, Environmental, and Technical to indicate the main area of benefits and challenges. The Task Force believes this work indicates the spectrum of benefits and challenges and is a useful summary of the overall impact.
The Energy Supply Work Group believes that implementing a combination of these recommendations will be necessary to meet the ambitions of Resolution 2018 – 06. Many potential options to meet the stated ambitions are offered in the Measures as delineated below.
The Energy Supply Work Group encourages the City of Bellingham to continue to work with PSE to evaluate feasibility, costs and impacts of the 100% renewable energy ambitions. The COB must also explore additional measures to include a broader spectrum of actions that can contribute to progress towards realizing COB’s ambitions, should the measures in this report prove insufficient. Further exploration of all of the measures with regard to feasibility and costs is essential before developing policies. The City should explore all measures concurrently to ensure it works toward meeting the stated ambitions.
The Energy Supply Work Group recommendations are grouped into three sections:
1. Renewable Energy 2. Emerging Technologies 3. Policy Initiatives
For additional information, please click on the following references: 1, 2
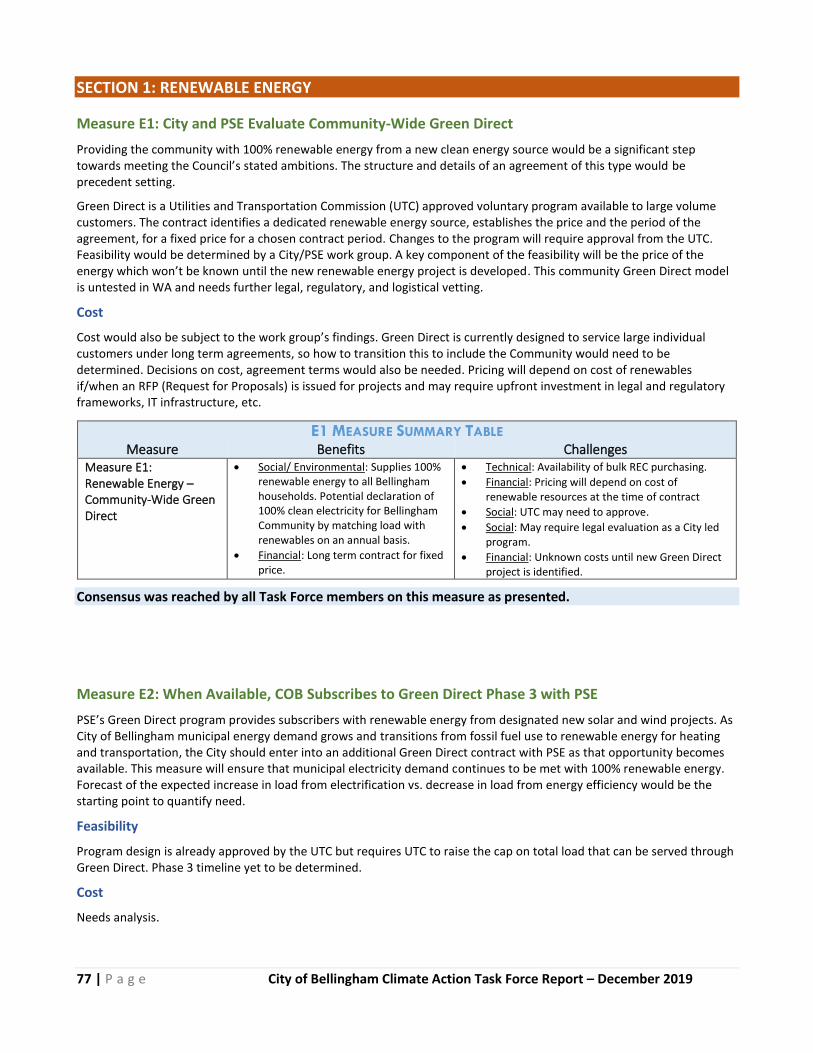
77 | P a g e City of Bellingham Climate Action Task Force Report – December 2019
SECTION 1: RENEWABLE ENERGY
Measure E1: City and PSE Evaluate Community-Wide Green Direct
Providing the community with 100% renewable energy from a new clean energy source would be a significant step towards meeting the Council’s stated ambitions. The structure and details of an agreement of this type would be precedent setting.
Green Direct is a Utilities and Transportation Commission (UTC) approved voluntary program available to large volume customers. The contract identifies a dedicated renewable energy source, establishes the price and the period of the agreement, for a fixed price for a chosen contract period. Changes to the program will require approval from the UTC. Feasibility would be determined by a City/PSE work group. A key component of the feasibility will be the price of the energy which won’t be known until the new renewable energy project is developed. This community Green Direct model is untested in WA and needs further legal, regulatory, and logistical vetting.
Cost
Cost would also be subject to the work group’s findings. Green Direct is currently designed to service large individual customers under long term agreements, so how to transition this to include the Community would need to be determined. Decisions on cost, agreement terms would also be needed. Pricing will depend on cost of renewables if/when an RFP (Request for Proposals) is issued for projects and may require upfront investment in legal and regulatory frameworks, IT infrastructure, etc.
E1 MEASURE SUMMARY TABLE Measure Benefits Challenges
Measure E1: Renewable Energy – Community-Wide Green Direct
• Social/ Environmental: Supplies 100% renewable energy to all Bellingham households. Potential declaration of 100% clean electricity for Bellingham Community by matching load with renewables on an annual basis.
• Financial: Long term contract for fixed price.
• Technical: Availability of bulk REC purchasing.
• Financial: Pricing will depend on cost of renewable resources at the time of contract
• Social: UTC may need to approve.
• Social: May require legal evaluation as a City led program.
• Financial: Unknown costs until new Green Direct project is identified.
Consensus was reached by all Task Force members on this measure as presented.
Measure E2: When Available, COB Subscribes to Green Direct Phase 3 with PSE
PSE’s Green Direct program provides subscribers with renewable energy from designated new solar and wind projects. As City of Bellingham municipal energy demand grows and transitions from fossil fuel use to renewable energy for heating and transportation, the City should enter into an additional Green Direct contract with PSE as that opportunity becomes available. This measure will ensure that municipal electricity demand continues to be met with 100% renewable energy. Forecast of the expected increase in load from electrification vs. decrease in load from energy efficiency would be the starting point to quantify need.
Feasibility
Program design is already approved by the UTC but requires UTC to raise the cap on total load that can be served through Green Direct. Phase 3 timeline yet to be determined.
Cost
Needs analysis.

78 | P a g e City of Bellingham Climate Action Task Force Report – December 2019
E2 MEASURE SUMMARY TABLE Measure Benefits Challenges
Measure E2: Renewable Energy – When available, COB subscribes to Green Direct phase 3 with PSE
• Environmental: Large scale renewables w/ storage provides same benefits as gas generation.
• Financial: Moves away from renewable projects with cost premium and long lead times.
• Financial: COB /PSE partnership utilizing large scale utility for 100% renewable energy.
• Financial: Lowers cost to COB for renewable energy.
• Technical: Matching renewables to load on annual basis simplifies renewable integration.
• Financial: City could encourage other large commercial users to enroll in phase 3.
• Financial: Market costs may rise due to increase demand for renewable energy projects.
• Financial: Pricing will depend on cost of renewable resources at the time RFP is issued for Phase 3.
• Technical: Energy Storage component still evolving.
Consensus was reached by all Task Force members on this measure as presented.
Measure E3: City Supports PSE Green Power Program for Residents and Businesses
Green Power is PSE’s voluntary consumer program that allows customers to choose to match all or some of their energy use with Green Power or clean electricity. The City and PSE have worked together to promote Green Power previously with notable results. Bellingham is the Green Power leader of communities in Washington State. A campaign will need to address the challenge of motivating participation in a voluntary program. Options might include incentives such as a cost reduction for meeting participation, volume or similar benchmarks. All energy provided to Green Power customers will be from certified renewable energy sources. Program costs would need to be evaluated and compared with local REC markets versus out of state markets.
Renewable energy projects that contribute to the Green Power program include, Swauk Wind Farm in Ellensburg and Nooksack Falls Hydroelectric project in Whatcom County. The cost for the program is $4 for 400kWh of electricity and allows participants to set a contribution level either in the form of 100% (1 cent multiplied by actual monthly kWh electricity usage) or at set levels of kWh. PSE’s Green Power fuel mix is 60% wind, 30% solar, 6% biogas, 2% landfill Gas, 1% geothermal and 1% low impact hydro.
Cost
For more information, review this cost calculator.
E3 MEASURE SUMMARY TABLE Measure Benefits Challenges
Measure E3: Renewable Energy – City Supports PSE Green Power program for residences and businesses
• Environmental: With 100% participation can hit 100% renewable energy targets.
• Social: PSE able to support additional campaigns to encourage customer participation.
• Environmental: Each increased customer participation of 25% could realize ~30 million pounds CO2 reduction annually.
• Technical: Need to predict future demand with PSE and identify sources for that demand.
• Social: Motivating voluntary participation
• Social: Green Power is a voluntary program as established by UTC; mandatory purchase from a customer not an option.
• Financial: Needs cost analysis.
Consensus was reached by all Task Force members on this measure as presented.

79 | P a g e City of Bellingham Climate Action Task Force Report – December 2019
Measure E4: City Assesses Community Solar Alongside Other Public Organizations - (e.g. School District and Port of Bellingham)
Community solar expands access to solar for people who face barriers to rooftop solar such as up-front costs, home ownership, and solar readiness. The programs help facilitate community-located, distributed solar deployment in Washington, and customers share in costs and benefits of new, local solar in Washington.
PSE issued a Request for Information to public entities like COB to understand where they’d like to see solar sited in their communities. Projects could include ground-based as well as building-based systems that would power local municipal, business or household uses. COB could encourage other entities to respond and cooperate with projects across organizations that could potentially feed a Community Solar project in Bellingham.
Feasibility
City and potential partners will need to pursue all facets of the project feasibility.
Cost
Needs analysis.
E4 MEASURE SUMMARY TABLE Measure Benefits Challenges
Measure E4: Renewable Energy – City Assesses Community Solar Alongside other public organizations
• Environmental: Provides increased solar energy for increase demand.
• Financial: Cost effective with net metering
• Social: Highly visible.
• Social: Supports local jobs.
• Financial: Potential COB, School, Port operating cost savings.
• Financial: Requires suitable building sites for solar development
• Financial: Economics make payback difficult without incentives
• Financial: Feasibility study needed
• Environmental – Permitting issues could arise
• Financial: Financing required
• Financial: City to monetize investment tax credits (tax equity)
Consensus was reached by all Task Force members on this measure as presented.
Measure E5: City Provides Community with Outreach and Education on the Benefits of Solar Installations
Feasibility
The City has capacity to provide outreach and education on climate issues. This could incorporate information on existing incentives and financing. If there are additional solarization campaigns, the City may also consider supporting them.
Cost
Marginal additional cost to City.
E5 MEASURE SUMMARY TABLE Measure Benefits Challenges
Measure E5: Renewable Energy – City provides community with outreach and education on the benefits of solar installations
• Social: Highly visible
• Social: Supports increase in solar adoption, increase of solar job market, increased energy independence
• Social: Social acceptability.
Consensus was reached by all Task Force members on this measure as presented.
For additional information, please click on the following references: 3,4
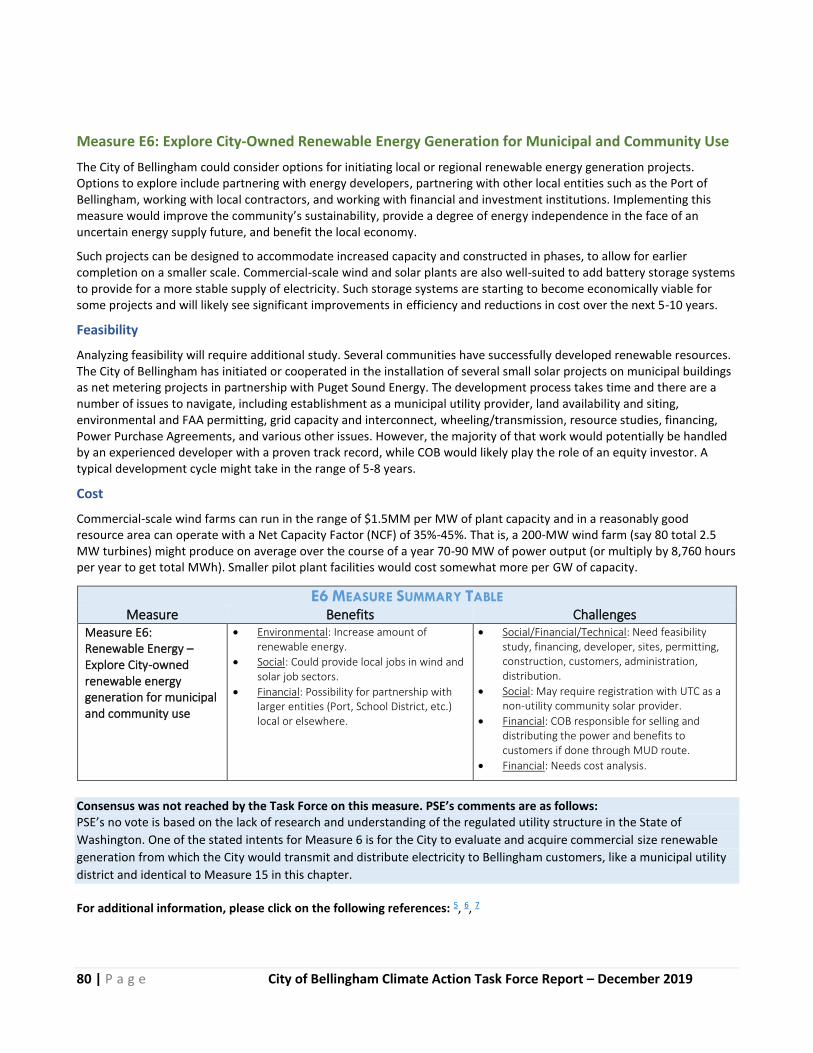
80 | P a g e City of Bellingham Climate Action Task Force Report – December 2019
Measure E6: Explore City-Owned Renewable Energy Generation for Municipal and Community Use
The City of Bellingham could consider options for initiating local or regional renewable energy generation projects. Options to explore include partnering with energy developers, partnering with other local entities such as the Port of Bellingham, working with local contractors, and working with financial and investment institutions. Implementing this measure would improve the community’s sustainability, provide a degree of energy independence in the face of an uncertain energy supply future, and benefit the local economy.
Such projects can be designed to accommodate increased capacity and constructed in phases, to allow for earlier completion on a smaller scale. Commercial-scale wind and solar plants are also well-suited to add battery storage systems to provide for a more stable supply of electricity. Such storage systems are starting to become economically viable for some projects and will likely see significant improvements in efficiency and reductions in cost over the next 5-10 years.
Feasibility
Analyzing feasibility will require additional study. Several communities have successfully developed renewable resources. The City of Bellingham has initiated or cooperated in the installation of several small solar projects on municipal buildings as net metering projects in partnership with Puget Sound Energy. The development process takes time and there are a number of issues to navigate, including establishment as a municipal utility provider, land availability and siting, environmental and FAA permitting, grid capacity and interconnect, wheeling/transmission, resource studies, financing, Power Purchase Agreements, and various other issues. However, the majority of that work would potentially be handled by an experienced developer with a proven track record, while COB would likely play the role of an equity investor. A typical development cycle might take in the range of 5-8 years.
Cost
Commercial-scale wind farms can run in the range of $1.5MM per MW of plant capacity and in a reasonably good resource area can operate with a Net Capacity Factor (NCF) of 35%-45%. That is, a 200-MW wind farm (say 80 total 2.5 MW turbines) might produce on average over the course of a year 70-90 MW of power output (or multiply by 8,760 hours per year to get total MWh). Smaller pilot plant facilities would cost somewhat more per GW of capacity.
E6 MEASURE SUMMARY TABLE Measure Benefits Challenges
Measure E6: Renewable Energy – Explore City-owned renewable energy generation for municipal and community use
• Environmental: Increase amount of renewable energy.
• Social: Could provide local jobs in wind and solar job sectors.
• Financial: Possibility for partnership with larger entities (Port, School District, etc.) local or elsewhere.
• Social/Financial/Technical: Need feasibility study, financing, developer, sites, permitting, construction, customers, administration, distribution.
• Social: May require registration with UTC as a non-utility community solar provider.
• Financial: COB responsible for selling and distributing the power and benefits to customers if done through MUD route.
• Financial: Needs cost analysis.
Consensus was not reached by the Task Force on this measure. PSE’s comments are as follows: PSE’s no vote is based on the lack of research and understanding of the regulated utility structure in the State of
Washington. One of the stated intents for Measure 6 is for the City to evaluate and acquire commercial size renewable
generation from which the City would transmit and distribute electricity to Bellingham customers, like a municipal utility
district and identical to Measure 15 in this chapter.
For additional information, please click on the following references: 5, 6, 7
81 | P a g e City of Bellingham Climate Action Task Force Report – December 2019
SECTION 2: EMERGING TECHNOLOGIES
Measure E7: City Evaluates Future Energy Projects that Could Include Microgrids, Distributed Energy Resources (DER), and Demand Response (DR)
The COB could support PSE or other partners in the evaluation and consideration of costs and impacts of development of various pilot projects such as microgrids, distributed energy resources, and demand response. These types of projects can reduce electricity use through more efficient management of demand. PSE is upgrading its meters, looking at storage, and evaluating demand response.
Microgrids
To support microgrid capacity, two-way communicating 'smart' meters will be helpful, but not required, for addressing critical peak. PSE is currently installing these meters across their service territory and are scheduled to be installed in 2023 in Whatcom County. This technology will allow for additional projects related to smart grid technology.
Microgrids, Distributed Energy Resources (DER), Distributed Resources (DR), and Energy Storage (ES) (see Measure #8 below) are emerging technologies that should be developed as demonstration pilot projects. As microgrids, DER, DR, and ES are developed in this country and globally, they are viewed as the next electricity resource and asset category following generation, transmission, and distribution.
Distributed Energy Resources (DER)
Potential Value of Combinations of DERs A PV system installed in isolation is limited in the services and value streams it can provide. But when PV is combined with other DERs, the resources’ total value can be greater than the sum of the values of each component in isolation. Examples of the benefits of these combinations include:
Demand Response (DR)
As defined and described by the Northwest Power and Conservation Council (NPCC), “demand response resources are voluntary reductions in customer electricity use during periods of high demand and limited resource availability. The Council’s resource strategy uses DR to meet winter and summer peak demands, primarily under critical water and extreme weather conditions. The strategy doesn’t consider other possible applications of demand response – to integrate variable resources like wind for example.”
The Council’s assessment identified more than 4,300 megawatts of regional demand response potential. A significant amount of this potential, nearly 1,500 megawatts, is available at relatively low cost – less than $25 per kilowatt of peak capacity per year. When compared to the alternative of constructing a simple cycle gas-fired turbine, demand response can be deployed sooner, in quantities better matched to the peak capacity need, deferring the need for transmission upgrades or expansions.
The NPCC states, “In particular, demand response is the least expensive means to maintain peak reserves for system adequacy. Its low cost is especially valuable because the need for peaking capacity in the region largely depends on water and weather conditions.”
DR + Solar (at Individual Sites)
The same technologies and techniques used for DR in isolation can be combined with PV to create even more value. For example, flexible loads such as electric water heating, air conditioning, electric space heating, and pool pumps can be programmed to take advantage of times when the generation from a customer’s PV system exceeds their momentary demand for other end uses. From a utility or independent system operator (ISO) perspective, this combination can be especially valuable in terms of flexibility.
Feasibility
The new Washington State requirements for CETA requires electric utilities to provide 100% clean electricity by 2045. Incorporating microgrids, DER, DR, and other new energy sources into the electricity grid will need a platform for managing the various components.
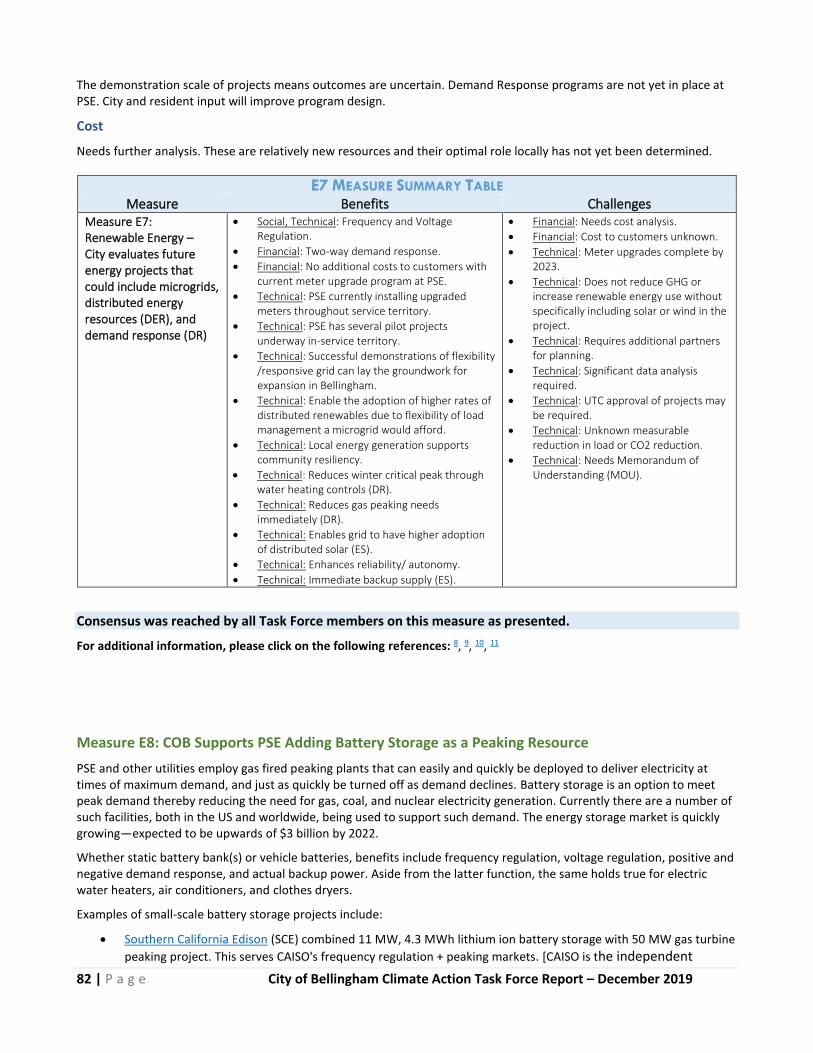
82 | P a g e City of Bellingham Climate Action Task Force Report – December 2019
The demonstration scale of projects means outcomes are uncertain. Demand Response programs are not yet in place at PSE. City and resident input will improve program design.
Cost
Needs further analysis. These are relatively new resources and their optimal role locally has not yet been determined.
E7 MEASURE SUMMARY TABLE Measure Benefits Challenges
Measure E7: Renewable Energy – City evaluates future energy projects that could include microgrids, distributed energy resources (DER), and demand response (DR)
• Social, Technical: Frequency and Voltage Regulation.
• Financial: Two-way demand response.
• Financial: No additional costs to customers with current meter upgrade program at PSE.
• Technical: PSE currently installing upgraded meters throughout service territory.
• Technical: PSE has several pilot projects underway in-service territory.
• Technical: Successful demonstrations of flexibility /responsive grid can lay the groundwork for expansion in Bellingham.
• Technical: Enable the adoption of higher rates of distributed renewables due to flexibility of load management a microgrid would afford.
• Technical: Local energy generation supports community resiliency.
• Technical: Reduces winter critical peak through water heating controls (DR).
• Technical: Reduces gas peaking needs immediately (DR).
• Technical: Enables grid to have higher adoption of distributed solar (ES).
• Technical: Enhances reliability/ autonomy.
• Technical: Immediate backup supply (ES).
• Financial: Needs cost analysis.
• Financial: Cost to customers unknown.
• Technical: Meter upgrades complete by 2023.
• Technical: Does not reduce GHG or increase renewable energy use without specifically including solar or wind in the project.
• Technical: Requires additional partners for planning.
• Technical: Significant data analysis required.
• Technical: UTC approval of projects may be required.
• Technical: Unknown measurable reduction in load or CO2 reduction.
• Technical: Needs Memorandum of Understanding (MOU).
Consensus was reached by all Task Force members on this measure as presented.
For additional information, please click on the following references: 8, 9, 10, 11
Measure E8: COB Supports PSE Adding Battery Storage as a Peaking Resource
PSE and other utilities employ gas fired peaking plants that can easily and quickly be deployed to deliver electricity at times of maximum demand, and just as quickly be turned off as demand declines. Battery storage is an option to meet peak demand thereby reducing the need for gas, coal, and nuclear electricity generation. Currently there are a number of such facilities, both in the US and worldwide, being used to support such demand. The energy storage market is quickly growing—expected to be upwards of $3 billion by 2022.
Whether static battery bank(s) or vehicle batteries, benefits include frequency regulation, voltage regulation, positive and negative demand response, and actual backup power. Aside from the latter function, the same holds true for electric water heaters, air conditioners, and clothes dryers.
Examples of small-scale battery storage projects include:
• Southern California Edison (SCE) combined 11 MW, 4.3 MWh lithium ion battery storage with 50 MW gas turbine
peaking project. This serves CAISO's frequency regulation + peaking markets. [CAISO is the independent
83 | P a g e City of Bellingham Climate Action Task Force Report – December 2019
system operator (ISO) managing the flow of electricity across the high-voltage, long-distance power lines that make up 80% of California’s and a small part of Nevada’s grid.] The nonprofit public benefit corporation keeps power moving to homes and communities. Batteries can export power immediately,
then recharge after a gas turbine ramps up in 5-10 min. Lifecycle 40-year accounts projects 60% reduction operating costs, 50% less heat-trapping gases, 45% decreased water demand. SCE is contemplating adding storage even to hydroelectric plants as it enhances response time and dispatchability.
• Duke Energy has installed a 36 MW battery storage system at their Notrees windfarm in Texas.
• Tehachapi Energy Storage Project – A 32 MWh battery storage system constructed in 2013.
PSE is also developing Customer-sited Energy Storage (CSES) demonstrations in a number of different locations throughout the service area. One demonstration involves installing and testing a community-scale, Battery Energy Storage System (BESS) on Samish Island. Customer-sited batteries create new opportunities for growth at PSE, and demonstration projects like Samish Island validate PSE’s use cases, help identify the benefits of battery technology, and determine the best way to move forward for customers.
Additional Battery Storage Options
• Storage + Solar Photo Voltaic (PV): When storage is added to a PV system, the primary limitation of PV — that it only provides power when the sun shines – is alleviated. This allows customers to plan storage and use around high-value times and reduce demand charges. With further investment in microgrid technology, this combination can also enable resilience by powering critical loads during outages.
• PV + Electric Vehicles (EV): When an EV replaces a fossil-fueled vehicle, the environmental impacts depend on the fuel mix and emissions of the power system from which the vehicle is drawing energy (a measure that is likely to change over time). An EV that is charged with power generated by PV — a zero-emissions fuel — will have maximum environmental benefits. For utilities, combining an EV with PV may also reduce the need for capacity upgrades to the transmission and distribution systems.
• EV Battery Recycling to Energy Storage: Most car manufacturers warranty their EV battery packs for eight years or 100,000 miles, but depending on vehicle use and climate, most battery packs will last as long as the vehicle itself, ten to fifteen years. After that time, the battery pack has degraded to between 70 to 80% of its original capacity, and the battery should not be used in a vehicle due to decreased driving range, diminished acceleration ability, and increased charging time. These batteries could be recycled and the materials reused for other batteries, but currently, recycling lithium-ion batteries can cost more than mining new lithium and is often not required by law, making it more economical, but less environmentally sound, to dispose of the battery rather than recycle it. However, these batteries still have a significant amount of capacity and could be reused in other applications, such as stationary storage. These second-use applications could defer recycling costs and increase their useful lifespan, as well as provide significant amounts of energy storage at a lower cost than new batteries. The National Renewable Energy Laboratory (NREL) estimates that, based on anticipated EV sales and expected vehicle battery life, a critical mass of EV batteries would be available for repurposing starting in 2030.
Researchers and car manufacturers are studying secondary use applications of EV batteries as a way to recoup the high financial and environmental costs of manufacturing and recycling batteries, to lower total cost of EV ownership, and provide cost-effective energy storage options.
NREL determined that, for electricity providers, the best economic and technical application for second-use EV batteries would be replacing grid-connected combustion turbine peaking power plants (“peakers”) and providing peak-shaving services. Under these applications, PEV batteries could be expected to have another ten years of useful life. The stock of EVs on the road as of March 2014 represented more than 2.25 GWh of capacity; if only half of these battery packs were repurposed, assuming 75% of capacity is retained, there would be approximately 850 MWh of storage capacity and 425 MW of power.
Feasibility
Incorporate onsite linked battery storage, as accomplished recently by Southern California Edison.
Cost
Needs analysis after possible local projects are scoped out.
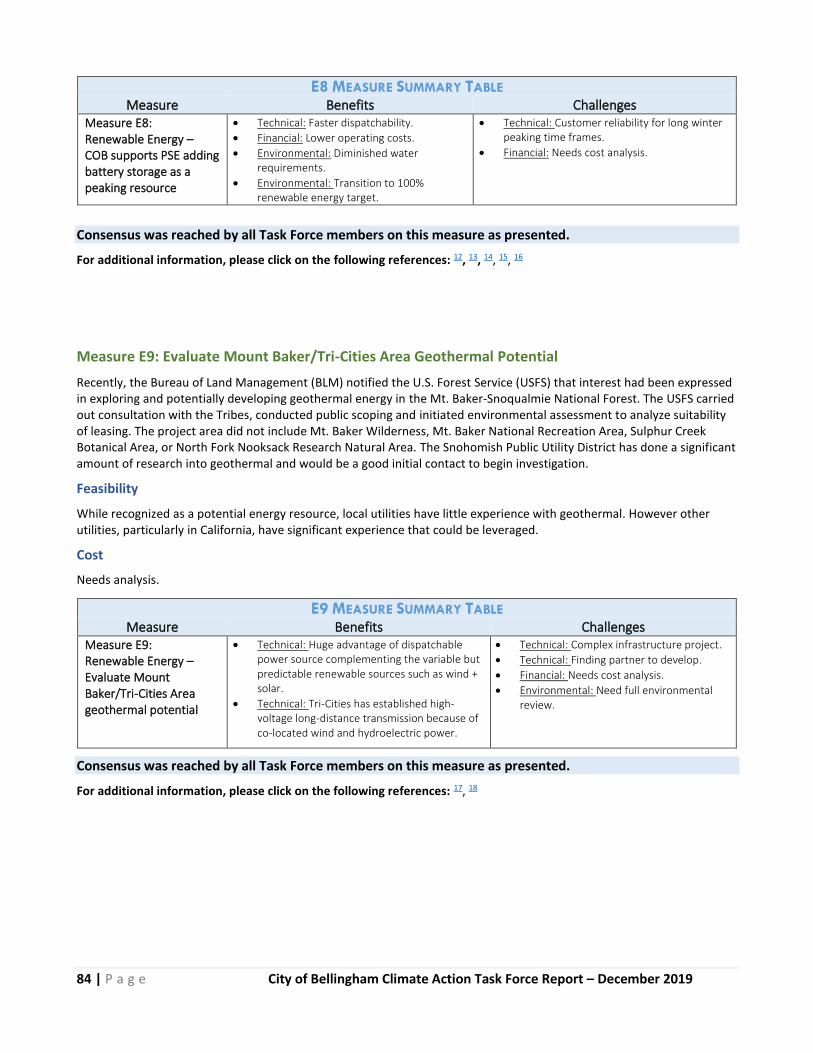
84 | P a g e City of Bellingham Climate Action Task Force Report – December 2019
E8 MEASURE SUMMARY TABLE Measure Benefits Challenges
Measure E8: Renewable Energy – COB supports PSE adding battery storage as a peaking resource
• Technical: Faster dispatchability.
• Financial: Lower operating costs.
• Environmental: Diminished water requirements.
• Environmental: Transition to 100% renewable energy target.
• Technical: Customer reliability for long winter peaking time frames.
• Financial: Needs cost analysis.
Consensus was reached by all Task Force members on this measure as presented.
For additional information, please click on the following references: 12, 13, 14, 15, 16
Measure E9: Evaluate Mount Baker/Tri-Cities Area Geothermal Potential
Recently, the Bureau of Land Management (BLM) notified the U.S. Forest Service (USFS) that interest had been expressed in exploring and potentially developing geothermal energy in the Mt. Baker-Snoqualmie National Forest. The USFS carried out consultation with the Tribes, conducted public scoping and initiated environmental assessment to analyze suitability of leasing. The project area did not include Mt. Baker Wilderness, Mt. Baker National Recreation Area, Sulphur Creek Botanical Area, or North Fork Nooksack Research Natural Area. The Snohomish Public Utility District has done a significant amount of research into geothermal and would be a good initial contact to begin investigation.
Feasibility
While recognized as a potential energy resource, local utilities have little experience with geothermal. However other utilities, particularly in California, have significant experience that could be leveraged.
Cost
Needs analysis.
E9 MEASURE SUMMARY TABLE Measure Benefits Challenges
Measure E9: Renewable Energy – Evaluate Mount Baker/Tri-Cities Area geothermal potential
• Technical: Huge advantage of dispatchable power source complementing the variable but predictable renewable sources such as wind + solar.
• Technical: Tri-Cities has established high-voltage long-distance transmission because of co-located wind and hydroelectric power.
• Technical: Complex infrastructure project.
• Technical: Finding partner to develop.
• Financial: Needs cost analysis.
• Environmental: Need full environmental review.
Consensus was reached by all Task Force members on this measure as presented.
For additional information, please click on the following references: 17, 18

85 | P a g e City of Bellingham Climate Action Task Force Report – December 2019
SECTION 3: POLICY INITIATIVES
Measure E10: City Revises Building Code Requirements for Rooftop Solar Installations on Commercial and Residential Buildings
It serves the City’s goals well to ensure that all new buildings are solar-ready. This includes keeping sufficient areas of each building's roof free from obstructions such as plumbing vents and HVAC equipment in order to have enough space to allow for future solar installation. This is a very low-cost way to ensure our local buildings are capable of being solar equipped in the future. As solar panel costs continue to drop, it may be worth evaluating the long-term cost benefits of required solar installations for new construction, as will be implemented in California on January 1, 2020.
Feasibility
Existing codes from other jurisdictions can be copied. Exemptions should be considered for locations with poor solar resource access or for other structural issues. However, as panels continue to become lighter, thinner, cheaper, and more efficient, structural exemptions should be minimal.
Cost
The costs would include City staff time.
E10 MEASURE SUMMARY TABLE Measure Benefits Challenges
Measure E10: Policy Initiatives – City revises building code requirements for rooftop solar installations on commercial and residential buildings
• Social: Will allow for more solar adoption.
• Social: House solar-ready code requirement makes it easier to adopt.
• Financial: Lowers the cost of solar.
• Technical: Existing codes from other jurisdictions may be copied implementation.
• Technical: Must comply with state and federal standards.
• Social: Public process requirement takes time.
• Financial: Needs cost analysis.
Consensus was reached by all Task Force members on this measure as presented.
Measure E11: Convene Discussion of Fire Access Pathway Requirements for Rooftop Solar
Providing sufficient access for firefighters is critical. At the same time, more solar can be deployed if more roof space is made available for solar instead of being reserved for rooftop fire access. The City should explore what can be done to increase available roof space without compromising safety. Streamlining the process with fire officials on commercial building permits would also be valuable.
The existing requirements limit or prohibit some solar projects by setting fire access standards that restrict potential projects to the extent that the area left for the array is not financially beneficial.
The International Fire Code (IFC) states in article 605.11.3.2.1 that “modules should be located in a manner that provides access pathway for firefighters.” It also says in article 605.11.3.2.4 that “panels/modules installed shall be located no higher than 3 feet below the ridge to allow for fire department ventilation operations.”
Combined, these codes require a 3-ft clearance down from the ridge of a pitched roof to allow for fire departments to ventilate the building. Additionally, a clear 3-ft pathway needs to be available for firefighter access to the roof.
Feasibility
Existing codes from other jurisdictions can be considered.
Cost

86 | P a g e City of Bellingham Climate Action Task Force Report – December 2019
The costs would include City staff time.
E11 MEASURE SUMMARY TABLE Measure Benefits Challenges
Measure E11: Policy Initiatives – Convene discussion of fire access pathway requirements for rooftop solar
• Environmental/Social: Increased solar adoption.
• Financial: Lower cost to solar adoption.
• Technical: Shorten installation lead times.
• Technical: Must comply with state and federal standards.
• Technical: Public process requirement takes time.
• Financial: Needs cost analysis.
Consensus was reached by all Task Force members on this measure as presented.
For additional information, please click on the following references: 19, 20
Measure E12: City Resolution to Support Virtual Net Energy Metering for Community Solar Projects
To understand the idea of Virtual Net Energy Metering (VNEM), you first need to understand the concept of standard Net Metering. Typical Net Metering is the concept that applies to a customer with a generation source (typically solar panels on a home or building). As a customer self-generates but at times doesn’t use all the self-generated electricity, the excess electricity produced goes back to the utility and creates credits for the customer. That is, their electric meter measures the “Net” of their consumption and their generation, though typically with stipulations as to the value of credits for generated vs consumed electricity. This has also been referred to as “spinning the meter backwards” when a home or building is generating more than it is consuming. Regarding a credits system, this is typically the mechanism by which credit is given for generated power, but sometimes at a rate lower than the cost of consumed power.
VNEM is system of compensating community solar participants for their share of the energy the project produces at a retail rate. VNEM is not a requirement for community solar and the construction of community solar projects is allowable in Washington today. VNEM pays back customers at the retail rate just as if smaller solar installations were in individual structures.
Other community solar models compensate customers the value of the energy the community solar project produced, while the customer continues to pay for the infrastructure required to deliver that energy as is the case with some other programs such as existing community solar programs in Washington, including those offered by Avista and Snohomish PUD.
There is concern for the potential cost shift to customers who don’t participate in a VNEM program. However, any justified added costs should reasonably be included in the VNEM crediting system, potentially avoiding any cost shift to other PSE customers.
State legislation is needed to enable VNEM before community VNEM generation sources can be developed. Not every state has VNEM, but a growing number are developing virtual net metering rules to make way for community generation options. The City should strongly promote such legislation in Washington.
Feasibility
Virtual Net Energy Metering bill may be introduced in the Washington State 2020 legislative session.
Cost
Needs analysis.
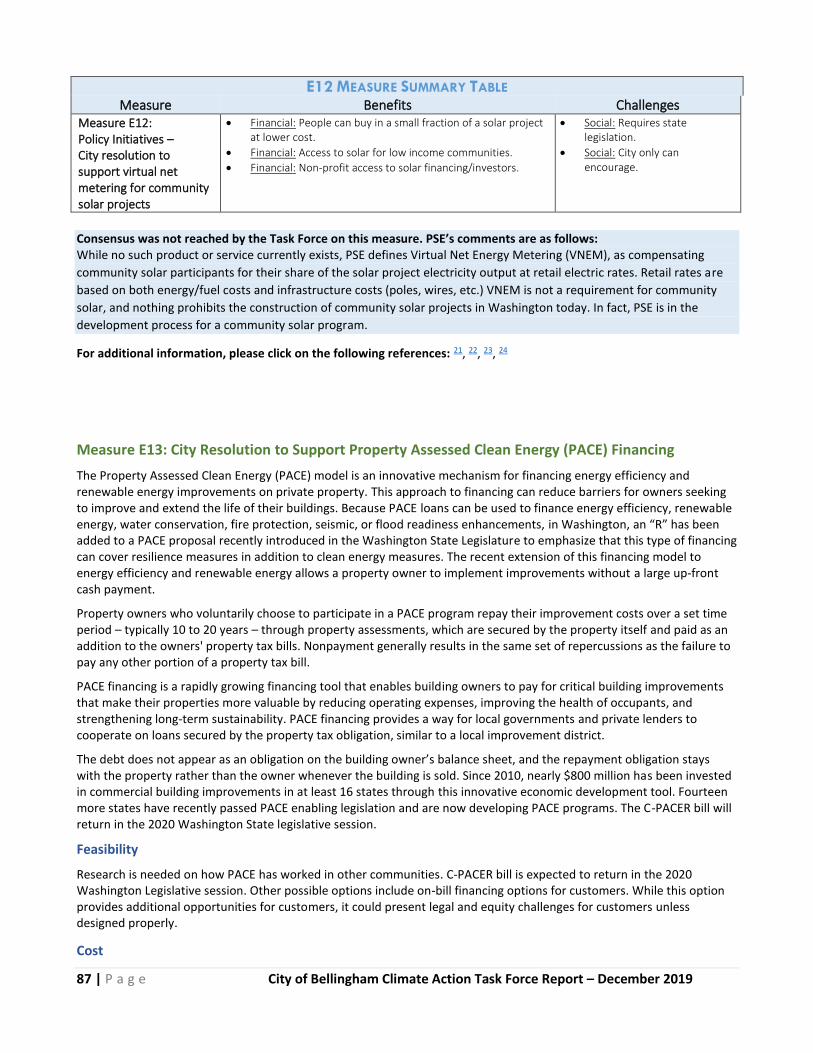
87 | P a g e City of Bellingham Climate Action Task Force Report – December 2019
E12 MEASURE SUMMARY TABLE Measure Benefits Challenges
Measure E12: Policy Initiatives – City resolution to support virtual net metering for community solar projects
• Financial: People can buy in a small fraction of a solar project at lower cost.
• Financial: Access to solar for low income communities.
• Financial: Non-profit access to solar financing/investors.
• Social: Requires state legislation.
• Social: City only can encourage.
Consensus was not reached by the Task Force on this measure. PSE’s comments are as follows: While no such product or service currently exists, PSE defines Virtual Net Energy Metering (VNEM), as compensating
community solar participants for their share of the solar project electricity output at retail electric rates. Retail rates are
based on both energy/fuel costs and infrastructure costs (poles, wires, etc.) VNEM is not a requirement for community
solar, and nothing prohibits the construction of community solar projects in Washington today. In fact, PSE is in the
development process for a community solar program.
For additional information, please click on the following references: 21, 22, 23, 24
Measure E13: City Resolution to Support Property Assessed Clean Energy (PACE) Financing
The Property Assessed Clean Energy (PACE) model is an innovative mechanism for financing energy efficiency and renewable energy improvements on private property. This approach to financing can reduce barriers for owners seeking to improve and extend the life of their buildings. Because PACE loans can be used to finance energy efficiency, renewable energy, water conservation, fire protection, seismic, or flood readiness enhancements, in Washington, an “R” has been added to a PACE proposal recently introduced in the Washington State Legislature to emphasize that this type of financing can cover resilience measures in addition to clean energy measures. The recent extension of this financing model to energy efficiency and renewable energy allows a property owner to implement improvements without a large up-front cash payment.
Property owners who voluntarily choose to participate in a PACE program repay their improvement costs over a set time period – typically 10 to 20 years – through property assessments, which are secured by the property itself and paid as an addition to the owners' property tax bills. Nonpayment generally results in the same set of repercussions as the failure to pay any other portion of a property tax bill.
PACE financing is a rapidly growing financing tool that enables building owners to pay for critical building improvements that make their properties more valuable by reducing operating expenses, improving the health of occupants, and strengthening long-term sustainability. PACE financing provides a way for local governments and private lenders to cooperate on loans secured by the property tax obligation, similar to a local improvement district.
The debt does not appear as an obligation on the building owner’s balance sheet, and the repayment obligation stays with the property rather than the owner whenever the building is sold. Since 2010, nearly $800 million has been invested in commercial building improvements in at least 16 states through this innovative economic development tool. Fourteen more states have recently passed PACE enabling legislation and are now developing PACE programs. The C-PACER bill will return in the 2020 Washington State legislative session.
Feasibility
Research is needed on how PACE has worked in other communities. C-PACER bill is expected to return in the 2020 Washington Legislative session. Other possible options include on-bill financing options for customers. While this option provides additional opportunities for customers, it could present legal and equity challenges for customers unless designed properly.
Cost
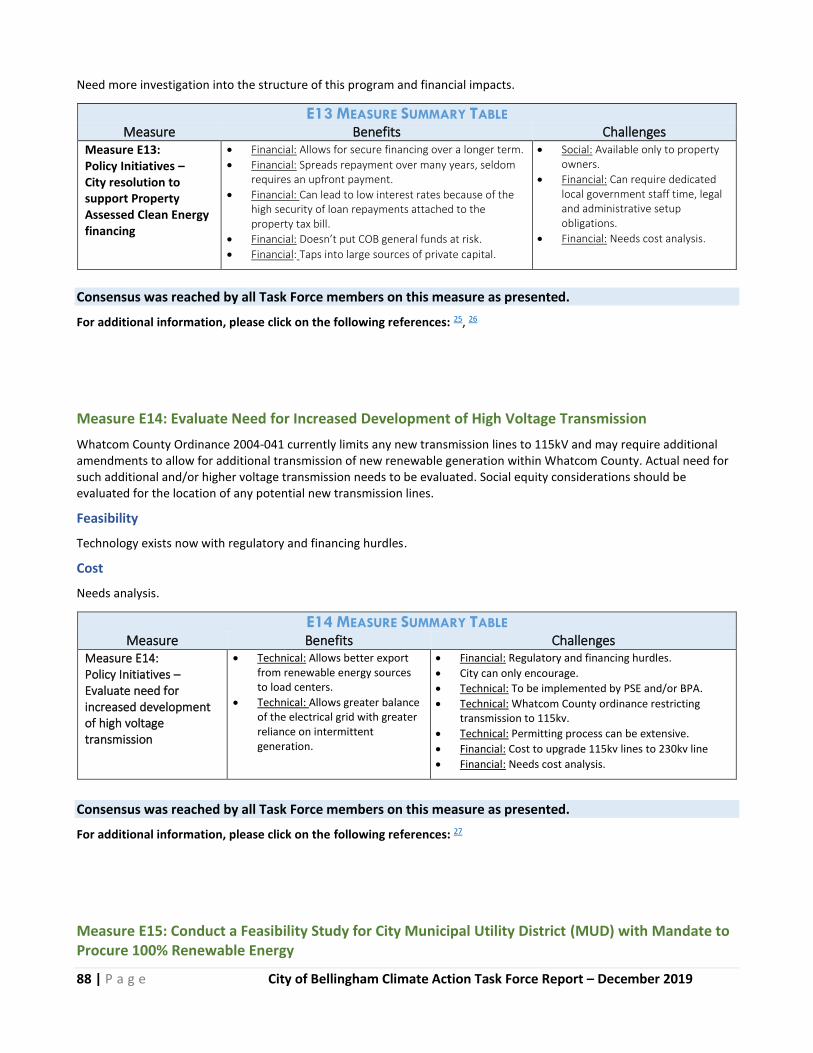
88 | P a g e City of Bellingham Climate Action Task Force Report – December 2019
Need more investigation into the structure of this program and financial impacts.
E13 MEASURE SUMMARY TABLE Measure Benefits Challenges
Measure E13: Policy Initiatives – City resolution to support Property Assessed Clean Energy financing
• Financial: Allows for secure financing over a longer term.
• Financial: Spreads repayment over many years, seldom requires an upfront payment.
• Financial: Can lead to low interest rates because of the high security of loan repayments attached to the property tax bill.
• Financial: Doesn’t put COB general funds at risk.
• Financial: Taps into large sources of private capital.
• Social: Available only to property owners.
• Financial: Can require dedicated local government staff time, legal and administrative setup obligations.
• Financial: Needs cost analysis.
Consensus was reached by all Task Force members on this measure as presented.
For additional information, please click on the following references: 25, 26
Measure E14: Evaluate Need for Increased Development of High Voltage Transmission
Whatcom County Ordinance 2004-041 currently limits any new transmission lines to 115kV and may require additional amendments to allow for additional transmission of new renewable generation within Whatcom County. Actual need for such additional and/or higher voltage transmission needs to be evaluated. Social equity considerations should be evaluated for the location of any potential new transmission lines.
Feasibility
Technology exists now with regulatory and financing hurdles.
Cost
Needs analysis.
E14 MEASURE SUMMARY TABLE Measure Benefits Challenges
Measure E14: Policy Initiatives – Evaluate need for increased development of high voltage transmission
• Technical: Allows better export from renewable energy sources to load centers.
• Technical: Allows greater balance of the electrical grid with greater reliance on intermittent generation.
• Financial: Regulatory and financing hurdles.
• City can only encourage.
• Technical: To be implemented by PSE and/or BPA.
• Technical: Whatcom County ordinance restricting transmission to 115kv.
• Technical: Permitting process can be extensive.
• Financial: Cost to upgrade 115kv lines to 230kv line
• Financial: Needs cost analysis.
Consensus was reached by all Task Force members on this measure as presented.
For additional information, please click on the following references: 27
Measure E15: Conduct a Feasibility Study for City Municipal Utility District (MUD) with Mandate to Procure 100% Renewable Energy
89 | P a g e City of Bellingham Climate Action Task Force Report – December 2019
Establishing a city (or joint city/county) MUD/PUD is a large undertaking and will require financial resources to evaluate the feasibility of the measure. A feasibility study should include evaluation of the benefits of municipal control of energy resources, short- and long-term costs, regulatory requirements, electricity sourcing flexibility, and the experiences of other communities.
• More specifically the study should evaluate the needed municipal-utility structure, management, system maintenance, billing, power supply contracting, capital expenditures bonding, procuring, etc. Cost evaluation will include purchase of the distribution system and associated stranded costs. Additionally, existing PSE Energy Efficiency grant recipients would need to pay back grants if they are served by another utility. For example, over $1.2 million dollars were awarded to participating Bellingham businesses in 2019.
• The study should also determine the process and cost for gaining approval from UTC. Alternatively, it may be possible to coordinate/partner with the already existing Whatcom County PUD service territory to include the City of Bellingham.
• Technical issues have been solved by other municipal utilities and PUDs and Bellingham should engage with other public power entities to learn from their experience (Blaine City Light, Seattle City Light, Tacoma Power, Lakeview Light & Power, Centralia City Light, etc.).
• The study should be done concurrently with the implementation of other Measures noted in this report.
Municipal Utility Districts and PUDs are non-profit, publicly owned organizations with an elected governance, as differentiated from PSE, which is a for-profit Investor Owned Utility (IOU) regulated by the Washington State Utilities and Transportation Commission (UTC).
The table below includes all 61 entities that provide residential electricity in the state of Washington. These are comprised of four types of electric utility governance structures: PUDs, Co-ops, municipal, and investor owned. Since Whatcom PUD doesn’t offer residential service, it isn't included in the table.
Facts as of 2017 per the Washington Public Utility Districts Association (WPUDA):
• Washington PUD Association members serve nearly 700,000 customers (connections);
• The average kilowatt-hour rate for WPUDA members is 7.45 cents;
• WPUDA members reliably maintain nearly 35,000 miles of electric lines in 26 counties;
• WPUDA member PUDs surpassed state-mandated conservation goals achieving more than double the required conservation.
Cost
Power costs may be similar if procured from Bonneville Power Administration, Energy Northwest, other potential wholesalers, or direct from Power Purchase Agreements (PPAs) with wind, solar, and other renewable resources; however, there is the potential for significant savings depending on sources. The City and COB residents should not and do not want to pay more than is required to deliver cleanly generated reliable electricity.
The next table lists the various entities alphabetically and includes estimated monthly costs based on 600 kWh and 1200 kWh for comparative analysis. The average residential consumption for PSE customers in Bellingham is 600 kWh per month per the calculation below. PSE monthly customer cost ranked near the middle at 600 kWh/month when considering Base Charge plus Tier charges. However, as residents transition to electrification (building heating, water heating, and electric vehicle charging), the average consumption will likely double by 2035, according to our analysis (see table below). With a doubling of consumption to 1,200 kWh/month, PSE ranks in the bottom, most expensive, 20% at current pricing.
Based on data from PSE, below is the consumption per customer (end of 2018): 273,401 Total MWh (residential annual total) 37,916 Residential meters 7.21 MWh / residential meter 7,211 Convert to kWh / meter 600.89 Monthly kWh / meter
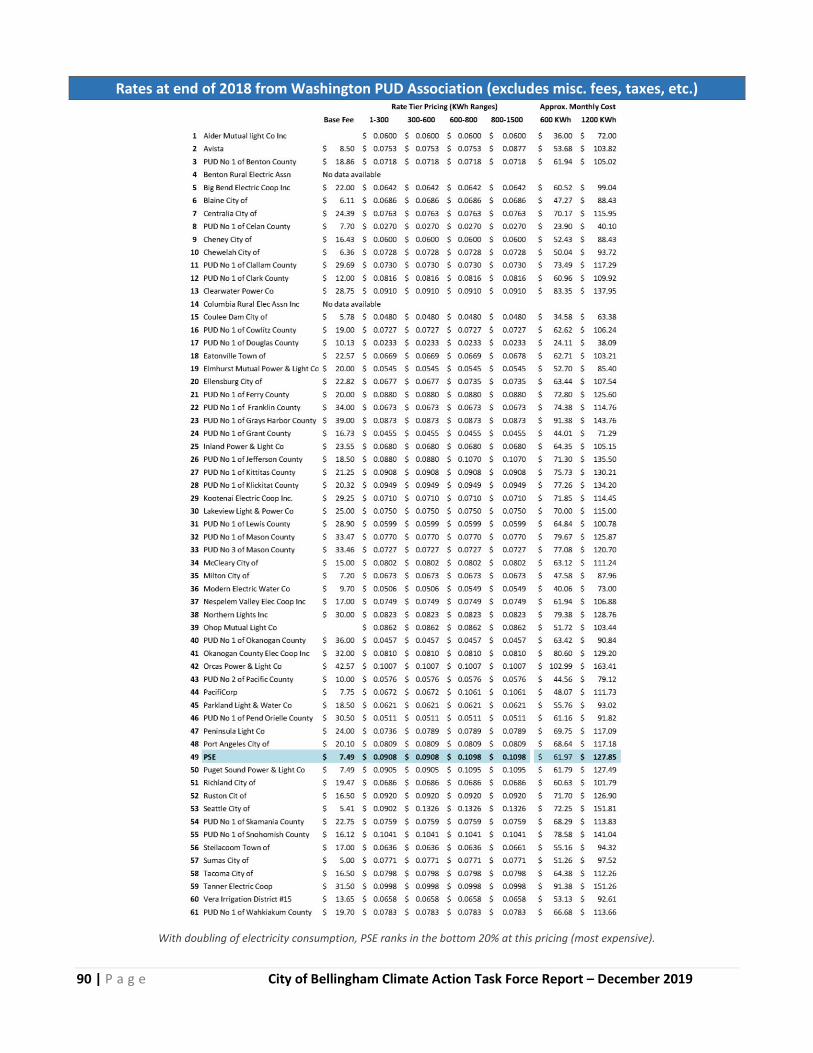
90 | P a g e City of Bellingham Climate Action Task Force Report – December 2019
Rates at end of 2018 from Washington PUD Association (excludes misc. fees, taxes, etc.)
With doubling of electricity consumption, PSE ranks in the bottom 20% at this pricing (most expensive).

91 | P a g e City of Bellingham Climate Action Task Force Report – December 2019
Each public utility determines how they charge their customers. Some PUD’s embed municipal and state utility taxes in their rates while others may have block rates or seasonal rates. Additional research is needed to capture all embedded costs, base charges, block charges, seasonal charges etc. As an example, Seattle City Light has a 6% municipal tax, a 3.873 State Utility Tax, a 1.5% RSA (Rate Stabilization Account) surcharge and a block charge with a seasonal charge in addition to their per kWh rate.
E15 MEASURE SUMMARY TABLE Measure Benefits Challenges
Measure E15: Policy Initiatives – Conduct a feasibility study for City Municipal Utility District with Mandate to Procure 100% Renewable Energy
• Financial: Establishes local control of power purchases.
• Financial: Potential savings over PSE rates.
• Social: Many social/equity benefits.
• Financial: Other WA State MUDs provide examples (won’t have to reinvent the wheel).
• Environmental: Gives City leverage if PSE can’t help us reach interim goals to get City to 100% renewable energy.
• Financial: Require City infrastructure and additional costs.
• Financial: Need plan for municipal utility structure, rates, etc.
• Financial: Contract for power supply, maintenance of infrastructure, etc.
• Financial: Approval from UTC.
• Financial: Establish municipal utility management, distribution system maintenance dept, billing dept, contracting and procurement dept, etc.
• Financial: Feasibility cost analysis required.
• Financial: Existing PSE EE grant recipients need to pay back grant if served by other utility.
• Financial: Purchase of PSE assets – generation, transmission, distribution and stranded costs.
• Social/Financial: Hold a city-wide referendum, including bonds for capital expenditures.
Consensus was not reached by the Task Force on this measure. PSE’s comments are as follows:
PSE’s no vote is based on the lack of research and understanding of the regulated utility structure in the State of
Washington. One of the stated intents for Measure 15 is for the City to evaluate and acquire commercial size renewable
generation from which the City would transmit and distribute electricity to Bellingham customers, like a municipal utility
district and identical to Measure 6 in this chapter.
For additional information, please click on the following references: 28, 29
Measure E16: Investigate alternative approaches of renewable energy to provide heating including ground, air and water-sourced heat pumps
For the City to achieve 100% renewable energy alternatives that reduce energy demand and shift use away from carbon-based fuels, commonly used in-household heating and cooling systems need to be identified.
Heat Pumps
One potential option that offers outstanding energy efficiency and carbon reduction opportunities is the replacement of current gas and oil-fired furnaces and associated air conditioning systems with heat pumps. A heat pump is an electrical device that extracts heat from one place and transfers it to another. The heat pump is not a new technology; it has been used around the world for decades. Refrigerators and air conditioners are both common examples of this technology.
Heat pumps can be more than three-times as efficient as a standard electric resistance heater or standard gas furnaces depending on the type of heat pump employed.
The heat pump cycle is fully reversible, and heat pumps can provide year-round climate control for your home – heating in winter and cooling and dehumidifying in summer. Since the ground and air outside always contain some heat, a heat

92 | P a g e City of Bellingham Climate Action Task Force Report – December 2019
pump can supply heat to a house even on cold winter days. In fact, Natural Resources Canada states that air at –18°C contains about 85% of the heat it contained at 21°C.
Ground Source Heat Pumps (GSHPs). There are various types of heat pumps including those that rely on water, air and the ground. While air source heat pumps are fairly common in Bellingham, ground source heat pumps or geothermal heat pumps are among the most efficient heating and cooling technologies available. They use the earth’s natural heat to provide space and water heating, as well as cooling. GSHPs provide a cost-effective alternative to electric, oil and natural gas space and water heating. The additional benefit is that these systems also provide cooling capacity using the same equipment during the summer.
GSHPs should be thought of as a long-term investment. They can have long lifespans, in the range of 25 years for GSHP indoor components (i.e. the heat pump) and 50-plus years for ground loops. Although installation costs can be up to several times more expensive, Energy.gov states that GSHPs are up to 65% more efficient than traditional HVAC units and pay themselves back over time in energy savings—typically within 10 years.
GSHPs require installation of underground piping as well as the heat pump to convert the heat into a usable form for a home. The underground equipment can be installed in both a horizontal (ditch) manner or a vertical (drilled) manner. Vertical installations lend themselves to installation on established properties since the surface disruption of yards is relatively minor.
Feasibility
Heat pumps are an outstanding alternative to standard heating systems in Bellingham. Installation and leasing of equipment to support this kind of energy system offers substantial business opportunities to utilities and other energy providers.
E16 MEASURE SUMMARY TABLE Measure Benefits Challenges
Measure E16: Policy Initiatives – Investigate alternative approaches of renewable energy to provide heating including ground, air and water sourced heat pumps
• Technical: Reduces overall energy demand and necessity for carbon-based fuels.
• Social: Provides local jobs in installation and maintenance.
• Financial: Economic opportunity for current and future energy providers.
• Technical: Provides both space heating and cooling.
• Technical: Equipment is durable and has a long replacement cycle.
• Financial: Payback time is typically less than 10 years.
• Financial: Costs for installation are higher than standard electric or gas space and water heating systems.
• Financial: Financing / capital availability may be limited.
Consensus was reached by all Task Force members on this measure as presented.
For additional information, please click on the following references: 30, 31, 32
Measure E17: Reduce or Eliminate Emissions from Large Industrial Consumers of Natural Gas
Large scale industrial and/or commercial consumers of natural gas represent the dominant share of gas consumption and therefore emissions due to the combustion of natural gas. Due to confidentiality constraints imposed on Cascade Natural Gas and Puget Sound Energy, the Task Force was unable to determine the identity of these large-scale consumers. Based on internal data provided by CNG for the year 2018, there are 5 large industrial consumers of gas and 8 ‘transport’ consumers of natural gas. These 13 parties consume 22.7 million therms of gas per year. Only .05% of gas consumers in Bellingham consume 50% of natural gas and are responsible for 50% of the associated emissions (13% to 26.24% of total city emissions across all sectors depending on assumed leakage rate and methane Global Warming Potential (GWP value).
93 | P a g e City of Bellingham Climate Action Task Force Report – December 2019
This means that even if residential and commercial natural gas consumers fully commit to electrification, the Bellingham community cannot achieve reductions to emissions from gas of more than 50%. Total emissions reductions will not exceed 75%. Obviously, this is a massive hurdle to achieving Bellingham’s emissions reduction goals.
Most likely, one of these consumers is Western Washington University’s Steam Plant and another is PSE’s Encogen NGCC power plant downtown (NGCC is an advanced power generation technology which allows improved fuel efficiency of natural gas). Curiously, over 35% of annual gas consumption throughout Bellingham on an annual basis occurs in July and August, the warmest months of the year when space heating needs are non-existent. This fact rules out the WWU steam plant and indicates large scale industrial consumption for cooling needs or consumption by PSE’s Encogen to generate electricity to support large-scale cooling needs.
The Task Force recommends finding a path forward to work with these large-scale consumers of natural gas to identify potential technologies and services that satisfy these energy needs (electricity generation, cooling, and heating etc.) at increased efficiency and, if possible, fuel switching from natural gas to reduce emissions. Again, failure to do so will result in an abatement of less than half of overall emissions from gas.
E17 MEASURE SUMMARY TABLE Measure Benefits Challenges
Measure E17: Reduce or Eliminate Emissions from Large Industrial Consumers of Natural Gas
• Technical: Getting large consumers to switch fuels (e.g. to electricity or RNG), or to substantially reduce energy use, could result in technological innovation.
• Environmental: Greenhouse gas emission reductions would be very large – up to half of the emissions associated with burning natural gas within the City limits of Bellingham.
• Social: Health benefits would likely result from reduced combustion of gas in Bellingham.
• Financial: Large-scale users could see utility cost reductions from reduction of energy use via conservation.
• Technical: Since sources of gas use have not been fully identified, it is unknown if all the technologies exist to reduce or eliminate emissions at all large industrial users.
• Technical: The Encogen plant serves PSE’s grid so the electricity it produces would need to be created in an alternative manner, from sources not specified at this time. Alternately, new sources of grid electricity would be needed to replace this electricity.
• Financial: Depending on the characteristics of the processes currently using natural gas, up-front costs could be substantial.
Consensus was not reached by the Task Force on this measure. PSE’s comments are as follows: The Encogen facility is part of the infrastructure approved by the UTC for PSE to own and operate to meet that mandate
both within and beyond Bellingham city limits. [2] The proposed measure fails to take into consideration the direct and
indirect effects on those stakeholders and interests within and beyond the City.
94 | P a g e City of Bellingham Climate Action Task Force Report – December 2019
SECTION 4: ENERGY DEMAND FROM ELECTRIFICATION
Puget Sound Energy has expressed concerns regarding the increase in electricity demand resulting from two fuel switches: 1) gasoline and diesel-powered internal combustion engines (ICE) to electricity powered electric vehicles (EV), and 2) gas-fired water and space heating appliances to electric heat pump water and space heating. Both EVs and heat pumps use about 1/3 less energy due to drastic efficiency advantages when compared to their fossil fuel-based predecessors and result in dramatic reductions of CO2 emissions, but they will increase electricity demand and PSE will need to increase generation and transmission to accommodate their increased use. Let’s consider a ‘worse-case scenario’. That is, how much would electricity demand grow by 2035 if all vehicular transportation needs and all water and space heating needs were to be served by electricity?
There are many variables to consider here. The most important are vehicle miles traveled, cumulative demand for water heating and space heating, efficiencies (ICE vehicles, EV vehicles, gas water heaters, gas furnaces, electric heat pump water heaters and electric heat pump space conditioners) and the carbon dioxide emission intensity of natural gas (with methane leakage) and various electric power grid resource mix emission intensities.
The following table provides a condensed list of the assumptions involved. Gas use fraction for space, water and cooking in homes as indicated by the Energy Information Agency are 47%, 42% and 4.5% respectively. For commercial buildings the breakdown is 43%, 26.5%, and 23.5 with the higher cooking use resulting from restaurants and commercial kitchens. Full derivations are displayed in the linked spreadsheet.
Condensed List of Assumptions for Calculations Variable Value Units Notes
Population 89045 people 2017 census
Population growth 1.44% -- 2015 Whatcom Comp Plan
Vehicle miles traveled 600,231,185 Miles per year 2018 via Lethal Coe
ICE CO2 per mile 0.404 kg/mile Assume 22 mpg
EV eff 0.025 kWh/mile 2020 EV average
PSE average emissions 472.6 kg/MWh 2018 PSE report
67/33 Wind Solar mix 30.6 kg/MWh NREL scope 3 LCA
Residential Gas Use 13,613,129 therms 2018 CNGC
Commercial Gas Use 8,742,767 therms 2018 CNGC
Eff. Gas Furnace 0.88 --
Eff. Elec. Heat Pump 3.4 --
Eff. Gas Water Heater 0.68 --
Eff. Elec. HP WH 2.23 --
The next figure shows the increased electricity demand due to population growth at 1.44% per year as a baseline demand estimate compared to several demand scenarios. The black line shows baseline growth. The red line shows the total electricity demand due to baseline growth plus universally-adopted EV and heating appliance fuel switching. The numerous other lines show the individual increase in electricity demand due to various fuel switching measures.

95 | P a g e City of Bellingham Climate Action Task Force Report – December 2019
Maximum projected electricity demand accommodating growth, universal adoption of EVs, and 100% residential + community fuel switching
This chart shows Increased electricity demand over time based on assumptions described in the title.
Baseline growth in electricity demand requires a 35.4% increase in electricity demand from 2018 to 2035. Universal fuel switching for vehicles and heating would see a 119% increase in demand from 2018 to 2035. Again, this is a ”worse-case scenario” and it assumes no reductions in VMT due to urbanization, mode-shifting, ride-sharing etc. This scenario also ignores all electrification of heating appliances that has already occurred and therefore assumes that all heating demands are replaced.
The purpose of this analysis was to determine the feasibility of satisfying electricity demand due to fuel shifting. It is feasible, especially when considering exponential build-out of renewable resources.
The next graph shows the per annum CO2 emissions at baseline compared to fuel switching under two grid mix scenarios: PSE today (in blue) and a 100% renewable (wind and solar) mix (in green).
To reduce CO2 emissions, it is imperative that the community stop burning gasoline and natural gas. Even with PSE’s current fuel mix when compared to all other West Coast utilities, the efficiency gains from EVs and heat pumps cut emissions nearly in half. However, by 2035 the emissions return to 2018 levels due to population growth. Switching to renewables renders emissions negligible and is the only viable solution to reach the goals identified by City Council.
kW
h
0.00E+00
5.00E+08
1.00E+09
1.50E+09
2.00E+09
2020 2025 2030 2035
res-space
res-water
res-cook
res-total no cook
com-space
com-water
com-cook
com-other
com-total-no cook
gas-ice-to-kwh-total
gas-ice-to-kwh+base growth
baseline e growth
kwh EV demand
maximum projected electricity demand accommodating growth, ubiquitous EVs, and 100% res + comm fuel switching

96 | P a g e City of Bellingham Climate Action Task Force Report – December 2019
Baseline residential and commercial natural gas emissions compared to universal conversion of gas appliances to electricity (tonnes)
0.00E+00
1.00E+05
2.00E+05
3.00E+05
2017 2018 2019 2020 2021 2022 2023 2024 2025 2026 2027 2028 2029 2030 2031 2032 2033 2034 2035
gas emissions PSE today 100% renewables
baseline residential and commercial nat gas emissions compared to ubiquitous gas appliance switch to electricity
(tonnes)
Chart shows impact of conversion of residential and commercial natural gas appliances over time.

97 | P a g e City of Bellingham Climate Action Task Force Report – December 2019
CHAPTER 8: SUMMARY OF RECOMMENDATIONS Feasibility, Costs, and Impacts
The City Council asked the Task Force to complete an analysis to determine the feasibility of achieving three ambitions as identified in Section 5 of the Council Resolution 2018-6:
• 100% renewable energy for municipal facilities (electricity, heating and transportation) by 2030;
• 100% renewable energy use for the Bellingham community's electricity supply by 2030; and
• 100% renewable energy for community heating and transportation by 2035.
The Task Force has completed this analysis and concluded that meeting all three ambitions of 100% renewable energy by 2035 is technically achievable. However, given what is known today and given the current acceptance of climate as a threat, the City will face significant challenges achieving these ambitions.
The Task Force believes that achieving 100% renewable energy for municipal facilities (electricity, heating and transportation) and Bellingham community's electricity supply are ambitions that the City might expect to achieve by 2030. The first of these is within the responsibilities of the City to determine. The second has strong potential for success with the support of the City, PSE and/or other public or private organizations.
Achieving 100% renewable energy for community heating and transportation by 2035 will be more difficult, requiring considerable support and buy-in from the community as well as substantial financial support in the form of incentives and/or offsets, especially for low income households. Some steps necessary to meet this ambition are outside the control of the City. Limiting access to the city to non-ICE vehicles is particularly problematic since visitors to the City cannot be limited at this time by the type of car they drive. Changes to home appliances necessary to meet this ambition would also require a new regulatory approach and very substantial innovations in programs, finance mechanisms, and incentives. In addition, at present, some businesses in our community require natural gas for certain business purposes, although non-gas alternatives are likely to expand steadily and may be fully available before 2035.
The ability to achieve a fully electrified transportation stock is contingent on cost trends, the availability of charging stations, and the availability of all-electric models that meet the needs of all consumers. While many of these trends are favorable, achieving at or close to 100% EVs may be impacted by factors outside of local control. Consequently, at present it is impossible to predict full electrification of transportation and the building stock by 2035 given current trends and available policy and financial tools. Factors that could accelerate this change include increases in fuel prices, improved understanding of cost savings, and financial incentives. Additionally, should understanding of the climate threat increase, with a consequent impact on lifestyle choices, a more rapid adoption of new energy efficient and carbon-free technologies would be possible.
Photo credit: David Roberts
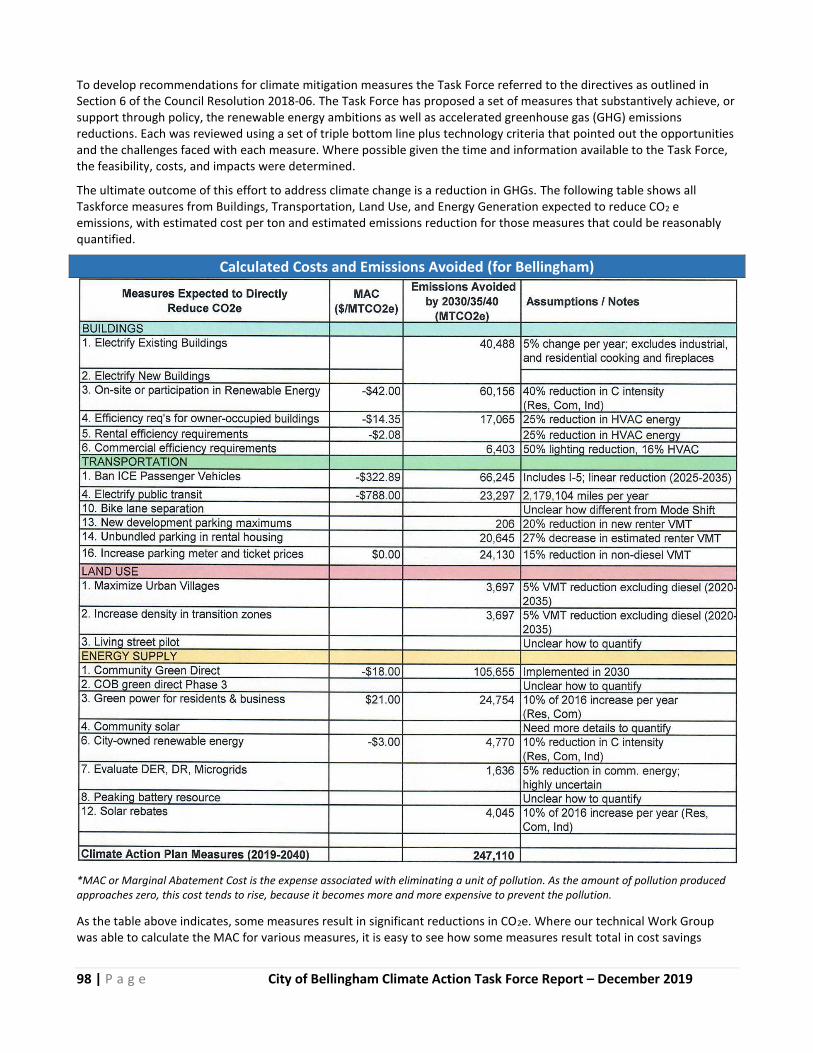
98 | P a g e City of Bellingham Climate Action Task Force Report – December 2019
To develop recommendations for climate mitigation measures the Task Force referred to the directives as outlined in Section 6 of the Council Resolution 2018-06. The Task Force has proposed a set of measures that substantively achieve, or support through policy, the renewable energy ambitions as well as accelerated greenhouse gas (GHG) emissions reductions. Each was reviewed using a set of triple bottom line plus technology criteria that pointed out the opportunities and the challenges faced with each measure. Where possible given the time and information available to the Task Force, the feasibility, costs, and impacts were determined.
The ultimate outcome of this effort to address climate change is a reduction in GHGs. The following table shows all Taskforce measures from Buildings, Transportation, Land Use, and Energy Generation expected to reduce CO2 e emissions, with estimated cost per ton and estimated emissions reduction for those measures that could be reasonably quantified.
Calculated Costs and Emissions Avoided (for Bellingham)
*MAC or Marginal Abatement Cost is the expense associated with eliminating a unit of pollution. As the amount of pollution produced approaches zero, this cost tends to rise, because it becomes more and more expensive to prevent the pollution.
As the table above indicates, some measures result in significant reductions in CO2e. Where our technical Work Group was able to calculate the MAC for various measures, it is easy to see how some measures result total in cost savings

99 | P a g e City of Bellingham Climate Action Task Force Report – December 2019
(negative MAC costs) while the cost for Green Power (See ENERGY SUPPLY 3: Green power for residents & business) is the only calculated measure that has a positive cost.
The next table lists the recommended policy and program measures that accelerate or contribute to the success of the measures that reduce CO2e.
Policy and Program Measures
Measures listed above are policies and programs that directly or indirectly support the recommended measures that result in reductions in CO2e.
100 | P a g e City of Bellingham Climate Action Task Force Report – December 2019
SECTION 1: METHODS: THE MARGINAL ABATEMENT COST (MAC)
Municipal governments that have set greenhouse gas reduction goals are faced with deciding on which mitigation measures are optimal to pursue. While the Task Force seeks to perform a triple bottom-line analysis in this report, two metrics are paramount: abatement potential and cost. A measure is not too useful if it doesn’t prevent the release of carbon dioxide of at least 10 metric tons per year (1% of Bellingham Annual Emissions) nor is it useful if it is terribly expensive (>$100/mt). Marginal carbon abatement cost curves have become a common tool to analyze which measures are the most cost-effective and have the largest emissions reductions potential.
A MAC curve was produced for the Task Force, plotting a suite of measures from the Climate Action Plan Task Force and the 2018 Update of the City’s Climate Protection Action Plan. The measures that will be analyzed and plotted on the curve cover the six core strategy categories outlined in the Plan: Energy Efficiency and Conservation, Transportation, Renewable Energy, Green Building, Land Use, and Waste Reduction. Some examples of specific measures that will be analyzed and plotted on the curve include community solar programs, PSE Green Power purchases, anaerobic bio-digester generation, energy efficiency improvements in municipal buildings, and public transit fleet electrification. The MAC curve will be constructed using a bottom-up approach that quantifies the cost-effectiveness of each measure in avoiding emissions. Much of the methodology and calculations follow that of the approach outlined in Ibrahim and Kennedy’s 2016 study.1 To plot the measures graphically two variables will need to be calculated - for the x-axis - the abatement potential (tCO2) and for the y-axis, the cost-effectiveness ($/tCO2).
The calculation of marginal cost to abate a mt of carbon dioxide begins simply enough but the individual terms house nested assumptions and variables. In short it is the annualized marginal cost (capital and operational) associated with replacing an energy resource, technology or appliance with one that emits less carbon divided by the annual amount of carbon dioxide emissions avoided.
$
𝑡𝐶𝑂2=
𝑐𝑜𝑠𝑡𝑝𝑟𝑜𝑗𝑒𝑐𝑡 − 𝑐𝑜𝑠𝑡𝑏𝑎𝑠𝑒𝑙𝑖𝑛𝑒
𝐶𝑂2𝑏𝑎𝑠𝑒𝑙𝑖𝑛𝑒 − 𝐶𝑂2𝑝𝑟𝑜𝑗𝑒𝑐𝑡
Note that the differences in the numerator and denominator are arranged such that the $ amount is positive if the project is more expensive than baseline and baseline emissions are greater than project emissions. A detailed breakdown of methods can be found in Appendix 3. The Task Force analysis includes project and baseline lifetimes, capital costs, operating costs and discount/interest rates where applicable.
SECTION 2: RESULTS
The figure below shows annual emissions avoided in year 2030/2035 as a function of each abatement measure. It emphasizes the effectiveness of 1) decarbonizing electricity with renewables, switching from ICE vehicles to EVs, and 2) making efficiency improvements in residential and commercial buildings. Decarbonizing electricity supply, the electrification of vehicles, the electrification of space heating, building efficiency and switching buildings from gas to electricity yield the greatest reduction in GHG emissions. Note that when switching from gasoline to EV and natural gas heating to electric heating the avoided emissions depend on the carbon intensity of the electricity as indicated by the three columns showing both “renewables” and “PSE”.
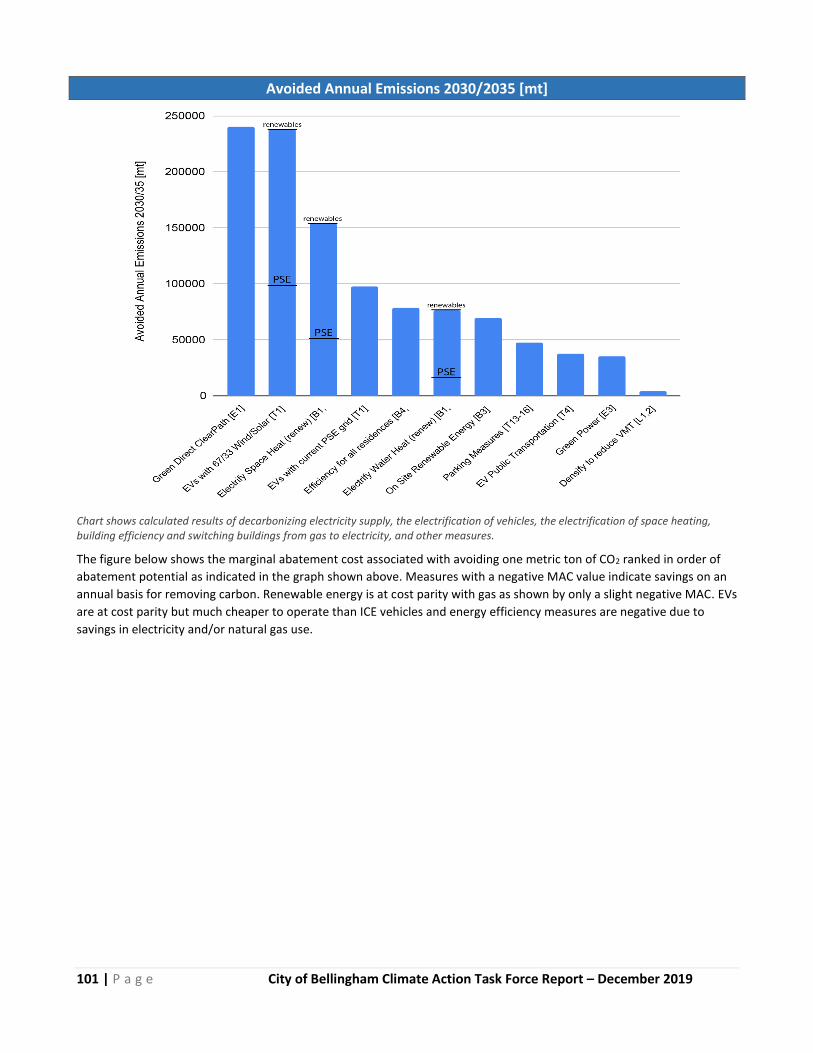
101 | P a g e City of Bellingham Climate Action Task Force Report – December 2019
Avoided Annual Emissions 2030/2035 [mt]
Chart shows calculated results of decarbonizing electricity supply, the electrification of vehicles, the electrification of space heating, building efficiency and switching buildings from gas to electricity, and other measures.
The figure below shows the marginal abatement cost associated with avoiding one metric ton of CO2 ranked in order of
abatement potential as indicated in the graph shown above. Measures with a negative MAC value indicate savings on an
annual basis for removing carbon. Renewable energy is at cost parity with gas as shown by only a slight negative MAC. EVs
are at cost parity but much cheaper to operate than ICE vehicles and energy efficiency measures are negative due to
savings in electricity and/or natural gas use.
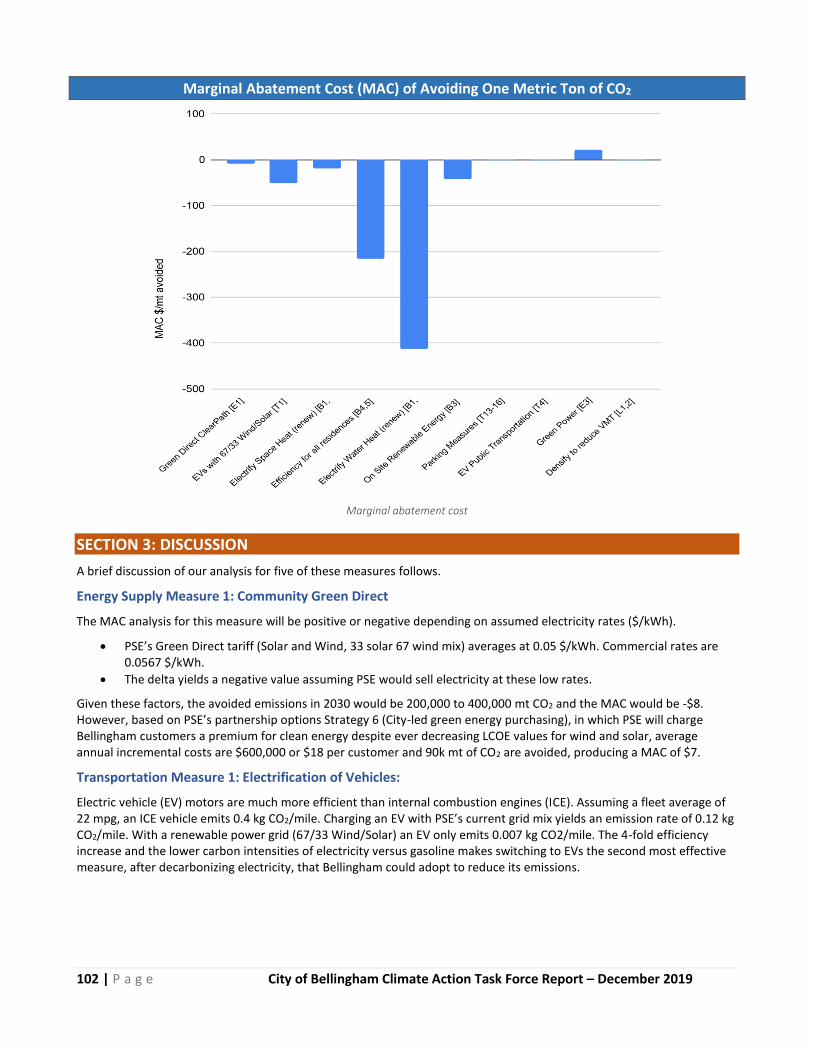
102 | P a g e City of Bellingham Climate Action Task Force Report – December 2019
Marginal Abatement Cost (MAC) of Avoiding One Metric Ton of CO2
Marginal abatement cost
SECTION 3: DISCUSSION
A brief discussion of our analysis for five of these measures follows.
Energy Supply Measure 1: Community Green Direct
The MAC analysis for this measure will be positive or negative depending on assumed electricity rates ($/kWh).
• PSE’s Green Direct tariff (Solar and Wind, 33 solar 67 wind mix) averages at 0.05 $/kWh. Commercial rates are 0.0567 $/kWh.
• The delta yields a negative value assuming PSE would sell electricity at these low rates.
Given these factors, the avoided emissions in 2030 would be 200,000 to 400,000 mt CO2 and the MAC would be -$8. However, based on PSE’s partnership options Strategy 6 (City-led green energy purchasing), in which PSE will charge Bellingham customers a premium for clean energy despite ever decreasing LCOE values for wind and solar, average annual incremental costs are $600,000 or $18 per customer and 90k mt of CO2 are avoided, producing a MAC of $7.
Transportation Measure 1: Electrification of Vehicles:
Electric vehicle (EV) motors are much more efficient than internal combustion engines (ICE). Assuming a fleet average of 22 mpg, an ICE vehicle emits 0.4 kg CO2/mile. Charging an EV with PSE’s current grid mix yields an emission rate of 0.12 kg CO2/mile. With a renewable power grid (67/33 Wind/Solar) an EV only emits 0.007 kg CO2/mile. The 4-fold efficiency increase and the lower carbon intensities of electricity versus gasoline makes switching to EVs the second most effective measure, after decarbonizing electricity, that Bellingham could adopt to reduce its emissions.
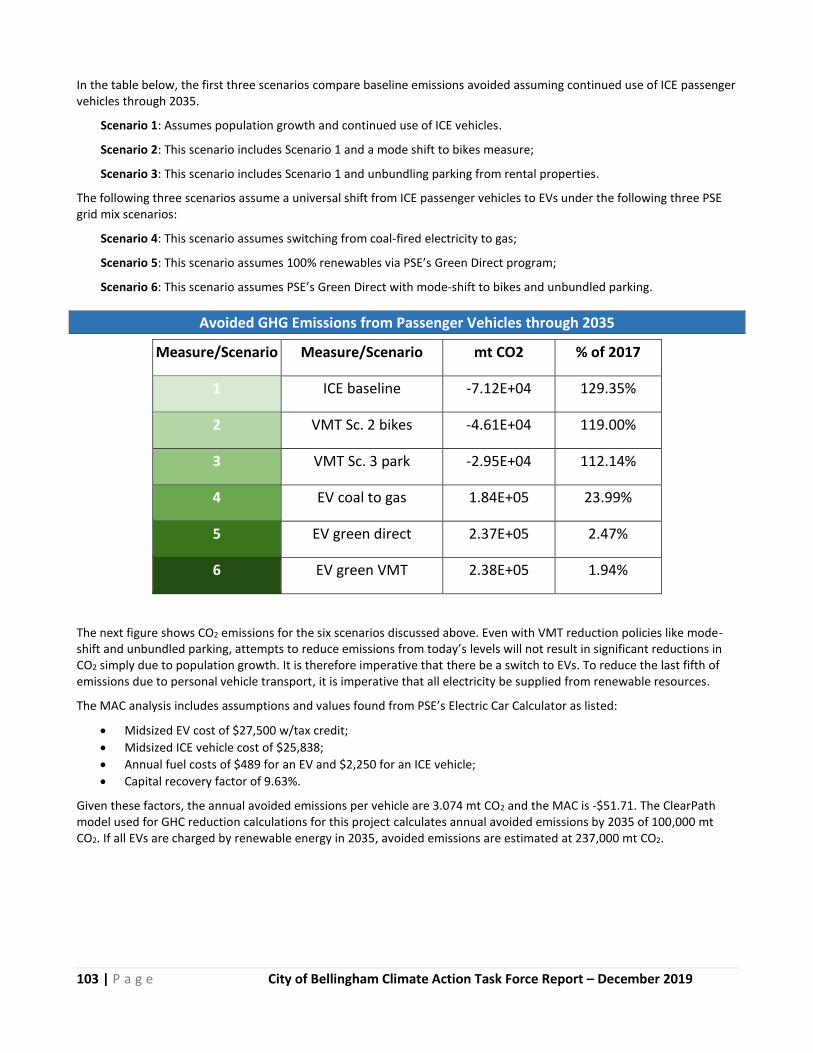
103 | P a g e City of Bellingham Climate Action Task Force Report – December 2019
In the table below, the first three scenarios compare baseline emissions avoided assuming continued use of ICE passenger vehicles through 2035.
Scenario 1: Assumes population growth and continued use of ICE vehicles.
Scenario 2: This scenario includes Scenario 1 and a mode shift to bikes measure;
Scenario 3: This scenario includes Scenario 1 and unbundling parking from rental properties.
The following three scenarios assume a universal shift from ICE passenger vehicles to EVs under the following three PSE grid mix scenarios:
Scenario 4: This scenario assumes switching from coal-fired electricity to gas;
Scenario 5: This scenario assumes 100% renewables via PSE’s Green Direct program;
Scenario 6: This scenario assumes PSE’s Green Direct with mode-shift to bikes and unbundled parking.
Avoided GHG Emissions from Passenger Vehicles through 2035
Measure/Scenario Measure/Scenario mt CO2 % of 2017
1 ICE baseline -7.12E+04 129.35%
2 VMT Sc. 2 bikes -4.61E+04 119.00%
3 VMT Sc. 3 park -2.95E+04 112.14%
4 EV coal to gas 1.84E+05 23.99%
5 EV green direct 2.37E+05 2.47%
6 EV green VMT 2.38E+05 1.94%
The next figure shows CO2 emissions for the six scenarios discussed above. Even with VMT reduction policies like mode-shift and unbundled parking, attempts to reduce emissions from today’s levels will not result in significant reductions in CO2 simply due to population growth. It is therefore imperative that there be a switch to EVs. To reduce the last fifth of emissions due to personal vehicle transport, it is imperative that all electricity be supplied from renewable resources.
The MAC analysis includes assumptions and values found from PSE’s Electric Car Calculator as listed:
• Midsized EV cost of $27,500 w/tax credit;
• Midsized ICE vehicle cost of $25,838;
• Annual fuel costs of $489 for an EV and $2,250 for an ICE vehicle;
• Capital recovery factor of 9.63%.
Given these factors, the annual avoided emissions per vehicle are 3.074 mt CO2 and the MAC is -$51.71. The ClearPath model used for GHC reduction calculations for this project calculates annual avoided emissions by 2035 of 100,000 mt CO2. If all EVs are charged by renewable energy in 2035, avoided emissions are estimated at 237,000 mt CO2.

104 | P a g e City of Bellingham Climate Action Task Force Report – December 2019
Car-based Transportation Emissions (mt CO2)
Building Measure 1: Electrify Building Space and Water Heating
This MAC analysis includes assumptions and values based on:
• All residences and commercial buildings in Bellingham and efficiencies for gas furnaces at 80% and heat pumps at 340%, CO2 reductions per year will be 52k mt/year for PSE’s current grid mix and 153k mt/year for an all-renewable grid mix. Replacing gas-fired water heaters with electric heat pump hybrid water heaters will avoid 16k mt/year for PSE’s mix and 76k mt/year with an all renewable mix.
• Heat pump space heaters have high capital costs that can vary significantly from one installation to the next leading to a low MAC estimate of -$47/mt and a high estimate of $222/mt. Using an average cost figure, costs are slightly negative as shown in the preceding MAC chart.
• Electric heat pump water heaters are not significantly more expensive than gas water heaters; they last 5 years longer and their much higher efficiencies lead to one of the most affordable MAC estimates at $-413/mt.
0.00E+00
1.00E+05
2.00E+05
3.00E+05
4.00E+05
2020 2025 2030 2035
ICE baseline
VMT Sc. 2 bikes
VMT Sc. 3 park
EV coal to gas
EV green direct
EV green -VMT
Car-Based Transportation Emissions (mt CO2)
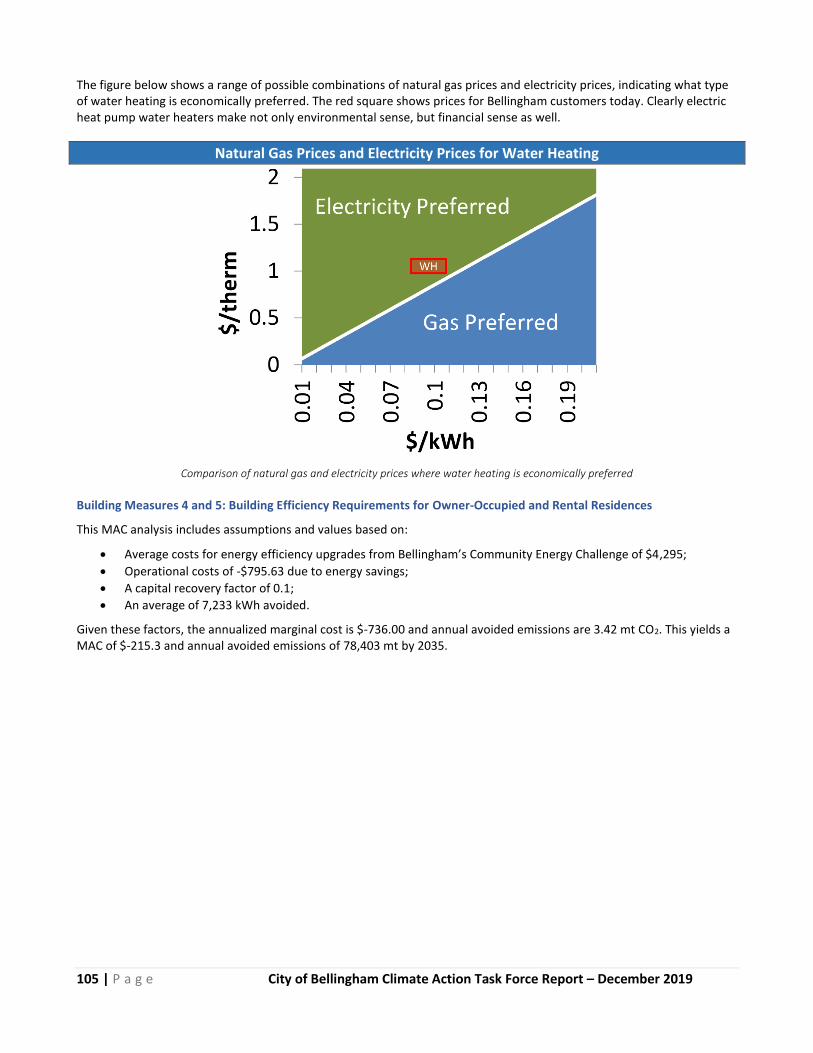
105 | P a g e City of Bellingham Climate Action Task Force Report – December 2019
The figure below shows a range of possible combinations of natural gas prices and electricity prices, indicating what type of water heating is economically preferred. The red square shows prices for Bellingham customers today. Clearly electric heat pump water heaters make not only environmental sense, but financial sense as well.
Natural Gas Prices and Electricity Prices for Water Heating
Comparison of natural gas and electricity prices where water heating is economically preferred
Building Measures 4 and 5: Building Efficiency Requirements for Owner-Occupied and Rental Residences
This MAC analysis includes assumptions and values based on:
• Average costs for energy efficiency upgrades from Bellingham’s Community Energy Challenge of $4,295;
• Operational costs of -$795.63 due to energy savings;
• A capital recovery factor of 0.1;
• An average of 7,233 kWh avoided.
Given these factors, the annualized marginal cost is $-736.00 and annual avoided emissions are 3.42 mt CO2. This yields a MAC of $-215.3 and annual avoided emissions of 78,403 mt by 2035.
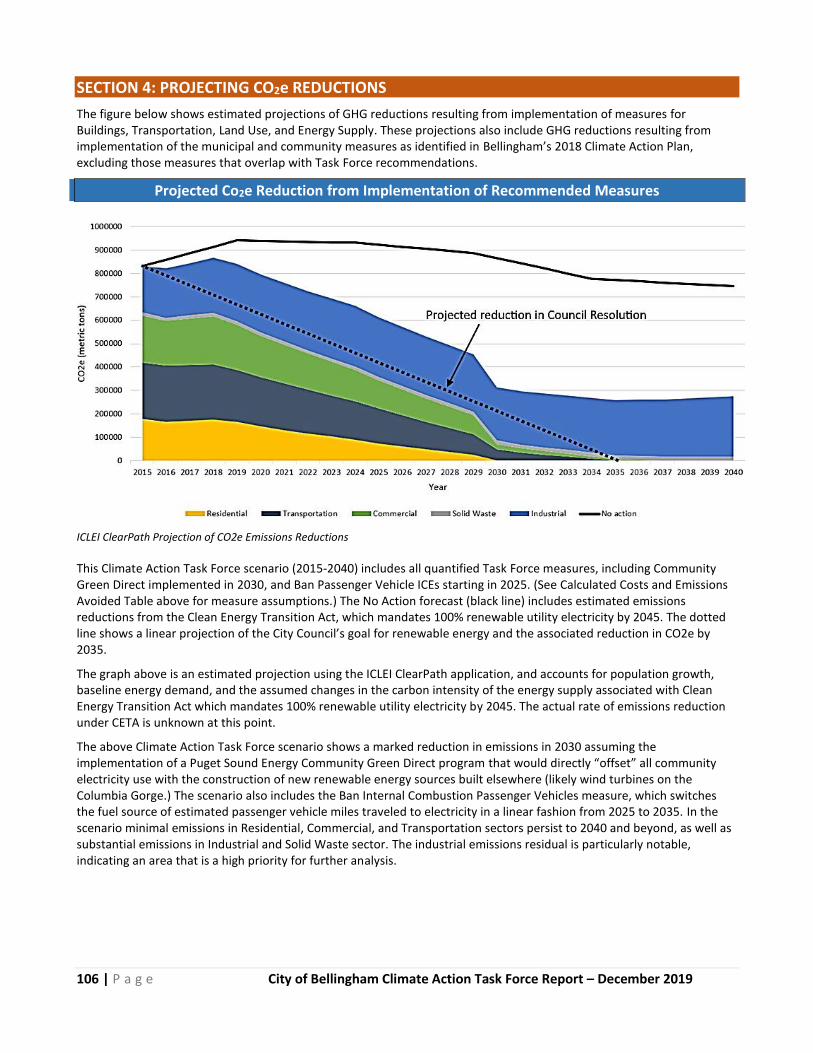
106 | P a g e City of Bellingham Climate Action Task Force Report – December 2019
SECTION 4: PROJECTING CO2e REDUCTIONS
The figure below shows estimated projections of GHG reductions resulting from implementation of measures for Buildings, Transportation, Land Use, and Energy Supply. These projections also include GHG reductions resulting from implementation of the municipal and community measures as identified in Bellingham’s 2018 Climate Action Plan, excluding those measures that overlap with Task Force recommendations.
Projected Co2e Reduction from Implementation of Recommended Measures
ICLEI ClearPath Projection of CO2e Emissions Reductions
This Climate Action Task Force scenario (2015-2040) includes all quantified Task Force measures, including Community Green Direct implemented in 2030, and Ban Passenger Vehicle ICEs starting in 2025. (See Calculated Costs and Emissions Avoided Table above for measure assumptions.) The No Action forecast (black line) includes estimated emissions reductions from the Clean Energy Transition Act, which mandates 100% renewable utility electricity by 2045. The dotted line shows a linear projection of the City Council’s goal for renewable energy and the associated reduction in CO2e by 2035.
The graph above is an estimated projection using the ICLEI ClearPath application, and accounts for population growth, baseline energy demand, and the assumed changes in the carbon intensity of the energy supply associated with Clean Energy Transition Act which mandates 100% renewable utility electricity by 2045. The actual rate of emissions reduction under CETA is unknown at this point.
The above Climate Action Task Force scenario shows a marked reduction in emissions in 2030 assuming the implementation of a Puget Sound Energy Community Green Direct program that would directly “offset” all community electricity use with the construction of new renewable energy sources built elsewhere (likely wind turbines on the Columbia Gorge.) The scenario also includes the Ban Internal Combustion Passenger Vehicles measure, which switches the fuel source of estimated passenger vehicle miles traveled to electricity in a linear fashion from 2025 to 2035. In the scenario minimal emissions in Residential, Commercial, and Transportation sectors persist to 2040 and beyond, as well as substantial emissions in Industrial and Solid Waste sector. The industrial emissions residual is particularly notable, indicating an area that is a high priority for further analysis.
107 | P a g e City of Bellingham Climate Action Task Force Report – December 2019
CHAPTER 9: CONCLUSIONS
In summary, over the last 15 months, the Task Force has devoted over a thousand hours to address the Council’s request for a feasibility analysis of a 100% renewable energy supply and estimates of GHG reduction. The Task Force members drew upon their extensive background and knowledge of the issues related to energy supply, buildings, transportation, and land use. They looked across the country and around the world to find the most promising and achievable ideas for your consideration. The Task Force appreciates the opportunity to support the Council and provide this report.
The Task Force members firmly believe that bold action is needed as soon as possible. The Task Force encourages the Council to move forward with all possible haste given rapidly changing climate indicators and the projected impacts on our communities, economies, and ecosystems.
Many of these recommendations are based on programs that have already been implemented in other municipalities and therefore will not require extensive analysis by City staff. However, other recommendations will require more careful consideration of the specific characteristics, concerns and needs of the community, or because of state programs and legal frameworks that could impact implementation.
In addition to these measures, the City should carry out a comprehensive engagement process with our community that focuses on the values of the community and shows how the recommended actions in this report will benefit all aspects of our community.
Bellingham has a history of aggressively addressing energy and environmental challenges and is positioned to be a leader in developing creative solutions. These solutions will not only reduce climate change but have long-term financial, environmental, social, and public health benefits for all.
Photo credit: David Roberts

108 | P a g e City of Bellingham Climate Action Task Force Report – December 2019
APPENDIX 1: COMBINED LIST OF MEASURES
Climate Action Plan Municipal Measures
Task Force Recommendations
Energy Efficiency and Conservation
Resource Conservation Management
Post Point Best Management Practices
Federal Building Retrofits
LED Streetlight Upgrades
Operations and Employee Actions
Parks LED Upgrades
Renewable Energy
100% Green Power When Available, COB Subscribes to Green Direct Phase 3 with PSE
City Solar Explore City-Owned Renewable Energy Generation for Municipal and Community Use
Post Point Resource Recovery
Wastewater Heat Recovery
No comparable Conduct a Feasibility Study for City Municipal Utility District with Mandate to Procure 100% Renewable Energy
Transportation
Biodiesel Pilot Project
Commute Trip Reduction Program City Employee Parking Fee
Increase Biodiesel/Renewable Diesel Use
Invest in Hybrid and Electric Vehicles
10% Ethanol in City Fleet
Limit Idling
35% Reduction in Employee Commute VMT
Free Employee Bus Passes
City Bike Fleet
Green Fleet Work Plan
Western Washington Clean Cities
Become Evergreen Fleets Certified
Efficient Driver Training
Advanced Vehicle Locator Systems
Diesel Exhaust Retrofits
Green Building
LEED Buildings
Recycled Construction Materials
Waste Reduction
City Hall Recycling
Green Purchasing
All City Facility Recycling
Green Event Kits
Municipal Waste Monitoring
Waste Reduction Plan
Good-On-One-Side Notepads
Specialty Recycling
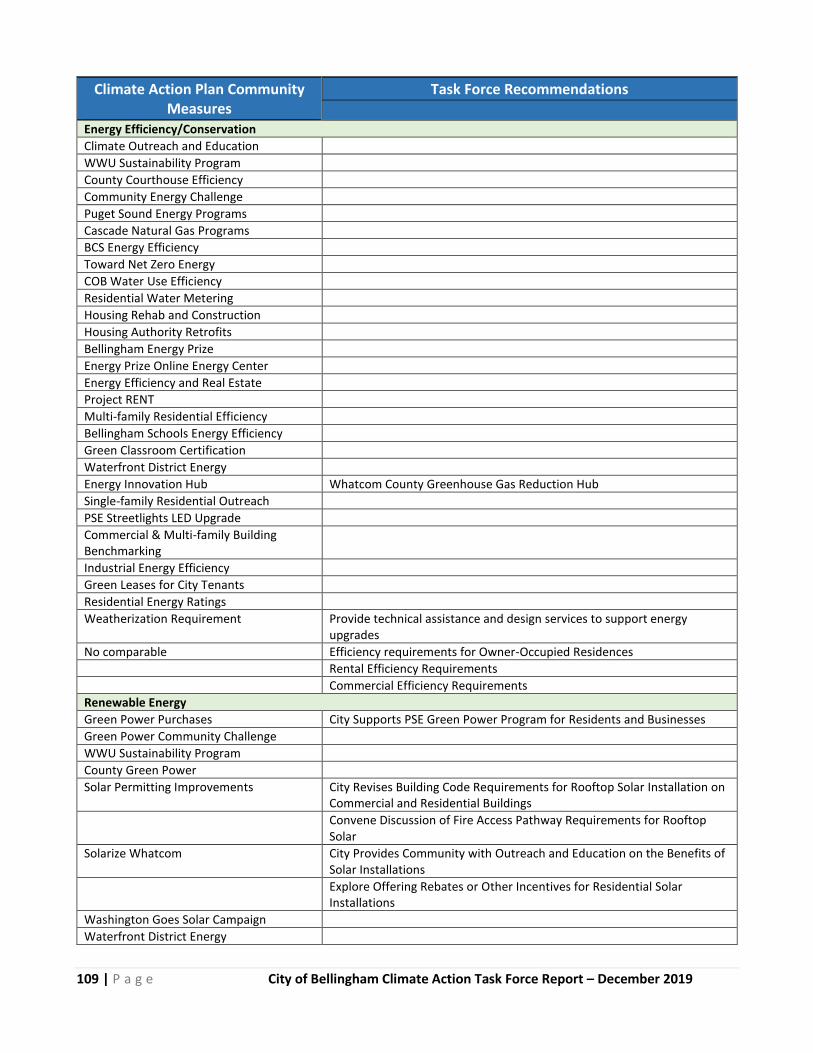
109 | P a g e City of Bellingham Climate Action Task Force Report – December 2019
Climate Action Plan Community Measures
Task Force Recommendations
Energy Efficiency/Conservation
Climate Outreach and Education
WWU Sustainability Program
County Courthouse Efficiency
Community Energy Challenge
Puget Sound Energy Programs
Cascade Natural Gas Programs
BCS Energy Efficiency
Toward Net Zero Energy
COB Water Use Efficiency
Residential Water Metering
Housing Rehab and Construction
Housing Authority Retrofits
Bellingham Energy Prize
Energy Prize Online Energy Center
Energy Efficiency and Real Estate
Project RENT
Multi-family Residential Efficiency
Bellingham Schools Energy Efficiency
Green Classroom Certification
Waterfront District Energy
Energy Innovation Hub Whatcom County Greenhouse Gas Reduction Hub
Single-family Residential Outreach
PSE Streetlights LED Upgrade
Commercial & Multi-family Building Benchmarking
Industrial Energy Efficiency
Green Leases for City Tenants
Residential Energy Ratings
Weatherization Requirement Provide technical assistance and design services to support energy upgrades
No comparable Efficiency requirements for Owner-Occupied Residences
Rental Efficiency Requirements
Commercial Efficiency Requirements
Renewable Energy
Green Power Purchases City Supports PSE Green Power Program for Residents and Businesses
Green Power Community Challenge
WWU Sustainability Program
County Green Power
Solar Permitting Improvements City Revises Building Code Requirements for Rooftop Solar Installation on Commercial and Residential Buildings
Convene Discussion of Fire Access Pathway Requirements for Rooftop Solar
Solarize Whatcom City Provides Community with Outreach and Education on the Benefits of Solar Installations
Explore Offering Rebates or Other Incentives for Residential Solar Installations
Washington Goes Solar Campaign
Waterfront District Energy
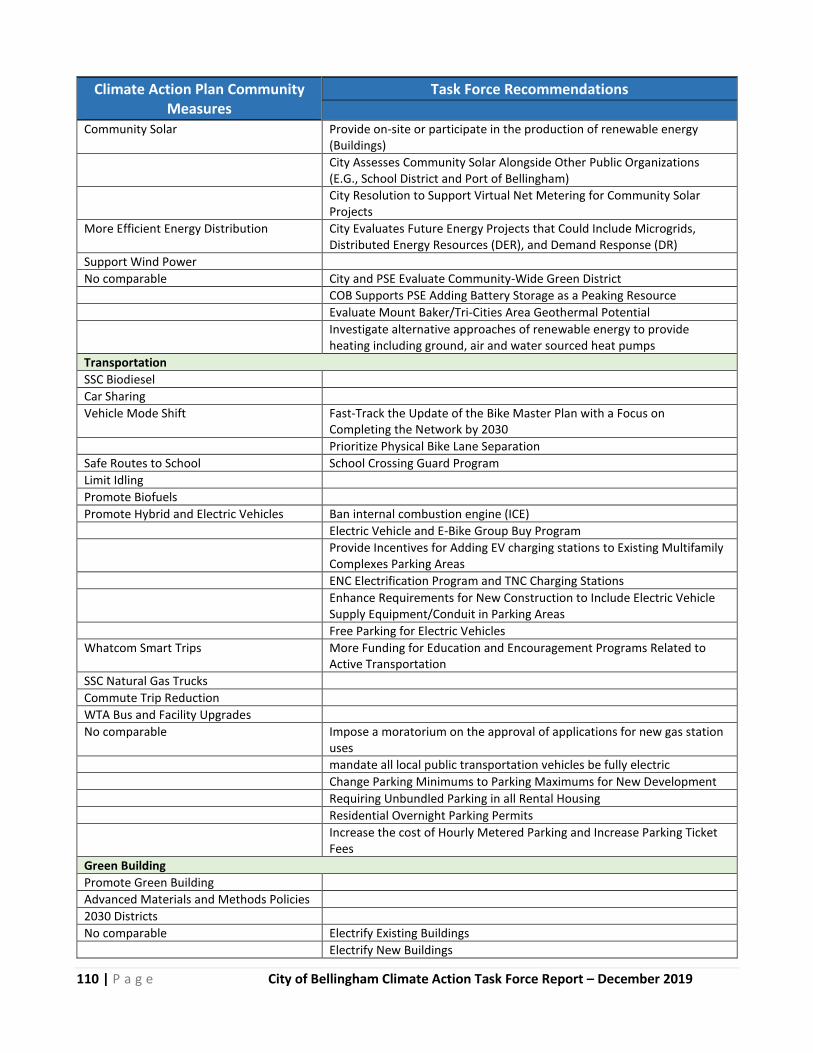
110 | P a g e City of Bellingham Climate Action Task Force Report – December 2019
Climate Action Plan Community Measures
Task Force Recommendations
Community Solar Provide on-site or participate in the production of renewable energy (Buildings)
City Assesses Community Solar Alongside Other Public Organizations (E.G., School District and Port of Bellingham)
City Resolution to Support Virtual Net Metering for Community Solar Projects
More Efficient Energy Distribution City Evaluates Future Energy Projects that Could Include Microgrids, Distributed Energy Resources (DER), and Demand Response (DR)
Support Wind Power
No comparable City and PSE Evaluate Community-Wide Green District
COB Supports PSE Adding Battery Storage as a Peaking Resource
Evaluate Mount Baker/Tri-Cities Area Geothermal Potential
Investigate alternative approaches of renewable energy to provide heating including ground, air and water sourced heat pumps
Transportation
SSC Biodiesel
Car Sharing
Vehicle Mode Shift Fast-Track the Update of the Bike Master Plan with a Focus on Completing the Network by 2030
Prioritize Physical Bike Lane Separation
Safe Routes to School School Crossing Guard Program
Limit Idling
Promote Biofuels
Promote Hybrid and Electric Vehicles Ban internal combustion engine (ICE)
Electric Vehicle and E-Bike Group Buy Program
Provide Incentives for Adding EV charging stations to Existing Multifamily Complexes Parking Areas
ENC Electrification Program and TNC Charging Stations
Enhance Requirements for New Construction to Include Electric Vehicle Supply Equipment/Conduit in Parking Areas
Free Parking for Electric Vehicles
Whatcom Smart Trips More Funding for Education and Encouragement Programs Related to Active Transportation
SSC Natural Gas Trucks
Commute Trip Reduction
WTA Bus and Facility Upgrades
No comparable Impose a moratorium on the approval of applications for new gas station uses
mandate all local public transportation vehicles be fully electric
Change Parking Minimums to Parking Maximums for New Development
Requiring Unbundled Parking in all Rental Housing
Residential Overnight Parking Permits
Increase the cost of Hourly Metered Parking and Increase Parking Ticket Fees
Green Building
Promote Green Building
Advanced Materials and Methods Policies
2030 Districts
No comparable Electrify Existing Buildings
Electrify New Buildings
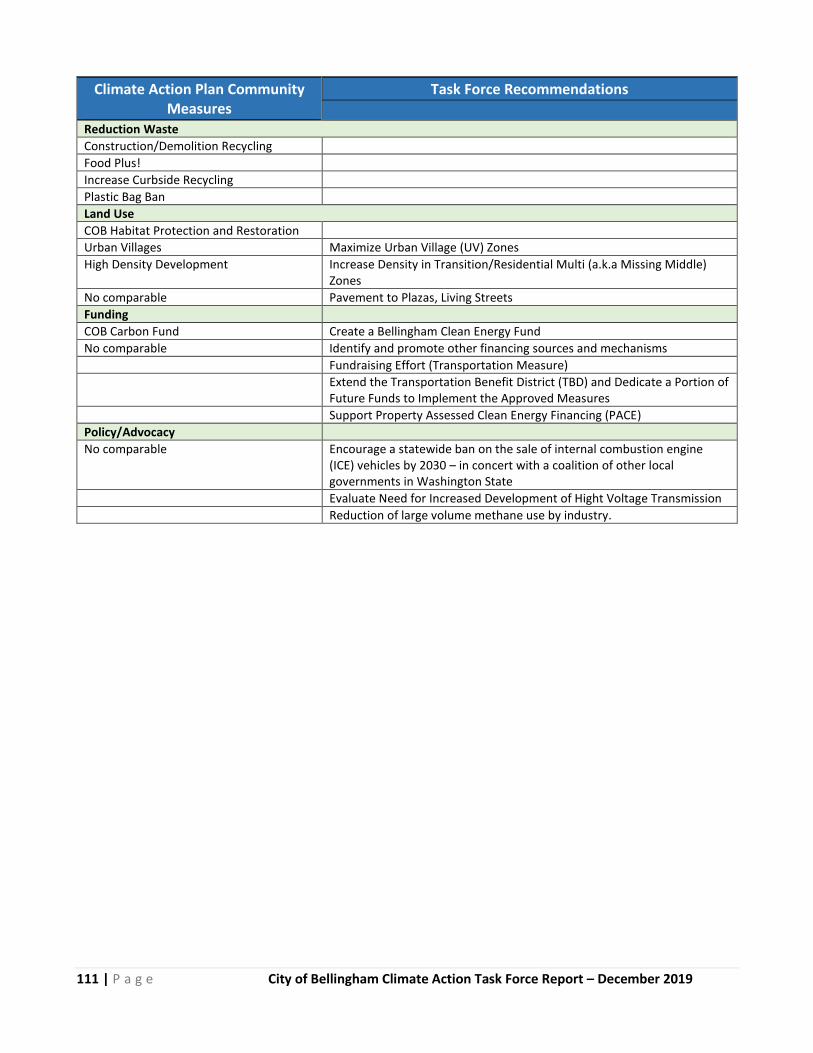
111 | P a g e City of Bellingham Climate Action Task Force Report – December 2019
Climate Action Plan Community Measures
Task Force Recommendations
Reduction Waste
Construction/Demolition Recycling
Food Plus!
Increase Curbside Recycling
Plastic Bag Ban
Land Use
COB Habitat Protection and Restoration
Urban Villages Maximize Urban Village (UV) Zones
High Density Development Increase Density in Transition/Residential Multi (a.k.a Missing Middle) Zones
No comparable Pavement to Plazas, Living Streets
Funding
COB Carbon Fund Create a Bellingham Clean Energy Fund
No comparable Identify and promote other financing sources and mechanisms
Fundraising Effort (Transportation Measure)
Extend the Transportation Benefit District (TBD) and Dedicate a Portion of Future Funds to Implement the Approved Measures
Support Property Assessed Clean Energy Financing (PACE)
Policy/Advocacy
No comparable Encourage a statewide ban on the sale of internal combustion engine (ICE) vehicles by 2030 – in concert with a coalition of other local governments in Washington State
Evaluate Need for Increased Development of Hight Voltage Transmission
Reduction of large volume methane use by industry.

112 | P a g e City of Bellingham Climate Action Task Force Report – December 2019
APPENDIX 2: ACRONYMS AND DEFINITIONS
Term Definition 100% renewable energy A 100% goal is fully achieved when the amount of energy generated from renewable
energy sources in the territory (or brought into it) equals or exceeds 100% of the annual energy consumed within that territory.
Atmosphere Commonly known as air, this layer of gases that surrounds our planet protects life on Earth and is held in place by gravity. It is composed primarily of nitrogen (78%) and oxygen (21%) and plays a major role in the water cycle, the nitrogen cycle, and the carbon cycle. The Earth’s atmosphere creates pressure allowing for liquid water to exist on the Earth's surface, absorbing ultraviolet solar radiation, warming the surface through heat retention, and reducing temperature extremes between day and night. Our atmosphere is about 60 miles thick, but most of the atmosphere (about 80%) is within 10 miles (16 km) of the surface of the Earth.
Bonneville Power Administration (BPA)
The BPA is a nonprofit federal power marketing administration based in the Pacific Northwest. Although BPA is part of the U.S. Department of Energy, it is self-funding and covers its costs by selling its products and services.
Bike Master Plan (BMP) The BMP recommends the steps should be taken to improve the existing transportation system and make a place more bicycle friendly. It informs and guides future investments in creating a connected network of comfortable cycling routes and facilities.
Commercial Property Assessed Clean Energy and Resilience tool (C-PACER and PACE)
C-PACER is an innovative economic development and financing tool called Property Assessed Clean Energy and Resilience tool. This financing approach can reduce barriers for owners seeking to improve and extend the life of their buildings for clean energy. PACE loans can be used to finance energy efficiency, renewable energy, water conservation, fire protection, seismic, or flood readiness enhancements. An “R” has been added to PACE to include financing to cover resilience measures in addition to clean energy measures.
Carbon Dioxide (CO2) A heavy odorless colorless greenhouse gas formed during respiration and by the decomposition of organic substances; absorbed from the air by plants in photosynthesis.
Carbon offset An action intended to compensate for the emission of carbon dioxide into the atmosphere as a result of industrial or other human activity, especially when quantified and traded as part of a commercial program.
Cascade Natural Gas Corporation (CNG)
Cascade Natural Gas Corporation is a subsidiary of MDU Resources Group, Inc. CNG is a Seattle-based natural gas distribution company that distributes natural gas to residential, commercial, industrial and transportation customers in Washington and Oregon.
Clean Energy Transformation Act (CETA)
The Clean Energy Transformation Act (CETA) applies to all electric utilities serving retail customers in Washington and sets specific milestones to reach the required 100% clean electricity supply. The first milestone is in 2022, when each utility must prepare and publish a clean energy implementation plan with its own targets for energy efficiency and renewable energy.
Combustion The carbon from the gasoline mixes with oxygen from the air. Gasoline consists mostly of hydrocarbons—chains of carbon encircled by atoms of hydrogen. When the hydrocarbons burn, they break apart and recombine with the air. This reaction produces heat, as well as two chemical byproducts: water and carbon dioxide
Community Development Financial Institutions (CFDI)
CFDIs are private financial institutions that are 100% dedicated to delivering responsible, affordable lending to help low-income, low-wealth, and other disadvantaged people and communities join the economic mainstream.
Community Energy Challenge (CEC)
The Community Energy Challenge is a non-profit partnership between Opportunity Council and Sustainable Connections. The two-fold goal of the Community Energy
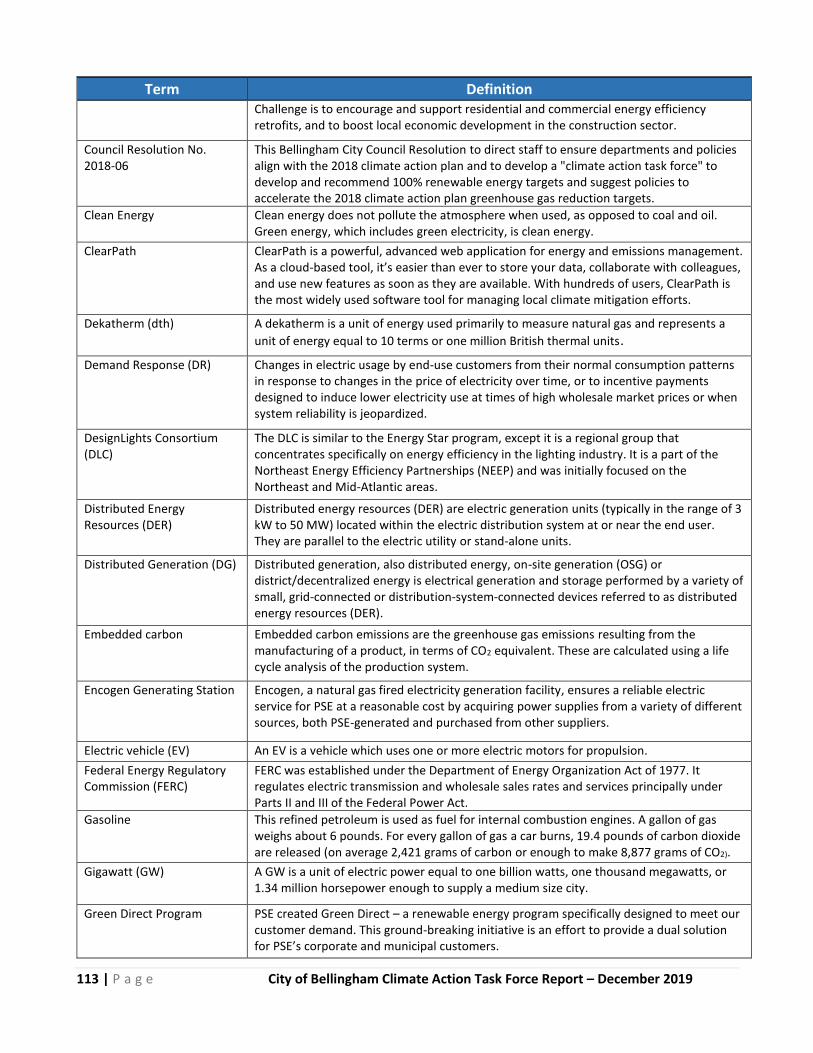
113 | P a g e City of Bellingham Climate Action Task Force Report – December 2019
Term Definition Challenge is to encourage and support residential and commercial energy efficiency retrofits, and to boost local economic development in the construction sector.
Council Resolution No. 2018-06
This Bellingham City Council Resolution to direct staff to ensure departments and policies align with the 2018 climate action plan and to develop a "climate action task force" to develop and recommend 100% renewable energy targets and suggest policies to accelerate the 2018 climate action plan greenhouse gas reduction targets.
Clean Energy Clean energy does not pollute the atmosphere when used, as opposed to coal and oil. Green energy, which includes green electricity, is clean energy.
ClearPath ClearPath is a powerful, advanced web application for energy and emissions management. As a cloud-based tool, it’s easier than ever to store your data, collaborate with colleagues, and use new features as soon as they are available. With hundreds of users, ClearPath is the most widely used software tool for managing local climate mitigation efforts.
Dekatherm (dth) A dekatherm is a unit of energy used primarily to measure natural gas and represents a
unit of energy equal to 10 terms or one million British thermal units.
Demand Response (DR)
Changes in electric usage by end-use customers from their normal consumption patterns in response to changes in the price of electricity over time, or to incentive payments designed to induce lower electricity use at times of high wholesale market prices or when system reliability is jeopardized.
DesignLights Consortium (DLC)
The DLC is similar to the Energy Star program, except it is a regional group that concentrates specifically on energy efficiency in the lighting industry. It is a part of the Northeast Energy Efficiency Partnerships (NEEP) and was initially focused on the Northeast and Mid-Atlantic areas.
Distributed Energy Resources (DER)
Distributed energy resources (DER) are electric generation units (typically in the range of 3 kW to 50 MW) located within the electric distribution system at or near the end user. They are parallel to the electric utility or stand-alone units.
Distributed Generation (DG) Distributed generation, also distributed energy, on-site generation (OSG) or district/decentralized energy is electrical generation and storage performed by a variety of small, grid-connected or distribution-system-connected devices referred to as distributed energy resources (DER).
Embedded carbon Embedded carbon emissions are the greenhouse gas emissions resulting from the manufacturing of a product, in terms of CO2 equivalent. These are calculated using a life cycle analysis of the production system.
Encogen Generating Station Encogen, a natural gas fired electricity generation facility, ensures a reliable electric service for PSE at a reasonable cost by acquiring power supplies from a variety of different sources, both PSE-generated and purchased from other suppliers.
Electric vehicle (EV) An EV is a vehicle which uses one or more electric motors for propulsion.
Federal Energy Regulatory Commission (FERC)
FERC was established under the Department of Energy Organization Act of 1977. It regulates electric transmission and wholesale sales rates and services principally under Parts II and III of the Federal Power Act.
Gasoline This refined petroleum is used as fuel for internal combustion engines. A gallon of gas weighs about 6 pounds. For every gallon of gas a car burns, 19.4 pounds of carbon dioxide are released (on average 2,421 grams of carbon or enough to make 8,877 grams of CO2).
Gigawatt (GW) A GW is a unit of electric power equal to one billion watts, one thousand megawatts, or 1.34 million horsepower enough to supply a medium size city.
Green Direct Program PSE created Green Direct – a renewable energy program specifically designed to meet our customer demand. This ground-breaking initiative is an effort to provide a dual solution for PSE’s corporate and municipal customers.
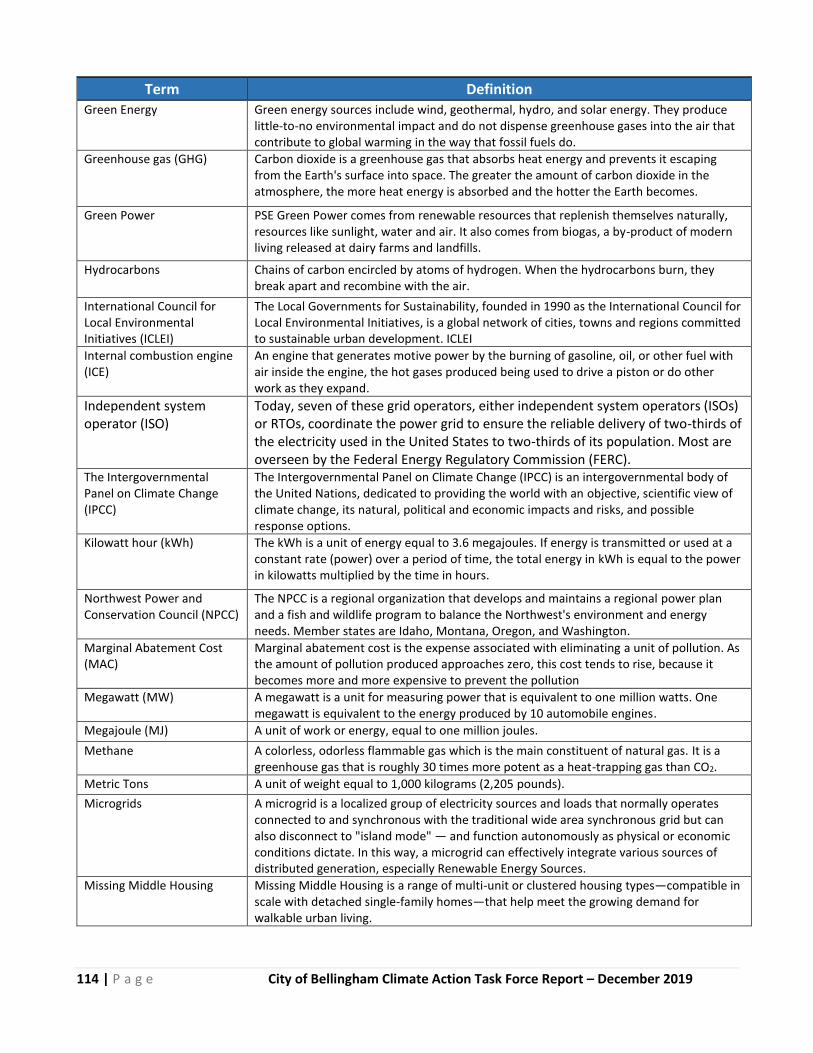
114 | P a g e City of Bellingham Climate Action Task Force Report – December 2019
Term Definition Green Energy Green energy sources include wind, geothermal, hydro, and solar energy. They produce
little-to-no environmental impact and do not dispense greenhouse gases into the air that contribute to global warming in the way that fossil fuels do.
Greenhouse gas (GHG) Carbon dioxide is a greenhouse gas that absorbs heat energy and prevents it escaping from the Earth's surface into space. The greater the amount of carbon dioxide in the atmosphere, the more heat energy is absorbed and the hotter the Earth becomes.
Green Power PSE Green Power comes from renewable resources that replenish themselves naturally, resources like sunlight, water and air. It also comes from biogas, a by-product of modern living released at dairy farms and landfills.
Hydrocarbons Chains of carbon encircled by atoms of hydrogen. When the hydrocarbons burn, they break apart and recombine with the air.
International Council for Local Environmental Initiatives (ICLEI)
The Local Governments for Sustainability, founded in 1990 as the International Council for Local Environmental Initiatives, is a global network of cities, towns and regions committed to sustainable urban development. ICLEI
Internal combustion engine (ICE)
An engine that generates motive power by the burning of gasoline, oil, or other fuel with air inside the engine, the hot gases produced being used to drive a piston or do other work as they expand.
Independent system operator (ISO)
Today, seven of these grid operators, either independent system operators (ISOs) or RTOs, coordinate the power grid to ensure the reliable delivery of two-thirds of the electricity used in the United States to two-thirds of its population. Most are overseen by the Federal Energy Regulatory Commission (FERC).
The Intergovernmental Panel on Climate Change (IPCC)
The Intergovernmental Panel on Climate Change (IPCC) is an intergovernmental body of the United Nations, dedicated to providing the world with an objective, scientific view of climate change, its natural, political and economic impacts and risks, and possible response options.
Kilowatt hour (kWh) The kWh is a unit of energy equal to 3.6 megajoules. If energy is transmitted or used at a constant rate (power) over a period of time, the total energy in kWh is equal to the power in kilowatts multiplied by the time in hours.
Northwest Power and Conservation Council (NPCC)
The NPCC is a regional organization that develops and maintains a regional power plan and a fish and wildlife program to balance the Northwest's environment and energy needs. Member states are Idaho, Montana, Oregon, and Washington.
Marginal Abatement Cost (MAC)
Marginal abatement cost is the expense associated with eliminating a unit of pollution. As the amount of pollution produced approaches zero, this cost tends to rise, because it becomes more and more expensive to prevent the pollution
Megawatt (MW) A megawatt is a unit for measuring power that is equivalent to one million watts. One megawatt is equivalent to the energy produced by 10 automobile engines.
Megajoule (MJ) A unit of work or energy, equal to one million joules.
Methane A colorless, odorless flammable gas which is the main constituent of natural gas. It is a greenhouse gas that is roughly 30 times more potent as a heat-trapping gas than CO2.
Metric Tons A unit of weight equal to 1,000 kilograms (2,205 pounds).
Microgrids A microgrid is a localized group of electricity sources and loads that normally operates connected to and synchronous with the traditional wide area synchronous grid but can also disconnect to "island mode" — and function autonomously as physical or economic conditions dictate. In this way, a microgrid can effectively integrate various sources of distributed generation, especially Renewable Energy Sources.
Missing Middle Housing Missing Middle Housing is a range of multi-unit or clustered housing types—compatible in scale with detached single-family homes—that help meet the growing demand for walkable urban living.

115 | P a g e City of Bellingham Climate Action Task Force Report – December 2019
Term Definition Municipal Utility District (MUD)
A political entity in charge of providing utility-related services such as water, sewage, and drainage services. An MUD is typically enacted by state law and is funded by special assessment bonds.
Multi-modal transportation The movement of cargo or people from origin to destination by several modes of transport.
Net Capacity Factors Net capacity factor is the unitless ratio of an actual electrical energy output over a given period of time to the maximum possible electrical energy output over that period.
North American Electric Reliability Corporation (NERC)
NERC is a federally recognized, self-regulated institution that oversees and regulates the reliability of the North American electrical grids and is responsible for developing and enforcing reliability standards; creating annual and 10-year assessments for winter and summer forecasts; monitoring the bulk power system; and educating, training and certifying industry personnel.
Northwest Power and Conservation Council (NPCC)
The Northwest Power and Conservation Council (NPCC) is a regional organization that develops and maintains a regional power plan and a fish and wildlife program to balance the Northwest's environment and energy needs.
Property Assessed Clean Energy Financing (PACE)
PACE is an innovative mechanism for financing energy efficiency and renewable energy improvements on private property.
Personal vehicle (PV) PV is a machine that transports people or cargo.
Photovoltaic cell (PV cell) A PV cell is a specialized semiconductor diode that converts visible light into direct current (DC).
Power Purchase Agreements (PPAs)
PPAs or electricity power agreement (EPAs), is a contract between two parties – one which generates electricity (the seller) and one which is looking to purchase electricity (the buyer). The PPA defines all of the commercial terms for the sale of electricity between the two parties.
Public Utility District (PUD) PUDs are a not-for-profit, community-owned utility. 28 PUDs serve customers across Washington state. PUDs provide electric, water, sewer, and wholesale telecommunications services and have the authority to produce and distribute renewable natural gas and renewable hydrogen.
Renewable Energy Renewable energy is from an energy resource that is replaced rapidly by a natural process such as power generated from the sun, wind, geothermal, hydroelectric action. Energy produced from the refining of biomass is also often classified as renewable. On the other hand, coal, oil or natural gas are finite sources.
Puget Sound Energy (PSE) PSE is a privately-owned, Washington state energy utility providing electrical power and natural gas primarily in the Puget Sound region of the northwest United States.
Puget Sound Cooperative Credit Union (PSCCU)
PSCUU is a nonprofit, member-owned financial cooperative and a proactive contributor to
environmental sustainability, financial security for others, and job creation.
Photovoltaic (PV) system A PV system or solar power system, is a power system designed to supply usable solar power by means of photovoltaics.
Rate Stabilization Account (RSA)
An RSA is a cash reserve that a utility can dip into when wholesale market prices or hydroelectric production changes cause an unexpected drop in revenue.
Regional Transmission Organization (RTO)
An RTO in the United States is an electric power transmission system operator (TSO) that coordinates, controls, and monitors a multi-state electric grid.
Renewable Energy Sources Renewable energy comes from a source that never runs out. In other words, its source lasts forever. Renewable energy comes from natural sources that Mother Nature continuously replaces on a human timescale. Wind, solar, and hydroelectricity are three renewable sources of energy. Sunlight, wind, rain, tides, waves, and geothermal heat are naturally replenished.

116 | P a g e City of Bellingham Climate Action Task Force Report – December 2019
Term Definition Residential Multi-Family This is a building or structure designed to house several different families in separate
housing units. Multi-family residential is also known as multi-dwelling unit or MDU. Units can be next to each other (side-by-side units) or stacked on top of each other (top and bottom units).
Retro-Commissioning (RCx) Retro-commissioning is a process that seeks to improve how building equipment and systems are operating and functioning together. Depending on the age of the building, retro-commissioning can often resolve problems that occurred during design or construction, or address problems that have developed throughout the building's life.
Safe Routes to School (SRTS) SRTS is an approach that promotes walking and bicycling to school through infrastructure improvements, enforcement, tools, safety education, and incentives to encourage walking and bicycling to school. Nationally, 10%–14% of car trips during morning rush hour are for school travel.
Seattle City Light (SCL) Seattle City Light is the public utility providing electrical power to Seattle, Washington, US, and parts of its metropolitan area.
Solar cell A solar cell is a device that converts photons from the sun (solar light) into electricity. Generally, a solar cell that includes both solar and non-solar sources of light (such as photons from incandescent bulbs) is termed a photovoltaic cell.
Smart growth zoning Smart growth zoning concentrates growth in compact, walkable urban centers to avoid sprawl. It also advocates for neighborhood schools, complete streets, and mixed-use development with a range of housing choices.
SmartRegs Program (Boulder, CO)
This SmartRegs program has been supported through a Climate Action Plan Tax since adopted. Fees are used to cover operating costs and are reviewed annually. This Smart Regulation program was adopted by Boulder City Council in 2010.
Therms Any of several units of heat, as one equivalent to 1000 large calories or 100,000 British thermal units.
Transportation Benefit Districts (TBDs)
Transportation Benefit Districts (TBDs) are separate legal entities that are created by cities or counties under Chapter 36.73 RCW for the purpose of financing their transportation improvements.
Transportation Network Companies (TNC or TNC-only)
A Transportation Network Company (TNC) is a company that uses Internet-based technology (typically a smart phone app) to link individuals selling transportation (drivers) with individuals who need transportation (customers). Uber, Lyft and Sidecar are perhaps the most well-known of the TNC’s,
Transportation Safety Planning (TSP)
Transportation Safety Planning (TSP) is a comprehensive, system-wide, multimodal, proactive process that better integrates safety into surface transportation decision-making. Federal law requires that the State and Metropolitan transportation planning processes be consistent with Strategic Highway Safety Plans.
Triple bottom line plus technology” (TBL+)
Triple bottom line plus technology (or TBL+) is an accounting framework with three parts: social, environmental, (or ecological) and financial. Some organizations have adopted the TBL framework to evaluate their performance in a broader perspective to create greater business value.
Urban Villages (UV) An urban village is typically characterized by medium-density housing, mixed use zoning, good public transit and an emphasis on pedestrian and public spaces. Urban villages are an alternative to decentralization and urban sprawl. They aim to reduce car reliance and promote cycling, walking, and transit use; provide a high level of self-containment (people working, recreating, and living in the same area); and help facilitate strong community institutions and interaction.
Washington Public Utility Districts Association (WPUDA)
WPUDA represents 27 nonprofit, community-owned utilities that provide electricity, water and wastewater services, and wholesale telecommunications to more almost one-

117 | P a g e City of Bellingham Climate Action Task Force Report – December 2019
Term Definition million residential, business, and industrial customers in communities across the State of Washington.
Washington Utilities and Transportation Commission (UTC)
The UTC of Washington State ensures that the services of regulated utility companies are safe, available, reliable, and fairly priced.
Urban Villages (UV) UVs are an urban development typically characterized by medium-density housing, mixed use zoning, good public transit and an emphasis on pedestrianization and public space. Urban villages are seen to provide an alternative to recent patterns of urban development.
Vehicle Miles Traveled (VMT)
Vehicle Miles Traveled is the total annual miles of vehicle travel divided by the total population in a state or in an urbanized area.
Virtual Net Metering (VNM) or Virtual Net Energy Metering – (VNEM)
Virtual net metering (VNM) is a bill crediting system for community solar. It refers to when solar is not used on-site but is instead externally installed and shared among subscribers. Virtual net metering is a billing mechanism that allows a customer to credit kWh’s (kilowatt-hours) from one meter to another.
Zero-carbon Zero carbon refers to zero carbon dioxide emissions or no net release of carbon dioxide into the atmosphere, and can be applied to CO2 equivalent emissions, that takes in the other GHG emissions. It is a not an agreed scientific term, but it is a scientific reality for climate change mitigation.
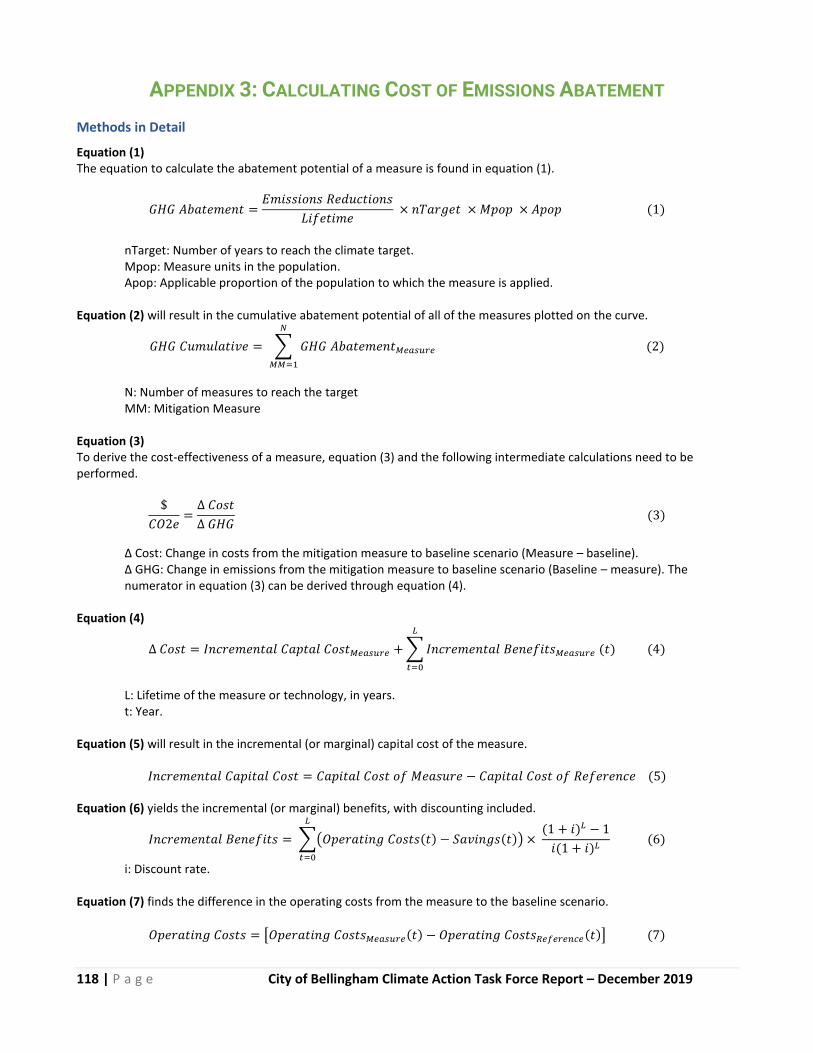
118 | P a g e City of Bellingham Climate Action Task Force Report – December 2019
APPENDIX 3: CALCULATING COST OF EMISSIONS ABATEMENT
Methods in Detail
Equation (1) The equation to calculate the abatement potential of a measure is found in equation (1).
𝐺𝐻𝐺 𝐴𝑏𝑎𝑡𝑒𝑚𝑒𝑛𝑡 =𝐸𝑚𝑖𝑠𝑠𝑖𝑜𝑛𝑠 𝑅𝑒𝑑𝑢𝑐𝑡𝑖𝑜𝑛𝑠
𝐿𝑖𝑓𝑒𝑡𝑖𝑚𝑒 × 𝑛𝑇𝑎𝑟𝑔𝑒𝑡 × 𝑀𝑝𝑜𝑝 × 𝐴𝑝𝑜𝑝 (1)
nTarget: Number of years to reach the climate target. Mpop: Measure units in the population. Apop: Applicable proportion of the population to which the measure is applied.
Equation (2) will result in the cumulative abatement potential of all of the measures plotted on the curve.
𝐺𝐻𝐺 𝐶𝑢𝑚𝑢𝑙𝑎𝑡𝑖𝑣𝑒 = ∑ 𝐺𝐻𝐺 𝐴𝑏𝑎𝑡𝑒𝑚𝑒𝑛𝑡𝑀𝑒𝑎𝑠𝑢𝑟𝑒
𝑁
𝑀𝑀=1
(2)
N: Number of measures to reach the target MM: Mitigation Measure
Equation (3) To derive the cost-effectiveness of a measure, equation (3) and the following intermediate calculations need to be performed.
$
𝐶𝑂2𝑒=
∆ 𝐶𝑜𝑠𝑡
∆ 𝐺𝐻𝐺 (3)
Δ Cost: Change in costs from the mitigation measure to baseline scenario (Measure – baseline). Δ GHG: Change in emissions from the mitigation measure to baseline scenario (Baseline – measure). The numerator in equation (3) can be derived through equation (4).
Equation (4)
∆ 𝐶𝑜𝑠𝑡 = 𝐼𝑛𝑐𝑟𝑒𝑚𝑒𝑛𝑡𝑎𝑙 𝐶𝑎𝑝𝑡𝑎𝑙 𝐶𝑜𝑠𝑡𝑀𝑒𝑎𝑠𝑢𝑟𝑒 + ∑ 𝐼𝑛𝑐𝑟𝑒𝑚𝑒𝑛𝑡𝑎𝑙 𝐵𝑒𝑛𝑒𝑓𝑖𝑡𝑠𝑀𝑒𝑎𝑠𝑢𝑟𝑒 (𝑡)
𝐿
𝑡=0
(4)
L: Lifetime of the measure or technology, in years. t: Year.
Equation (5) will result in the incremental (or marginal) capital cost of the measure.
𝐼𝑛𝑐𝑟𝑒𝑚𝑒𝑛𝑡𝑎𝑙 𝐶𝑎𝑝𝑖𝑡𝑎𝑙 𝐶𝑜𝑠𝑡 = 𝐶𝑎𝑝𝑖𝑡𝑎𝑙 𝐶𝑜𝑠𝑡 𝑜𝑓 𝑀𝑒𝑎𝑠𝑢𝑟𝑒 − 𝐶𝑎𝑝𝑖𝑡𝑎𝑙 𝐶𝑜𝑠𝑡 𝑜𝑓 𝑅𝑒𝑓𝑒𝑟𝑒𝑛𝑐𝑒 (5) Equation (6) yields the incremental (or marginal) benefits, with discounting included.
𝐼𝑛𝑐𝑟𝑒𝑚𝑒𝑛𝑡𝑎𝑙 𝐵𝑒𝑛𝑒𝑓𝑖𝑡𝑠 = ∑(𝑂𝑝𝑒𝑟𝑎𝑡𝑖𝑛𝑔 𝐶𝑜𝑠𝑡𝑠(𝑡) − 𝑆𝑎𝑣𝑖𝑛𝑔𝑠(𝑡)) × (1 + 𝑖)𝐿 − 1
𝑖(1 + 𝑖)𝐿
𝐿
𝑡=0
(6)
i: Discount rate. Equation (7) finds the difference in the operating costs from the measure to the baseline scenario.
𝑂𝑝𝑒𝑟𝑎𝑡𝑖𝑛𝑔 𝐶𝑜𝑠𝑡𝑠 = [𝑂𝑝𝑒𝑟𝑎𝑡𝑖𝑛𝑔 𝐶𝑜𝑠𝑡𝑠𝑀𝑒𝑎𝑠𝑢𝑟𝑒(𝑡) − 𝑂𝑝𝑒𝑟𝑎𝑡𝑖𝑛𝑔 𝐶𝑜𝑠𝑡𝑠𝑅𝑒𝑓𝑒𝑟𝑒𝑛𝑐𝑒(𝑡)] (7)
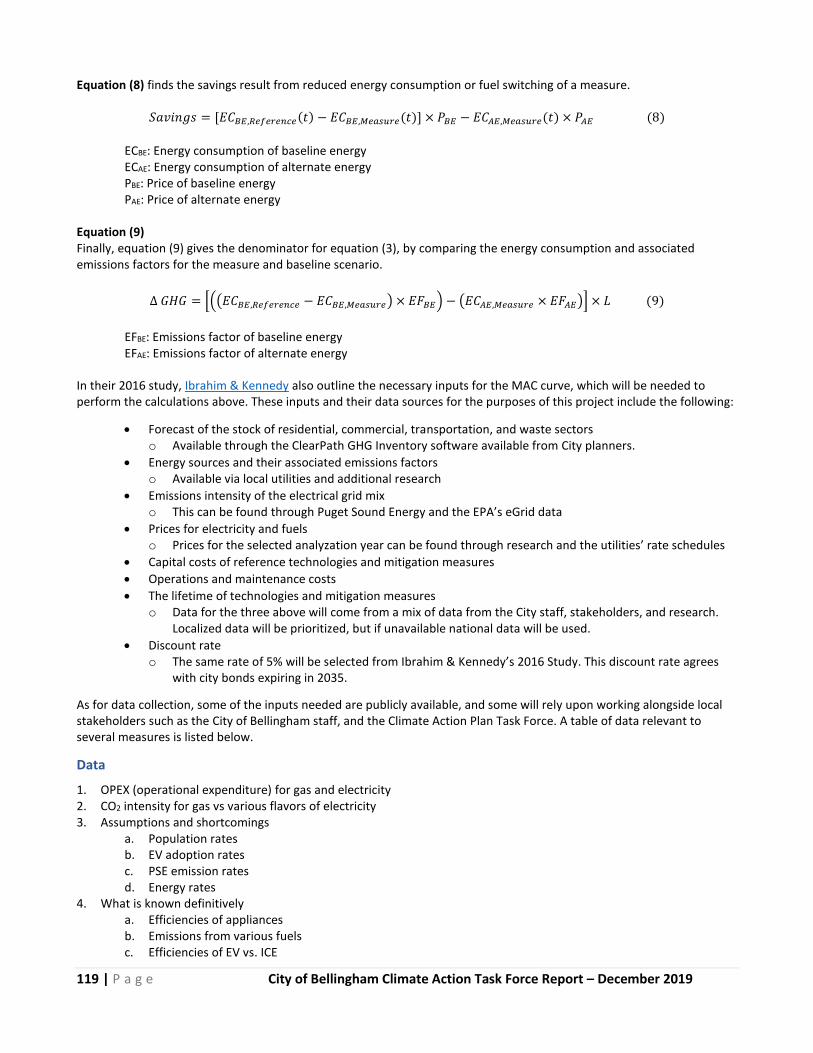
119 | P a g e City of Bellingham Climate Action Task Force Report – December 2019
Equation (8) finds the savings result from reduced energy consumption or fuel switching of a measure.
𝑆𝑎𝑣𝑖𝑛𝑔𝑠 = [𝐸𝐶𝐵𝐸,𝑅𝑒𝑓𝑒𝑟𝑒𝑛𝑐𝑒(𝑡) − 𝐸𝐶𝐵𝐸,𝑀𝑒𝑎𝑠𝑢𝑟𝑒(𝑡)] × 𝑃𝐵𝐸 − 𝐸𝐶𝐴𝐸,𝑀𝑒𝑎𝑠𝑢𝑟𝑒(𝑡) × 𝑃𝐴𝐸 (8)
ECBE: Energy consumption of baseline energy ECAE: Energy consumption of alternate energy PBE: Price of baseline energy PAE: Price of alternate energy
Equation (9) Finally, equation (9) gives the denominator for equation (3), by comparing the energy consumption and associated emissions factors for the measure and baseline scenario.
∆ 𝐺𝐻𝐺 = [((𝐸𝐶𝐵𝐸,𝑅𝑒𝑓𝑒𝑟𝑒𝑛𝑐𝑒 − 𝐸𝐶𝐵𝐸,𝑀𝑒𝑎𝑠𝑢𝑟𝑒) × 𝐸𝐹𝐵𝐸) − (𝐸𝐶𝐴𝐸,𝑀𝑒𝑎𝑠𝑢𝑟𝑒 × 𝐸𝐹𝐴𝐸)] × 𝐿 (9)
EFBE: Emissions factor of baseline energy EFAE: Emissions factor of alternate energy
In their 2016 study, Ibrahim & Kennedy also outline the necessary inputs for the MAC curve, which will be needed to perform the calculations above. These inputs and their data sources for the purposes of this project include the following:
• Forecast of the stock of residential, commercial, transportation, and waste sectors o Available through the ClearPath GHG Inventory software available from City planners.
• Energy sources and their associated emissions factors o Available via local utilities and additional research
• Emissions intensity of the electrical grid mix o This can be found through Puget Sound Energy and the EPA’s eGrid data
• Prices for electricity and fuels o Prices for the selected analyzation year can be found through research and the utilities’ rate schedules
• Capital costs of reference technologies and mitigation measures
• Operations and maintenance costs
• The lifetime of technologies and mitigation measures o Data for the three above will come from a mix of data from the City staff, stakeholders, and research.
Localized data will be prioritized, but if unavailable national data will be used.
• Discount rate o The same rate of 5% will be selected from Ibrahim & Kennedy’s 2016 Study. This discount rate agrees
with city bonds expiring in 2035.
As for data collection, some of the inputs needed are publicly available, and some will rely upon working alongside local stakeholders such as the City of Bellingham staff, and the Climate Action Plan Task Force. A table of data relevant to several measures is listed below.
Data
1. OPEX (operational expenditure) for gas and electricity 2. CO2 intensity for gas vs various flavors of electricity 3. Assumptions and shortcomings
a. Population rates b. EV adoption rates c. PSE emission rates d. Energy rates
4. What is known definitively a. Efficiencies of appliances b. Emissions from various fuels c. Efficiencies of EV vs. ICE
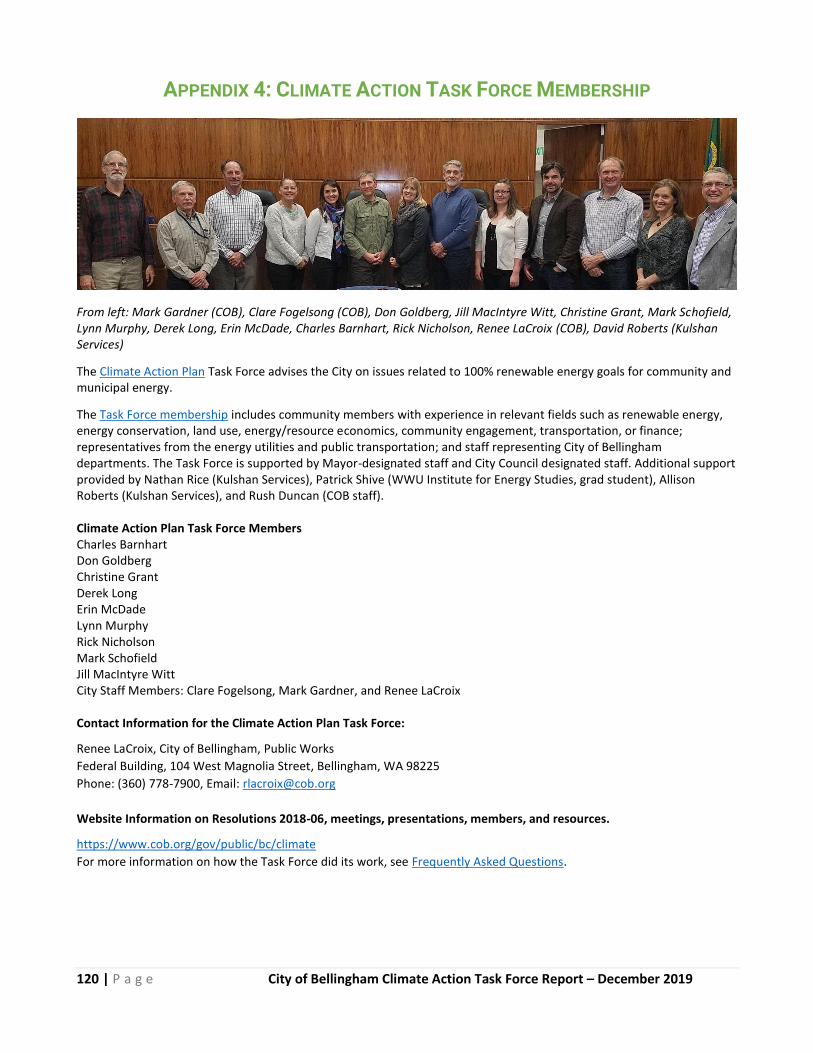
120 | P a g e City of Bellingham Climate Action Task Force Report – December 2019
APPENDIX 4: CLIMATE ACTION TASK FORCE MEMBERSHIP
From left: Mark Gardner (COB), Clare Fogelsong (COB), Don Goldberg, Jill MacIntyre Witt, Christine Grant, Mark Schofield, Lynn Murphy, Derek Long, Erin McDade, Charles Barnhart, Rick Nicholson, Renee LaCroix (COB), David Roberts (Kulshan Services)
The Climate Action Plan Task Force advises the City on issues related to 100% renewable energy goals for community and municipal energy.
The Task Force membership includes community members with experience in relevant fields such as renewable energy, energy conservation, land use, energy/resource economics, community engagement, transportation, or finance; representatives from the energy utilities and public transportation; and staff representing City of Bellingham departments. The Task Force is supported by Mayor-designated staff and City Council designated staff. Additional support provided by Nathan Rice (Kulshan Services), Patrick Shive (WWU Institute for Energy Studies, grad student), Allison Roberts (Kulshan Services), and Rush Duncan (COB staff). Climate Action Plan Task Force Members Charles Barnhart Don Goldberg Christine Grant Derek Long Erin McDade Lynn Murphy Rick Nicholson Mark Schofield Jill MacIntyre Witt City Staff Members: Clare Fogelsong, Mark Gardner, and Renee LaCroix Contact Information for the Climate Action Plan Task Force:
Renee LaCroix, City of Bellingham, Public Works
Federal Building, 104 West Magnolia Street, Bellingham, WA 98225
Phone: (360) 778-7900, Email: [email protected]
Website Information on Resolutions 2018-06, meetings, presentations, members, and resources.
https://www.cob.org/gov/public/bc/climate
For more information on how the Task Force did its work, see Frequently Asked Questions.
121 | P a g e City of Bellingham Climate Action Task Force Report – December 2019
APPENDIX 5: REFERENCES
References: Buildings
1 City of Boulder, “SmartRegs Program-to-Date Progress Report,” December 31, 2018. 2 A number of detailed cost studies of implementation in different markets show that electrification of new buildings often results in
cost savings. For example, see E3, “Residential Building Electrification in California,” April 2019, https://www.ethree.com/wp-
content/uploads/2019/04/E3_Residential_Building_Electrification_in_California_April_2019.pdf; https://rmi.org/insight/the-
economics-of-electrifying-buildings/; https://efiling.energy.ca.gov/GetDocument.aspx?tn=224761 3 HomeAdvisor, “How Much Does It Cost To Install A Water Heater?”,
https://www.homeadvisor.com/cost/plumbing/install-a-water-heater/?zip=98225 4 David Gutman, “Puget Sound Energy wants 14% increase on natural-gas bills,” Seattle Times, October 24, 2019,
https://www.seattletimes.com/seattle-news/puget-sound-energy-wants-14-increase-on-natural-gas-bills/ 5 Boulder County, Energy Smart, “Comfort365—Renewable Cooling and Heating,” https://www.energysmartyes.com/comfort365/ 6 This level would encompass people enrolled in the state Property Tax Exemption Program, households qualifying for City
reduced utility rates for water, sewer, and stormwater utilities, and households that present evidence that they are
income-qualified for certain federal or state assistance programs including EBT, TANF, and low and reduced price school
meals. 7 Erin Christensen, “CH& Concludes That PACE Can Be Adopted in Washington Without Violating the State Constitution,” January 8,
2019, https://www.cairncross.com/blog/candh-energy-blog/washington-state-government/property-assessed-clean-energy-pace-
chand-concludes-that-highly-successful-conservation-financing-mechanism-can-be-adopted-in-washington-without-violating-the-state-
constitution.
References: Transportation _______________________________________ 1https://tonyseba.com/wp-content/uploads/2014/05/book-cover-Clean-Disruption.pdf 2http://www.pewtrusts.org/~/media/Assets/2015/10/Emergency-Savings-Report-1_ARTFINAL.pdf?la=en 3https://newsroom.aaa.com/auto/your-driving-costs/ 4https://www.census.gov/quickfacts/fact/table/whatcomcountywashington,bellinghamcitywashington,WA/PST045218 5https://academic.oup.com/jpubhealth/article/33/2/160/1591440 6http://www.pewtrusts.org/~/media/Assets/2015/10/Emergency-Savings-Report-1_ARTFINAL.pdf?la=en 7https://newsroom.aaa.com/auto/your-driving-costs/ 8https://www.census.gov/quickfacts/fact/table/whatcomcountywashington,bellinghamcitywashington,WA/PST045218 9https://academic.oup.com/jpubhealth/article/33/2/160/1591440 10http://nwenergy.org/featured/nw-energy-coalition-issue-paper-weighs-benefits-and-opportunities-for-vehicle-
electrification/ 11https://forthmobility.org/storage/app/media/Documents/Forth-Utility-White-Paper.pdf 12https://www.planetizen.com/news/2018/09/100622-phasing-out-internal-combustion-engine-no-easy-task 13https://petaluma.granicus.com/MetaViewer.php?view_id=31&event_id=43437&meta_id=422825 14https://denver.streetsblog.org/2017/02/09/brent-toderian-dont-balance-modes-prioritize-walking-biking-and-transit/ 15https://www.mdpi.com/2313-576X/2/4/26/htm 16Nicholas Ferenchak and Wesley Marshall, “The Relative (In)Effectiveness of Bicycle Sharrows on Ridership and Safety
Outcomes,” Paper presented at the Transportation Research Board 95th Annual meeting, Washington, D.C., January 2016. 17https://nacto.org/publication/urban-bikeway-design-guide/bikeway-signing-marking/shared-lane-markings/ 18www.saferoutesinfo.org/introduction/the_decline_of_walking_and_bicycling.cfmSaferoutesinfo.org
122 | P a g e City of Bellingham Climate Action Task Force Report – December 2019
19http://guide.saferoutesinfo.org/introduction/the_decline_of_walking_and_bicycling.cfm 20https://www.citylab.com/transportation/2018/11/parking-lots-near-me-shopping-plazas-vacant-spaces/576646/ 21https://www.its.ucla.edu/publication/turning-housing-driving-parking-requirements-density-los-angeles-new-york/ 22https://escholarship.org/uc/item/24f521mp 23https://www.citylab.com/perspective/2019/09/parking-lot-urban-planning-transit-street-traffic-congestion/598504/ 24https://www.sightline.org/2018/12/10/parking-reform-minneapolis-san-francisco/ 25https://escholarship.org/uc/item/24f521mp 26https://www.seattle.gov/transportation/permits-and-services/permits/parking-permits/rpz-permits/how-much-does-it-
cost 27https://www.oxfordshire.gov.uk/residents/roads-and-transport/connecting-oxfordshire/oxford-zero-emission-zone
References: Energy Supply _______________________________
Introduction
1http://energywatchgroup.org/wp-content/uploads/EWG_Natural_Gas_Study_September_2019.pdf
2https://nwenergy.org/featured/the-harmonious-grid-a-new-direction-for-the-nw-electric-system/
Measure #5: Green Power
3https://www.pse.com/green-options/Renewable-Energy-Programs/green-power
4C-PACER: https://shiftzeroorg.files.wordpress.com/2019/09/c-pacer.pdf
Measure #6: City-Owned Renewable Energy Generation
5https://www.windpowerengineering.com/first-time-wind-developers-know-build/
6https://www.eonenergy.com/blog/2015/October/how-to-build-a-wind-farm
7https://www.thebalance.com/how-to-build-a-wind-farm-1182553
Measure #7 Microgrids, Distributed Energy Resources (DER), and Demand Response (DR)
8The Energy Supply Work Group offers the following information as an overview to this next electricity resource. Note that the first news item discusses the development of a city microgrid as part of a newly formed municipal utility.
Case Example: “San Jose Looks to Exit PG&E to Develop Microgrids Following California’s Power Shutoff”, October 21, 2019. Link: https://microgridknowledge.com/san-jose-microgrids-pge/
This article discusses the city’s plan to explore microgrid options as a solution to energy demand. The most feasible long-term solution, Mayor Liccardo said, “lies in distributed, off-grid electricity generation, and storage, which can take several forms. Enabling residents with solar arrays to create islands of resiliency within neighborhoods can help, as can investing in larger microgrids in strategic parts of the city.” But to expand microgrids beyond a single home or block, either the state legislature will need to change law that constrains microgrid development or San Jose will need to create its own public utility, Liccardo said. San Jose, which last month announced plans to make buildings in the city all electric, was already quietly looking at forming a municipal utility, he said. Now Liccardo wants the city to conduct polling to gauge voter support for bonds that would pay for microgrids at critical facilities and for the purchase of PG&E’s electrical infrastructure in the city, a precursor to creating a municipal utility. “It’s time to explore a San Jose without PG&E. It’s time to move on, and to take bolder action to protect our residents,” Liccardo said.

123 | P a g e City of Bellingham Climate Action Task Force Report – December 2019
9“Capturing More Value from Combinations of PV and Other Distributed Energy Resources”, Regulatory Assistance Project, August 2019. Link: https://www.raponline.org/knowledge-center/?_sf_s=capturing%20more%20value%20from
10Northwest Power and Conservation Council, 7th Plan, 2016: Demand Response. https://www.nwcouncil.org/reports/seventh-power-plan, Chapter 14: Demand Response Resources
11Additional Article: “Nation’s Largest Residential Battery Demand Response System Being Built in Utah”, Sep 24, 2019. Link: https://microgridknowledge.com/virtual-power-plant-apartment/
Measure #8: Energy Storage Resources
12https://energystorage.pnnl.gov/
13Some sizeable US utility scale examples, some in late stage development, include projects found at the following link: https://energyacuity.com/blog/2019-top-10-energy-storage-battery-projects/
https://nawindpower.com/duke-energy-upgrades-battery-storage-west-texas-wind-farm
https://newsroom.edison.com/releases/sce-unveils-largest-battery-energy-storage-project-in-north-america
14Additional informational links:
http://css.umich.edu/sites/default/files/U.S._Grid_Energy_Storage_Factsheet_CSS15-17_e2018.pdf https://www.ge.com/renewableenergy/hybrid/battery-energy-storage https://en.wikipedia.org/wiki/List_of_energy_storage_projects
15Current energy-utility news feeds also offer a rich source of the rapid growth in renewable and battery projects. The following are a few of the more recent applicable examples:
https://www.utilitydive.com/news/opportunities-everywhere-nrel-study-shows-mass-potential-for-storage-to/558344/
https://www.utilitydive.com/news/los-angeles-approves-historically-low-cost-solarstorage-project/562681/
https://www.greentechmedia.com/articles/read/new-york-approves-316-mw-battery-plant-for-peak-power
https://www.utilitydive.com/news/nothing-standing-in-the-way-of-energy-storages-explosive-growth-navigan/562901/
https://microgridknowledge.com/battery-system-pjm-frequency/
16NREL Article “Identifying and Overcoming Critical Barriers to Widespread Second Use of PEV Batteries”, February 2015. Link: http://www.nrel.gov/docs/fy15osti/63332.pdf
Measure #9: Geothermal
17https://www.snopud.com/PowerSupply/Geothermal.ashx?p=1156
18https://www.power-technology.com/projects/the-geysers-geothermal-california/
Measure #11: Fire Pathways
19https://www.iccsafe.org/cs/SCAC/Documents/TaskGroup5/SolarInThe2012ICodesA.pdf
20http://whatcomcounty.us/631/Fire-Codes
Measure #12: Virtual Net Metering for Community Solar Projects
21https://www.utc.wa.gov/regulatedIndustries/utilities/energy/Pages/netMetering.aspx
22https://www.pse.com/pages/customer-connected-solar
23https://www.renewableenergyworld.com/2019/03/04/what-is-virtual-net-metering-and-who-is-it-for/#gref
24https://news.energysage.com/virtual-net-metering-what-is-it-how-does-it-work/
124 | P a g e City of Bellingham Climate Action Task Force Report – December 2019
Measure #13: PACE
25https://www.energy.gov/eere/slsc/property-assessed-clean-energy-programs
26https://shiftzero.org/pace/
Measure #14: Transmission Lines
27http://apps2.whatcomcounty.us/council/2004/ord/ord2004-041.pdf
Measure #15: City Municipal Utility District
28Many social/equity benefits (www.wpuda.org)
29Many details regarding PUDs in Washington state can be found here: https://www.wpuda.org/faqs
Measure #16: Heat Pumps
30https://www.energy.gov/sites/prod/files/guide_to_geothermal_heat_pumps.pdf
31https://www.nrcan.gc.ca/energy/publications/efficiency/heating-heat-pump/6827
32https://www.energy.gov/eere/articles/5-things-you-should-know-about-geothermal-heat-pumps
References: Summary of Recommendations _______________________________
1Nadine Ibrahim and Christopher Kennedy, “A Methodology for Constructing Marginal Abatement Cost Curves for Climate Action in Cities,” Energies, March 2016, https://www.mdpi.com/1996-1073/9/4/227/htm