click to edit master title style falkland islands holdings results - year ended 31 march 2015...
TRANSCRIPT

Click to edit Master title style
FALKLAND ISLANDS HOLDINGS
Results - Year ended 31 March 2015
Creating foundations for growth

• Pre-Tax profits £3.56m (2014: £3.65m)
• Cash flow from operations £7.2m (2014 £3.6m)- Cash on hand £7.4m
• FIC: Strong recovery, continued investment
• Momart: Quieter trading year, growth with blue-chip clients
• PHFC: Stable trading – new ferry delivered
• FOGL: Disposal of 7.8m shares -£2.3m. and residual 5m shares sold post year-end.
• Focus on organic and acquisition led earnings growth
2
FKL: Overview
2

FKL: Year ended 31 March 2015Trading Overview
• Group revenue +0.8% to £38.6m (2014: £38.3m)
— FIC : Operating profits +£0.3m to £1.3m (2014: £1.0m)– Growth in Retail and Housebuilding &
Construction
— Momart: Quieter trading year – profits -32% to £1.2m
— PHFC: Small decline in passenger numbers (-2.1%) – Revenue & profits stable at £0.8m
— Operating profit -2.3% to £3.8m (2014: £3.9m)
— Underlying pre tax profits -2.4% to £3.56m (2014: £3.65m)
• EPS on underlying profits unchanged 22.0p (2014: 22.0p)
• Reported pre tax profits + £0.5m at £3.9m
• Cash +£1.7m to £7.4m (2014: £5.7m)
• Bank borrowings reduced to £0.7m (2014: £1.0m)
• £1.4m annual dividend suspended to facilitate investment and acquisition led growth
3

Year ended 31 March
2015£000
2014£000
Change +/-
Turnover – continuing operations 38,560 38,263 +0.8%
Underlying operating profit 3,763 3,852 -2.3%
Interest (net) incl. pensions costs (204) (205) -0.5%
Underlying pre tax profit 3,559 3,647 -2.4%
Non trading items 477 64 +645.3%
Amortisation of Intangibles (142) (307) -53.7%
Reported Profit Before Tax 3,894 3,404 +14.4%
Diluted EPS on taxed underlying PBT 22.0p 22.0p -%
Weighted shares in issue 12,446,097 12,460,985 -0.1%
FKL: Year ended 31 March 2015Trading Overview
4

31 March 2015£000
31 March 2014£000
Change £000
Bank Loans (735) (1,019) 284Hire Purchase & Other borrowings (280) (265) (15)Total borrowings (1,015) (1,284 269
Cash 7,435 5,715 1,720
Net Cash /(Borrowings) 6,420 4,431 1,989
Pontoon Finance Lease (4,858) (4,886) 28Margin on bank loans: 2.8% + Bank of England base rate
FKL: Cash & Liquidity
5

6
FKL: Segmental Analysis – year ended 31 March 2015
2015£000
2014£000 Change +/-
Turnover
FIC 18,506 15,881 +16.5%
PHFC 4,301 4,124 +4.3%
Momart 15,753 18,258 -13.7%
Total Turnover 38,560 38,263 +0.8%
Pre Tax Profit
FIC 1,556 1,116 +39.4%
PHFC 796 770 +3.4%
Momart 1,207 1,761 -31.5%
Underlying Pre-Tax Profit (PBTa) 3,559 3,647 -2.4%

7
• Premier Oil (PMO) progressing technical development of Sea Lion • PMO “Engaging with supply chain to capture lower costs”– May 2015
• Lower cost engineering concept- Leased FPSO production facility
• Phased approach to develop 400mmbbls in total
• Pre first oil costs reduced to $1.8bn
• Further cost reductions being targeted for drilling, subsea and fabrication costs
• FEED being progressed for Board sanction- decision in Summer 2016
• Commitment depend on further recovery in oil price and positive news from drilling programme
• 2015 drilling programme “ to determine ultimate resource potential of N. Falklands Basin” Positive results from first two wells , Zebedee and Isobel Deep. Four more wells to be drilled
• Noble Energy drilling large Humpback prospect in June / July 2015 in S&E Basin
FIC: Background to Oil – June 2015

Timeline for OilFalklands: Timeline for Oil
8
Revised Sea Lion Timeline Jun-15 2015 2016 2017 2018 2019 2020
Temp dock in Stanley Harbour Complete Nov 2014
Exploration Drilling 1 rig Eirik Raude Rig March - Nov 2015 6 wells
PMO Project Sanction / FDP Approval"H1 2016 "
Field Development Prepare Develop Develop Construct Construct Revised view June 2015Phase 1 using lower cost FPSO
First Oil
FIRST OIL Now estimated 2020 ( 4 yrs following Project Sanction ) "Premier Oil " Engaging with supply chain to capture lower costs " May 2015 , Pre First Oil costs now
reduced to $1.8bn

FIC: Stanley
9

– FIC: Year ended 31 March 2015Revenue 2015
£ million 2014
£ millionChange
%
Retail 9.54 9.26 3.0%Falklands 4x4 3.07 2.66 15.6%Freight and port services 1.24 1.26 -1.7%Support services 1.66 1.30 28.1%Property and construction 3.00 1.40 113.5%
Total Revenue 18.51 15.88 16.5%
Operating profit 1.31 0.98 34.3%Share of Joint Venture 0.18 0.04 400.0%
Net Interest 0.07 0.10 -37.9%
Pre Tax profit 1.56 1.12 39.4%Operating profit margin 7.1% 6.2% 15.2%
10

• Revenue ahead + 16.5% at £18.51 million (2014: 15.88 million )
• Contribution +39.4% to £1.56m (2014: £1.1m )
• Retail revenues + 3% to £9.5m – better margins - further investment
• Good growth in Falklands 4x4 + 15.6% to £3.1m - 76 vehicles sold (2014: 79 )
• Falkland Building Services – Kit Homes growth – 16 properties sold 2014: 8)
• Stronger cruise ship visitors numbers +26% to 50,000 helped H2 sales.
• Good contribution from SAtCO at £0.18m (2014: 0.04m) - Installation of Noble Energy
temporary dock from March – Nov 2014
FIC: Trading - Year ended 31 March 2015
11

12
FIC: Expanding Home Builder DIY Store

• FBS Kit Homes on Government plots • FBS Kit Home
FIC: Further progress to First Oil
13

14
• £2.6m capital investment during year. • New chiller and warehouse / container facilities at Airport Road nearing completion
• Refurbishment complete of the Company’s Head Office at Crozier place, offering attractive office space for external rental and improved Head Office facilities for FIC ;
• Three new houses built in central Stanley, and one four bedroomed house purchased to add to rental portfolio
• Creation of new “Home Builder” Retail Warehouse and Garden Centre
• £0.4 million spent on the purchase and installation of 10 mobile homes for staff
• Strong contribution from SAtCO JV £180k (after tax) – Temp Dock project for Premier Oil & Noble Energy
• FIG plans for Deep Water Port on hold pending green light on Sea Lion
FIC: Year ended 31 March 2015

15
FIC: New ambient and chilled warehousing

FIC: Premier / Noble Temporary Dock Facility
16

17
Momart: Return to more normal trading patterns
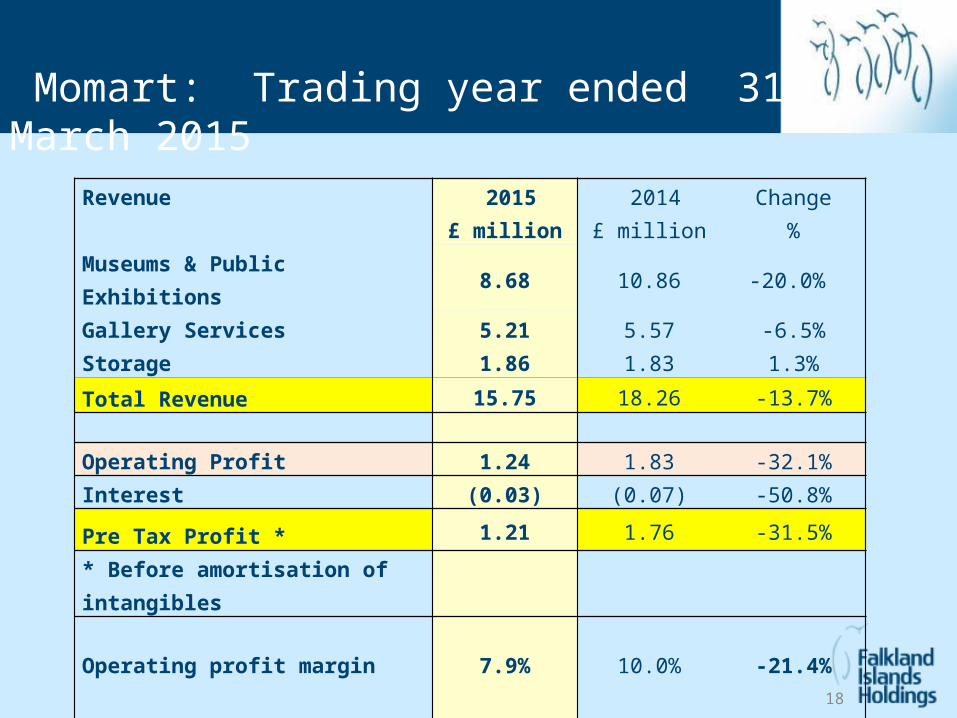
Momart: Trading year ended 31 March 2015
Revenue 2015£ million
2014£ million
Change%
Museums & Public Exhibitions 8.68 10.86 -20.0% Gallery Services 5.21 5.57 -6.5%Storage 1.86 1.83 1.3%
Total Revenue 15.75 18.26 -13.7%
Operating Profit 1.24 1.83 -32.1%Interest (0.03) (0.07) -50.8%
Pre Tax Profit * 1.21 1.76 -31.5%
* Before amortisation of intangibles
Operating profit margin 7.9% 10.0% -21.4%
18

Momart: Trading year ended 31 March 2015• Quieter Trading – Absence of high added value contracts seen in prior year.
– Revenue -14% to £15.8m (2014: £18.26m )
– Profits down to £1.24m (2014: £1.83m )
• Exhibitions revenues -£2.2m (-20% )
• Overseas revenues -£0.8m
• Commercial Gallery Services revenues -6.5% to £5.21million
• Storage revenues +1.3% to £1.86m: 33% expansion of storage space arriving Q1 2016 .
• Strengthened management team – increased focus on sales and marketing
– New marketing director and full time manger appointed – March 2015
– Specialist PR Agency now advising March 2015
– New Business Development Manager appointed- Nov 2014
• Notable exhibitions: Matisse Cut Outs at Tate Modern; Anselm Keifer and Rubens at the Royal
Academy; Virginia Woolf at the National Portrait Gallery; and Ming at the British Museum.
19

• Matisse: Cut Outs, Tate Modern • New dedicated storage racks for Royal Academy
Momart: Working with Blue Chip clients
20

• Landmark Trust: Installing works by Anthony Gormley
Momart: Working with Blue Chip clients
21

Portsmouth Harbour Ferry Company (PHFC)
22

PHFC - Year ended 31 March 2013 Revenues 2015
£ million 2014
£ millionChange
%
Ferry fares4.13 3.95
4.5%
Other revenue 0.17 0.17 0.6%Total Revenue 4.30 4.12 4.4%
Operating Profit 1.03 1.01 1.9%
Pontoon lease finance interest (0.24) (0.24) -2.9%
Profit before tax 0.79 0.77 3.4%
Net margin on revenue (%) 18.5% 18.7%-0.9 %
Passenger journeys (000s) 2,923 2,986-2.1%
PHFC: Trading year ended 31 March 2015
23

P• Revenue +4.4% to £4.3million
• PBT + 3.4% to £0.79m (2014: £ 0.77m )
• Passenger journeys -2.1% to c.2.92 m (2014: -1.6% to c.2.99m )
– BAE,1,000 local job losses summer 2014
– Subsidised Park & Ride in Portsmouth
• Fares increased 6% June 2014
– Adult Return fares £2.90 > £3.10, Child / OAP unchanged at £2.10
— 10 Trip Ticket £13.50 > £14.50
• New vessel arrived from Croatia Q1 2015 – cost £3.2million – 30 year life
• No further vessel investment for 15-20 years
• Medium term outlook for Portsmouth positive – QE2 carriers - 2017 onwards
PHFC: Trading year ended 31 March 2015
24

FKL: Outlook• FIC
– Falklands economy buoyant in H1 with drilling programme and FI Govt capital spending – Further positive news from drilling will lessen reliance on oil price recovery – Significant longer term growth linked to Sea Lion development
• Momart– No immediate repetition of exceptional 2013-14 result – Commercial art market expected to remain buoyant – importance of London growing– New ERP system will boost efficiency in 2014-15 – Plans to expand storage business in 2015 to remove block to further growth
• PHFC – Stable outlook – more active promotional offers to offset cheap petrol – Increased costs for new vessel ( deprec. / finance ) will hold back 2015-16 – Cyclical recovery & Dockyard expansion gives positive medium term view
• Overall – Further investment in growth businesses – Strategic acquisitions using cash and bank borrowings
25

FKL: Strategy
• FIC: Leverage property assets and support services to maximise long term returns from oil
• Momart: Expand storage capacity and develop sales & marketing to capitalise on brand reputation.
• PHFC: Maintain fleet, steady profits & strong cash flow • Group:• No final dividend planned - cash reinvested to accelerate earnings growth • Leverage cash flow to finance strategic acquisitions
26
FKL: Strategy
26

Appendices
Additional Information on Falkland Islands Holdings

FKL Group balance sheet31 March 2015
£00031 March 2014
£000Change
£000
Property, plant and equipment 19,621 16,609 3,012
Investment properties 3,693 3,396 297
Intangibles & goodwill 12,226 12,238 (12)
Deferred tax assets & sundry other 1,852 1,602 250
Investment in FOGL at market value (5m shares @ 30.0p (2014: 12.825m shares at 25.5p ) 1,500 3,270 (1,770)
Total fixed assets and investments 38,892 37,115 1,777
Working capital - Net 1,132 3,255 (2,123)
Cash 7,435 5,715 1,720
Net operating assets 47,459 46,085 1,374
Income tax payable (27) (419) 392
Bank loans, Finance Leases & HP (5,873) (6,170) 297
Pension provisions & Deferred tax (4,871) (4,119) (752)Net Assets / Shareholders funds 36,688 35,377 1,311
Net assets per share £2.95 £2.85 £0.10
FKL: Balance Sheet
28

FKL Group cash flowYear ended 31 March 2015
£0002014£000
Underlying operating profit 3,763 3,852
Depreciation 1,426 1,233
Tax paid (792) (780)
Decrease / (Increase) in working capital 2,145 (1,676)
Other (158) 169
Net cash flow from operating activities 6,384 2,798
Capital expenditure (4,944) (4,974)
Dividends paid (1,424) (1,423)
Loan repayments & Interest (1,408) (1,435)
FOGL shares sold 2,287 -
Loan repaid by / (loan to) Joint Venture 151 (529)
Bank & other loans drawn down 833 -
Other (159) (138)
Net Cash Inflow / (outflow) 1,720 (5,701)
FKL: Cash Flow
29

FIC: Sites for development
Site Location & size Development Potential
1 Fitzroy Road 2 acres , Central Stanley 26 x 2 bed apartments / Terraced Housing
2 Dairy Paddock Western Stanley 36 acres Planning for 350 houses / Work camp
3 YPF site Central Stanley, 2.25 acres Offices , high quality residential
4 East Jetty Waterfront Stanley , 3.0 acres FIC warehousing – prime site for re-development
5 “Coastel” Road FIPASS area, 7.5 acres
Warehousing & lay down areas with planning
6 Airport Road/FIPASS FIPASS ,11.0 acres Warehousing & lay down areas with planning
7 Fairy Cove North side of Stanley Harbour, 301 acres
Adjoins site for proposed new deep water port at Navy Point
FIC: Sites for development
30

Map of FIC Development Sites
Map of FIC Development Sites
31

Map of FIC Development Sites
Map of FIC Development Sites
32

33
FIC: Development sites in Stanley
YPF site on Stanley Harbour 2.25 acres
Coastel Rd site on Stanley Harbour 7.5 acres
Fairy Cove : 300 acre site next to Navy Point harbour site
Crozier Place and East Jetty, 3.0 acres
Prestige site for high quality residential homes
Warehousing, lay down areas and storage
Prime central site for offices , hotel / leisure
Dairy Paddock 36 acre site in central Stanley
Planning permission for workers camp and 350 houses
Site 2 Site 3
Site 4 Site 5 Prime central site for Offices, Hotel or Leisure.
FIC: Development sites in Stanley

Edmund Rowland, ChairmanEdmund was appointed to the Board on 16 April 2013, and became Chairman on 9 February 2015. He currently serves as a Director of Blackfish Capital Management, a specialist asset manager based in London and as Chief Executive Officer of Banque Havilland S.A (London Branch), previously having gained experience in London and Hong Kong, as an analyst and investment manager with BNP Paribas S.A and Blackfish. He has broad experience of principal investing in both equity and credit capital markets, with a focus on special situations. He sits on the board of Banque Havilland (Monaco) SAM and Certus Trust Limited.
John Foster, Managing DirectorJohn joined the Board in 2005. He is a Chartered Accountant and previously served as Finance Director for software company Macro 4 plc and toy retailer, Hamleys plc. Prior to joining Hamleys, he spent three years in charge of acquisitions and disposals at FTSE 250 company Ascot plc and before that worked for nine years as a venture capitalist with a leading investment bank in the City.
Jeremy Brade, Non Executive Jeremy joined the Board in 2009. He is a Director of Harwood Capital Management where he is the senior private equity partner. Jeremy has served on the boards of several private and publicly listed international companies. Formerly Jeremy was a diplomat in the Foreign and Commonwealth Office, and before that an Army officer.
Management Team
Management Team
34

35