9th june 2014 falkland islands holdings plc (“fih” or the ... islands holdings plc (“fih ......
TRANSCRIPT

9th June 2014
Falkland Islands Holdings plc
(“FIH” or the “Group”)
Final results for the year ended 31 March 2014
FIH, the AIM quoted international services group that owns essential services businesses in the Falkland Islands and the UK, is pleased to announce its Final results for the year ended 31 March 2014.
Group Financial Highlights
• Group revenue increased by 7.5% to £38.3 million (2013: £35.6 million) • Underlying pre-tax profits increased 10.8% to £3.65 million (2013: £3.29 million) • Underlying basic earnings per share of 22.2p (2013: 21.6p) • Cash balances totalled £5.7 million (2013: £11.4 million) • Bank borrowings were £1.0 million (2013: £2.0 million) • The Board is recommending a maintained final dividend of 7.5p per share, which makes a total dividend of
11.5p per share (2013: 11.5p)
Operating Highlights
Falkland Islands Company (FIC)
• Revenues up 4.3% at £15.88 million (2013: £15.22 million) with underlying operating profit of £1.01 million (2013: £1.33 million)
• Quieter year in the Falklands Islands as anticipated with the absence of offshore drilling. • The Group continues to invest in modernising FIC and strengthening local management to ensure the
Company remains positioned to capitalise on future growth in the economy
Momart
• Revenues up 12.0% to £18.26 million (2013: £16.30 million) • Underlying operating profit up 53.1% to £1.83 million (2013: £1.19 million) • A strong roster of exhibitions and high level of capacity utilisation for gallery services and storage resulted in a
record year • Prestigious major exhibition contracts during the year included: Manet: Portraying Life at the Royal Academy,
Ellen Gallagher: AxMe at Tate Modern, David Bowie: Is and Masterpieces of Chinese Painting at the V & A, the Portrait of Vienna at the National Gallery, Vikings: Life and Legend at the British Museum and the Houghton Revisited Exhibition at Houghton Hall
Portsmouth Harbour Ferry Company
• Revenue up 1.2% at £4.12 million (2013: £4.08 million) and underlying operating profit up 2.9% at £1.01 million (2013: £0.98 million)
• Significant improvement in the underlying trend of passenger numbers • Construction now well advanced on a third modern ferry vessel, “Harbour Spirit”, which is due to enter service
early in 2015
Falkland Oil & Gas Limited (‘FOGL’)
• The Group owns 12.83 million shares in FOGL which represents 2.4% of the issued share capital of FOGL; at 31 March 2014 the market value of the investment was broadly unchanged at £3.3 million
1

• The acquisition of Desire Petroleum gives FOGL an interest in the North Falkland Basin and the Sea Lion discovery.
• Three separate 3D surveys totalling over 12,000 sq km were carried out to the South and East of the Falklands; the interpretation of these results, combined with existing seismic and drilling data, will inform the choice of targets for the next drilling campaign
• The 2015 drilling campaign will include 5 wells in which FOGL has an interest. FOGL already has funding for the campaign which has the potential to transform the value of the company
David Hudd, Chairman of FIH, said:
“We are pleased to report another good year of progress for the Group, with encouraging revenue and profit growth.
“Momart delivered a record year as it benefited from the strength of the international art market, supporting prestigious exhibitions and utilising a high level of capacity in gallery services and storage.
“The Portsmouth Harbour Ferry Company saw a significant improvement in passenger numbers which is encouraging.
“In the Falklands, FIC experienced a quieter year, as anticipated, in the absence of a drilling campaign. We remain focussed on modernising the business in readiness for the expected increase in economic activity as the next round of drilling approaches. We continue to believe that our wide spread of businesses in the Falklands offers an outstanding business opportunity there. ”
- End -
Enquiries:
Falkland Islands Holdings plc David Hudd, Chairman John Foster, Managing Director
Tel: 01279 461 630 Tel: 07771 893267
WH Ireland Ltd. - NOMAD and Broker to FIH Adrian Hadden / Nick Field
Tel: 0207 220 1666
FTI Consulting Edward Westropp / Georgina Goodhew
Tel: 020 3727 1000
2

Chairman’s Statement 2014
The Group achieved a pleasing trading result for the year with underlying pre-tax profits ( before amortisation and non- trading items, but including the £0.04 million Group’s share of the joint venture results) up 10.8% to a record £3.65 million (2013: £3.29 million). Diluted earnings per share based upon underlying profits increased by 3.3% to 22.0p from 21.3p. Reported earnings per share were 21.1p (2013: 13.7p).
The Directors are pleased to recommend a maintained final dividend of 7.5p, which makes the total dividend for the year 11.5p (2013 11.5p).
The Group’s financial position remains strong and after £5 million of capital expenditure of which £2.7million was invested in the Falklands, cash balances at the end of the year were £5.7 million, with residual bank debt which will be repaid this year reduced to £1 million. The excellent track record and cash generative nature of the Group’s three trading businesses mean that the Group has significant untapped borrowing potential sufficient to fund likely investment requirements in the medium term.
Operations
Thanks to a substantial increase in profits at Momart, Group underlying operating profits before tax (as defined above) increased by 10.0% to £3.85 million from £3.50 million.
Momart enjoyed an excellent year with a 53% increase in contribution to £1.8 million as the business benefited from the continued strength of the international art market. A strong roster of exhibitions and a high level of capacity utilisation for gallery services and storage resulted in a record year.
The Portsmouth Harbour Ferry Company maintained its profit at just over £1.0 million. Passenger numbers saw a significant improvement on the historic trend, experiencing a much smaller decline of 1.6% compared to the 8.9% decline in the prior year, the impact of which was offset by increased fares.
For the first time for three years there was no offshore drilling in Falkland waters. The presence of a drilling rig and associated personnel have provided a substantial stimulus to the economy and generated significant business for the Falkland Islands Company (FIC) in prior years. The absence of drilling particularly impacted wholesale food sales and property rental income but support services maintained its contribution and construction and Falkland 4x4 performed well. There were significant inflationary increases in labour and freight costs which also had an impact. As a result profits decreased to £1.0 million from £1.3 million last year.
Falkland Oil and Gas (FOGL)
The most significant development for FOGL was the acquisition of Desire Petroleum in December 2013 and the subsequent farm out of two of Desire’s licences to Premier Oil and Rockhopper Exploration. We were supportive of the Desire transaction, which gave FOGL exposure to the North Falklands Basin and the Sea Lion field. Following these developments FOGL is now the largest licence holder in the Falkland Islands and has a net interest of 40,000 sq km.
During the year three separate 3D surveys totalling over 12,000 sq km was carried out to the South and East of the Falklands and the interpretation of these results together with existing seismic and drilling data will inform the choice of targets for the next drilling campaign. This is expected to start in the first half of 2015 and will include five wells in which FOGL will have an interest; three in the Sea Lion area and two in the original acreage to the South and East of the Falklands.
The market valuation of the Group’s shareholding of 12.83 million shares was virtually unchanged over the year at £3.3 million with the shares at 25.5p at 31 March 2014 (2013: 26.5p). The shareholding now represents 2.4% of the enlarged share capital of FOGL (2013: 4.0%).
Over the last decade FOGL, in which we were founding shareholders, has drilled three exploration wells in the Southern and Eastern basins. Although confirming the presence of hydrocarbons, these wells did not reveal their presence in commercial quantities. The 2015 drilling campaign for which FOGL is already funded is FOGL’s most
3
extensive to date and has the potential to transform the value of our holding. In these circumstances your Board currently believes that it is appropriate to retain a significant shareholding until the outcome of the programme is known.
Outlook
We anticipate an increase in economic activity in the Falklands as the next round of drilling approaches, but it will be the funding of the Sea Lion development which will trigger a step change in activity. Meanwhile we will continue to invest in modernising FIC in readiness for future growth. For the current year, the fishing season started well and we expect further progress from our construction business.
At Momart, the pipeline of exhibition work remains strong but we are unlikely to repeat the exceptional result experienced this year. A number of opportunities are being explored to increase the capacity of the business to meet customer demand.
For PHFC, there are encouraging signs of an improving trend in demand and the changes agreed with the Ministry of Defence for the reimbursement of travel expenses on the ferry augur well for the future. Good progress is being made with the construction of our new ferry, Harbour Spirit, which we expect to introduce into service early in 2015.
In the year to date, the Group’s trading performance is in line with our expectations and we anticipate a satisfactory year. Looking further ahead we continue to believe that we have an outstanding business opportunity in the Falkland Islands.
David Hudd
Chairman
4

Managing Director’s Strategic Report
Business Review
Group Overview
I am pleased to report another year of progress for the Group, with an encouraging 7.5% increase in revenues to £38.3 million (2013: £35.6 million) and a 10.8% increase in underlying pre-tax profits to £3.65 million (2013: £3.29 million).
The strong trading performance at Momart more than offset a reduced contribution from the Falklands so that underlying operating profits for the Group (before amortisation and financing costs but including the Group’s £0.04m share of the SAtCO joint venture results) increased by 10% to £3.85 million (2013: £3.50 million).
Review of Operations
Group revenue and operating profits are analysed below:
Group revenue
Year ended 31 March 2014 2013 Change £m £m %
Falkland Islands Company 15.88 15.22 4.3 Portsmouth Harbour Ferry 4.12 4.08 1.2 Momart 18.26 16.30 12.0 Total 38.26 35.60 7.5
Group underlying operating profit*
Year ended 31 March 2014 2013 Change
£m £m %
Falkland Islands Company 1.01 1.33 -23.5 Portsmouth Harbour Ferry 1.01 0.98 2.9 Momart 1.83 1.19 53.1 Total 3.85 3.50 10.0 * operating profit is stated before amortisation of intangibles and non–trading items, and includes the Group’s £0.04m share of the SAtCO joint venture profit.
Falkland Islands Company (“FIC”)
As expected the Falklands had a quieter year with the absence of offshore drilling resulting in a temporary hiatus in the economic growth experienced in recent years. Lower oil exploration demand for rental housing, provisioning, food supplies and agency services led to a downturn in revenues and profits for those activities, whilst in the wider economy, general retail demand softened as linked private sector work contracted. As a consequence, although the Group’s Falklands business retains outstanding growth potential over the medium to long term, in the year just ended FIC profits had decreased to £1.01 million from £1.33 million in the prior year.
Oil developments
During the year, Noble Energy and Premier Oil continued to progress their plans for a new round of exploration drilling planned for 2015 in the Northern and Southern basins and in March 2014 a new temporary floating dock arrived in Stanley Harbour to support the offshore programme. In the North Falklands basin, Premier Oil, (“Premier”), the licence holder for the 300mbbl Sea Lion field refined its plans and confirmed the engineering approach for the
5

ultimate commercial production of oil.
In February 2014, Premier announced that it was seeking a farm-in partner for Sea Lion and it is now clear that the Sea Lion development will not go ahead without the introduction of a third party who can help with funding, which is estimated at $5.2billion. Meanwhile, Premier has indicated that it is progressing the preparatory work and that contracts to develop the detailed engineering design work necessary for phase 1 of Sea Lion will be placed by mid-2014. This will ensure that once funding is in place, field development can proceed with minimum delay. Significant onshore construction activity and oil related expenditure would then be expected within 2 years with “First Oil” flowing approximately 4 years after final project sanction.
The planned drilling programme in both the Northern and Southern basins during 2015 opens up the prospect of further discoveries. This together with the impact of the Sea Lion discovery on the Falklands economy, mean that FIC has good prospects for growth over the medium term.
Trading Review
FIC has a long established position as a leading local business and the wide range of retail and support services it can offer to Islanders, government and oil companies makes it uniquely placed to benefit from the anticipated growth in the Falklands economy.
In the year, further steps were taken in modernising FIC and strengthening local management. In addition the benefits of earlier investment were seen with good growth in both the Company’s automotive business “Falklands 4x4” and in Falklands Building Services (“FBS”). As a result, despite the downturn in retail demand and freight income, overall revenue in FIC increased by £0.66 million (+4.3%) to £15.88 million (2013: £15.22 million).
However, increased freight costs and wage inflation of some 5% saw continued pressure on profits. Helped by FBS and strong demand for new 4x4 vehicles, profitability in the second half recovered to be on a par with the prior year, but the slow start to the year meant that overall underlying operating profits were £0.32 million lower at £1.01 million (2013: £1.33 million).
FIC Operating results
Year ended 31 March 2014 2013 Change £m £m %
Revenues
Retail 9.26 9.73 -4.8 Falklands 4x4 2.66 1.87 42.3 Freight & Port Services 1.26 1.65 -23.5 Support services 1.30 1.21 6.7 FBS (property and construction) 1.40 0.76 85.6 Total FIC revenue 15.88 15.22 4.3 FIC underlying operating profit 1.01 1.33 -23.5. Underlying operating profit margin 6.4% 8.7% -26.7
Total retail sales fell by 4.8% to £9.26 million (2013: £9.73 million) which was accounted for by reduced warehouse sales following the departure of the Leiv Eiriksson drilling rig late last year. After a weaker first half, the Company’s core West Store supermarket finished the year with sales only 1.1% lower helped by increased spending from cruise ship passengers, where visitor numbers rose by 34%, and a strengthened BHS clothing offer. In other areas, sales
6

at the waterfront Capstan gift shop were 6% ahead on the prior year, and further progress was seen at the satellite “West Store” at the Mount Pleasant military base. Driven by a more aggressive pricing policy, sales in construction and building materials increased by 18%, although the focus on growing market share did result in some margin erosion. This together with increased freight costs and overheads saw contribution from retailing as a whole decline and was the major factor in the decrease in FIC’s contribution in the year.
Falklands 4x4, made good progress benefiting from an increased use of HP financing to stimulate sales. Total vehicle sales increased from 48 to 79 units (+65%) helped by sales to the Falklands Government. At £2.66 million total automotive revenues were at a record level despite the absence of military orders which remain subject to central procurement from UK.
Revenues from third party freight and port services fell by 23.5% to £1.26 million (2013: £1.65 million) without the benefit of oil related cargoes, which increased revenues last year.
On a positive note Support Services revenues recovered to increase by 6.7% helped by a strong illex squid catch which boosted revenues at FIC’s Fishing Agency, an improved performance from Penguin Travel as cruise ship numbers increased and further progress at FIC’s insurance agency.
FBS has been able to establish a unique client offer that finances work in progress for first time buyers during the 3-4 month construction period. In this way FBS has delivered 8 new houses for local buyers and at 31 March 2014 had a record order book for 20 further houses. In addition to house building, FBS also undertook small general construction contracts for the Falkland Islands Government as well as progressing internal construction projects within FIC (which are not included in revenue). At the end of the year FBS had 54 employees compared to 22 in March 2013. Despite a £0.1 million decline in rental income, overall revenues from property and construction increased by 85.6% to £1.4 million.
To prepare FIC for the expected future growth in the economy, capital expenditure of £2.7 million was incurred, including £0.7 million spent on investment properties, and FBS:
• Completed the construction of four new houses in Hebe Street central Stanley which are all now occupied.
• Progressed the expansion and modernisation of office facilities at FIC’s office at Crozier Place including space for external tenants which will be available in late 2014.
• Commenced the expansion of DIY/Building Materials retail outlet Homebuilder to the rear of Crozier Place for
completion in Autumn 2014.
• Commenced the construction of new warehouse/freezer facilities at Airport Road East Stanley which will replace FIC’s aging facilities and make available a prime 2 acre site on the waterfront in central Stanley.
FIC‘s property rental portfolio now comprises 36 properties in central Stanley which are available for letting. In the absence of any drilling activity, rental income declined by 25% to £0.2 million in the year to 31 March 2014, rental yields reduced and overall occupancy averaged 82% during the year.
During the year the Falkland Islands Government completed its own site surveys and commissioned PWC to advise on the feasibility of financing a new deep water port at the government’s designated site at Port William in Stanley’s outer harbour. However further progress awaits the agreement of commercial terms with port users and FIG support.
We have deferred, pending further progress on the Sea Lion development, the construction of 26 apartments on Fitzroy Road and a workers’ camp at Dairy Paddock.
In the year, FIC’s construction joint venture, the South Atlantic Construction Company, (“SAtCO”) won its first contracts undertaking infrastructure work for FIG and winning the contract to install a new floating dock in Stanley Harbour that will support Noble Energy’s exploration drilling programme in 2015. Work on the dock commenced in March 2014 and is expected to be ready by mid-2014. Connected with this contract, SAtCO invested £1 million in crane and forklift facilities which are being leased to Noble Energy. In the year to March 2014 SAtCO earned revenues
7

of £1.0 million and produced a profit before tax of £0.1 million. The Group’s share of post-tax results from SAtCO was £0.04 million. All staff were seconded as required from parent companies FIC and Trant Construction and at 31 March 2014 SAtCO had no permanent employees.
FIC Key Performance Indicators and Operational Drivers
Year ended 31 March 2014 2013 2012
Staff Numbers ( FTE 31 March ) 165 129 119 Capital Expenditure £’000’s 2,715 1,594 632 Retail Sales growth % -4.8% 3.0% -2.8% Number of FIC rental properties 36 32 33 Average occupancy during the year 82% 88% 83% Number of vehicles sold 79 48 50 Number of 3rd party houses sold 8 3 0 IIlex squid catch in tonnes ( 000’s) 188.0 58.2 67.3 Cruise ship passengers ( 000’s ) 39.5 29.6 35.2
Portsmouth Harbour Ferry Company (“PHFC”)
During the period, there was a significant improvement in the underlying trend as passenger numbers fell by 1.6%, compared to the 8.9% decline seen in the prior year. Overall total ferry revenues increased by 1.2% and operating profits, (before pontoon lease finance costs of £0.23 million) increased marginally to £1.01 million (2013: £0.98 million).
PHFC Operating results
Year ended 31 March 2014 2013
Change £m £m %
Revenues Ferry fares 3.95 3.89 1.5% Cruising and Other revenue 0.17 0.19 -5.4% Total PHFC revenue 4.12 4.08 1.2% Underlying PHFC operating profit 1.01* 0.98* 2.9% Underlying operating profit margin 24.6% 24.0% 2.2% Passengers carried (000s) 2,986 3,033 -1.6%
*Operating profit is shown before charging finance lease interest of £0.23 million (2013: £0.24 million) relating to the new Pontoon.
8

Over the course of the year weekday passenger numbers declined by 2.7% whereas in contrast weekend volumes increased by 1.8%. The further decline in weekday commuter traffic reflected the ongoing economic challenges in the local economy and the impact of changes to the Ministry of Defence’s policy of “Home to Duty” expenses reimbursement which saw a shift from ferry to car travel. However after persistent lobbying, support from the local MP in Gosport and the Secretary of State for Transport, the Ministry of Defence agreed to reverse its decision and from 1 May 2014 will once more reimburse travel to work on the ferry. We anticipate that this will have a positive impact on passenger numbers in 2014-15 which should go some way to offsetting the impact of 1,000 dockyard job losses announced by BAE Systems in 2014. Looking ahead the outlook for passenger growth is positive as the Naval Base expands to support the new Queen Elizabeth class carriers.
Ferry fares were increased by an average of 3.3% in June 2013, bringing the total cost of an adult return to £2.90. Discounted fares for regular customers (£1.35 per ferry journey), and lower tariffs for seniors and children (£1.90 return) reinforce the value for money offered by the ferry service compared to bus and car travel.
Average fares per passenger journey increased by 3.1% to £1.32 (2013: £1.28).
Ferry reliability was again outstanding with on time departures running at 99.7% (2013: 99.5%).
Construction is now well advanced on a third modern ferry vessel, “Harbour Spirit”, which is due to enter service early in 2015. Expenditure incurred in the year on the vessel amounts to £1.8 million and the total cost will be approximately £3.3 million, this will be substantially financed by a 10 year bank loan. With three ferry vessels built since 2001 and an estimated service life of over 30 years, no further significant vessel expenditure is anticipated in the next decade.
PHFC Key Performance Indicators and Operational Drivers
Year ended 31 March 2014 2013 2012 Staff Numbers ( FTE at 31 March ) 37 35 35 Capital Expenditure £ ‘ 000’s 1,958 223 5,080 Ferry Reliability( on time departures) 99.7% 99.5% 99.9% Number of weekday passengers ‘000 2,169 2,230 2,497 % change on prior year -2.7% -10.7% -1.6% Number of weekend passengers ‘000 817 803 831 % change on prior year 1.8% -3.4% -4.1% Total number of passengers ‘000’s 2,986 3,033 3,328 % change on prior year -1.6% -8.9% -2.1% Revenue growth % 1.2% -1.9% 11.5% Average yield per passenger journey £1.32 £1.28 £1.19
9

Momart
Momart, the Group’s art handling and logistics business, again produced a strong trading performance. The growth seen in the first half of the year continued into the second half and total revenue for the year increased by 12.0% to £18.3 million (2013: £16.3 million) while underlying operating profit increased by 53.1% to £1.83 million (2013: £1.19 million).
Momart Operating results
Year ended 31 March 2014 2013 Change £m £m %
Revenues Museums and public Exhibitions 10.86 9.01 20.4 Commercial gallery services 5.57 5.50 1.3 Storage 1.83 1.79 2.6 Total Momart revenue 18.26 16.30 12.0 Underlying Momart operating profit 1.83 1.19 53.1 Underlying operating profit margin 10.0% 7.3% 36.6
Exhibitions
Museum exhibitions enjoyed an exceptional year both in the UK and internationally with overall revenues increasing by 20.4% to a record level of £10.86 million. Momart installed a wide variety of high quality, technically complex exhibitions, drawing on its reputation for client service, problem solving and attention to detail. This record level of activity in exhibitions includes a number of large international projects which are not expected to re-occur in the near term and some touring exhibitions which travelled to multiple locations. In the UK, Momart was involved in the installation of a number of prestigious and popular exhibitions including: Manet: Portraying Life at the Royal Academy, Ellen Gallagher: AxMe at Tate Modern, David Bowie: Is and Masterpieces of Chinese Painting at the V & A, the Portrait of Vienna at the National Gallery, Vikings: Life and Legend at the British Museum and the Houghton Revisited Exhibition at Houghton Hall, which showcased Sir Robert Walpole’s personal art collection, on loan from the Hermitage Museum.
Gallery Services
Gallery Services revenues were 1.3% ahead of 2013 at £5.57 million. Gross margins improved, helped by the appointment of a new Finance and Commercial Director and as the first benefits were realised from Momart’s recent investment in improved management information systems. The final roll out of this ERP system was completed in March 2014 and further benefits are expected to be generated in the current year.
Storage
Storage revenues increased by 2.6% and were generated from a broader client base as new commercial relationships were established. With Momart’s existing storage facilities fully utilised plans are being progressed for a significant extension to existing warehouse facilities.
10

General
The year saw Momart generate record levels of revenue and contribution reflecting the strength of its global reputation and its commercial and institutional relationships which have been developed over decades. With the continued strength of the global art market and the increasing importance of London as an international centre, prospects for sustained growth and underlying profits are excellent, although in the short term we do not expect to see a repetition of the exceptional results of 2013-14.
Momart Key Performance Indicators and Operational Drivers
Year ended 31 March 2014 2013 2012 Staff Numbers ( FTE 31 March ) 124.6 119.0 115.9 Capital Expenditure £ ‘ 000’s 260 598 524 Warehouse % fill vs capacity 92.9% 94.2% 95.1%
Exhibition Order Book 31 March £3.89m £3.83m £4.16m Own labour charged out £11.67m £9.02m £8.58m Revenues from overseas clients £8.3m £4.6m £5.7m Exhibitions sales growth 20.4% 27.8% 5.7% Gallery Services sales growth 1.3% (12.7)% 26% Storage sales growth 2.6% 10.5% 6.6% Total Sales growth % 12.0% 8.9% 13.5%
FOGL investment
Details of the Group’s shareholding in FOGL are set out below:
31 March 2014
Number of shares held 12,825,000 FOGL share price (bid price) 25.5p Market value of holding £3.27m Cost £2.6m Book cost per share 20.0p
The market value of the Group’s 2.4% shareholding on 6 June 2014 was £3.30 million.
Trading outlook
The Group’s prospects for growth in the medium term remain outstanding.
In the Falklands, delays in the development of the Sea Lion oil field have slowed progress but the size of the discovery is such that its future development seems assured. With the added potential of positive results from the
11

2015 drilling campaign, the prospects for dramatic growth for the Falkland Islands economy over the medium term remain.
At PHFC the stabilisation in passenger numbers is encouraging and this should be helped by the recent change in travel policy by the Ministry of Defence and the longer term outlook for growth at the Portsmouth Dockyard.
At Momart, although we do not anticipate an immediate repetition of the exceptional performance seen in the year ended 31 March 2014, underlying growth prospects in this high quality business remain good.
With bank borrowings reduced to £1.0 million (2013: £2.0 million) and cash on hand of £5.7 million, together with significant further borrowing capacity, the Group has significant capacity to exploit opportunities over the medium term.
Financial Review Summary income statement
Year ended 31 March 2014 2013 Change £m £m %
Group revenue 38.26 35.60 7.5 Underlying Operating profit* 3.85 3.50 10.0 Net financing costs (0.20) (0.21) (2.8) Underlying profit before tax 3.65 3.29 10.8 Less: Fund raising costs - (0.68) – Gain on sale of FOGL shares - 0.77 – Gain / (loss) on disposal of the PHFC pension scheme 0.06 (0.18) (135.2) Amortisation of intangibles (0.31) (0.40) (22.9) Profit before tax as reported 3.40 2.80 21.7
*Underlying operating profit excludes amortisation and non-trading items but includes £0.04 million of the Group’s share of the results of the SAtCO joint venture. Revenue and underlying operating profit Group revenue rose 7.5% to £38.26 million and Group and underlying operating profit increased 10.0% to £3.85 million in the year ended 31 March 2014. These are discussed in more detail above in the Review of Operations. Non-trading items Non-trading items comprise a gain of £0.06 million on the final transfer of the PHFC defined benefit scheme (2013: loss £0.18 million), and a fall in the amortisation charge to £0.31 million on the intangible assets (2013: £0.40 million) due to a review of the useful life of the Momart brand name, which is now expected to have an indefinite useful life, so amortisation ceased on 30 September 2013. The prior year included a further profit of £0.77 million on the sale of FOGL shares and £0.68 million relating to the costs of the £10.0 million fund raising in July 2012.
Net financing costs The Group’s net financing costs remain little changed with the prior year at £0.20 million, with the fall in interest
12

income on bank deposits following the expenditure in the year, being offset by a decrease in bank interest payable reflecting the £1.0 million reduction in bank loans. Underlying pre-tax profit The Group’s underlying pre-tax profits (“PBT”) grew by £0.36 million (10.8%) to £3.65 million (2013: £3.29 million). Reported pre-tax profit After charging £0.3 million for the amortisation of intangible assets (2013: £0.4 million), and the other non-trading items noted above, reported profit before tax for the Group increased by 21.7% to £3.40 million (2013: £2.8 million). Taxation The Group pays corporation tax on its UK earnings at 23% and on earnings in the Falkland Islands at 26%. The Falklands Islands Company Limited has been granted a foreign branch exemption, and as a result no longer pays UK corporation tax and will gain the full benefit of the tax allowability in the Falkland Islands of expenditure on commercial and industrial buildings. The effective tax rate on underlying profits is 24.7% (2013: 24.2%). Earnings per share
Year ended 31 March 2014 2013 Change % £m £m
Underlying profit before tax 3.65 3.29 10.8 Taxation on underlying profit (0.90) (0.80) 13.2 Underlying profit after tax 2.75 2.49 10.1 Diluted average number of shares in issue (thousands) 12,461 11,704 6.5 Effective underlying tax rate 24.7% 24.2% 2.1 Diluted EPS on underlying profit 22.0p 21.3p 3.3
Fully diluted Earnings per Share (“EPS”) derived from underlying profits, increased by 3.3% to 22.0p (2013: 21.3p), this was after a 6.5% increase in the diluted average number of shares, following the 33% increase in the share capital of the Company in July 2012. Balance sheet The Group’s Balance Sheet remains strong. Total net assets increased to £35.4 million from £34.3 million in the prior year, despite a £0.1 million fall in the market value of the Group’s investment in FOGL as the share price fell slightly from 26.5 pence to 25.5 pence. Retained earnings after the payment of tax and dividends increased by £0.2 million to £14.8 million (2013: £13.6 million). Bank borrowings were reduced to £1.0 million (2013: £2.0 million) and the Group had cash balances of £5.7 million (2013: £11.4 million). The carrying value of intangible assets was reduced by £0.1 million to £12.2 million (2013: £12.3 million) due to the annual amortisation charge of £0.3 million on the intangible assets arising on the 2008 acquisition of Momart, and a £0.1 million amortisation charge for computer software, offset by a £0.3 million transfer from plant and machinery. The net book value of property, plant and equipment increased by £2.9 million to £16.6 million (2013: £13.7 million) after capital investment of £4.3 million, including £2.1 million in the Falkland Islands. The Group owns investment properties comprising commercial and residential properties in the Falkland Islands held for rental, together with approximately 400 acres in and around Stanley. This includes 18 acres for industrial
13

development, 25 acres of prime mixed-use land and 300 acres which is adjacent to the site proposed for a new port. During the year, the net book value of investment property increased £0.6 million to £3.4 million (2013: £2.8 million) after £0.1 million of depreciation. These properties are all situated in the Falkland Islands, and the £0.7 million additions include £0.2 million for the purchase of a property on Ross Road, Stanley and further development of residential properties to increase the Group’s portfolio. The Group owns 36 investment properties (mainly houses) in Stanley which are held at depreciated cost. The net book value of these properties of £3.4 million has been reviewed by the Directors resident in the Falkland Islands and at 31 March 2014 the fair value of this property portfolio was estimated at £6.3 million (2013: £5.7 million). If oil development proceeds, the value of all these properties is expected to increase significantly. The Group’s 2.4% shareholding in FOGL is described above in the Business Review. Deferred tax assets relating to future pension liabilities decreased to £0.6 million (2013: £0.7 million). These assets now only include the deferred tax on the FIC unfunded scheme calculated by applying the 26% Falklands tax rate. Inventories, which largely represents stock held for resale in the Falkland Islands increased by £1.6 million to £6.7 million at 31 March 2014. The increase largely relates to Falklands Building Services which is experiencing significant growth. Trade and Other Receivables were increased by £0.9 million to £7.0 million as at 31 March 2014 due to the increased activity at Momart. Average debtor days outstanding were 47.0 (2013: 57.1). Outstanding finance lease liabilities totalled £5.2 million (2013: £5.3 million). £4.9 million of the finance leases balance is in respect of the 50 year lease from Gosport Borough Council for the Gosport Pontoon. Corporation tax due for payment within the next 12 months is £0.4 million (2013: £0.4 million). This is lower than the £0.9 million taxation charge on underlying profit, as £0.3 million of the 2014 tax charge has been paid in instalments. Trade and other payables increased from £10.0 million to £11.0 million at 31 March 2014 reflecting increased trading activity. At 31 March 2014 the liability due in respect of the Group’s defined benefit pension schemes was £2.5 million (2013: £2.6 million). The pension scheme in the Falkland Islands, which was closed to new entrants in 1988 and to further accrual in 2007, is unfunded and liabilities are met from operating cash flow. The net deferred tax liabilities, excluding the pension asset at 31 March 2014 at £1.6 million remained in line with the prior year (2013: £1.7 million). £1.4 million of this balance arises on property, plant and equipment, and is principally due to properties in the Falklands, where capital allowances of 10% are available on the majority of the FIC properties. With such assets depreciated over 20-50 years a timing difference arises on which deferred tax is provided. Net assets per share were 285p at 31 March 2014 (2013: 276p).
14

Cash flows Operating cash flow Net cash flow from operating activities decreased from £3.5 million last year to £2.8 million, primarily due to a further increase in working capital as the Falkland Islands prepare for future growth. The Group’s Operating Cash Flow can be summarised as follows:
Year ended 31 March 2014 2013 £m £m
Underlying profit before tax 3.6 3.3 Depreciation 1.1 1.2 Amortisation of computer software 0.1 - Net Interest payable 0.2 0.2 EBITDA 5.0 4.7 Share based payments - 0.2 Increase in working capital (1.7) (0.5) Tax paid (0.8) (0.7) Other 0.3 (0.2) Net cash inflow from operating activities 2.8 3.5 Net proceeds of shares issued - 9.2 Sale of 1.2 million FOGL shares - 1.0 Less: Dividends paid (1.4) (1.4) Capital expenditure (5.0) (2.4) Net bank interest received 0.1 0.1 Disposal of PHFC pension scheme - (0.3) Loan to joint venture (0.5) - Net cash outflow on sale & purchase of treasury shares (0.1) - Loan repayments (1.4) (1.1) Increase in hire purchase debtors (0.2) (0.1) Financing draw down loans - 0.1 Net (outflow) / inflow from financing and investing activities (8.5) 5.1 Net cash (outflow) / inflow (5.7) 8.6 Cash balance b/fwd 11.4 2.8 Cash balance c/fwd 5.7 11.4
15

Financing outflows During the year the Group paid dividends of £1.4 million (2013: £1.4million) and made fixed asset investment of £5.0 million of expenditure to strengthen the Group’s operating base, including instalment payments of £1.6 million on the new vessel for Gosport ferry (2013 total expenditure: £2.4 million); £2.7 million was invested in Stanley with £0.7 million of expenditure on investment land and buildings, £0.6 million on plant and machinery, £0.3 million spend refurbishing the Stanley head office and £0.5 million building a new retail warehouse at Airport Road. Scheduled loan repayments of £1.4 million were made, including £0.3 million of payments to Gosport Council on the 50 year pontoon finance lease, £0.1m of repayments on hire purchase leases for trucks at Momart and £1.0 million of bank loan repayments reducing the Group’s bank debt to £1.0 million. John Foster Managing Director 9 June 2014
16

Consolidated Income Statement FOR THE YEAR ENDED 31 MARCH 2014 Before
amortisation & non-trading
items 2014 £'000
Amortisation & non-trading
items
2014 £'000
Total 2014 £'000
Before amortisation
& non-trading
items 2013 £'000
Amortisation & non-trading
items
2013 £'000
Total 2013 £'000
Revenue 38,263 - 38,263 35,596 - 35,596 Cost of sales (22,212) - (22,212) (21,178) - (21,178) Gross profit 16,051 - 16,051 14,418 - 14,418
Other administrative expenses (12,235) - (12,235) (10,916) - (10,916)
Fund raising expenses - - - - (682) (682) Gain on sale of FOGL shares - - - - 768 768
Net settlement gain / (loss) on the transfer of the PHFC pension scheme - 64 64 - (182) (182)
Amortisation of intangible assets - (307) (307) - (398) (398)
Operating expenses (12,235) (243) (12,478) (10,916) (494) (11,410) Operating profit 3,816 (243) 3,573 3,502 (494) 3,008
Share of results of Joint Venture 36 - 36 - - -
Profit before net financing costs 3,852 (243) 3,609 3,502 (494) 3,008
Finance income 220 - 220 257 - 257 Finance expense (425) (425) (468) (468) Net financing costs (Note 3) (205) - (205) (211) - (211)
Profit / (loss) before tax from continuing operations 3,647 (243) 3,404 3,291 (494) 2,797
Taxation (901) 130 (771) (796) (397) (1,193)
Profit / (loss) for the year attributable to equity holders of the company 2,746 (113) 2,633 2,495 (891) 1,604
Earnings per share (Note 4) Basic 22.2p 21.3p 21.6p 13.9p Diluted 22.0p 21.1p 21.3p 13.7p
17

Consolidated Statement of Comprehensive Income FOR THE YEAR ENDED 31 MARCH 2014 2014 2013 £'000 £'000 Unrealised loss on the revaluation of shares in Falkland Oil and Gas (129) (4,873) Transfer to the income statement on sale of shares in FOGL - (521) Items which will ultimately be recycled to the income statement (129) (5,394) PHFC actuarial loss on pension scheme - (77) FIC actuarial gain / (loss) on pension scheme 135 (173) Movement on deferred tax asset relating to pension schemes (35) 61 Effect of tax rate changes on deferred tax asset relating to pension schemes - 47 Items which will ultimately not be recycled to the income statement 100 (142) Other comprehensive expense (29) (5,536) Profit for the year 2,633 1,604 Total comprehensive income / (expense) 2,604 (3,932)
18

Consolidated Balance Sheet AT 31 MARCH 2014
2014 2013 £'000 £'000 Non-current assets Intangible assets 12,238 12,315 Property, plant and equipment 16,609 13,725 Investment properties 3,396 2,786 Shares held in Falkland Oil and Gas Limited 3,270 3,399 Investment in Joint venture 86 50 Loan to Joint venture 529 - Non-current assets held-for-sale - 20 Other financial assets 342 121 Deferred tax assets 645 671 Total non-current assets 37,115 33,087 Current assets Inventories 6,692 5,099 Trade and other receivables 7,041 6,133 Other financial assets 503 486 Cash and cash equivalents 5,715 11,416 Total current assets 19,951 23,134 TOTAL ASSETS 57,066 56,221
Current liabilities
Interest-bearing loans and borrowings (1,109) (1,149) Income tax payable (419) (364) Trade and other payables (10,981) (10,012) Total current liabilities (12,509) (11,525) Non-current liabilities Interest-bearing loans and borrowings (5,061) (6,139) Employee benefits (2,480) (2,584) Deferred tax liabilities (1,639) (1,694) Total non-current liabilities (9,180) (10,417) TOTAL LIABILITIES (21,689) (21,942) Net assets 35,377 34,279 Capital and reserves Equity share capital 1,243 1,243 Share premium account 17,447 17,447 Other reserves 1,162 1,162 Retained earnings 14,839 13,612 Financial assets fair value reserve 686 815 Total equity 35,377 34,279
19

Consolidated Cash Flow Statement FOR THE YEAR ENDED 31 MARCH 2014 2014 2013 £'000 £'000 Cash flows from operating activities Profit for the year 2,633 1,604 Adjusted for: (i) Non-cash items: Depreciation 1,116 1,204 Depreciation of computer software 117 - Amortisation 307 398 (Profit) / loss on disposal of fixed assets (4) 56 Share of Joint Venture profit (36) - Amortisation of loan fees 16 16 Past service cost of pension scheme 45 - Expected return on pension scheme assets - (2) Interest cost on pension scheme liabilities 108 111 Equity-settled share-based payment expenses 43 134 Non-cash items adjustment 1,712 1,917 (ii) Other items: Bank interest receivable (99) (164) Bank interest payable 39 85 Finance lease interest payable 262 - Gain on disposal of FOGL shares - (768) Fund raising expenses - 682 Net settlement (gain) / loss on the transfer of the PHFC pension scheme (64) 182 Corporation and deferred tax expense 771 1,193 Other adjustments 909 1,210 Operating cash flow before changes in working capital and provisions 5,254 4,731 Increase in trade and other receivables (888) (513) Increase in inventories (1,593) (1,108) Increase in trade and other payables 927 1,221 Decrease in provisions and employee benefits (122) (129) Changes in working capital and provisions (1,676) (529) Cash generated from operations 3,578 4,202 Corporation taxes paid (780) (735) Net cash flow from operating activities 2,798 3,467 Cash flows from investing activities Purchase of property, plant and equipment (4,933) (2,415) Purchase of computer software (41) - Proceeds from the disposal of property, plant & equipment 21 17 Proceeds received from the sale of FOGL shares - 1,005 Cash received / (paid) on transfer of pension scheme 46 (260) Investment in Joint Venture - (50) Loans to Joint Venture (529) - Interest received 99 164 Net cash flow from investing activities (5,337) (1,539) Cash flow from financing activities Increase in other financial assets (238) (72) Repayment of secured loan (1,396) (1,135) Financing loan draw downs - 122 Interest paid (39) (85) Proceeds from the issue of ordinary share capital - 9,889 Net cashflows from sale and purchase of Treasury shares (66) -
20

Fund raising expenses paid - (620) Dividends paid (1,423) (1,362) Net cash flow from financing activities (3,162) 6,737 Net increase in cash and cash equivalents (5,701) 8,665 Cash and cash equivalents at start of year 11,416 2,751 Cash and cash equivalents at end of year 5,715 11,416
Consolidated Statement of Changes in Shareholders' Equity FOR THE YEAR ENDED 31 MARCH 2014 2014 2013 £'000 £'000 Shareholders' funds at the beginning of the period 34,279 29,488 Profit for the year 2,633 1,604 Change in fair value of available-for-sale financial assets (129) (4,873) Transfer to the income statement on sale of available-for-sale equity securities - (521) Actuarial loss on pension net of tax 100 (189) Effect of tax rate changes to deferred tax asset relating pension schemes - 47 Total comprehensive expense 2,604 (3,932) Dividends paid (1,423) (1,362) Net Treasury share movements (126) - Proceeds from the issue of share capital - 9,889 Share-based payments 43 196 Shareholders' funds at the end of the period 35,377 34,279
21

NOTES 1. Basis of preparation
The financial statements are presented in pounds sterling, rounded to the nearest hundred thousand pounds. They are prepared on the historical cost basis except that the shares in Falkland Oil and Gas Limited are stated at their fair value.
The following amendments and revisions to IFRSs which were effective for the first time in the year ended 31 March 2014 did not have any material impact on the consolidated financial statements:
Amendments and revisions to IFRSs IFRS 7 Financial Instruments Disclosures IFRS 13 Fair Value Measurement IAS 19 Employee Benefits IAS 28 Investments in Associates and Joint Ventures IAS 27 Separate Financial Statements
At the date of authorisation of these financial statements, there are a number of Standards and Interpretations in issue but not yet effective that have therefore not yet been applied in these financial statements. The Directors anticipate that adoption of these Standards and Interpretations in future periods will have no material impact on the financial statements of the Group.
The financial information contained in this announcement was approved by the Board on 9 June 2014. The information in this preliminary announcement does not constitute the statutory accounts of the Group within the meaning of Section 434 of the Companies Act 2006. The statutory accounts of Falkland Islands Holdings plc for the year ended 31 March 2013 have been delivered to the Registrar of Companies. KPMG Audit Plc has reported on those accounts and KPMG LLP have reported on the statutory accounts for the year ended 31 March 2014. Both audit reports were (i) unqualified, (ii) did not include reference to any matters to which the auditors drew attention by way of emphasis without qualifying their report and (iii) did not contain a statement under section 498 (2) or (3) of the Companies Act 2006 in respect of the accounts for the year ended 31 March 2013 nor for the year ended 31 March 2014.
2. Segmental analysis
Segment information is presented in respect of the Group's business and geographical segments. The primary reporting format is determined to be by business type: the provision of ferry services; arts logistics and storage; and general trading in the Falkland Islands. The secondary reporting format is determined to be geographical. The Group is organised into three operating segments, and information on these segments is reported to the chief operating decision maker (‘CODM’) for the purposes of resource allocation and assessment of performance. The CODM has been identified as the Board of Directors. The operating segments offer different products and services and are determined by business type: general trading in the Falkland Islands, the provision of ferry services and art logistics and storage. Segment results, assets and liabilities include items directly attributable to a segment as well as those that can be allocated on a reasonable basis. Segment capital expenditure is the total cost incurred during the period to acquire property, plant and equipment and intangible assets other than goodwill.
22

2. Segmental analysis (continued)
2014 General Ferry Art logistics trading Services and storage (Falklands) (Portsmouth) (UK) Unallocated Total £'000 £'000 £'000 £'000 £'000 Revenue 15,881 4,124 18,258 - 38,263 Segment operating profit before tax, amortisation & non-trading items 977 1,013 1,826 - 3,816 Net settlement gain on the transfer of the PHFC pension scheme - - - 64 64 Amortisation
- - (307) - (307) Segment operating profit 977 1,013 1,519 64 3,573 Share of result of joint venture 36 - - - 36 Profit before net financing costs 1,013 1,013 1,519 64 3,609 Interest income 121 - - 99 220 Interest expense (108) (246) (29) (42) (425) Segment profit before tax 1,026 767 1,490 121 3,404 Assets and liabilities Segment assets 20,129 14,437 13,492 9,008 57,066 Segment liabilities (8,950) (6,541) (4,818) (1,380) (21,689) Segment net assets 11,179 7,896 8,674 7,628 35,377 Other segment information Capital expenditure: Property, plant and equipment 2,057 1,958 260 - 4,275 Investment properties 658 - - 658 Computer software - - 41 - 41 Depreciation Property, plant and equipment 429 332 307 - 1,068 Investment properties 48 - - - 48 Computer software - - 117 - 117 Amortisation of intangible assets on acquisition of Momart - - 307 - 307
Underlying profit before tax Segment operating profit 977 1,013 1,826 - 3,816 Share of results of joint venture 36 - - - 36 Underlying profit before net financing costs 1,013 1,013 1,826 - 3,852 Interest income 121 - - 99 220 Interest expense (108) (246) (29) (42) (425) Underlying profit before tax 1,026 767 1,797 57 3,647
23

2. Segmental analysis (continued)
2013 General Ferry Art logistics trading Services and storage (Falklands) (Portsmouth) (UK) Unallocated Total £'000 £'000 £'000 £'000 £'000 Revenue 15,222 4,076 16,298 - 35,596 Segment operating profit before tax, amortisation & non-trading items 1,325 984 1,193 - 3,502 Fund raising costs - - - (682) (682) Gain on sale of 1.175 million FOGL shares - - - 768 768 Net settlement loss on the transfer of the PHFC pension scheme - - - (182) (182) Amortisation
- - (398) - (398) Segment operating profit 1,325 984 795 (96) 3,008 Interest income 91 2 - 164 257 Interest expense (118) (263) (29) (58) (468) Segment profit before tax 1,298 723 766 10 2,797 Assets and liabilities Segment assets 15,059 12,792 13,532 14,838 56,221 Segment liabilities (8,664) (6,650) (4,597) (2,031) (21,942) Segment net assets 6,395 6,142 8,935 12,807 34,279 Other segment information Capital expenditure: Property, plant and equipment 1,332 223 598 - 2,153 Investment properties 262 - - - 262 Depreciation Property, plant and equipment 466 301 414 - 1,181 Investment properties 23 - - - 23 Amortisation of intangible assets on acquisition of Momart - - 398 - 398
Underlying profit before tax Segment operating profit 1,325 984 1,193 - 3,502 Share of results of joint venture - - - - - Underlying profit before net financing costs 1,325 984 1,193 - 3,502 Interest income 91 2 - 164 257 Interest expense (118) (263) (29) (58) (468) Underlying profit before tax 1,298 723 1,164 106 3,291
24
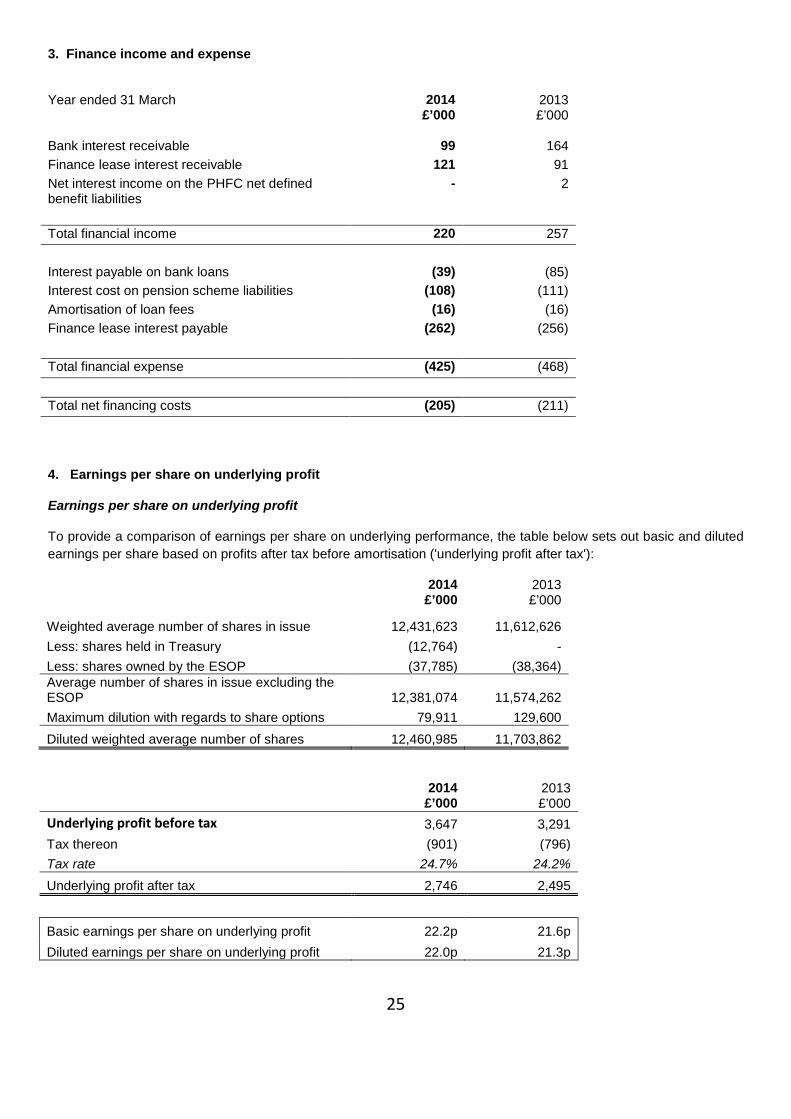
3. Finance income and expense Year ended 31 March 2014
£’000 2013 £’000
Bank interest receivable 99 164 Finance lease interest receivable 121 91 Net interest income on the PHFC net defined benefit liabilities
- 2
Total financial income 220 257 Interest payable on bank loans (39) (85) Interest cost on pension scheme liabilities (108) (111) Amortisation of loan fees (16) (16) Finance lease interest payable (262) (256) Total financial expense (425) (468) Total net financing costs (205) (211) 4. Earnings per share on underlying profit
Earnings per share on underlying profit
To provide a comparison of earnings per share on underlying performance, the table below sets out basic and diluted earnings per share based on profits after tax before amortisation ('underlying profit after tax'):
2014 £’000
2013 £’000
Weighted average number of shares in issue 12,431,623 11,612,626 Less: shares held in Treasury (12,764) - Less: shares owned by the ESOP (37,785) (38,364) Average number of shares in issue excluding the ESOP 12,381,074 11,574,262 Maximum dilution with regards to share options 79,911 129,600 Diluted weighted average number of shares 12,460,985 11,703,862 2014
£’000 2013 £’000
Underlying profit before tax 3,647 3,291 Tax thereon (901) (796) Tax rate 24.7% 24.2% Underlying profit after tax 2,746 2,495
Basic earnings per share on underlying profit 22.2p 21.6p Diluted earnings per share on underlying profit 22.0p 21.3p
25

5. Financial assets - available for sale equity securities
(a) At fair value
The Group has an investment of 12,825,000 shares (2013:12,825,000) in the AIM quoted company Falkland Oil and Gas Limited ('FOGL').
2014 2013
Number of shares held by Group 12,825,000 12,825,000 FOGL share price 25.5p 26.5p Investment stated at fair value:
Falkland Oil and Gas Limited £’000 3,270 3,399
(b) At cost
31 March 2014 £'000
31 March 2013 £'000
Investment at cost: Falkland Oil and Gas Limited 2,586 2,586
6. Net cash / (debt)
As at 1 April
2013 £'000
Cash flows £'000
As at 31 March
2014 £'000
Cash at bank and in hand 11,416 (5,701) 5,715 Debt due within one year (1,149) 40 (1,109) Debt due after one year - Bank loans (1,003) 969 (34) Debt due after one year - Hire Purchase (250) 81 (169) Debt due after one year - Pontoon Lease (4,886) 28 (4,858) Total debt (7,288) 1,118 (6,170) Net debt at end of period 4,128 (4,583) (455) 7. Final Dividend of 7.5 pence. The Directors recommend a dividend of 7.5p per share (2013: 7.5p) which, if approved by shareholders at the forthcoming Annual General Meeting on 4 September 2014, will be paid on 19 September 2014 to shareholders on the register at the close of business on 29 August 2014.
26