cleve gaddis re/max center sure realty, inc. report_2015.pdf · gaddis partners, re/max center ......
TRANSCRIPT

GoGaddis.com
Cleve Gaddis
Gaddis Partners, RE/MAX Center
Sure Realty, Inc.(a boutique residential property management company)
10475 Medlock Bridge Road, Suite 119Johns Creek, GA 30097
www.GoGaddis.com770‐497‐0000

GoGaddis.com
Metro AtlantaCleve’s 10‐Year Market Projections – SF Detached
48,908
51,926
55,129
58,531
62,142
65,976
70,047
74,369
78,958
83,829
89,002
$231,000
$221,760
$228,413
$235,265
$242,323
$252,016
$262,097
$275,909
$290,450
$305,756
$321,870
0
50000
100000
150000
200000
250000
300000
350000
2008 2009 2010 2011 2012 2013 2014 2015 2016 2017 2018
Total Single Family DetachedClosings
Average Sales Price
Actual Closings
Actual Average Sales Price
Source: First Multiple Listing Service

FMLS – Market Charts

GoGaddis.com Source: First Multiple Listing Service
47,82651,743
57,726
65,80368,256
57,218
45,992 44,75241,740
49,09254,174 53,965 54,857
62,552
0
10,000
20,000
30,000
40,000
50,000
60,000
70,000
80,000
2002 2003 2004 2005 2006 2007 2008 2009 2010 2011 2012 2013 2014 2015
Single Family Detached ‐ ClosingsMetro Atlanta
14.0%
2015 vs. 2014

GoGaddis.com
$225,022$231,846
$240,312$255,168$260,723
$265,723
$230,617
$197,562$200,252
$176,326$183,829
$230,762
$251,509
$267,098
$0
$50,000
$100,000
$150,000
$200,000
$250,000
$300,000
2002 2003 2004 2005 2006 2007 2008 2009 2010 2011 2012 2013 2014 2015
Single Family Detached ‐ Average Sale PriceMetro Atlanta
Source: First Multiple Listing Service
6.2%
2015 vs. 2014
Up 51.4% since 2011

GoGaddis.com
5,5146,185
8,181
10,562
12,052
10,771
7,794 7,722 7,648
8,758
9,84310,462
11,398
13,129
0
2,000
4,000
6,000
8,000
10,000
12,000
14,000
2002 2003 2004 2005 2006 2007 2008 2009 2010 2011 2012 2013 2014 2015
Single Family Attached ClosingsMetro Atlanta
Source: First Multiple Listing Service
15.2%
2015 vs. 2014

GoGaddis.com
$180,365$187,073$186,042
$186,324$192,495
$195,446
$177,318
$150,811$143,386
$125,126$139,328
$175,157
$195,334
$211,685
$0
$50,000
$100,000
$150,000
$200,000
$250,000
2002 2003 2004 2005 2006 2007 2008 2009 2010 2011 2012 2013 2014 2015
Single Family Attached ‐ Average Sales PriceMetro Atlanta
Source: First Multiple Listing Service
8.4%
2015 vs. 2014
Up 69.2% since 2011
GoGaddis.com
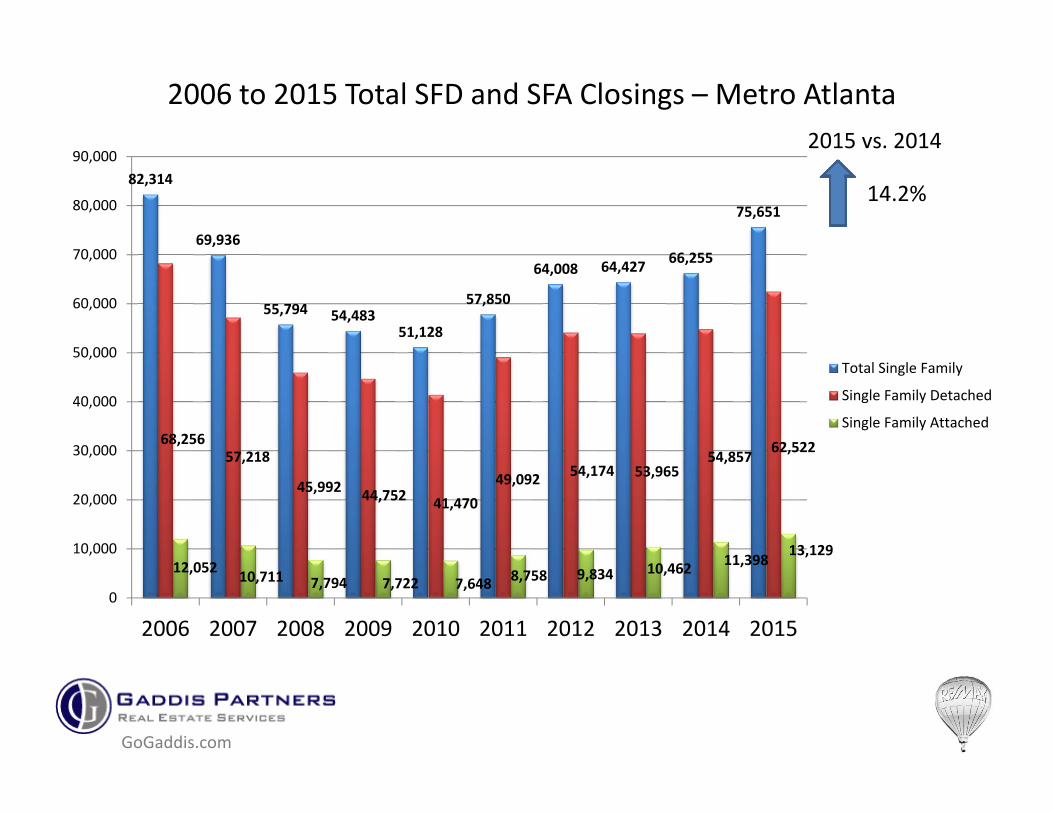
2006 to 2015 Total SFD and SFA Closings – Metro Atlanta
82,314
69,936
55,794 54,48351,128
57,850
64,008 64,427 66,255
75,651
68,25657,218
45,992 44,752 41,47049,092 54,174 53,965
54,857 62,522
12,052 10,711 7,794 7,722 7,648 8,758 9,834 10,462 11,398 13,129
0
10,000
20,000
30,000
40,000
50,000
60,000
70,000
80,000
90,000
2006 2007 2008 2009 2010 2011 2012 2013 2014 2015
Total Single Family
Single Family Detached
Single Family Attached
14.2%
2015 vs. 2014

GoGaddis.com
98
131
104 10289
102
150 155
137
120110
70
88
69
0
20
40
60
80
100
120
140
160
180
2002 2003 2004 2005 2006 2007 2008 2009 2010 2011 2012 2013 2014 2015
Single Family Detached –Total Days on MarketMetro Atlanta
Source: First Multiple Listing Service

GoGaddis.com
34,829
40,845 42,93939,050
45,847
63,922
71,676
51,695
43,966
35,169
20,529
15,11418,806 18,371
0
10,000
20,000
30,000
40,000
50,000
60,000
70,000
80,000
2002 2003 2004 2005 2006 2007 2008 2009 2010 2011 2012 2013 2014 2015
Single Family Detached ‐ Total Expired ListingsMetro Atlanta
Source: First Multiple Listing Service
GoGaddis.com
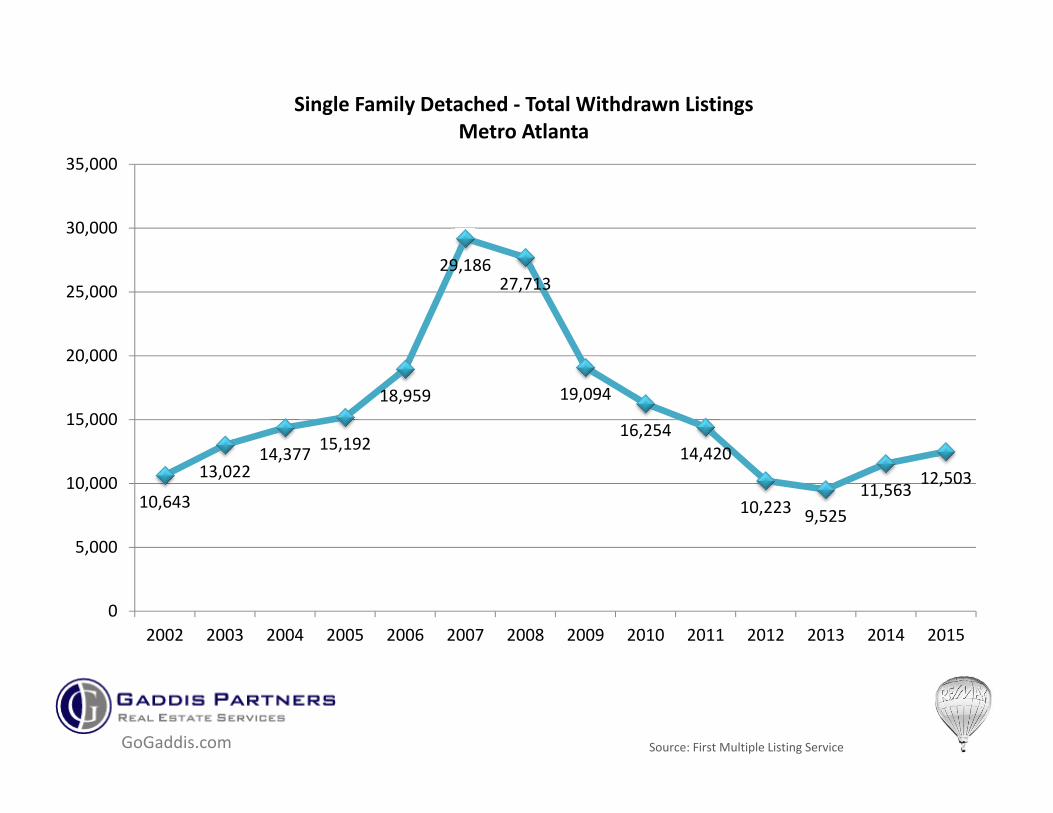
10,643
13,02214,377 15,192
18,959
29,18627,713
19,094
16,25414,420
10,223 9,52511,563
12,503
0
5,000
10,000
15,000
20,000
25,000
30,000
35,000
2002 2003 2004 2005 2006 2007 2008 2009 2010 2011 2012 2013 2014 2015
Single Family Detached ‐ Total Withdrawn Listings Metro Atlanta
Source: First Multiple Listing Service

GoGaddis.com
34,190
39,326 41,31144,544
59,425
75,622
68,431
54,121 54,070
36,659
23,56427,043
30,605 30,204
0
10,000
20,000
30,000
40,000
50,000
60,000
70,000
80,000
2002 2003 2004 2005 2006 2007 2008 2009 2010 2011 2012 2013 2014 2015
Total Listing Inventory as of 12/31 Metro Atlanta – All Property Types
Source: First Multiple Listing Service

GoGaddis.com
Months of Supply – Metro Atlanta• Seller’s Market – Less than 4 months inventory• Balanced Market – 4 to 5 months inventory• Buyer’s Market – More than 5 months inventory
0
5
10
15
20
25
2005 2006 2007 2008 2009 2010 2011 2012 2013 2014 2015
Mon
ths o
f Sup
ply
New ‐ ResidentialDetached
New ‐ ResidentialAttached
Resale ‐ ResidentialDetached
Resale ‐ ResidentialAttached
Balanced Market
Source: First Multiple Listing Service

GoGaddis.com
Closings Effectiveness RatioTotal Listings and Total Closings ‐Metro Atlanta
45% 30% 38% 37% 45%50%
45%33%
44%46%
Source: First Multiple Listing Service
120,892
134,956
148,498159,056
186,922
212,095
186,864
142,892137,975127,882125,693
108,526112,788 119,360
54,984 59,82668,547
79,637 83,935
70,645
55,369 54,181 50,98157,850
64,008 64,427 66,255
78,681
0
50000
100000
150000
200000
250000
2002 2003 2004 2005 2006 2007 2008 2009 2010 2011 2012 2013 2014 2015
Total Listings
Total Closings
65.9%45.5% 44.3% 46.2% 50.1% 44.9% 33.3% 29.6% 37.9% 36.9% 45.2% 50.9% 59.4%

GoGaddis.com
Sales Price to List Price RatiosSingle Family Detached in Metro Atlanta
97.0%95.6%
88.4%86.6%86.8%
88.5%90.2%
94.9%95.6%95.6%
97.6%96.7%94.7%
93.6%93.9%94.0%95.1%
96.8%96.9%97.1%
80.0%82.0%84.0%86.0%88.0%90.0%92.0%94.0%96.0%98.0%100.0%
2006 2007 2008 2009 2010 2011 2012 2013 2014 2015
OLP/SPLP/SP
Source: First Multiple Listing Service

GoGaddis.com
97.8%
94.2%
92.0%
93.0%
94.0%
95.0%
96.0%
97.0%
98.0%
99.0%
No Price Change With Price Change
Sales P
rice as % of O
riginal List Price
Effect of Price Changes onSales Price to Original List Price Ratio
Metro Atlanta ‐ Detached and Attached SF Homes
91.2 Days on Market
$11,306.50 lower sales price
31.2 Days on Market

GoGaddis.com Source: First Multiple Listing Service
20.7% 17.3% 14.2% 10.0% 7.0% 7.1% 8.9% 9.2% 10.2%
79.3% 82.7% 85.8% 90.0% 93.0% 92.9% 91.1% 90.8% 89.8%
0.0%
10.0%
20.0%
30.0%
40.0%
50.0%
60.0%
70.0%
80.0%
90.0%
100.0%
2007 2008 2009 2010 2011 2012 2013 2014 2015
New Construction and Re‐Sale Closingsin Metro Atlanta
% New % Re‐Sale

GoGaddis.com
Average Sales Prices of New and Re‐Sale Homes Metro Atlanta
Source: First Multiple Listing Service
71.8% 60.3% 63.0% 60.4% 62.1% 69.3% 70.8%
% Resale Price of New Price
$340,782$330,504
$298,396
$297,603
$275,583$283,724
$318,037$341,598
$353,852
$244,744
$207,495
$179,866
$187,610
$166,367$176,206
$220,529 $241,914
$256,607
$0
$50,000
$100,000
$150,000
$200,000
$250,000
$300,000
$350,000
$400,000
2007 2008 2009 2010 2011 2012 2013 2014 2015
Avg. Sales Price New Avg. Sales Price Re‐Sale
62.8% 72.5%

GoGaddis.com
Price Ranges of Single Family Detached Closings in Metro Atlanta
4684
974513437 13064
20284 21251
128248891 7764
31569
22185
18452 17547
17798 19940
24015
2575630347
1638811165
8886 85738267 9952
1301315506 18731
3526 2352 1800 1838 1792 1970 2769 3251 39281023 787 570 560 540 582 776 993 1123878 635 450 467 451 517 599 754 891
0%
10%
20%
30%
40%
50%
60%
70%
80%
90%
100%
2007 2008 2009 2010 2011 2012 2013 2014 2015
$1,000,000+
$750,000‐$999,999
$500,000‐$749,999
$250,000‐$499,999
$100,000‐$249,999
<$99,999
Source: First Multiple Listing Service

GoGaddis.com
19.15%
26.41%
31.24%
39.91%
45.09%
44.21%
36.42%
28.00%
15.00%
20.00%
25.00%
30.00%
35.00%
40.00%
45.00%
50.00%
2008 2009 2010 2011 2012 2013 2014 2015
Cash %
Cash Purchases as Percentage of Total Closings Single Family Detached ‐ Priced Under $200,000 ‐Metro Atlanta
Source: First Multiple Listing Service

GoGaddis.comSource: S&P/Case‐Shiller Home Price Index
104.8110.2 114.3117.79
122.2129.0
134.9 136.5124.7
110.1 110.0
88.995.7
113.4119.4
126.2
50.00
100.00
150.00
200.00
250.00
300.00
2000 2001 2002 2003 2004 2005 2006 2007 2008 2009 2010 2011 2012 2013 2014 2015
AZ‐Phoenix
CA‐Los Angeles
DC‐Washington
FL‐Miami
GA‐Atlanta
IL‐Chicago
NC‐Charlotte
NV‐Las Vegas
NY‐New York
TX‐Dallas
S&P/Case‐Shiller Home Price IndexAugust of Each Year
Atlanta up 43% since 2011

Metro AtlantaCounty Charts

GoGaddis.com
Source: First Multiple Listing Service
+16.5%
5.2% of total
10,337
7,681 7,9147,353
9,53710,516
8,9749,440
10,993
1,0741,961
2,697 2,272
3,4644,002
1,8981,302
571
0
2,000
4,000
6,000
8,000
10,000
12,000
2007 2008 2009 2010 2011 2012 2013 2014 2015
Gwinnett County
Total SFD Closings
Total SFD DistressedClosings
$241,070$222,523
$181,828$176,037
$142,737$150,101
$192,319$210,274
$275,646
$162,363$167,827
$157,777
$157,421
$108,892 $112,857$137,288
$142,827
$176,543
$0
$50,000
$100,000
$150,000
$200,000
$250,000
$300,000
2007 2008 2009 2010 2011 2012 2013 2014 2015
Gwinnett County
Avg. Total SP
Avg. Distressed SP
+31.1%

GoGaddis.com
Source: First Multiple Listing Service
3730
2770 2633 27473028
3279
4131 40344488
155 270 356 440 383 480235 161 57
0
500
1,000
1,500
2,000
2,500
3,000
3,500
4,000
4,500
5,000
2007 2008 2009 2010 2011 2012 2013 2014 2015
North Fulton County
Total SFD Closings
Total SFD DistressedClosings
$456,617$455,497
$410,796
$405,817
$392,881$361,230
$427,108$447,810
$482,670
$375,059$383,409
$370,524$350,100
$289,795
$284,992
$308,232$311,606
$405,978
$0
$100,000
$200,000
$300,000
$400,000
$500,000
$600,000
2007 2008 2009 2010 2011 2012 2013 2014 2015
North Fulton County
Avg. Total SP
Avg. Distressed SP
+11.2%
1.3% of total
+7.8%

GoGaddis.com
Source: First Multiple Listing Service
1,287
1,487 1,500
1,2911,372
1,560
1,190 1,238
1,415
234
531655
545 499
761
404 363203
0
200
400
600
800
1,000
1,200
1,400
1,600
1,800
2007 2008 2009 2010 2011 2012 2013 2014 2015
South Fulton County
Total SFD Closings
Total SFD DistressedClosings
$192,586
$151,830
$125,197$118,565$102,410
$101,955
$131,591$144,569
$157,731
$142,273
$117,374
$104,823$107,919
$83,622$85,813
$104,759
$100,491
$120,951
$0
$50,000
$100,000
$150,000
$200,000
$250,000
2007 2008 2009 2010 2011 2012 2013 2014 2015
South Fulton County
Avg. Total SP
Avg. Distressed SP
+14.3%
14.3 % of total
+9.1%

GoGaddis.com
Source: First Multiple Listing Service
4,215
5,213
4,459
3,4113,827 3,680
4,158 4,2734,553
1,128
2,0791,744
1,083 1,108833
552 651231
0
1,000
2,000
3,000
4,000
5,000
6,000
2007 2008 2009 2010 2011 2012 2013 2014 2015
City of Atlanta
Total SFD Closings
Total SFD DistressedClosings
$353,280
$217,427$197,349
$260,717$284,181
$297,869
$354,938
$393,134$415,586
$101,593
$59,615$64,789
$95,147$91,976
$129,508$132,346
$113,651$98,982
$0
$50,000
$100,000
$150,000
$200,000
$250,000
$300,000
$350,000
$400,000
$450,000
2007 2008 2009 2010 2011 2012 2013 2014 2015
City of Atlanta
Avg. Total SP
Avg. Distressed SP
+6.5%
5.1 % of total
+5.7%

GoGaddis.com
Source: First Multiple Listing Service
8,243
6,219 6,032 5,992
7,051
8,0418,551 8,511
9,446
7021167 1461 1643 1908 2063
1189 868368
0
1,000
2,000
3,000
4,000
5,000
6,000
7,000
8,000
9,000
10,000
2007 2008 2009 2010 2011 2012 2013 2014 2015
Cobb County
Total SFD Closings
Total SFD Distressed Closings
$279,727
$255,472
$225,781$221,356
$192,121$202,083
$245,411
$266,451$277,194
$163,622$161,340
$158,088$155,923
$113,041$126,026
$131,561
$162,313$156,415
$0
$50,000
$100,000
$150,000
$200,000
$250,000
$300,000
2007 2008 2009 2010 2011 2012 2013 2014 2015
Cobb County
Avg. Total SP
Avg. Distressed SP
+11%
+3.9% of total
+4.0%

GoGaddis.com
Source: First Multiple Listing Service
6,5396,031
5,7265,118 5,073
6,509 6,385 6,501
7,317
1,1931,742 1,768
1,429 1,582 1,754
981 986493
0
1,000
2,000
3,000
4,000
5,000
6,000
7,000
8,000
2007 2008 2009 2010 2011 2012 2013 2014 2015
Dekalb County
Total SFD Closings
Total SFD Distressed Closings
$265,330
$223,661
$179,446$184,816$167,863
$178,402
$248,769$264,629
$283,901
$131,504
$105,998$88,224$95,987$80,362$83,339
$104,047$119,156
$103,320
$0
$50,000
$100,000
$150,000
$200,000
$250,000
$300,000
2007 2008 2009 2010 2011 2012 2013 2014 2015
Dekalb County
Avg. Total SP
Avg. Distressed SP
+12.5%
6.7% of total
+7.3%

GoGaddis.com
Source: First Multiple Listing Service
$355,547
$324,648
$291,159$277,071
$256,347$263,620
$293,263$320,170
$337,768
$232,633
$279,964$264,959
$231,184
$190,018$185,018
$211,885$225,418
$209,898
$0
$50,000
$100,000
$150,000
$200,000
$250,000
$300,000
$350,000
$400,000
2007 2008 2009 2010 2011 2012 2013 2014 2015
Forsyth County
Avg. Total SP
Avg. Distressed SP
3,283
2,3862,098 2,199
2,6092,939
3,5573,769
4,186
121 259439 529 642 651
356 222 81
0
500
1,000
1,500
2,000
2,500
3,000
3,500
4,000
4,500
2007 2008 2009 2010 2011 2012 2013 2014 2015
Forsyth County
Total SFD Closings
Total SFD Distressed Closings
+11.0%
2% of total
+4.0%

GoGaddis.com
Source: First Multiple Listing Service
3,489
2,344 2,410 2,342
2,813
3,186
3,6093,794
4,281
185403
665 739891 977
649336
143
0
500
1,000
1,500
2,000
2,500
3,000
3,500
4,000
4,500
2007 2008 2009 2010 2011 2012 2013 2014 2015
Cherokee County
Total SFD Closings
Total SFD Distressed Closings
$253,392
$232,402$212,785
$203,348
$180,993$184,276
$211,014$231,251
$249,798
$182,532$182,441$198,066
$178,867
$136,053$139,641$150,575$156,683
$167,875
$0
$50,000
$100,000
$150,000
$200,000
$250,000
$300,000
2007 2008 2009 2010 2011 2012 2013 2014 2015
Cherokee County
Avg. Total SP
Avg. Distressed SP
+12.8%
3.3% of total
+8.0%

GoGaddis.com
Source: First Multiple Listing Service
1,779
1,216 1,2161,351
1,6351,789 1,834 1,851
2,202
131289
450 511595
769
397271
146
0
500
1,000
1,500
2,000
2,500
2007 2008 2009 2010 2011 2012 2013 2014 2015
Hall County
Total SFD Closings
Total SFD Distressed Closings
$254,922
$226,327
$202,984
$181,721
$158,667 $158,475
$193,258
$220,888$235,498
$138,768$156,681
$174,053
$149,894
$109,630$106,598
$106,296
$125,328$137,655
0
50,000
100,000
150,000
200,000
250,000
300,000
2007 2008 2009 2010 2011 2012 2013 2014 2015
Hall County
Avg. Total SP
Avg. Distressed SP
+18.9%
6.6% of total
+6.6%

GoGaddis.com
Source: First Multiple Listing Service
1,035
1,225
1,432
1,143
1,289
1,115
865 854
1,012
221
465567
486 514 536
368287
199
0
200
400
600
800
1,000
1,200
1,400
1,600
2007 2008 2009 2010 2011 2012 2013 2014 2015
Clayton County
Total SFD Closings
Total SFD DistressedClosings
$119,715
$83,003
$59,822$55,958$47,117 $48,588
$62,940
$80,545
$101,611
$92,228
$66,275$55,952
$50,699
$39,455$44,046
$57,113$65,212$62,121
0
20,000
40,000
60,000
80,000
100,000
120,000
140,000
2007 2008 2009 2010 2011 2012 2013 2014 2015
Clayton County
Avg. Total SP
Avg. Distressed SP
+18.5%
19.6% of total
+26.2%

GoGaddis.com
Source: First Multiple Listing Service280
239 234
186 192
216
244 237
282
2438
60
38 45 5234 32
14
0
50
100
150
200
250
300
2007 2008 2009 2010 2011 2012 2013 2014 2015
Fayette County
Total SFD Closings
Total SFD Distressed Closings
$308,204$294,653
$277,205$267,005
$227,401$239,630
$158,421
$283,195
$356,036
$230,856$204,486$194,453
$171,285$162,982
$171,005
$106,957
$170,841$182,617
$0
$50,000
$100,000
$150,000
$200,000
$250,000
$300,000
$350,000
$400,000
2007 2008 2009 2010 2011 2012 2013 2014 2015
Fayette County
Avg. Total SP
Avg. Distressed SP
+18.9%
5% of total
+25.7%

GoGaddis.com
Source: First Multiple Listing Service711
642
484
573526
554 574
759
217257
184146
203
13490 71
0
100
200
300
400
500
600
700
800
2008 2009 2010 2011 2012 2013 2014 2015
Henry County
Total SFD Closings
Total SFD DistressedClosings
$193,611
$172,714
$140,540$134,030$122,936$115,198
$142,569
$180,414
$202,749
$155,128$144,584
$130,525$111,110
$96,457$100,809$106,548$109,857
$130,428
$0
$50,000
$100,000
$150,000
$200,000
$250,000
2007 2008 2009 2010 2011 2012 2013 2014 2015
Henry County
Avg. Total SP
Avg. Distressed SP
+28.0%
9.3% of total
+11%

GoGaddis.com
Source: First Multiple Listing Service
364
329
367
330
295322
284263
336
71
105
147122
89
139
9470
41
0
50
100
150
200
250
300
350
400
2007 2008 2009 2010 2011 2012 2013 2014 2015
Rockdale County
Total SFD Closings
Total SFD Distressed Closings
$210,530
$172,777
$152,726$149,421
$121,904$113,566
$139,831$156,880
$162,453
$169,542
$143,675
$136,289$141,007
$115,355
$94,918$103,225
$135,012$127,770
$0
$50,000
$100,000
$150,000
$200,000
$250,000
2007 2008 2009 2010 2011 2012 2013 2014 2015
Rockdale County
Avg. Total SP
Avg. Distressed SP
+27.3%
12.2% of total
+3.5%

GoGaddis.com
The Effect of Distressed Property Sales on Single Family Sales Prices in 2012 in Metro Atlanta
Source: First Multiple Listing Service
Average Sales Price (Non‐Distressed) $220,930Single Family Detached
Average Sales Price (Distressed Closings) $110,676Single Family Detached
Average Sales Price (All Closings) $183,827 Single Family Detached
Average Sales Price (Non‐Distressed) $166,180Single Family Attached
Average Sales Price (Distressed Closings) $82,250Single Family Attached
Average Sales Price (All Closings) $139,729Single Family Attached
‐16.7%
‐15.9%

GoGaddis.com
The Effect of Distressed Property Sales on Single Family Sales Prices in 2013 in Metro Atlanta
Source: First Multiple Listing Service
Average Sales Price (Non‐Distressed) $258,683Single Family Detached
Average Sales Price (Distressed Closings) $120,509Single Family Detached
Average Sales Price (All Closings) $230,731 Single Family Detached
Average Sales Price (Non‐Distressed) $194,596Single Family Attached
Average Sales Price (Distressed Closings) $92,310Single Family Attached
Average Sales Price (All Closings) $175,189Single Family Attached
‐10.8%
‐10.0%

GoGaddis.com
The Effect of Distressed Property Sales on Single Family Sales Prices in 2014 in Metro Atlanta
Source: First Multiple Listing Service
Average Sales Price (Non‐Distressed) $266,056Single Family Detached
Average Sales Price (Distressed Closings) $142,924Single Family Detached
Average Sales Price (All Closings) $251,349 Single Family Detached
Average Sales Price (Non‐Distressed) $204,098Single Family Attached
Average Sales Price (Distressed Closings) $95,553Single Family Attached
Average Sales Price (All Closings) $195,314Single Family Attached
‐5.5%
‐4.3%

GoGaddis.com
The Effect of Distressed Property Sales on Single Family Sales Prices in 2015 in Metro Atlanta
Source: First Multiple Listing Service
Average Sales Price (Non‐Distressed) $276,138Single Family Detached
Average Sales Price (Distressed Closings) $125,887Single Family Detached
Average Sales Price (All Closings) $266,949 Single Family Detached
Average Sales Price (Non‐Distressed) $216,560Single Family Attached
Average Sales Price (Distressed Closings) $98,221Single Family Attached
Average Sales Price (All Closings) $211,674Single Family Attached
‐3.3%
‐2.3%

GoGaddis.com
Savings on Short Sales and Foreclosures vs. Market SalesMetro Atlanta 2015
Single Family Detached Single Family Attached
Non Distressed Avg. Sales Price $276,138
Short Sales Avg. Sales Price$152,242 (45% less)
Foreclosures Avg. Sales Price$112,168 (60% less)
Non Distressed Avg. Sales Price $216,560
Short Sales Avg. Sales Price$106,745 (51% less)
Foreclosures Avg. Sales Price$93,032 (57% less)
Source: First Multiple Listing Service

Mortgage Delinquencies

GoGaddis.com
Source: Mortgage Bankers Association & caculatedriskblog.com

GoGaddis.com
Source: Mortgage Bankers Association & calculatedriskblog.com
2015 National Foreclosure Rate: 1.2%
2015 Georgia Foreclosure Rate: .67%

Price‐to‐Rent Ratios

GoGaddis.com

GoGaddis.com

GoGaddis.com
Cost to Purchase vs. Rent AnalysisMetro Atlanta, GA
Average Monthly Cost to Rent Metro Atlanta Home: $1,652
Average Monthly Cost to Purchase Metro Atlanta Home: $1,320 (20% less)
Effective Monthly Cost to Purchase with Tax Advantages: $1,120 (32% less)

Looking Ahead

GoGaddis.com
2016 Atlanta Real Estate Market Projections:
• Prices will rise 5‐6%.• Sales will rise 8‐10%.• Buyer sense of urgency will increase.• More buyers and sellers will question the need for having representation
from an agent.• Credit standards will continue to ease.• Mortgage rates will rise slightly – and just slightly.• Builders will start offering more incentives (to buyers and to
brokers/agents).• “Smart Data” will start to emerge.• “Rebate” brokerage models will be on the rise.• Potential sellers will worry more about where they are going to move
than last couple years.• Sellers will want to push the envelope on pricing.• Buyer’s remorse after contract will increase in the tighter market.

GoGaddis.com

GoGaddis.com

GoGaddis.com
*1982‐2000
Millennial* Myths:
• Prefer to live in parent’s basement
• Too much student debt to buy homes
• Prefer to rent than buy
• Live Urban

GoGaddis.com

GoGaddis.com
7.3 million more homeowners


GoGaddis.com
100
600
1100
1600
2100
2600
3100 Apples to Apples 100‐based IndexUS Average Home Sales Price Dow Jones Industrial Average S&P 500 Average
Source: US Census

GoGaddis.comSource: US Census
$0
$50,000
$100,000
$150,000
$200,000
$250,000
$300,000
$350,000
Average US Home Prices
Average US Home Sales Price US Average Home Sales Price ‐ Adjusted for Interest Rate

GoGaddis.com
‐
1.00
2.00
3.00
4.00
5.00
6.00
7.00
8.00
9.001‐Jan‐00
1‐Jul‐0
0
1‐Jan‐01
1‐Jul‐0
1
1‐Jan‐02
1‐Jul‐0
2
1‐Jan‐03
1‐Jul‐0
3
1‐Jan‐04
1‐Jul‐0
4
1‐Jan‐05
1‐Jul‐0
5
1‐Jan‐06
1‐Jul‐0
6
1‐Jan‐07
1‐Jul‐0
7
1‐Jan‐08
1‐Jul‐0
8
1‐Jan‐09
1‐Jul‐0
9
1‐Jan‐10
1‐Jul‐1
0
1‐Jan‐11
1‐Jul‐1
1
1‐Jan‐12
1‐Jul‐1
2
1‐Jan‐13
1‐Jul‐1
3
1‐Jan‐14
1‐Jul‐1
4
1‐Jan‐15
1‐Jul‐1
5
1‐Jan‐16
Mortgage Rates ‐ 10‐Year Treasury Yield ‐ Fed Funds Rate
30‐year Mortgage Rate 15‐year Mortgae Rate 10‐year Treasury Yield Federal Funds Rate
Source: Freddie Mac & US Federal Reserve
Historic:15‐year spread: 1.18%30‐year spread: 1.76%
Today:15‐year spread: .68%30‐year spread: 1.38%

GoGaddis.com
Atlanta Will Continue to Grow
Source: Atlanta Regional Commission
• By 2040
Year Population Employment2010 5,473,846 2,699,9502040 8,256,323 4,472,563

GoGaddis.com
Source: Atlanta Regional Commission and US Census
New Housing Units Required in Metro Atlanta based on Population Growth
2016 35,5372017 35,5372018 35,5372019 35,5372020 35,537
5‐Year Total 177,685

GoGaddis.com
Where Will Growth Take Place in Metro Atlanta?
Source: Atlanta Regional Commission
For 20 Counties
NNWNNE
ENE
ESE
SSESSW
WSW
WNW
The “Core” is not depicted by a “growth bar”, but increases by 77,024 persons and 65,562 jobs between 2000 and 2030

GoGaddis.com
Metro Atlanta Employment Density ‐2030
Source: Atlanta Regional Commission
1.32 = median jobs per acre for census tracts
Jobs per acreLess than .3 jobs per acre
0.31 - 1.32 (Below Median)
1.33 - 3.00 (Above Median)
3.01 - 8.00 (Job Rich)
< 8 (Very Job Rich)
50 percent of 20‐county jobs
is inside the blue outline

GoGaddis.com
Feel Free to contact me with any questions.
Cleve Gaddis
Gaddis Partners, RE/MAX Center
Sure Realty, Inc.(a boutique residential property management company)
10475 Medlock Bridge Road, Suite 119Johns Creek, GA 30097
www.GoGaddis.com770‐497‐0000