cleaning oil-contaminated vessel by emulsan …
TRANSCRIPT

Dow
nloa
ded
from
http
://jo
urna
ls.tu
ms.
ac.ir
/ on
Mon
day,
Mar
ch 1
2, 2
012
Iran. J. Environ. Health. Sci. Eng., 2010, Vol. 7, No. 3, pp. 209-222
209
*Corresponding author: E-mail: [email protected]/Fax:+98 22-82276636
CLEANING OIL-CONTAMINATED VESSEL BY EMULSAN PRODUCERS (AUTOCHTHONOUS BACTERIA)
1,3P. Chamanrokh, *2 M. Mazaheri Assadi, 1,3 Gh. Amoabediny, 1,3H. Rashedi
1Department of Chemical Engineering, Faculty of Engineering, Tehran University,Tehran, Iran
2*Environmental Biotechnology Group, Biotechnology Department, Iranian Research Organization for Science and Technology,Tehran, Iran
3 Research Center for New Technologies in Life Science Engineering, University of Tehran, Tehran, Iran
Received 28 October 2009; revised 20 March 2010 ; accepted 25 June 2010
ABSTRACTIn a process for cleaning hydrocarbonaceous residues, including residual petroleum from laboratory made oil-contaminated vessels, several previously isolated bacteria from Ilam and Paydar oil reservoirs, were used. The isolated strains were compared with the standard sample of Acinetobacter calcoaceticus PTCC 1318 from Persian Type Culture Collection (PTCC). This gram-negative bacterium grows on a variety of different substrates as sole carbon and energy sources, including crude oil, soy oil and ethanol. It is oxidase-negative, non-motile and strictly aerobic. Among the isolated strains, two autochthonous strains were found to produce an extracellular emulsifying agent when grown in Mineral Salt Medium containing soy oil, ethanol or local crude oil. The crude emulsifier of PTCC1318, Paydar-4 and Ilam-1 were concentrated from the cell-free culture fluid by ammonium sulfate precipitation to yield 1.89 g, 1.78 g and 1.69 g of bioemulsan, respectively. Although measuring the surface tension (ST) is not very applicable procedure in case of bioemulsan, but in order to prove this theory, ST was conducted.Further analysis of purified emulsion was performed to prove the molecular structure by Carbon13 Nuclear Magnetic Resonance, Proton1Nuclear Magnetic Resonance and Fourier Transform Infrared Radiation methods. These investigations showed that the molecular weight of emulsion produced by species isolated from Ilam and Paydar crude oil reservoirs are comparable with Acinetobacter calcoaceticus PTCC 1318.
Key words: Autochthonous Bacteria; Oil-contaminated vessel; Emulsan clean-up; Acinetobacter calcoaceticus
INTRODUCTIONThere is a significant increase in world production of petroleum hydrocarbon to 2.030.866 thousand billion barrel/day. This dramatic increase in the production, refining and distribution of crude oil has also brought with it an ever-increasing problem of environmental pollution, which has been a consequence of the massive movements of petroleum by oil tankers from the areas of
high production to those of high consumption. It has been estimated that between 0.5-0.6 % of transported crude oil finds its way into aquatic environment, largely through accidental spills and deliberate discharge of ballast and wash waters from oil tankers.The application of biotechnology in oil arena is expanding continually (Akhavan et al., 2008; Tabatabaee et al., 2005). Today the experts of biotechnology with cooperation of oil engineers
Dow
nloa
ded
from
http
://jo
urna
ls.tu
ms.
ac.ir
/ on
Mon
day,
Mar
ch 1
2, 2
012
P. Chamanrokh, et al., ClEANINg oIl-CoNTAmINATEd VESSEl ...
210
are trying to improve production from oil wells. The basic idea in the microbial method is the application of certain microbes in wells to augment the production. Prior to this research, processing on bioemulsan production and application has been studied by different scientists (Pornsunthorntawee et al., 2008a, b; Joshi et al., 2008a, b; Mukherjee et al., 2009). Bioemulsifiers are amphipathic molecules, usually derived from microorganisms, and can be divided into low-molecular mass compounds, such as glycolipids and phospholipids, which lower the interfacial tension between hydrophobic liquids and water and thus reduce the energy required to emulsions and polymers or complexes of polymers, referred to bioemulsans, which stabilize emulsions.Acinetobacter is a bacterium that can degrade and remove a wide range of organic and inorganic compounds by producing emulsan. The gram negative bacterium Acinetobacter calcoaceticus PTCC 1318 grows on a variety of different substrates as sole carbon sources, including crude oil, middle chain length alkanes, alcohols, fatty acids and triglycerides (Chamanrokh et al., 2008), with molecular weight of about 1000 KD in average.It is oxidase-negative, non-motile, and strictly aerobic and appears as gram-negative coccobacilli in pairs under the light microscope. It can use various carbon sources for growth and can be cultured on relatively simple media, including nutrient agar or trypticase soya agar. When this microorganism grows under adequate conditions, it produces a group of extra-cellular anionic lipoheteropolysaccharides known as emulsan. Emulsan stabilizes a wide variety of oil-in-water emulsions by forming a strong film at the oil–water interface(Chamanrokh et al., 2008).. The famous bacterium called Acinetobacter calcoaceticus Rag-1 grows to the stationary phase and releases emulsan. Emulsan has a main chain composed of three amino sugars, including D-galactosamine, D-galactosamineuronic acid and diamino-6-deoxy- D-glucose. Saturated and monounsaturated fatty acids ranging from C10 to C18 are linked to the polysaccharide backbone by O- and N- acyl bonds and constitute up to 15% (w/w) of the polymer. These structural
characteristics lead to amphipathic behavior and utility of emulsan for a range of emulsifier applications including oily residue removal and stabilization of 70% o/w emulsions (Kim et al., 1997; Gorkovenko et al., 1999; Toledo et al., 2008). Owing to these properties, emulsan can commercially be applied to emulsion stabilization and heavy oil transportation (Zhang et al., 1997).The objective of this study was to process the cleaning hydrocarbonaceous residues, including residual petroleum, from oil-contaminated tankers and characterize the molecular structure of an specific emulsan produced by two autochthonous bacteria, and to compare it with the standard species of Acinetobacter calcoaceticus PTCC 1318.
MATERIALS AND METHODSStrainsTwo bacterial strains were previously isolated autochthonous from Ilam and Paydar crude oil reservoirs (Amirian et al., 2004). Acinetobacter calcoaceticus PTCC 1318 was kindly donated by PTCC (Persian Type Culture Collection). The cells were maintained as frozen glycerol cultures (1:1 mixture of freshly grown cells and 30% [wt/vol] glycerol solution) at -70°C.
Preculture The optimized nutrient broth medium used for all the strains was the same as described previously (Chamanrokh et al., 2008). The innoculum size was adjusted to OD600 = 1 (Amirian et al., 2004; Chamanrokh et al., 2008).
Pre-cultivation conditionsMedium optimization with respect to emulsan production in batch culture was performed with the used organism on lab scale in a 1-liter flask which was described in detail elsewhere (Francy et al . ,1991:Chamanrokh et al., 2008). Different carbon sources like ethanol (2%), soy oil (1%) and crude oil (3%) were used (Amirian et al., 2004: Chamanrokh et al., 2008).
Size of inoculumsInoculates were grown in several baffled 1-liter shake flasks with 200 mL of mineral salt medium.

Dow
nloa
ded
from
http
://jo
urna
ls.tu
ms.
ac.ir
/ on
Mon
day,
Mar
ch 1
2, 2
012
Iran. J. Environ. Health. Sci. Eng., 2010, Vol. 7, No. 3, pp. 209-222
211
Late-exponential-phase cells (1 litre) served as the inoculums for the start-up batch cultivation. Ethanol, soy oil and crude oil were used as sources of carbon and energy. As described in previous studies, flasks were placed in a Lab-line incubator-shaker maintained at 30°C (200 rpm) (Chamanrokh et al., 2008).
Experimental design of crude oil tankerThe simple experimental apparatus used as oil tanker consisted of a channel of length 75cm , width of 25cm and depth of 0.8m. First and foremost, prior to the experiment, the microcosm was cleaned and flushed out with tap water to ensure cleaning of the surface. After then, the apparatus was filled with crude oil and left to calm down to become stagnant. Furthermore, the microcosm was emptied. Crude oil was released in the inner surface of the apparatus and then the pre- production medium was spread over the crude oil surface. The time of dispersion was noted starting instantly at the time the culture medium was released into the apparatus containing crude oil (Nemati and Mazaheri, 2003).
Surface tensionPeriodically the surface tension was measured using Dv Novy Ring Method and a tensiometer system 40 mL from 72h culture medium was purred in Petri dish. The temperature was set on 25°C and the surface tension was measured for each sample the test was triplicated. Each time the water surface tension and the sterile medium were measured as reference number (Cooper et al., 1987; Adria et al., 2003).
Cmd (Critical micelle dilution)To measure CMD-1 and CMD-2, the 72h cultured MSM medium was diluted to 1/10 and 1/100 dilutions of phosphate buffer and put an overnight at room temperature. Then the surface tensions from diluted tubes were measured (Rosenberg et al., 1979; Cooper et al., 1987). Isolation of emulsanAfter the fermentation period in experimental apparatus (oil tanker), the content were collected in a flask centrifuged (8000 rpm, 40 min), the supernatant was collected, and the pellet was
washed with distilled water. The supernatant and the washing liquid were combined and sulfate 50% was added to the cell-free liquid which was maintained at 4°C for 24h. The resulting precipitate was separated by centrifugation (8000 rpm, 40 min), suspended in water, dialyzed against distilled water for 2 days (at least five replacements of water) and dried by lyophilization. The crude Ethyl Methyl Keton was extracted with ether for 2 days using a Soxhlet apparatus and the Ethyl Methyl Keton yield was then determined by gravimetric analysis after drying the product in-vacuo (pressure< 30 mm Hg, 50°C) to constant weight (Rosenberg et al., 1988). molecular structure analysisCarbon Nuclear Magnetic Resonance (13CNMR) spectra was recorded at 300 MHz using a magnetic fielded 7 Tesla and magnet (super conductor, Bruker, Germany). The solvent was D2O in Carbon Nuclear Magnetic Resonance ( Pavia, 1996).Proton1 Nuclear Magnetic Resonance (1HNMR) spectra was recorded at 300 MHz using a magnetic fielded 7 Tesla, and magnet: super conductor, Bruker, Germany. The solvent was Dimethyl Solfucside in (Proton1) Nuclear Magnetic Resonance ( Pavia, 1996).
FT-IR (Infra red spectrometry)Fourier transform infrared (FT-IR) spectra was recorded with a Thermo Nicollet model 870. The infra red spectra of 2 emulsan molecules obtained from Strain Paydar-4 and Ilam-1, were compared with Acinetobacter calcoaceticus PTCC 1318.
RESULTSEmulsan production in crude oil tankersIn present studies it is found out that two previously isolated autochthonous bacteria from Iranian crude oil reservoir designated as (Pay-4) and (Il-1), have the potential to produce the highest amount of emulsan not only in flask but also in a simple experimental designed apparatus as a crude oil tanker. The best conditions for emulsan production were obtained with the slightly modified minimal medium (Nemati and Mazaheri, 2003). During logarithmic phase, cells accumulated

Dow
nloa
ded
from
http
://jo
urna
ls.tu
ms.
ac.ir
/ on
Mon
day,
Mar
ch 1
2, 2
012
P. Chamanrokh, et al., ClEANINg oIl-CoNTAmINATEd VESSEl ...
212
capsular material on the cell surface and then released this polymeric material in the form of an active emulsifier in stationary phase. Bioemulsifier production by microorganisms is generally associated with cell growth on different carbon sources needed for maximum bacterial growth. In the example of this work, three different carbon sources (ethanol, crude oil and soy oil) were examined in a minimal salt medium for their ability to support cell growth and production of bioemulsan. Among these carbon sources, soy oil yielded the best cell growth. Other low molecular weight carbon sources might also be employed, but
their efficiency would have to be established on a strain-by-strain basis. The dry weights of each bacterial strain after 72h of growth were 3 g/L for A. calcoaceticus PTCC 1318, 2.8 g/L for Il-1 and 2.9 g/L for Paydar-4 in crude oil medium. When soy oil was used, 3.2 g/L for A. calcoaceticus, 3g/L for Il-1 and 3.5 g/L for Paydar-4 in Soya medium, 2.8 g/L for A. calcoaceticus and 2.6g/L for Il-1 and 2.7 g/L for PAY-4 in ethanol medium was obtained (Table 1). In order to find out if there is any difference or interaction of water in oil emulsion, crude oil culture medium was used to compare with cell free medium after centrifugation of 8000 rpm for 40 minutes using all the three strains.
Surface tension analysisThe results showed that surface tension (Fig. 1) was about 30, 30 and 32 (mN/m) for A. calcoaceticus PTCC 1318, Pay-4 and Il-1, respectively when ethanol was used as media. Whereas surface tension was 28.2, 29 and 30(mN/m) for A. calcoaceticus PTCC 1318, PAY-4 and Il-1
Table 1:Results of Day Weight Cell Biomass
Crude oil Soy oil Ethanol
PTCC1318 3 3/4 2/9
PAY-4 3/1 3/2 2/8Il-1 2/8 2/9 2/7
Fig. 1: Results of surface tension ST (mN/m), CMD-1, CMD-2 for culture media
26
27
28
29
30
31
32
33
RAG - 1 PAY - 4 IL- 1
Ethanol Soya Oil
28
29
30
31
32
33
34
35
RAG - 1 PAY - 4 IL- 1
Ethanol Soya Oil
34
35
36
37
38
39
40
41
RAG - 1 PAY - 4 IL- 1
Ethanol Soya Oil
(a) (b)
(c)

Dow
nloa
ded
from
http
://jo
urna
ls.tu
ms.
ac.ir
/ on
Mon
day,
Mar
ch 1
2, 2
012
Iran. J. Environ. Health. Sci. Eng., 2010, Vol. 7, No. 3, pp. 209-222
213
respectively with soy oil as a source of carbon and energy. When Crude oil was used, the obtained surface tensions were 29, 29.2 and 31 (mN/m), respectively for the above-mentioned bacteria.
These results showed that when soy oil was used in the medium, there was better reduction in surface tension compared to crude oil and ethanol as the source of carbon. The same figure indicates
Fig 3. : ( Carbon13) Nuclear Magnetic Resonance for three bacteria in soya
Fig. 2: Results of surface tension, ST (mN/m), CMD-1, CMD-2 of Cell Free Medium
0
5
10
15
20
25
30
35
40
RAG - 1 PAY - 4 IL- 1
Ethanol Soya OilCrude oil
31
3233
3435
36
3738
3940
41
RAG - 1 PAY - 4 IL- 1
Ethanol Soya OilCrude oil
26
27
28
29
30
31
32
33
Ethanol Soya Oil
RAG - 1 PAY - 4 IL- 1
Crude oil
39.0
763
38.7
887
38.5
043
38.2
234
37.9
423
37.6
574
37.3
772

Dow
nloa
ded
from
http
://jo
urna
ls.tu
ms.
ac.ir
/ on
Mon
day,
Mar
ch 1
2, 2
012
P. Chamanrokh, et al., ClEANINg oIl-CoNTAmINATEd VESSEl ...
214
that although bacterium PAY-4 is a wild type but it is comparable with genetically modified PTCC 1318. Similar results were significant for CMD-1, CMD-2.
This reduction of surface tension measurements indicated the production of surface-active compounds by the microbial culture, which has been shown to aid the metabolism of the substrate and stimulate microbial growth.
Fig. 4 : (Proton1) Nuclear Magnetic Resonance for PTCC 1318 in range between 0-3 ppm
The CMD-1 and CMD-2 measurements of bioemulsan concentration (Fig. 2), showed that insufficient emulsan was produced when soy oil was used in medium to form micelles. After 48hs of growth, the emulsan concentration started to increase, reaching its maximum after about 72 h. These results indicate that the bioemulsan biosynthesis occurred predominately during the exponential growth phase, suggesting that the bioemulsan is produced as a primary metabolite accompanying cellular biomass formation. The results show that surface tension was about 34, 36 and 32 (mN/m) for A. calcoaceticus PTCC 1318, Paydar-4 and Il-1, respectively when ethanol was used as media. Whereas surface tension was 30, 28.4 and 28.5 (mN/m) for A. calcoaceticus PTCC 1318, Paydar-4 and Il-1 respectively, with soy oil as a source of carbon and energy. When crude oil was used, the obtained surface tension was 32, 34 and 30 (mN/m), respectively
for the above-mentioned bacteria. These results showed that when soy oil was used in medium, there was better reduction in surface tension in comparison with crude oil and ethanol as the source of carbon. The same figure indicates that although bacterium Paydar-4 is a wild type, but it is comparable with genetically modified PTCC 1318. Similar results were significant for CMD-1, CMD-2.. Also the result shows (Fig. 1 and 2) that bacterium PTCC 1318 has almost the same ability to reduce surface tension compared with two other isolates. On the other hand, bacterium Paydar-4 has more ability to reduce the surface tension compared with Il-1 isolate. The same results can be observed for CMD-1 and CMD-2.
molecular structure analysisWhen the results were compared to Pavya, 1996, the NMR spectra of the native polysaccharide were complex due to partial acylation and the
Fig. 4: 1HNMR for RAG-1 in range between 0-3 ppm.
____
_2.2
6093
1.98
802
1.87
945
1.41
819
1.22
116
1.13
930
0.83
890
0.73
353
ppm
2.0 1.5 1.0 0.5ppm
Fig. 4: 1HNMR for RAG-1 in range between 0-3 ppm.
____
_2.2
6093
1.98
802
1.87
945
1.41
819
1.22
116
1.13
930
0.83
890
0.73
353
ppm
2.0 1.5 1.0 0.5ppmFig. 4: 1HNMR for RAG-1 in range between 0-3 ppm.
____
_2.2
6093
1.98
802
1.87
945
1.41
819
1.22
116
1.13
930
0.83
890
0.73
353
ppm
2.0 1.5 1.0 0.5ppmFig. 4: 1HNMR for RAG-1 in range between 0-3 ppm.
____
_2.2
6093
1.98
802
1.87
945
1.41
819
1.22
116
1.13
930
0.83
890
0.73
353
ppm
2.0 1.5 1.0 0.5ppm
Fig. 4: 1HNMR for RAG-1 in range between 0-3 ppm.
____
_2.2
6093
1.98
802
1.87
945
1.41
819
1.22
116
1.13
930
0.83
890
0.73
353
ppm
2.0 1.5 1.0 0.5ppm
Fig. 4: 1HNMR for RAG-1 in range between 0-3 ppm.
____
_2.2
6093
1.98
802
1.87
945
1.41
819
1.22
116
1.13
930
0.83
890
0.73
353
ppm
2.0 1.5 1.0 0.5ppm
Fig. 4: 1HNMR for RAG-1 in range between 0-3 ppm.
____
_2.2
6093
1.98
802
1.87
945
1.41
819
1.22
116
1.13
930
0.83
890
0.73
353
ppm
2.0 1.5 1.0 0.5ppm
Fig. 4: 1HNMR for RAG-1 in range between 0-3 ppm.
____
_2.2
6093
1.98
802
1.87
945
1.41
819
1.22
116
1.13
930
0.83
890
0.73
353
ppm
2.0 1.5 1.0 0.5ppm

Dow
nloa
ded
from
http
://jo
urna
ls.tu
ms.
ac.ir
/ on
Mon
day,
Mar
ch 1
2, 2
012
Iran. J. Environ. Health. Sci. Eng., 2010, Vol. 7, No. 3, pp. 209-222
215
Fig. 5: (Proton1) Nuclear Magnetic Resonance for PTCC 1318 in range between 4-6 ppm
Fig. 6: (Proton1) Nuclear Magnetic Resonance for Paydar-4 in range between 0-3 ppm
high molecular weight. The (Proton1) NMR spectra of the emulsan showed that the repeating unit contained three kinds of sugars identified by the compositional analysis. These data are in agreement with the presence of a repeating unit composed of three sugars as already described by FT-IR spectra of polysaccharides derived from different carbon sources.
Carbon NmR for three bacteria in SoyaCarbon Nuclear magnetic resonance 13C NMR spectra was recorded at 300 MHz. The solvent
was D2O in (Carbon 13) NMR. Fig. 1 shows the results of (Carbon13) NMR for three bacteria in soya. According to this figure and using Pavia, 1996 as reference, the components of this particular molecule can be identified as emulsan (Fig. 3).
H NmR and FT-IR for three bacteria in SoyaProton1 NMR 1HNmR spectra was recorded at 300MHz. The figures show the results of Proton1 Nuclear Magnetic Resonance. According to these figures and using Pavia reference, the components
Fig. 5: 1HNMR for RAg-1 in range between 4-6 ppm.
ppm
____
_5.3
0381
____
_5.1
6533
____
_4.6
5281
ppm 6.0 5.8 5.6 5.4 5.2 5.0 4.8 4.6 4.4
inte
gral
Fig. 5: 1HNMR for RAg-1 in range between 4-6 ppm.
ppm
____
_5.3
0381
____
_5.1
6533
____
_4.6
5281
ppm 6.0 5.8 5.6 5.4 5.2 5.0 4.8 4.6 4.4
inte
gral
Fig. 5: 1HNMR for RAg-1 in range between 4-6 ppm.
ppm
____
_5.3
0381
____
_5.1
6533
____
_4.6
5281
ppm 6.0 5.8 5.6 5.4 5.2 5.0 4.8 4.6 4.4
inte
gral
Fig. 5: 1HNMR for RAg-1 in range between 4-6 ppm.
ppm
____
_5.3
0381
____
_5.1
6533
____
_4.6
5281
ppm 6.0 5.8 5.6 5.4 5.2 5.0 4.8 4.6 4.4
inte
gral
____
_2.2
6093
1.98
802
1.87
945
1.41
819
1.22
116
1.13
930
0.83
890
0.73
353
ppm
2.0 1.5 1.0 0.5ppm
Fig.6:1HNMR for PAY- 4 in range between 0-3 ppm.
____
_2.2
6093
1.98
802
1.87
945
1.41
819
1.22
116
1.13
930
0.83
890
0.73
353
ppm
2.0 1.5 1.0 0.5ppm
Fig.6:1HNMR for PAY- 4 in range between 0-3 ppm.
____
_2.2
6093
1.98
802
1.87
945
1.41
819
1.22
116
1.13
930
0.83
890
0.73
353
ppm
2.0 1.5 1.0 0.5ppm
Fig.6:1HNMR for PAY- 4 in range between 0-3 ppm.
____
_2.2
6093
1.98
802
1.87
945
1.41
819
1.22
116
1.13
930
0.83
890
0.73
353
ppm
2.0 1.5 1.0 0.5ppm
Fig.6:1HNMR for PAY- 4 in range between 0-3 ppm.
____
_2.2
6093
1.98
802
1.87
945
1.41
819
1.22
116
1.13
930
0.83
890
0.73
353
ppm
2.0 1.5 1.0 0.5ppm
Fig.6:1HNMR for PAY- 4 in range between 0-3 ppm.
____
_2.2
6093
1.98
802
1.87
945
1.41
819
1.22
116
1.13
930
0.83
890
0.73
353
ppm
2.0 1.5 1.0 0.5ppm
Fig.6:1HNMR for PAY- 4 in range between 0-3 ppm.
____
_2.2
6093
1.98
802
1.87
945
1.41
819
1.22
116
1.13
930
0.83
890
0.73
353
ppm
2.0 1.5 1.0 0.5ppm
Fig.6:1HNMR for PAY- 4 in range between 0-3 ppm.
____
_2.2
6093
1.98
802
1.87
945
1.41
819
1.22
116
1.13
930
0.83
890
0.73
353
ppm
2.0 1.5 1.0 0.5ppm
Fig.6:1HNMR for PAY- 4 in range between 0-3 ppm.
____
_2.2
6093
1.98
802
1.87
945
1.41
819
1.22
116
1.13
930
0.83
890
0.73
353
ppm
2.0 1.5 1.0 0.5ppm
Fig.6:1HNMR for PAY- 4 in range between 0-3 ppm.

Dow
nloa
ded
from
http
://jo
urna
ls.tu
ms.
ac.ir
/ on
Mon
day,
Mar
ch 1
2, 2
012
P. Chamanrokh, et al., ClEANINg oIl-CoNTAmINATEd VESSEl ...
216
Fig. 8: (Proton1) Nuclear Magnetic Resonance for IL-1 in the range between 0-3 ppm
Fig. 7: (Proton1) Nuclear Magnetic Resonance for Paydar-4 in range between 4-6 ppm
of emulsan molecular structure were obtained. The solvent was DMSO in (Proton1) Nuclear Magnetic Resonance. Fig. 4 shows the result
of (Proton1) NMR for PTCC 1318 in the range between 0-3 ppm; the peaks at 0.73353 , 0.83890 ppm represent the presence of CH3 group and
Fig.7: 1HNMR for PAY-4 in range between 4-6 ppm.
ppm
____
_5.1
8746
5.30
109
ppm
Pay-4
6.2 6.0 5.8 5.6 5.4 5.2 5.0 4.8
inte
gral
Fig.7: 1HNMR for PAY-4 in range between 4-6 ppm.
ppm
____
_5.1
8746
5.30
109
ppm
Pay-4
6.2 6.0 5.8 5.6 5.4 5.2 5.0 4.8
inte
gral
Fig.7: 1HNMR for PAY-4 in range between 4-6 ppm.
ppm
____
_5.1
8746
5.30
109
ppm
Pay-4
6.2 6.0 5.8 5.6 5.4 5.2 5.0 4.8
inte
gral
Fig.8: 1HNMR for Il-1 in range between 0-3 ppm.
ppm
____
_2.2
7186
____
_2.1
0993
1.98
554
1.89
520
____
_1.4
3553
____
_1.2
1899
226
093
____
_1.1
4202
0.84
062
0.51
839
0.75
014
inte
gral
ppm 2.0 1.5 1.0 0.5
Fig.8: 1HNMR for Il-1 in range between 0-3 ppm.
ppm
____
_2.2
7186
____
_2.1
0993
1.98
554
1.89
520
____
_1.4
3553
____
_1.2
1899
226
093
____
_1.1
4202
0.84
062
0.51
839
0.75
014
inte
gral
ppm 2.0 1.5 1.0 0.5
Fig.8: 1HNMR for Il-1 in range between 0-3 ppm.
ppm
____
_2.2
7186
____
_2.1
0993
1.98
554
1.89
520
____
_1.4
3553
____
_1.2
1899
226
093
____
_1.1
4202
0.84
062
0.51
839
0.75
014
inte
gral
ppm 2.0 1.5 1.0 0.5
Fig.8: 1HNMR for Il-1 in range between 0-3 ppm.
ppm
____
_2.2
7186
____
_2.1
0993
1.98
554
1.89
520
____
_1.4
3553
____
_1.2
1899
226
093
____
_1.1
4202
0.84
062
0.51
839
0.75
014
inte
gral
ppm 2.0 1.5 1.0 0.5
Fig.8: 1HNMR for Il-1 in range between 0-3 ppm.
ppm
____
_2.2
7186
____
_2.1
0993
1.98
554
1.89
520
____
_1.4
3553
____
_1.2
1899
226
093
____
_1.1
4202
0.84
062
0.51
839
0.75
014
inte
gral
ppm 2.0 1.5 1.0 0.5Fig.8: 1HNMR for Il-1 in range between 0-3 ppm.
ppm
____
_2.2
7186
____
_2.1
0993
1.98
554
1.89
520
____
_1.4
3553
____
_1.2
1899
226
093
____
_1.1
4202
0.84
062
0.51
839
0.75
014
inte
gral
ppm 2.0 1.5 1.0 0.5
Fig.8: 1HNMR for Il-1 in range between 0-3 ppm.
ppm
____
_2.2
7186
____
_2.1
0993
1.98
554
1.89
520
____
_1.4
3553
____
_1.2
1899
226
093
____
_1.1
4202
0.84
062
0.51
839
0.75
014
inte
gral
ppm 2.0 1.5 1.0 0.5
Fig.8: 1HNMR for Il-1 in range between 0-3 ppm.
ppm
____
_2.2
7186
____
_2.1
0993
1.98
554
1.89
520
____
_1.4
3553
____
_1.2
1899
226
093
____
_1.1
4202
0.84
062
0.51
839
0.75
014
inte
gral
ppm 2.0 1.5 1.0 0.5
Fig.8: 1HNMR for Il-1 in range between 0-3 ppm.
ppm
____
_2.2
7186
____
_2.1
0993
1.98
554
1.89
520
____
_1.4
3553
____
_1.2
1899
226
093
____
_1.1
4202
0.84
062
0.51
839
0.75
014
inte
gral
ppm 2.0 1.5 1.0 0.5

Dow
nloa
ded
from
http
://jo
urna
ls.tu
ms.
ac.ir
/ on
Mon
day,
Mar
ch 1
2, 2
012
Iran. J. Environ. Health. Sci. Eng., 2010, Vol. 7, No. 3, pp. 209-222
217
ppm
5.30
162
5.16
974
____
_4.1
2990
3.95
650
3.00
493
inte
gral
ppm 4.5 4.05.0
Fig.9:1HNMR for IL-1 in range between 4-6 ppm
ppm
5.30
162
5.16
974
____
_4.1
2990
3.95
650
3.00
493
inte
gral
ppm 4.5 4.05.0
Fig.9:1HNMR for IL-1 in range between 4-6 ppm
ppm
5.30
162
5.16
974
____
_4.1
2990
3.95
650
3.00
493
inte
gral
ppm 4.5 4.05.0
Fig.9:1HNMR for IL-1 in range between 4-6 ppm
ppm
5.30
162
5.16
974
____
_4.1
2990
3.95
650
3.00
493
inte
gral
ppm 4.5 4.05.0
Fig.9:1HNMR for IL-1 in range between 4-6 ppm
ppm
5.30
162
5.16
974
____
_4.1
2990
3.95
650
3.00
493
inte
gral
ppm 4.5 4.05.0
Fig.9:1HNMR for IL-1 in range between 4-6 ppm
ppm
5.30
162
5.16
974
____
_4.1
2990
3.95
650
3.00
493
inte
gral
ppm 4.5 4.05.0
Fig.9:1HNMR for IL-1 in range between 4-6 ppm
Fig. 9: (Proton1) Nuclear Magnetic Resonance for IL-1 in range between 4-6 ppm
FTIR for RAG 1 in Soya
Figure 10 : FTIR for RAG-1 in soyaWave numbers (1/cm)
3412
.13
2918
.73
1656
.65
1373
.24
1064
.28 53
0.92
Fig. 10: FTIR for RAG-1 in soya
1.13930, 1.41819 and 1.22116 ppm represent CH2 group. The peaks on 1.98802 ppm represent the presence of Cyclic Carbonyl Compound group; the peaks on 2.26093 ppm represents CH group.Fig. 5 shows the result of 1H NMR for PTCC 1318 in range between 4-6 ppm, in which peaks on 4.65281 ppm represent CH2OCO, 5.30381
ppm represent NH groups and peaks on 5.16533 ppm represent OH group. Fig. 6 shows the result of 1H NMR for Paydar-4 in range between 0-3 ppm, in which peaks on 0.75716 ppm represent CH3 group, peaks on 1.45938, 1.89897 and 2.11395 ppm represent CH groups and peaks on 1.11627, 1.17146 and
Dow
nloa
ded
from
http
://jo
urna
ls.tu
ms.
ac.ir
/ on
Mon
day,
Mar
ch 1
2, 2
012
P. Chamanrokh, et al., ClEANINg oIl-CoNTAmINATEd VESSEl ...
218
100
98
96
94
92
90
88
86
84
823500 3000 2500 2000 1500 1000 500
Wave numbers (1/cm)
3262
.67
1655
.81
1076
.33
863.
26
531.
69
977.
81
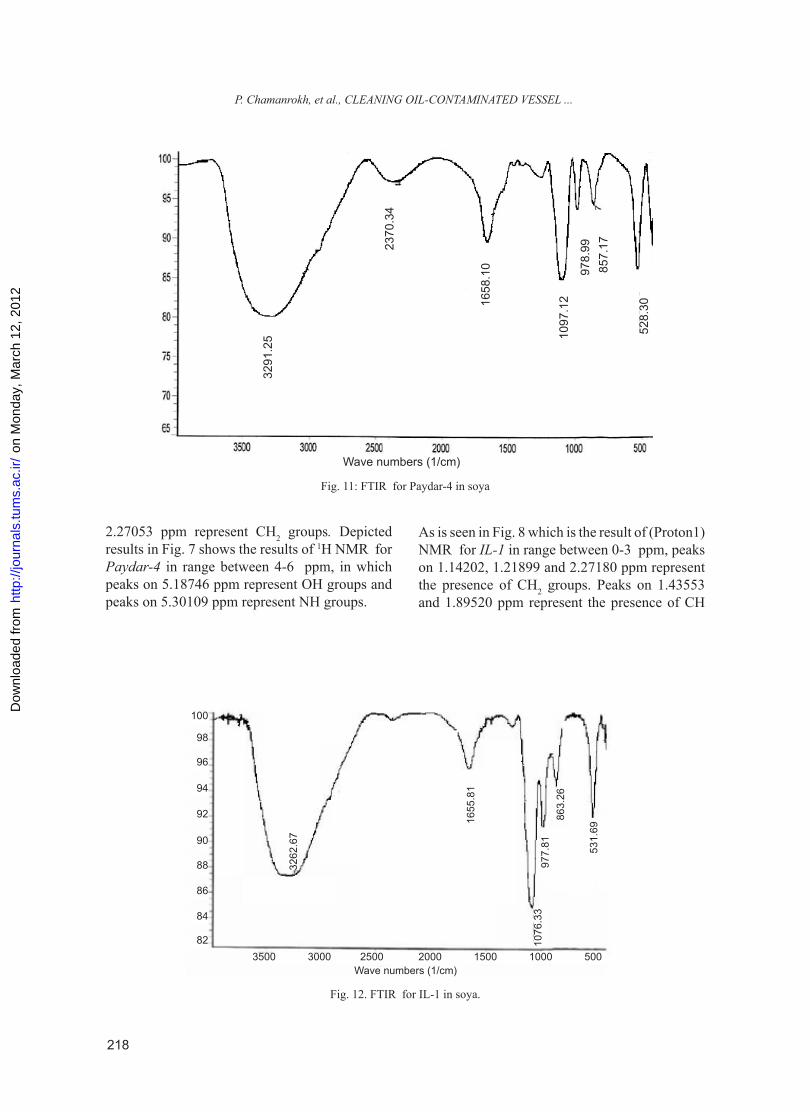
Fig. 12. FTIR for IL-1 in soya.
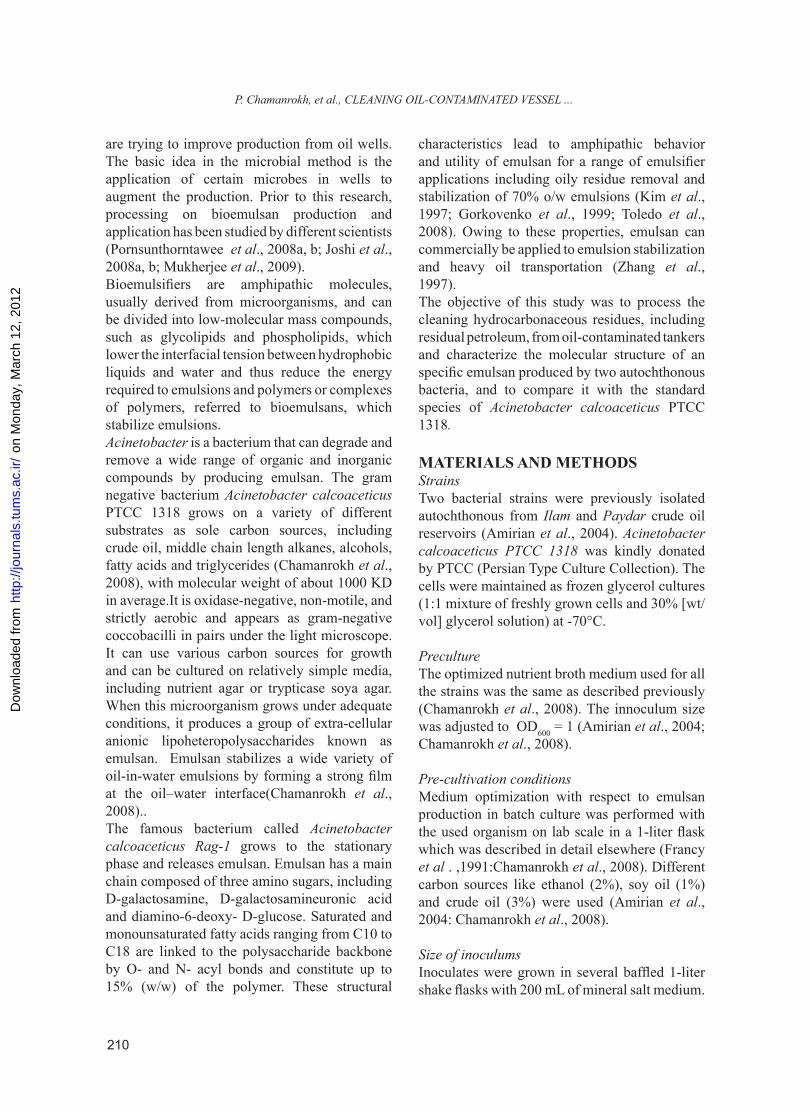
2.27053 ppm represent CH2 groups. Depicted results in Fig. 7 shows the results of 1H NMR for Paydar-4 in range between 4-6 ppm, in which peaks on 5.18746 ppm represent OH groups and peaks on 5.30109 ppm represent NH groups.
As is seen in Fig. 8 which is the result of (Proton1) NMR for Il-1 in range between 0-3 ppm, peaks on 1.14202, 1.21899 and 2.27180 ppm represent the presence of CH2 groups. Peaks on 1.43553 and 1.89520 ppm represent the presence of CH
Fig.11: FTIR for PAY-4 in Soya
3291
.25
2370
.34
1658
.10
1097
.12
978.
9985
7.17
528.
30
Wavenumbers(cm-1)Wave numbers (1/cm)
3291
.25
2370
.34
1658
.10
1097
.12
978.
9985
7.17
528.
30
Fig. 11: FTIR for Paydar-4 in soya

Dow
nloa
ded
from
http
://jo
urna
ls.tu
ms.
ac.ir
/ on
Mon
day,
Mar
ch 1
2, 2
012
Iran. J. Environ. Health. Sci. Eng., 2010, Vol. 7, No. 3, pp. 209-222
219
Fig.13: Structure of emulsan produced by RAg-1, PAY-4, and IlAm-1 in
which fatty acids are linked to a heteropolysacharide backbone
Fig. 13: Structure of emulsan produced by PTCC 1318, Paydar-4, and Il-1 in which fatty acids are linked to a heteropolysacharide backbone
groups. Peak on 2.10993 ppm represents the presence of CH/OH group. As it is indicated in Fig. 9 (the result of (Proton1) NMR for Il-1 in range between 4-6 ppm), peak on 5.30162 represents the NH group, peaks at 5.16974 and 4.1290 ppm represent the presence of OH group and peaks on 3.95650 and 3.60483 ppm represent the presence of CH2 groups. Depicted results in Fig.10 shows the results of FT-IR for PTCC 1318 in soy oil in which peaks on 2918.73 ppm represent aliphatic stretching, 1373.24 ppm represent aliphatic bending, peak on 1656.65 ppm represent C=O, peak on 3412.13 ppm represents OH/NH group and peak on 1064.28 represent C-O groups. The results presented in Fig.11 shows the results of FT-IR for Paydar-4 in soy oil in which peaks on 3291.25 ppm represent OH/NH groups and Peak on 1658.10 ppm represents C=O groups and peak on 1097.12 represent C-O group. As it is seen in Fig. 12, for the results of FTIR for Il-1 in soy, peaks on 3262.67 ppm represent OH/NH group and on 1655.81 represents C=O bonds in emulsn structure. Fig. 13 shows the structure
of emulsan produced by PTCC 1318, Paydar-4, and Il-1 in which fatty acids are linked to a heteropolysacharide backbone. This is the result of (Carbon13) Nuclear Magnetic Resonance, (Proton1) Nuclear Magnetic Resonance and FT- IR essays.
Cleaning oil-contaminated vesselsAqueous solutions having emulsan are excellent emulsifying agents for cleaning and recovering hydrocarbonaceous residues. Washing the oil-contaminated surfaces of such vessels with an aqueous solution containing from about 10 mg/mL to about 20 mg/mL of emulsan, readily forms an oil-in-water emulsion of such hydrocarbonaceous residues provided that the solution contains from about 1 to about 100 mM, and preferably from about 5 mM or higher. Moreover, the emulsan needs not to be purified, since a cell-free fermentation broth containing emulsans resulting from growing Acinetobacter calcoaceticus on a suitable medium can be used directly or after adequate dilution.The same processes of experiments can be

Dow
nloa
ded
from
http
://jo
urna
ls.tu
ms.
ac.ir
/ on
Mon
day,
Mar
ch 1
2, 2
012
P. Chamanrokh, et al., ClEANINg oIl-CoNTAmINATEd VESSEl ...
220
designed to clean any oil-contaminated vessel and to recover the hydrocarbonaceous residue from the resultant oil-in-water emulsion, either by breaking the emulsion physically or chemically. Depending upon the amount and composition of the oil or hydrocarbonaceous residue to be cleaned, the aggregate amount of alpha-emulsan may be as low as 1 part by weight (dry weight basis) per 1000 to 10000 parts by weight of hydrocarbon, the higher concentrations of emulsan yielding more stable emulsions . Our finding is compatible with that of Gutnick et al., 1989 (U.S. Patent 4883757). The results of this study showed that emulsan produced by different microorganisms such as Acinetobacter calcoaceticus PTCC 1318 can be a good candidate to remove the oil remains in oil vessels or may be oil tankers.In our laboratory investigation, approximately 98% of the used crude oil was recovered. Such a clean-up process is therefore can be economically rewarding and less hazardous as compared to conventional processes . Our finding is in agreement with Banat et al., 1995. Also the results using (Proton1) NMR (Carbon13) showed that the molecular structure of all three strains were similar to eachother as described in the text (Fig.13).
DISCUSSIONIn this study the best conditions for emulsan production were obtained similar to studies conducted by (Nemati, 2003). During logarithmic phase, cells accumulated capsular material on the cell surface and then released this polymeric material in the form of an active emulsifier in stationary phase. Also, during the period of unbalanced growth, similar results were obtained by Rubinovitz et al., 1982 and Amirian et al., 2004.Bioemulsifier production by microorganisms is generally associated with cell growth on different carbon sources needed for maximum bacterial growth. In this work three different carbon sources (ethanol, crude oil and soy oil) were examined in a minimal salt medium for their ability to support cell growth and production of bioemulsan. Among these carbon sources, soy oil yielded the best cell growth. Other low molecular weight
carbon sources might also be employed, but their efficiency would have to be established on a strain-by-strain basis. The dry weights of each bacterial strain using different carbon and energy sources were similar to previous studies (Amirian et al. , 2004). Another study conducted by Gutnick et al, showed that fermentations of Acinetobacter calcoaceticus could be run on ethanol or on other carbon sources as described previously. Findings of difference or interaction of water in oil emulsion using crude oil as culture medium is in comparision with cell free medium, suggest that the emulsifier’s activity depends on its affinity to hydrocarbon substrates which involves a direct interaction with the hydrocarbon itself rather than an effect on the surface tension of the medium. This is similar to the findings of (Amirian et al., 2004).The surface tension results showed a good reduction with all the three tested carbon sources. Similar results where significant for CMD-1, CMD-2.. This reduction of surface tension measurements indicated the production of surface-active compounds by the microbial culture, which has been shown to aid the metabolism of the substrate and stimulate microbial growth. Our result is comparable with the results obtained by Abu–Ruwaida et al., 1991.Bioemulsan biosynthesis occurred predominately during the exponential growth phase, suggesting that the bioemulsan is produced as a primary metabolite accompanying cellular biomass formation. Similar observations have been made for other biosurfactant-producing microorganisms (Abu–Ruwaida et al., 1991). The surface tension results of crude oil, soy oil and ethanol as the source of carbon, indicated that although isolated bacteria were wild type, but it is comparable with genetically modified PTCC 1318. Similar results where significant for CMD-1, CMD-2..Also the result shows bacterium PTCC 1318 has almost the same ability to reduce surface tension compared with two other isolates. The NMR spectra of the native polysaccharide was complex due to partial acylation and the high molecular weight. These data are in agreement with Pyroh et al., 2001.Carbon nuclear magnetic resonance spectra were recorded at 300 MHz. The components of this particular molecule which identified as emulsan,

Dow
nloa
ded
from
http
://jo
urna
ls.tu
ms.
ac.ir
/ on
Mon
day,
Mar
ch 1
2, 2
012
Iran. J. Environ. Health. Sci. Eng., 2010, Vol. 7, No. 3, pp. 209-222
221
is comparable with Pyroh et al., 2001.Furthermore this particular bioemulsan is excellent emulsifying agents for cleaning and recovering hydrocarbonaceous residues. This is in agreement with Gutnick et al.,1989, when Acinetobacter calcoaceticus Rag1 was used for crude oil clean up including residual crude oil, from oil-contaminated tankers, barges, storage tanks, tank cars and trucks, pipelines and other containers used to transport or store crude oil or petroleum fractions. Washing the oil-contaminated surfaces of such vessels with an aqueous solution may be used directly or after adequate dilution. The results of this study showed that emulsan produced by different authochthonous microorganisms such as Acinetobacter calcoaceticus can be a good candidate to remove the oil remains in oil vessels or oil tanks.
ACKNOWLEDGEMENTSThe authors sincerely acknowledge the help of Behruz Mirza and Nasir Iravani through this project.
REFERENCESAbu–Ruwaida, A.S., Banat, I.M., Haditirto, S., salem, A.,
Kadri, A., (1991). Isolation of biosurfactant–producing bacteria product characterization, and evaluation. Acta Biotechnologicla. 4: 315-324.
Adria, A., Bodour, K., Drees, P., Raina, M.M., (2003). Distribution of biosurfactant-producing bacteria in undisturbed and contaminated Arid South Western soils. Appl. Environ. Microbiol. 69(6): 3280-3287.
Akhavan Sepahi, A., Dejban Golpasha, I., Emami, M., Nakhoda, A. M.,( 2008). Isolation and characterization of crude oil degrading Bacillus spp. Iran. J. Environ. Health. Sci. Eng. 5( 3): 149-154.
Amirian, A., Mazaheri Assadi, M., Saggadian, V.A., Noohi, A., (2004). Bioemulsan Production by Iranian Oil Reservoirs Microorganisms. Iran. J. Environ. Health Sci. Eng. 1(2): 28-35.
Banat, I. M.,(1995). Production and possible uses in microbial enhanced recovery and oil pollution remediation Bioresource technology. 51:1-12
Calvo, C., Toledo, F.L., González-López, J., (2004). Surfactant activity of a naphthalene degrading Bacillus pumilus strain isolated from oil sludge. J. Biotechnol., 109(3): 255-262.
Chamanrokh. P., Mazaheri Assadi, M., Noohi, A., Yahyai, S., (2008). Emulsan analysis produced by locally isolated bacteria and Acinetobacter calcoaceticus . Iran. J. Environ. Health Sci. Eng. 5(2): 101-108.
Cleaning oil-contaminated vessels with .alpha.-emulsans, Document Type and Number United States Patent 4276094
Cooper, D.G., Goldenberg, B.G., (1987). Surfaceactive agents from two Bacillus species. Appl. Environ. Microbiol., 53: 224-229.
Francy, D.S., Thomas, M., Raymond, R.L., Ward, C.H., (1991). Emulsification of hydrocarbons by subsurface bacteria. J. Ind. Microbiol. 8: 236-246.
Gorkovenko, A., Zhang, J., Gross, A., Kaplan, D., (1999). Control of unsaturated fatty acid in emulsan. Carbohydr. Polym. 39: 79-84.
Gutnick, D.L., Nestaas, Rosenberg, E., Sar, E., Nechemia ., (1989) Bioemulsifier production by Acinetobacter calcoaceticus strains. United States Patent 4883757.
Joshi, S., Bharucha, C., Desai, A.J., (2008, a). Production of biosurfactant and antifungal compound by fermented food isolate Bacillussubtilis20B. Bioresour. Technol., 99(11): 4603-4608.
Joshi, S., Bharucha, C., Jha, S., Yadav, S., Nerurkar, A., Desai, A.J., (2008, b). Biosurfactant production using molasses and whey under thermophilic conditions. Bioresour. Technol., 99(1): 195-199.
Kim, P., Oh, D-K., Kim, S-Y., Kim, J-H., (1997). Relationship between emulsifying activity and carbohydrate backbone structure of emulsan from Acinetobacter calcoaceticus Biotechnol. Lett. 19(5): 457-459.
Mukherjee, S., Palashpriya, Das., Ramkrishna, Sen., (2009). Rapid quantification of a microbial surfactant by a simple turbidometric method.Journal of Microbiological Methods 76: 38–42.
Nemati, F., Mazaheri Assadi, M., (2003). Improving emulsan production by Acinetobacter calcoaceticus. A report submitted to Biotechnology Center of IROST.
Pavia, Lampman,Cruis,introduction to spectroscopy,(1996).pp. 107.
Pornsunthorntawee, O., Wongpanit, P., Chavadej, S., Abe, M., Rujiravanit, R., (2008, b). Structural and physicochemical characterization of crude biosurfactant produced by Pseudomonas aeruginosa SP4 isolated from petroleum-contaminated soil. Bioresour. Technol., 99(6): 1589-1595.
Pornsunthorntawee,O., Arttaweeporn, N., Paisanjit, S., Somboonthanate, P., Abe, M., Rujiravanit, R., Chavadej, S., (2008, a). Isolation and comparison of biosurfactants produced by Bacillus subtilis PT2 and Pseudomonas aeruginosa SP4 for microbial surfactant-enhanced oil recovery. Biochem. Eng. J., 42(2): 172-179.
Pyroh, T.P., Senchenkova, S.M., Hrinberh ,T.A., Malashenko, IuR.,(2001). Structure of an acylated exopolysaccharide synthesized by Acinetobacter sp., Ukr Biokhim Zh, 2001 May-Jun, 73(3): 71 – 9.
Rosenberg, E.A., Rosenberg, C., Legman, R., Ron, E.Z., (1988). Purification and chemical properties of Acinetobacter calcoaceticus A2 biodispersan, Appl. Environ. Microbiol. 54(2): 323-326.
Rosenberg, E., Zuckerberg, A., Rubinovitz, C., Gutnick, D.L., (1979). Emulsifier of Arthrobacter sp.: Isolation and emulsifying properties. Appl. Environ. Microbiol. 37(3): 402-408.
Rubinovitz, C., Gutnick, D., Rosenberge, E., (1982). Emulsan Production by Acinetobacter calcoaceticus in the presence of Chloramphenicaol. J. Bacteriol. 152(1): 126-
Dow
nloa
ded
from
http
://jo
urna
ls.tu
ms.
ac.ir
/ on
Mon
day,
Mar
ch 1
2, 2
012
P. Chamanrokh, et al., ClEANINg oIl-CoNTAmINATEd VESSEl ...
222
132.Tabatabaee, A., Mazaheri Assadi, M., Noohi, A. A., Sajadian,
V A., ( 2005). Isolation of Biosurfactant Producing Bacteria from Oil Reservoirs. Iran. J. Environ. Health Sci. Eng.2 (1): 6-12.Toledo, F.L., González-López, J., Calvo, C., (2008). Production of bioemulsifier by Bacillus subtilis, Alcaligenes faecalis and Enterobacter species in liquid culture Bioresour. Technol., 99(17): 8470-8475.
Zhang, J., Gorokovenko, A., Gross, R.A., Allen, A.L., Kaplan, D., (1997). Incorporation of 2-hydroxyl fatty acid by Acinetobacter calcoaceticus to tailor emulsan structure. Int. J. Biol. Macromol. 20: 9-21.