clean development mechanism project design document … · the gcv for pith is chiefly dependent on...
TRANSCRIPT

PROJECT DESIGN DOCUMENT FORM (CDM PDD) - Version 02 CDM – Executive Board page 1
CLEAN DEVELOPMENT MECHANISM PROJECT DESIGN DOCUMENT FORM (CDM-PDD)
Version 02 - in effect as of: 1 July 2004)
CONTENTS A. General description of project activity B. Application of a baseline methodology C. Duration of the project activity / Crediting period D. Application of a monitoring methodology and plan E. Estimation of GHG emissions by sources F. Environmental impacts G. Stakeholders’ comments
Annexes Annex 1: Contact information on participants in the project activity Annex 2: Information regarding public funding Annex 3: Baseline information
Annex 4: Monitoring plan Annex 5: Emission Reductions
PROJECT DESIGN DOCUMENT FORM (CDM PDD) - Version 02 CDM – Executive Board page 2 SECTION A. General description of project activity A.1 Title of the project activity: >> Biomass based Cogeneration Power Project in Uttar Pradesh Version 01 Dated: 28/03/2006 A.2. Description of the project activity: >> Yash Papers Ltd. (YPL) is undertaking an expansion of its production capacity of paper from 16,000 TPA to 39,100 TPA. The power requirement for the paper plant shall be increased from present installed capacity of 2.5 MW to 8.5 MW (increment of 6 MW). The purpose of the expansion cogeneration project is to utilize the biomass Rice Husk (available in the region), Bagasse Pith and Strong Black Liquor (from the process plant) for effective generation of electricity for in-house consumption. The project is the part of cogeneration activity involving generation of electricity and steam for captive consumption. The steam requirement for the power generation and process are met by two sources; a typical eco-friendly biomass based boiler and the other being the chemical recovery boiler. The project also proposes to use Strong Black Liquor, an industrial biomass residue, to generate steam in the Soda Recovery Boiler (SRB). This black liquor is a by-product generated during cooking of agro pulp in the digesters. It is first concentrated in the evaporator to get the desired level of solid content and then fired at the SRB for chemical recovery and steam generation (used for both electricity generation and process requirement). The total steam requirement for cogeneration unit is 50 TPH of which 15 TPH will be generated in the Chemical Recovery Boiler and the remaining through biomass-fueled boiler. The project activity will indirectly help in reducing the power deficit in the region and conserve natural resources like coal. Biomass power would be one of the most important elements in the overall project plan due to following inherent advantages:
• Abundant availability of biomass throughout the region, which presently has limited commercial use
• Ease of integration with the local economy • In house consumption of steam for power production with the available waste biomass.
YPL has also planned for agro-plantation to meet the raw material requirement for the paper mill on a continual basis. This captive power plant along with the agro-plantation meets the general and special requirements of the Clean Development Mechanism of Kyoto Protocol. Availability of biomass It is envisaged to set up boilers operating on biomass – primarily Rice Husk and Biomass Pith. Rice Husk shall be procured from market where as the Bagasse Pith shall be the reject from the paper manufacturing process. A separate chemical recovery boiler shall also be installed to burn strong black liquor. The area around Faizabad has abundant Rice Husk, as paddy is one of the chief cultivated crops. There are many rice mills operating in the vicinity. Rice Husk is available in plenty and more importantly, does

PROJECT DESIGN DOCUMENT FORM (CDM PDD) - Version 02 CDM – Executive Board page 3 not have any use other than burning. Owing to backwardness of region, there are not many buyers for the same resulting in easy availability within a 50 km radius. Project’s contribution to sustainable development The project contributes to the sustainable development of the region in the following ways: Environmental and Technological well being The project activity is a change from a fossil fuel usage to biomass that will lead to the reduction of GHG emissions thus contributing to the ultimate objective of the convention. The project will utilize the biomass available in the region and biomass generated within the factory that was either left unused or burnt openly. The following are the local and global environmental benefits from the project:
• Eliminating the generation of equivalent quantum of electricity using conventional fuel that is feeding the state grid by substituting the electricity requirement from grid by cogeneration scheme
• Conserving the coal and other non-renewable natural resource • Mitigating the emission of GHG (CO2) by utilizing the carbon neutral fuels (Biomass, bagasse
pith & rice husk). • Prevention of the accumulation of biomass (pith and rice husk) that is abundantly available in the
region causing environmental hazards. • Adopting an advanced and sustainable technology for long-term benefits.
Socio-Economic well-being • Contributing to a small increase in the local employment by employing skilled and un-skilled
personnel for operation and maintenance of the equipment. The present manpower of YPL is over 166 with 108 skilled, 25 semiskilled and 33 unskilled employees. The project activity results in alleviation of poverty by generating direct and indirect employment during the project operation.
• Saving the power at grid and allowing it to be diverted to other needy sections of the economy. • Helping to bridge the gap of electricity demand and supply at local level.
The cogeneration plant is located at Darshan Nagar, Dist. Faizabad (Eastern Uttar Pradesh), which is about 140 km away from the state capital, Lucknow. To facilitate access to this site from other places, better infrastructure is needed. Therefore setting up of the project is going to benefit the area by improving the infrastructure and would have positive effect on landscaping. A.3. Project participants: >> Name of Party involved (*) ((host) indicates a host Party)
Private and/or public entity(ies) project participants (*)
(as applicable)
Kindly indicate if the Party involved
wishes to be considered as
project participant (Yes/No)
Ministry of Environment and Forest, Government of India
Yash Papers Limited (Private entity, project participant)
No
YPL will be the sole owner of the CERs generated and the detailed contact address is given in Annex 1.

PROJECT DESIGN DOCUMENT FORM (CDM PDD) - Version 02 CDM – Executive Board page 4 A.4. Technical description of the project activity: A.4.1. Location of the project activity: >> A.4.1.1. Host Party(ies): >> India A.4.1.2. Region/State/Province etc.: >> Faizabad District, Uttar Pradesh State A.4.1.3. City/Town/Community etc: >> Darshan Nagar A.4.1.4. Detail of physical location, including information allowing the unique identification of this project activity (maximum one page): >> The company’s plant is located at Darshan Nagar, Dist. Faizabad (Eastern Uttar Pradesh), which is a notified B Category backward area. It is about 140 k.m. from Lucknow, 200 k.m. from Varanasi, 160 k.m. from Allahabad, 140 k.m. from Gorakhpur and about 636 k.m. from Delhi. Buses are frequently available from Lucknow, Delhi and Gorakhpur. Trains are available from Delhi, Lucknow, Varanasi and Allahabad. Faizabad has an Airport at Naka, near Dr. Ram Manohar Lohia University. Nearest airport is Lucknow (about 140 k.m.). Location map of the project (Latitude: 26.47N, Longitude: 82.12 E) is given below:
Location of Uttar Pradesh State and project site in Faizabad District in Uttar Pradesh State
A.4.2. Category(ies) of project activity: >>

PROJECT DESIGN DOCUMENT FORM (CDM PDD) - Version 02 CDM – Executive Board page 5 The present project activity will fall under the sectoral scope 1: Energy Industries (renewable / non-renewable sources) A.4.3. Technology to be employed by the project activity: >> The proposed plant comprises of an agro-based fuel fired boiler and one chemical recovery boiler. The chemical recovery boiler shall produce steam, which shall be routed to the turbine through a common steam header along with input of steam from agro-based fired boiler. The agro-based boiler shall have a capacity of 35 TPH (Rice Husk and Pith, where the pith is a reject of pre-paper production) and the SRB shall be 15 TPH. One double extraction condensing steam turbo generator set of 6.0 MW capacity has been considered. The boiler would generate steam at 65kg/cm2 (g) pressure and 465ºC temperature. The power generation would be at 11 kV. There shall be a step down transformer near the load end; this shall convert the power to 415 V. Pressure and temperature configuration has been proposed as 65 kg/cm2 and 465ºC respectively for boiler and double extraction condensing steam turbine. This gives the best system efficiency with respect to steam utilization and the expertise of operation. The specific steam consumption for power generation and other thermodynamic parameters have been worked out and the best option has been selected as per the following table: Table: Steam Requirement for 6MW Turbine
S.No.
Particulars
Steam Requirement (MT/hr)
1 Extraction Steam to Process (at 12 ata, 180ºC) 12 2 Extraction Steam to Process (at 5 ata, 180ºC) 32 3 Steam going to condenser (at 0.1 ata) 6 4 Net steam going to turbine inlet (at 65 kg/cm2 , 465ºC ) 50
The specific fuel consumption for power generation would depend upon:
• Calorific Value of fuel • Boiler thermal efficiency • Extent of steam extraction and • Thermodynamic efficiency of the steam power cycle.
The Gross Calorific Value (GCV) value determined on ‘as received basis’ would be governed by the following factors:
• Inherent chemical composition and ultimate analyses (typical range is as given in the table below) • Total moisture content at purchase point • Storage degradation.
Table Ultimate analysis-% mass Rice Husk Pith
Ash 17.4 1.5 Carbon 39.6 22.25
Hydrogen 4.4 3.25 Nitrogen 2.2 1 Sulphur 0.1 0 Oxygen 32.7 22

PROJECT DESIGN DOCUMENT FORM (CDM PDD) - Version 02 CDM – Executive Board page 6
Moisture 3.6 50 The GCV value for husk ‘on received basis’ has been reportedly varying from 3100 to 3400 kcal/kg. Large variation takes place primarily because of external impurities like additional surface moisture, carry over of soil and dirt. The quality monitoring system has to be very simple and transparent. Based on the experience of the promoters in biomass procurement, the average value for the landed fuel should be considered at 3200 kcal/kg.
The GCV for pith is chiefly dependent on the moisture level. The moisture level varies from 40 % to 60 % depending upon the freshness of pith and the de-pithing process of Biomass. Average moisture has been taken as 50 % and the GCV as 2000 kcal/kg.
Boiler efficiency for biomass fuel is primarily governed by excess air requirement and air-preheat conditions. The excess air ratio for husk would be maintained at around 1.3. At this level thermal efficiency of the boiler would be 82±2%. Owing to excessive moisture in the pith the wet flue gas losses are very high. The average efficiency of a pith boiler shall be 68 ± 2%.
For calculating the fuel requirement on various operating conditions the efficiency has been considered as 80% for the husk fired boiler and 68 % for the pith-fired boiler. The plant is detailed with all other auxiliary plant systems like: 1. Water system: Water would be required for the following applications:
• Cooling tower make up • Feed water make up • Filters back wash and Reverse Osmosis plant regeneration. • Shortfall in the condensate recovery • Miscellaneous requirements including that for quenching ash
2. Ash handling system: Ash hoppers would be provided at the following points:
• Furnace • Convection bank • Economiser • Electro static precipitator/Dust collection unit for pollution control Boiler blow down water would be stored after flash steam recovery and would be used as ash
quenching water.
3. Compressed air system 4. Fire fighting system A.4.4. Brief explanation of how the anthropogenic emissions of anthropogenic greenhouse gas (GHGs) by sources are to be reduced by the proposed CDM project activity, including why the emission reductions would not occur in the absence of the proposed project activity, taking into account national and/or sectoral policies and circumstances: >>

PROJECT DESIGN DOCUMENT FORM (CDM PDD) - Version 02 CDM – Executive Board page 7 The proposed project will reduce anthropogenic GHG emissions by displacing fossil fuel based electricity generation with environmentally sustainable resources (Rice Husk, Biomass Pith and Strong Black Liquor), which are renewable biomass. Since the biomass contains only negligible quantities of other elements like Nitrogen, Sulphur etc., the release of other GHGs are considered as negligible. Prior to the project implementation, the total requirement of steam and power for process of YPL unit was met by a 2.5 MW cogeneration power plant. However, YPL is expanding its paper production and to meet the additional power requirement for the same, it is proposed to expand the cogeneration power plant to 8.5 MW along with the Chemical recovery boiler. Furthermore, with the increase in availability of steam and power from biomass expansion cogeneration plant and from Strong Black Liquor in SRB unit, there has been a corresponding increase in electricity generation at the in-house power plant. This has resulted in a proportionate decrease in electricity generation by coal fired system and grid imports. In the absence of the project activity, the energy load corresponding to the power requirement of the paper plant would have been borne by the state grid, which primarily comprises of thermal power plants resulting in CO2 emissions in to the atmosphere. The CO2 emission reductions from the project are thus estimated at 84,904 tonnes per annum. A.4.4.1. Estimated amount of emission reductions over the chosen crediting period: >> The total emissions’ reductions over the renewable crediting period (7 years) from the project are expected to be as follows:
Years Annual estimation of emission reductions in tonnes of CO2 e
2007 84,904 2008 84,904 2009 84,904 2010 84,904 2011 84,904 2012 84,904 2013 84,904
Total estimated reductions 5,94,328 Total number of crediting years 21y-0m Annual average over the crediting period of estimated reductions (tones of CO2 e)
84,904
A.4.5. Public funding of the project activity: >> No funding from Annex 1 based institutions has been availed.

PROJECT DESIGN DOCUMENT FORM (CDM PDD) - Version 02 CDM – Executive Board page 8 SECTION B. Application of a baseline methodology B.1. Title and reference of the approved baseline methodology applied to the project activity: >> The recently approved consolidated baseline methodology ACM0006 /Version 03 dated: 19th May 2006, “Consolidated baseline methodology for grid-connected electricity generation from biomass residues” would be an appropriate methodology for the present project. Therefore the project developer decided to follow the guidelines of ACM0006 since the methodology is applicable to biomass fired electricity generation project activities, including cogeneration plants. B.1.1. Justification of the choice of the methodology and why it is applicable to the project activity: >> The proposed baseline methodology is flexible and general enough to be applicable to any biomass-based and biomass residue based co- generation plant. The proposed biomass (Rice Husk, strong black liquor & Biomass pith) cogeneration project activity is from renewable sources and avoids methane emissions from uncontrolled biomass burning and / or anaerobic decomposition. The proposed cogeneration project complies with the applicability criteria: power capacity expansion projects, “The proposed project activity includes the installation of a new biomass power generation unit, which is operated next to existing power generation capacity fired with either fossil fuels or the same type of biomass residue as in the project plant”. Further requirements that also need to be fulfilled by the proposed project activity: No other biomass types other than biomass residues are used in the project plant and these biomass residues are the predominant fuel used in the project plant: The proposed project will use biomass (Rice Husk) and biomass residue (Biomass Pith and the strong black liquor) from the Yash Paper Mill. In the existing cogeneration plant, the co-firing of fossil fuel is partly done to meet the heat requirement, but for the proposed project activity the project promoters are not using the fossil fuels for co-firing since there is an excess amount of biomass residue from the mill and Rice Husk availability around the region. The implementation of the project shall not result in an increase of the processing capacity of raw input: The proposed project will neither result in substantial process changes in the production nor the production capacity of the paper unit. The proposed project is implemented in order to meet the power and heat requirements of the paper unit. The biomass used by the project facility should not be stored for more than one year: The biomass (Rice husk) procurement is scheduled with a buffer stock for 45 days operation only. The storage facility provided in the plant is also constructed to hold the biomass for that duration. There is no storage of other biomass residues in the facility, since bagasse pith and black liquor are by-products of the Kraft cycle. No significant energy quantities, except for transportation of the biomass, are required to prepare the biomass residues for fuel combustion: No the proposed project activity does not process any of the biomass residues prior to its combustion in the proposed plant.

PROJECT DESIGN DOCUMENT FORM (CDM PDD) - Version 02 CDM – Executive Board page 9 It is further noted that the project is well in compliance with the applicability criteria of the methodology and justifiable to the project activity. B.2. Description of how the methodology is applied in the context of the project activity: >> The project activity comes under the Scenario 16 – Power Capacity Expansion Projects, of the methodology i.e. “Combinations of project types and baseline scenarios applicable to the (ACM0006) methodology”. The methodology is applied in the context of the project activity in the following ways:
1. Project involves installation of new cogeneration unit of 6 MW, which operates next to an existing biomass power generation unit of 2.5 MW.
2. The existing unit is fired with biomass and will continue to operate in the same manner after the installation of the new power unit.
3. In the absence of the project activity: - The power would have been imported from the grid and partly generated in the
plant. - The biomass would have been partly used for heat and the excess of it would be
dumped and left to decay. - The heat would have been generated in the on-site boilers fired partly with
biomass and partly with fossil fuels
The stepwise application of baseline methodology consists of the following elements: Step1: Determine the alternate baseline scenario Step2: Determine that the project activity is not part of the baseline (Additionality) Step3: Determine the emission reductions
Step1: Determine the alternate baseline scenario As per the proposed methodology the project is required to identify the plausible baseline scenario and identify the realistic and credible alternatives of scenario 16 with regard to the following points:
- How would power be generated in the absence of the CDM project activity; - What would happen to the biomass in the absence of the project activity; and - In case of cogeneration projects: how would heat be generated in the absence of the project
activity?

PROJECT DESIGN DOCUMENT FORM (CDM PDD) - Version 02 CDM – Executive Board page 10
Alternative for power generation Baseline Scenario Description of the alternative selected Option P4: Generation of power in existing and / or new grid connected power plants Option P6: The continuation of power generation in an existing power plant, fired with the same type of biomass as (co)-fired in the project activity and, at the end of the lifetime of the existing plant, replacement of that plant by a similar new plant
In absence of the project activity, the power generation would have continued in the existing power plant (old configuration) by using the same type of biomass, which partly meets the requirement of the paper plant, and the rest would have been met by importing the power from the regional grid. Baseline scenario for power generation is therefore a combination of P4 and P6.
Alternative for heat generation Baseline Scenario Description of the alternative selected Option H4: The generation of heat in boilers using the same type of biomass residues Option H6: The generation of heat in boilers using fossil fuels
In the absence of the project activity, the heat would be generated in existing boilers, partly by firing the same biomass residues and partly by fossil fuels. Baseline scenario for heat generation is therefore a combination of H4 and H6.
Alternative for use of biomass Baseline Scenario Description of the alternative selected Option B1: The biomass is dumped or left to decay or burned in an uncontrolled manner without utilizing it for energy purposes Option B2: The biomass is used for heat and/or electricity generation at the project site
In absence of the project activity, a part of the biomass would be used for heat generation in the boiler and the rest would be dumped or left to decay. Baseline scenario for biomass disposal is therefore a combination of B1 and B2.
Step2: Determine that the project activity is not part of the baseline (Additionality) Within the scope of the adopted baseline methodology, additionality has been demonstrated as per the steps indicated in the applied methodology and presented in section B.3 of this PDD. As required by the methodology, the additionality tests follow the recommendation of the CDM EB guidelines i.e., as per “Tools for demonstration of additionality” and follows a step-wise logical approach as delineated in this guideline. Step3: Determine the Emission Reductions

PROJECT DESIGN DOCUMENT FORM (CDM PDD) - Version 02 CDM – Executive Board page 11 The project activity mainly reduces CO2 emissions through substitution of power and heat generation with fossil fuels by energy generation with biomass. The emission reduction ERy by the project activity during a given year y is given by: ERy = ERheat,y + ERelectricity,y +BEbiomass,y - PEy - Ly Where ERheat,y are the emission reductions due to displacement of heat during the year y in tons of CO2, ERelectricity,y are the emission reductions through substitution of electricity generation with fossil fuels BEbiomass,y are the baseline emissions due to natural decay or burning of anthropogenic sources of
biomass during the year y in tons of CO2 equivalents, PEy are the project emissions Ly are emissions due to leakage The baseline information and emission reductions from the project activity are detailed in section E and Annex 5 of this document. B.3. Description of how the anthropogenic emissions of GHG by sources are reduced below those that would have occurred in the absence of the registered CDM project activity: >> As per the proposed baseline methodology, the project proponent is required to establish that the GHG reductions due to the project activity are additional to those that would have occurred in absence of the present project activity as per the ‘Tool for the demonstration and assessment of additionality’. Additionality of the project as described in proposed baseline methodology is discussed further. Step 0: Preliminary screening based on the starting date of the project activity. As the project will not be registered before the project date of commissioning, the crediting period is expected to start after the implementation of the project. Since the project participants do not wish to have the crediting period start prior to the registration of their project activity, Step 0 is satisfied. Step 1: Identification of alternatives to the project activity consistent with current laws and regulations. The demonstration of the baseline scenarios (in section B2) incorporated the steps contained within this section and therefore, to summarize the conclusions of the baseline scenario it was shown that the alternatives might be limited to: - The generation of power by the continuation of present scenario and part import of power from the grid - The generation of heat by partly firing biomass and partly firing fossil fuels - A part of the same biomass used for heat generation and the rest left to decay or dumped openly Considering the business-as-usual practice in the paper mill industry and the level of feasibility and ubiquitous conservativeness, the alternative that most likely and conservatively reflects how the power and heat would have been generated if the proposed project activity had not been implemented must be chosen as the baseline scenario. Step 3: Barrier analysis

PROJECT DESIGN DOCUMENT FORM (CDM PDD) - Version 02 CDM – Executive Board page 12 Sub-step 3a: Identify barriers that would prevent a wide spread implementation of the proposed project activity: (A) Investment barriers:
Under the present capacity expansion project, a high-pressure configured turbine has to be installed. Alternatively, the project would have maintained a low-pressure configuration turbine, which would have sufficed its internal needs or it would have imported power from the grid. Therefore, this high-pressure configuration turbine is a financial barrier. The YPL has invested Rs.440 Mn (Rs.170 Million for power plant and Rs.270 Million for the chemical recovery boiler) on the project. The project participants (investors) required investing around Rs.73 millions per MW, which was high compared to investment in conventional power projects. YPL had to face a lot of difficulty in obtaining the financial closure of the project activity as it was not a common practice in the region and was supposed to provide the total captive requirement to the paper mill totally based on biomass. The IRR of the project increases significantly when CER revenues are taken into account. Therefore the CDM revenues are significant for viability of the project activity. In addition to the high pressure configuration, the fact that the project generating power for the on-site application the investment for the expansion of the project is a barrier to meet the on-site requirements otherwise the project would import power from the grid. Moreover, as the expansion of the project is in itself a massive investment, the added uncertainty associated with producing its own power to feed this expansion is viewed as a significant investment barrier. As most of the pulp factories normally generate power through a relatively low-pressure configuration technically easier to operate boilers, the installation of a high-pressure boiler lends a new set of operational challenges for this pulp factory. (B) Technological barriers: The fundamental technological barrier was the fact that the project has a high-pressure configuration power generation unit, which was / is not a business-as-usual practice in the Indian Paper Mills. Furthermore, the Cogeneration unit is the integral part of YPL pulping unit. With the implementation of the project all the standby units had to be done away with. This is a valiant techno-economic decision requiring streamline meticulous preventive checks. A single failure of the boiler and its auxiliaries will lead to production downtime of the pulp mill. This would lead to huge financial loss for the industry. In terms of heating value on dry basis, almost all types of biomass exhibit similar characteristics. However, the constitution of each varies quite significantly, as in the case of Pith, which is rich in moisture. This therefore makes it a problematic fuel. Also when dry, it is a very light fuel due to its very small particle size. These small and light particles tend to fly off and deposit in various heat transfer zones of the boiler, thus necessitating frequent stoppages and cleaning of the boiler. This can adversely affect both fuel efficiency and PLF value for the process.
(C) Prevailing Practice:

PROJECT DESIGN DOCUMENT FORM (CDM PDD) - Version 02 CDM – Executive Board page 13 Although many barriers exist in the path of the project activity, it was felt that the availability of carbon revenue from the saleability of carbon credits generated due to project activity would help overcome these barriers. Some of the key barriers are discussed below: There was no policy existent in the state for the promotion of renewable energy sources based power generation. The UP electricity Regulatory Commission had issued a policy for Renewable Energy Sources based independent power production in September 20011. Thus due to the lack of government policy, the paper industry sector had little or no incentive to move towards implementation of technologies which would lead to lower emissions. YPL unit has essentially considered Soda Recovery Boiler not only for chemical recovery but also as steam generating boiler using Strong Black Liquor. This mode of utilizing biomass residue in efficient manner is generally neglected in the sector. The main objective was to generate more steam in an efficient manner utilizing residues from the pulp processes. This is not a business-as-usual case and hence is uncommon in the sector.
(D) Other barriers: Storage of biomass: Since biomass residues are only available for three to six months a year; adequate storage facilities are required, which in turn occupied lot of space in the unit. The characteristics of biomass fuels will also change quickly within short time. Most importantly, the calorific value decreases due to the loss of volatiles and deterioration of biomass, which affects the performance of the plant equipment. Hence, biomass materials cannot be stored for long periods. The proposed project activity involves the following additional barriers and uncertainties.
a) The success of the biomass power plant mainly depends on the availability of biomass materials. Biomass availability is highly subject to seasonal fluctuations due to the vagaries of nature.
b) Biomass prices fluctuate continuously depending on seasonal variations, making the cost of generation unstable.
c) Biomass is widely dispersed in small quantities. Hence, collection and transportation of biomass materials to the project site become a constraint. In addition, the cost of collection and transportation charges will increase every year due as per the trend in the cost of labor and of fossil fuels used for transportation (mainly diesel).
d) Since biomass power generation is a relatively new technology, the effects of combusting biomass fuels on the life cycle of the plant equipment were not established. The cost of maintenance is one indicator in this regard.
e) The biomass conversion efficiency is very low compared to fossil fuel energy conversion efficiencies.
Biomass procurement risk: Procuring biomass from over 100 independent sellers was a new exercise for YPL. In order to operate the new biomass based energy system, YPL had to develop infrastructure in terms of manpower and financial resources so as to ensure continuous fuel availability. This would be a daunting task as it involved the setting up of a system for the collection of biomass from a large number of sellers, since one single supplier cannot supply the quantity of biomass required for the project activity. This requires experience in managing rural and not necessarily educated sellers. Also the continuous supply of fuel for the project activity requires good managerial skills, commitment and resources.
1 http://www.uppcl.org/niti.htm

PROJECT DESIGN DOCUMENT FORM (CDM PDD) - Version 02 CDM – Executive Board page 14 Managerial resource and organizational barrier: YPL had to overcome the managerial resource barrier because of lack of trained manpower to operate the cogeneration plant, considering that their plant is situated in a rural area. YPL being involved in business of paper production and rural economics for a longtime had to overcome these barriers in order to deal with power sector economics and related aspects.
Step 4. Common Practice Analysis Sub-step 4a: Analyze other activities similar to the proposed project activity: The sector, historically, has always exploited its biomass in an inefficient manner by making use of low-pressure boilers. Although they consume almost all the biomass for self-energy generation purposes, it is done is such a manner that no surplus electricity is available for sale, and very few (if any) companies have ventured in the electricity market till now. The majority of projects implemented / under implementation are targeting registration under the Clean Development Mechanism in order to generate additional revenues that are most essential to make the projects viable and thus possible. Sub-step 4b: Discuss any similar options that are occurring Most of the similar projects have been implemented recently and most, if not all, of them are being developed under the Clean Development Mechanism. Step 5. Impact of CDM registration The registration of this CDM project activity, will contribute towards overcoming all the barriers described in this tool: Technological, institutional, economic, investment, and other barriers will all be significantly mitigated on account of the additional revenue generation from the sale of carbon credits. This would bring more solidity to the investment itself, thus fostering and supporting the project owner’s decision to the break through on their business model. The project proponent is already engaged in negotiations to sell their expected CERs. In addition, the CDM project registration would influence other similar projects to be set up and encourage the use of CERs as an additional revenue stream that is reliable enough to be seriously considered in the computation of project returns. B.4. Description of how the definition of the project boundary related to the baseline methodology selected is applied to the project activity: >> For the proposed project, the project boundary is from the point of fuel storage to the point of electricity supply to the paper plant. Thus the project boundary includes the fuel storage, boilers, steam turbine generator and all other accessory equipments. Project boundary is illustrated in the diagram:
Rice Husk and Bagasse Pith
Biomass fired boiler
Cogeneration unit
Soda Recovery Boiler
Strong Black Liquor
Project Boundary

PROJECT DESIGN DOCUMENT FORM (CDM PDD) - Version 02 CDM – Executive Board page 15 B.5. Details of baseline information, including the date of completion of the baseline study and the name of person (s)/entity (ies) determining the baseline: >> The details of the baseline scenario and the emission reductions from the project activities are specified in Section E and in Annex 5 The date of completion of the baseline study: 30/12/2005 Name of the entity conducting the baseline study: Yash Papers Limited The detailed contact address of the above entity is given in Annex 1.

PROJECT DESIGN DOCUMENT FORM (CDM PDD) - Version 02 CDM – Executive Board page 16 SECTION C. Duration of the project activity / Crediting period C.1 Duration of the project activity: C.1.1. Starting date of the project activity: >> 01/11/2005 C.1.2. Expected operational lifetime of the project activity: >> 30y-0m C.2 Choice of the crediting period and related information: C.2.1. Renewable crediting period
C.2.1.1. Starting date of the first crediting period: >> 01/01/2007 C.2.1.2. Length of the first crediting period: >> 7y-0m C.2.2. Fixed crediting period: C.2.2.1. Starting date: >> Not applicable C.2.2.2. Length: >> Not applicable

PROJECT DESIGN DOCUMENT FORM (CDM PDD) - Version 02 CDM – Executive Board page 17 SECTION D. Application of a monitoring methodology and plan
D.1. Name and reference of approved monitoring methodology applied to the project activity: >> The recently approved consolidated Monitoring methodology ACM0006/version 03; “Consolidated Monitoring methodology for grid-connected electricity generation from biomass residues” would be an appropriate methodology for the present project for approval under CDM. D.2. Justification of the choice of the methodology and why it is applicable to the project activity: >> The proposed monitoring methodology is a general monitoring methodology applicable to all the biomass based power projects connected to the grid. The monitoring takes into consideration all aspects related to electricity generation from the project, baseline emissions, project emissions and emissions related to leakage. Since the proposed project is a Biomass based cogeneration project, all the monitoring requirements are in line with the monitoring methodology proposed. Therefore, the proposed monitoring methodology “grid-connected electricity generation from biomass residues” is the most suitable monitoring methodology applicable to the project activity.


PROJECT DESIGN DOCUMENT FORM (CDM PDD) - Version 02 CDM – Executive Board page 19 D.2. 1. Option 1: Monitoring of the emissions in the project scenario and the baseline scenario D.2.1.1. Data to be collected in order to monitor emissions from the project activity, and how this data will be archived: ID number (Please use numbers to ease cross-referencing to D.3)
Data variable Source of data
Data unit
Measured (m), calculated (c) or estimated (e)
Recording frequency
Proportion of data to be monitored
How will the data be archived? (electronic/ paper)
Comment
1 Quantity ofRice Husk combusted in the project plant
Plant records/Log books
Tons m Monthly 100% Electronic The quantity of Biomass, used as feedstock for the cogeneration project that is procured from the suppliers will be collected and monitored.
2 Quantity ofbiomass residues like Bagasse pith and strong black liquor
Plant records/Log books
Tons m Monthly 100% Electronic The quantity of biomass residues used as feedstock for the cogeneration project is generated with in the paper plant and this will be collected and monitored.
3. Off-sitetransportation emissions
Plant records/Log books
tCO2e c Monthly 100% Electronic Number of trucks required to transport the biomass and the distance travelled is recorded in Log book.
4. Net CO2Emission Factor for combustion of fossil fuels for transporting the biomass
tCO2e/ km
c Annually 100% Electronic The local value from the IPCC guidelines will be considered for the corresponding CO2e emissions.
D.2.1.2. Description of formulae used to estimate project emissions (for each gas, source, formulae/algorithm, emissions units of CO2 equ.) >>

PROJECT DESIGN DOCUMENT FORM (CDM PDD) - Version 02 CDM – Executive Board page 20 The Biomass (Rice Husk) used, as the feedstock for the proposed cogeneration power project will be procured from the suppliers and the CO2e emissions from the combustion of the fossil fuels for the transportation for the same is monitored every year. The other biomass residues being generated with in the project site itself, therefore no corresponding emissions. D.2.1.3. Relevant data necessary for determining the baseline of anthropogenic emissions by sources of GHGs within the project boundary and how such data will be collected and archived :
ID number (Please use numbers to ease cross-referencing to table D.3)
Data variable
Source of data
Data unit Measured (m), calculated (c), estimated (e),
Recording frequency
Proportion of data to
be monitored
How will the data be archived?
(electronic/ paper)
Comment
5. NetElectricity displaced from the grid
Project Records / Log book
MWh m Hourly 100% electronic Net Electricity supplied and used for on-site applications from the Biomass based cogeneration project is recorded on hourly basis
6. CO2Emission Factor of the grid
CEA tCO2e/GWh
c Annually 100% electronic Calculated as the weighted sum of OM and BM Emission Factor
7. CO2 OMEmission Factor of the grid
CEA tCO2e/GWh
c Annually 100% electronic Calculated as option 1 (simple OM) as per the referred methodology ACM 0002
8. CO2 BMEmission Factor of the grid
CEA tCO2e/GWh
c Annually 100% electronic Calculated as option 1 (Ex-ante) as per the referred methodology ACM 0002

PROJECT DESIGN DOCUMENT FORM (CDM PDD) - Version 02 CDM – Executive Board page 21 D.2.1.4. Description of formulae used to estimate baseline emissions (for each gas, source, formulae/algorithm, emissions units of CO2 equ.) >> Emission reductions due to the displacement of electricity are calculated by multiplying the net quantity of electricity generated with biomass as a result of the project activity (EGy) with the CO2 baseline emission factor for the electricity displaced due to the project (EFgrid,y), as follows: ERelectricity,y = EGy * EFgrid,y Where: ERelectricity,y are the emission reductions due to displacement of electricity during the year y in tons of CO2 EGy is the net quantity of electricity generation as a result of the project activity during the year y in MWh, EFgrid,y is the CO2 baseline emission factor where part of the electricity is displaced due to the project activity during the year y in tons CO2/MWh. (1) Electricity generation from the project activity (EGy) The total power generated during the crediting period is based on the power plant’s capacity, auxiliary consumption, net power available for captive purpose, plant load factor and number of operating days in the year. (2) Determination of Baseline Emission Factor (EFgrid,,y) The baseline emission factor (EFgrid,y) of the chosen grid is calculated as combined margin (CM), consisting of the combination of operating margin (OM) and build margin (BM) factors following the guidelines in the section “Consolidated baseline methodology for grid-connected electricity generation from renewable sources” (ACM 0002). Calculation of Operating Margin Emission Factor for the region based on Simple OM The simple OM emission factor (EFOM, simple,y) is calculated as the generation-weighted average emissions per electricity unit (tCO2/MU) of all generating sources serving the system, not including low-operating cost and must-run power plants. The detailed baseline information is given in Annex 3.
Σ Fi ,j, y * COEFi,j y EFOM, y =
Σ GENj,y
where Fi ,j, y is the amount of fuel i (in a mass or volume unit) consumed by relevant power sources j in year(s) y,

PROJECT DESIGN DOCUMENT FORM (CDM PDD) - Version 02 CDM – Executive Board page 22
j refers to the power sources delivering electricity to the grid, not including low-operating cost and must run power plants, and including imports5 to the grid, COEFi,j y is the CO2 emission coefficient of fuel i (tCO2 / mass or volume unit of the fuel), taking into account the carbon content of the fuels used by relevant power sources j and the percent oxidation of the fuel in year(s) y, and GENj,y is the electricity (MWh) delivered to the grid by source j.
The CO2 emission coefficient COEFi is obtained as COEFi = NCVi * EFCO2,i * OXIDi
where: NCVi is the net calorific value (energy content) per mass or volume unit of a fuel i, OXIDi is the oxidation factor of the fuel EFCO2,i is the CO2 emission factor per unit of energy of the fuel i.
Calculation of Build Margin Emission Factor for the region (ex-ante):
Σ Fi,m, y * COEFi,m EFBM, y =
Σ GENm,y
where Fi,m,y, COEFi,m Are analogous to the variables described for the simple OM method above for plants m.
The project developer has adopted option 1 (Ex-ante), which requires to calculate the Build Margin emission factor EFBM,y ex-ante based on the most recent information available on plants already built for sample group m at the time of PDD submission. The data used to determine the simple BM emission factor (EFBM,y ) Baseline emission factor (EFgrid,,y) The baseline emission factor EFgrid,,y is calculated as the weighted average of the Operating Margin emission factor (EFOM, simple,y) and the Build Margin emission factor (EFBM,y) , where the weights WOM and WBM, by default, are 50% and EFOM, simple,y and EFBM,y are calculated as described in steps 1 and 2 above and are expressed in tCO2/MU. EFgrid,,y = 0.5(EFOM, y +EFBM, y)

PROJECT DESIGN DOCUMENT FORM (CDM PDD) - Version 02 CDM – Executive Board page 23 D. 2.2. Option 2: Direct monitoring of emission reductions from the project activity (values should be consistent with those in section E). Not Applicable D.2.2.1. Data to be collected in order to monitor emissions from the project activity, and how this data will be archived:
ID number(Please use numbers to ease cross-referencing
to table D.3)
Data variable
Source of data
Data unit
Measured (m), calculated (c), estimated (e),
Recording frequency
Proportion of data to
be monitored
How will the data be archived? (electronic/
paper)
Comment
D.2.2.2. Description of formulae used to calculate project emissions (for each gas, source, formulae/algorithm, emissions units of CO2 equ.): >> D.2.3. Treatment of leakage in the monitoring plan D.2.3.1. If applicable, please describe the data and information that will be collected in order to monitor leakage effects of the project activity ID number(Please use numbers to ease cross-referencing to table D.3)
Data variable
Source of data Data
unit
Measured (m), calculated (c) or estimated (e)
Recording frequency
Proportion of data to be monitored
How will the data be archived? (electronic/ paper)
Comment

PROJECT DESIGN DOCUMENT FORM (CDM PDD) - Version 02 CDM – Executive Board page 24 D.2.3.2. Description of formulae used to estimate leakage (for each gas, source, formulae/algorithm, emissions units of CO2 equ.)
>> Not applicable. D.2.4. Description of formulae used to estimate emission reductions for the project activity (for each gas, source, formulae/algorithm, emissions units of CO2 equ.) >> The emission reduction ERy by the project activity during a given year y is given by: ERy = ERheat,y + ERelectricity,y +BEbiomass,y - PEy - Ly Where ERheat,y are the emission reductions due to displacement of heat during the year y in tons of CO2, ERelectricity,y are the emission reductions through substitution of electricity generation with fossil fuels BEbiomass,y are the baseline emissions due to natural decay or burning of anthropogenic sources of biomass during the year y in tons of CO2 equivalents, PEy are the project emissions Ly are emissions due to leakage
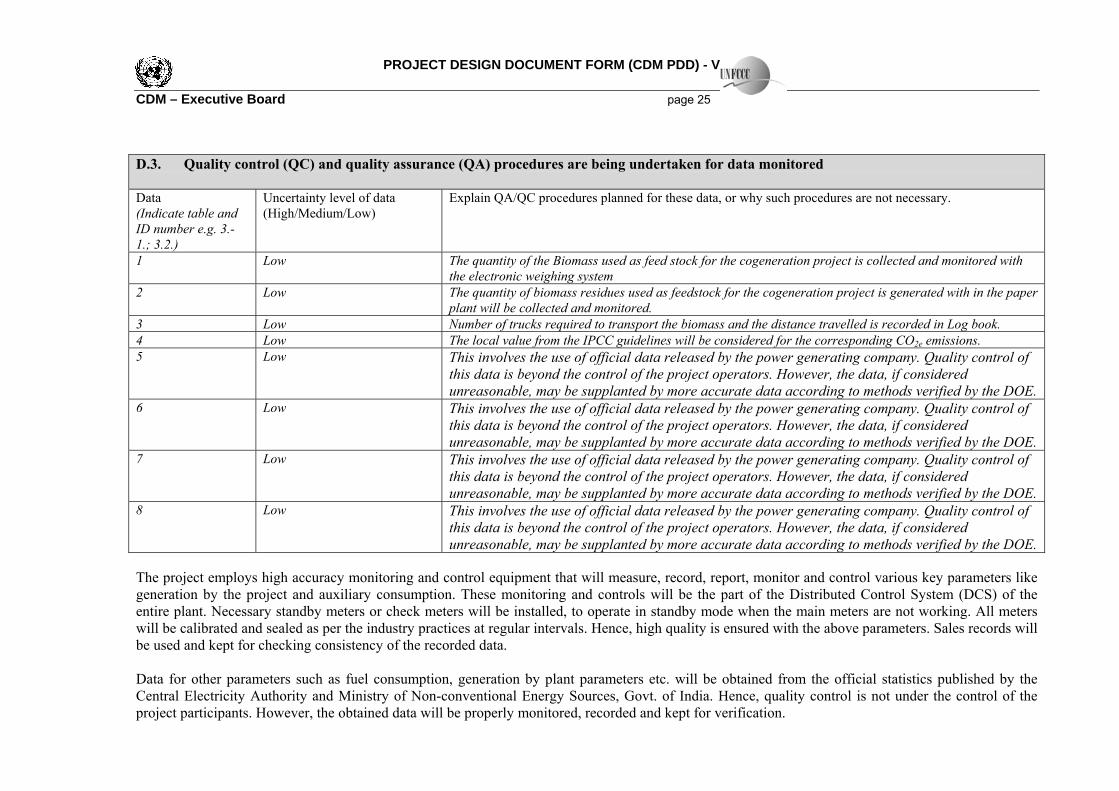
PROJECT DESIGN DOCUMENT FORM (CDM PDD) - Version 02 CDM – Executive Board page 25 D.3. Quality control (QC) and quality assurance (QA) procedures are being undertaken for data monitored Data (Indicate table and ID number e.g. 3.-1.; 3.2.)
Uncertainty level of data (High/Medium/Low)
Explain QA/QC procedures planned for these data, or why such procedures are not necessary.
1 Low The quantity of the Biomass used as feed stock for the cogeneration project is collected and monitored with the electronic weighing system
2 Low The quantity of biomass residues used as feedstock for the cogeneration project is generated with in the paper plant will be collected and monitored.
3 Low Number of trucks required to transport the biomass and the distance travelled is recorded in Log book. 4 Low The local value from the IPCC guidelines will be considered for the corresponding CO2e emissions. 5 Low This involves the use of official data released by the power generating company. Quality control of
this data is beyond the control of the project operators. However, the data, if considered unreasonable, may be supplanted by more accurate data according to methods verified by the DOE.
6 Low This involves the use of official data released by the power generating company. Quality control of this data is beyond the control of the project operators. However, the data, if considered unreasonable, may be supplanted by more accurate data according to methods verified by the DOE.
7 Low This involves the use of official data released by the power generating company. Quality control of this data is beyond the control of the project operators. However, the data, if considered unreasonable, may be supplanted by more accurate data according to methods verified by the DOE.
8 Low This involves the use of official data released by the power generating company. Quality control of this data is beyond the control of the project operators. However, the data, if considered unreasonable, may be supplanted by more accurate data according to methods verified by the DOE.
The project employs high accuracy monitoring and control equipment that will measure, record, report, monitor and control various key parameters like generation by the project and auxiliary consumption. These monitoring and controls will be the part of the Distributed Control System (DCS) of the entire plant. Necessary standby meters or check meters will be installed, to operate in standby mode when the main meters are not working. All meters will be calibrated and sealed as per the industry practices at regular intervals. Hence, high quality is ensured with the above parameters. Sales records will be used and kept for checking consistency of the recorded data. Data for other parameters such as fuel consumption, generation by plant parameters etc. will be obtained from the official statistics published by the Central Electricity Authority and Ministry of Non-conventional Energy Sources, Govt. of India. Hence, quality control is not under the control of the project participants. However, the obtained data will be properly monitored, recorded and kept for verification.

PROJECT DESIGN DOCUMENT FORM (CDM PDD) - Version 02 CDM – Executive Board page 26 D.4 Please describe the operational and management structure that the project operator will implement in order to monitor emission reductions and any leakage effects, generated by the project activity >> The monitoring parameters relevant for the CDM activity (see section D.3), i.e. quantity of biomass, electricity production and consumption are part of the regular monitoring scheme of the plant. No additional CDM related training was required. The monitoring data required for the CDM verification are taken from the regular digital and manual logs. Organization structure Flat organization structure with substantial delegation at operation level shall be maintained for efficient operation and low operating cost. The organization structure during project stage shall be developed considering deployment requirement, need for cost optimisation and smooth transition from construction to operation. Recruitment for the project stage shall also be carried out in a phased manner coinciding with the construction schedule. Project stage structure and the tentative schedule for filling up the structure are shown in the table below.
The project has experienced Engineers and has an Officer for Fuel Procurement under the guidance of the Executive / Technical Director. Together they have recruited and groomed a team of Supervisors and Field Representatives to effectively control and monitor the complete process of fuel procurement, quality issues, and the handling and storage of material in the plant area. A
TG set 1 Boiler 1 BoP 1 Elec + Inst (1+2)
Mechanical (1+2)
Power Plant Manager
At the operation phase, the plant shall be organized under the following functional performance areas. • Fuel purchase • Fuel handling • Water supply and treatment • Boiler • Turbo-generator • Electrical and instrumentation • Mechanical/ Civil repair • Commercial and finance • General administration including PR, safety and security and infrastructure shall be handled by
the present staff.

PROJECT DESIGN DOCUMENT FORM (CDM PDD) - Version 02 CDM – Executive Board page 27 Based on this, following organization structure shall be followed:
Water supply & Treatment
4
TG Set 1+4
Elec+Inst 2
Boiler incl. FW & Ash systems
1+4+4 + 4 Contract
Mechanical 2
Fuel handling Contract
4
GM (plant) 1
D.5 Name of person/entity determining the monitoring methodology:
>> Yash Papers Limited. The detailed contact address of the above entity is given in Annex 1.

PROJECT DESIGN DOCUMENT FORM (CDM PDD) - Version 02 CDM – Executive Board page 28 SECTION E. Estimation of GHG emissions by sources E.1. Estimate of GHG emissions by sources: >> The total project emissions from the project activity are given by: PEy = PETy + PEFFco2, y + GWPCH4 * PEBiomass, CH4, y (1) Emissions from the combustion of fossil fuels for transportation of biomass (PETy) The CO2 emissions associated with the transport of rice husk from suppliers to the power plant are to be taken into consideration as a part of the project emissions. The total quantity of biomass (Rice Husk) procured from outside is 80000 TPA. The Biomass pith and Strong Black Liquor are the residues from the paper processing; therefore no emissions from these biomass residues are accounted for. The project participants have chosen Option 1 (based on the transportation distance and the number of trips) for calculating the project emissions from the combustion of fossil fuels for transportation of biomass to the project plant. PETy. = Ny * AVDy * EFkm, CO2 Emission CO2 CH4 GWP of N2O GWP of Factor = emission + emission x CH4 + emission x N2O Factor factor factor (tCO2e/km) (tCO2/km) (tCH4/km) (tCO2e/tCH4) (tN2O/km) (tCO2e/tN2O) = 415x10-6 + 0.01x10-6 x 21 + 0.031x10-6 x 310 = 425 x 10-6 t CO2/km Therefore Project emissions from Biomass transportation to the Power plant (PETy.) is given by PETy.= 10,000 * 100 * 425 x 10-6
PETy = 425 t CO2/yr (2) Emissions from on-site consumption of fossil fuels (PEFFCO2, y)
PEFFCO2, y = ∑ FFproject plant, i, y * COEFCO2,i
No on-site fossil fuel consumption in the project therefore no emissions can be estimated from the same. (3) Methane emission from the combustion of biomass (PEBiomass, CH4, y)
PEBiomass, CH4, y = EFCH4 ∑ BFi,y * NCVi
PEBiomass, CH4, y = 0.0411 [(80000*0.01337)+(12340*0.00836)] = 48.22 t CH4/yr GWPCH4 * PEBiomass, CH4, y = 21* 48.22 = 1012.6 t CO2e/yr

PROJECT DESIGN DOCUMENT FORM (CDM PDD) - Version 02 CDM – Executive Board page 29 Therefore the total project emissions PEy = PETy + PEFFco2, y + GWPCH4 * PEBiomass, CH4, y PEy = 425 + 0 + 1012.6 = 1,438 t CO2e/yr E.2. Estimated leakage: >> Demonstration of use of the biomass residues will not result in increase of fossil fuel consumption elsewhere: The biomass resource assessment was conducted by the project promoter- to study the biomass resources availability, their consumption and the surplus biomass availability. The assessment report can be presented to the validator. Biomass assessment was carried out in three zones of 15 kms radius, 15 to 25 kms radius and 25 to 50 kms radius. The basic objective of the study was to assess the biomass resources availability, their consumption and therefore, the surplus biomass availability. This objective was kept in mind while devising the methodology. Biomass generation from crop residues, agro industries mainly from rice mills, and forest and wastelands is estimated and given below:
Tehsils
Crop Residues tons
Other Residues
tons
Agro-Industry
tons
Total tons
< 15 kms , 15-25 kms & 25-50 kms radius Grand total 1305611 107273 605075 2017959
Summary of Biomass consumption within 50 kms radius in tons
Tehsils Domestic
tons Fodder
tons Industry
tons Total tons
< 15 kms , 15-25 kms & 25-50 kms radius Grand Total 125158 984399 429433 1538990
The quantity of biomass available (agro-industry) = 2017959 tons The quantity of biomass that is utilized (including the present plant) = 1538990+80000=1618990 tons Hence the available biomass in the region is approximately 25% over and above that quantity which is utilized. Therefore implementation of the project activity will not divert the biomass from other users to the project plant and no net emissions from the fossil fuel combustion due to diversion are accounted and are considered negligible. E.3. The sum of E.1 and E.2 representing the project activity emissions: >> The net project activity emissions by the project is estimated as 1,438 t CO2e/yr

PROJECT DESIGN DOCUMENT FORM (CDM PDD) - Version 02 CDM – Executive Board page 30 E.4. Estimated anthropogenic emissions by sources of greenhouse gases of the baseline: >> (1) Baseline emissions due to natural decay or uncontrolled burning of anthropogenic sources of biomass BEBiomass,y= GWPCH4 * ∑BFi,notused,y * NCVi * EFburning,CH4,i BEBiomass,y=21[(80000*0.013376)+(12340*0.00836)]*0.0219 BEBiomass,y = 540 t CO2/yr (2) Baseline emissions from displacement of grid-electricity ERelectricity,y = EGy * EFgrid,y (details are furnished in Annex 5)
Year Net quantity of electricity
generated in the new plant (GWh)
EGy
Emission Factor for
displacement of electricity
(tCO2e /GWh) EFgrid,y
Baseline emissions (tCO2e)
ERelectricity,y
2007 38.86 914.88 35,559 2008 38.86 914.88 35,559 2009 38.86 914.88 35,559 2010 38.86 914.88 35,559 2011 38.86 914.88 35,559 2012 38.86 914.88 35,559 2013 38.86 914.88 35,559
(3) Emission reductions or increases due to displacement of heat Emission reductions from savings of fossil fuels are determined by: ERheat,y = Qy * COEFi / [εboiler * NCVi ] Where: Qbiomass,historic,3yr = εboiler biomass∑ BFk,boiler,historic,3yr * NCVi or k Qbiomass,historic,3yr = 100 * 45576 * 3.436 Qbiomass,historic,3yr = 156638 MWh Qy = Min {[Qproject plant,y], [Qtotal,y – (Qhistoric,3yr)/3]} - (Qbiomass,historic,3yr)/3 Qy = (304326-156638) = 141,438 MWh ERheat,y = Qy * COEFi / [εboiler * NCVi ] ERheat,y = 141,438 * 1.58 / (100% * 4.64) = 50,242 tCO2e
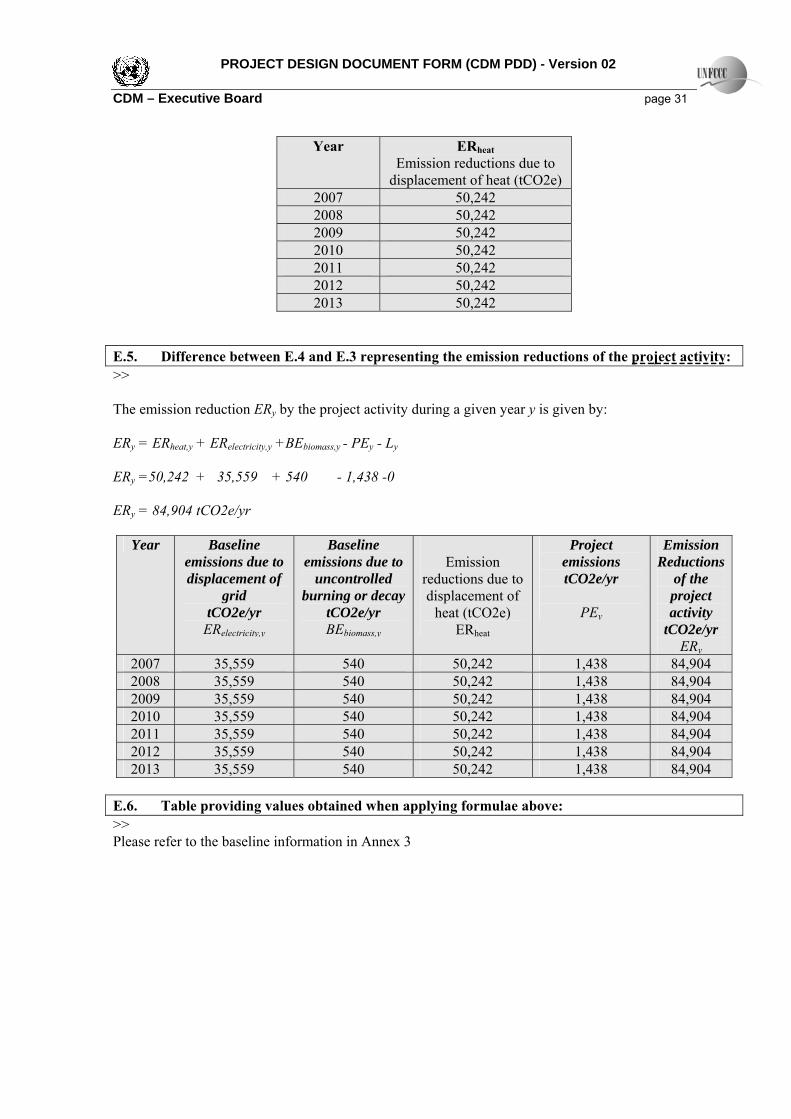
PROJECT DESIGN DOCUMENT FORM (CDM PDD) - Version 02 CDM – Executive Board page 31
Year ERheatEmission reductions due to
displacement of heat (tCO2e) 2007 50,242 2008 50,242 2009 50,242 2010 50,242 2011 50,242 2012 50,242 2013 50,242
E.5. Difference between E.4 and E.3 representing the emission reductions of the project activity: >> The emission reduction ERy by the project activity during a given year y is given by: ERy = ERheat,y + ERelectricity,y +BEbiomass,y - PEy - Ly ERy =50,242 + 35,559 + 540 - 1,438 -0 ERy = 84,904 tCO2e/yr
Year Baseline emissions due to displacement of
grid tCO2e/yr
ERelectricity,y
Baseline emissions due to
uncontrolled burning or decay
tCO2e/yr BEbiomass,y
Emission
reductions due to displacement of
heat (tCO2e) ERheat
Project emissions tCO2e/yr
PEy
Emission Reductions
of the project activity
tCO2e/yr ERy
2007 35,559 540 50,242 1,438 84,904 2008 35,559 540 50,242 1,438 84,904 2009 35,559 540 50,242 1,438 84,904 2010 35,559 540 50,242 1,438 84,904 2011 35,559 540 50,242 1,438 84,904 2012 35,559 540 50,242 1,438 84,904 2013 35,559 540 50,242 1,438 84,904
E.6. Table providing values obtained when applying formulae above: >> Please refer to the baseline information in Annex 3

PROJECT DESIGN DOCUMENT FORM (CDM PDD) - Version 02 CDM – Executive Board page 32 SECTION F. Environmental impacts F.1. Documentation on the analysis of the environmental impacts, including transboundary impacts: >> No negative environmental impacts will occur as a result of the project activity. The most significant positive environmental impact arising from the project activity is the reduction in carbon dioxide emissions from the replacement of fossil fuels that would be generated under the baseline scenario. F.2. If environmental impacts are considered significant by the project participants or the host Party, please provide conclusions and all references to support documentation of an environmental impact assessment undertaken in accordance with the procedures as required by the host Party: >> According to Indian regulation, the implementation of biomass plants does not require an Environmental Impact Assessment (EIA). The Ministry of Environment and Forests (MoEF), Government of India notification dated June 13, 2002 regarding the requirement of EIA studies as per the Environment Protection Rule, 1986 (MoEF, 2002) states that any project developer in India needs to file an application to the MoEF (including a public hearing and an EIA) in case the proposed industry or project is listed in a predefined list. Thermal Power Plants with an investment of less than INR 1 billion (US$ 22.22million) are excluded from this list. As the investment of biomass-based project (being a Thermal Power Plant) is less than INR 1 billion (total project cost is INR 0.44 billion), an EIA is not required (neither is a public hearing). The impacts identified on various components of environment are studied during two different phases -construction phase and operational phase. The important aspects of the report are summarized as follows: During Construction Phase
The proposed installation of Plant is in remote area near Darshan Nagar, Faizabad. The installation of power plant would have positive effect on landscaping. Project proponents will improve the aesthetics of the surroundings. The land section was under agriculture and therefore, construction would not require any tree to be uprooted. There are no endangered species to be uprooted for the project. In the initial stages of construction itself, bore well shall be constructed for meeting the requirement of construction and also drinking water, for which necessary treatment facilities shall be installed. There would be short-term negative impact on various components of socio-economic environment due to increase in population comprising of workmen & labour. However, by providing adequate housing, water, power and sanitation facilities to construction workmen and labour, these impacts shall be contained within the site. Contractors for labourers shall also arrange adequate cooking fuel. Thus, this short-term negative impact may be contained within the site & minimized. Further, there is a small village close to the construction site. Bulk of the requirement of unskilled labour shall be met from this village, thereby significantly reducing the short-term negative impact. During Operational Phase
The thermal energy emitted in the environment by power generating stations has long-term negative impacts. However, the proposed installation is insignificantly small with respect to bringing about climatic changes. Furthermore, the plant is based on renewable form of energy – biomass. The air

PROJECT DESIGN DOCUMENT FORM (CDM PDD) - Version 02 CDM – Executive Board page 33 pollution from burning of such fuel is far less harmful compared to fossil fuels as the former contains lesser quantity of sulphur (~0.6%). Moreover the particulate emissions would be arrested by an Electrostatic precipitator (pollution control equipment). This ESP installed in conjunction with the boiler would capture almost the entire quantity of ash thereby practically eliminating all particulate matter related problems. Requirement of water is proposed to be meet with the bore well available at the site. The yield of this borewell and the potential for sustained availability of water from it has been established. No surface water bodies are available in the vicinity & therefore, would not be exploited for operation of the plant, thus surface water would not receive any impact. The ecological environment shall have no impact due to operation of the plant.
GHG emission reduction
Global environment would be positively affected due the reduction of green house gas emissions from the plant. Power generation from biomass is considered to be fundamentally free of CO2 emissions due to the recycling of emitted carbon through the plant route. Thus, the net quantity of power of 38.86 MU can be considered to substitute fossil fuel generated power. The project proponent would explore possibility of getting emission credits under CDM of Kyoto Protocol.
Social impact The socio economic environment shall be impacted due to minor increase in population. This will be subsequently reduced as the plant goes into operational phase from the construction phase. A very low negative long-term impact is envisaged on demography, sanitation, and health aspects. Moderate long-term negative impact due to increase in traffic is also anticipated during operational phase, the effect of which would be reduced by plantation and maintenance of roads. Due to requirement of skilled workmen and labour in the power plant, there would be increase in earning capacity of local population. Similarly, increased production in the Faizabad industrial area would cause enhancement of trade and commerce related activities. There would be further income generation due to primary and secondary employment opportunity generated by the plant and operation of fuel logistics.

PROJECT DESIGN DOCUMENT FORM (CDM PDD) - Version 02 CDM – Executive Board page 34 SECTION G. Stakeholders’ comments >> G.1. Brief description how comments by local stakeholders have been invited and compiled: >> The stakeholders identified for the present project are as follows: Village Panchayat UPPCB MOEF Stakeholders’ list includes several government & non-government organizations, which are involved with the project activity during various stages of its implementation. The institutions are already in place for the local and national stakeholder review and we will report these during the final phase of validation. G.2. Summary of the comments received: >> The village municipality or local authority of representatives administrating the local area is a true representative of the local population in a democracy like India. Hence, their comments/permission/ views with regards to the set up and operation of the project are very necessary. This project has attained the consent letter from the Gram Pradhan stating their willingness to the project. The project will provide direct and indirect employment opportunities to local populace and hence will be encouraged by the local community. The project does not require any displacement of the local population. Additionally, the project displaces equivalent quantity of power from the grid and improves the power reliability and stability in the local electricity network. Thus, it implies that the project will not cause any adverse social impacts on the local population and instead, will help in improving the quality of life for them. The project has attained No Objection Certificate (NOC) from the state pollution control board stating that the project meets the prescribed standards of environmental compliance standards. G.3. Report on how due account was taken of any comments received: >> The relevant comments and important clauses mentioned in the project documents / clearances like detailed DPR, environmental clearances, PPA, local clearance etc., were considered while preparation of CDM PDD.

PROJECT DESIGN DOCUMENT FORM (CDM PDD) - Version 02 CDM – Executive Board page 35
Annex 1
CONTACT INFORMATION ON PARTICIPANTS IN THE PROJECT ACTIVITY The below entity is the project proponent Organization: Yash Papers Limited Street/P.O.Box: Darshan Nagar Building: City: Faizabad State/Region: Uttar Pradesh Postfix/ZIP: Country: India Telephone: +91 5278 258589 / 258777 FAX: +91 5278 258062 E-Mail: [email protected]: http://www.yash-papers.comRepresented by: Title: Managing Director Salutation: Mr. Last Name: Krishna Middle Name: First Name: Ved Department: Mobile: Direct FAX: Direct tel: Personal E-Mail:
Annex 2
INFORMATION REGARDING PUBLIC FUNDING There is no funding from Annex- I parties

PROJECT DESIGN DOCUMENT FORM (CDM PDD) - Version 02 CDM – Executive Board page 36
Annex 3
BASELINE INFORMATION Indian power grid system is divided into five regions namely Northern, Southern, Eastern, Western and North Eastern regions. These regions have independent load dispatch centres. Northern region mainly consists of Delhi, Uttar Pradesh, Rajasthan, Uttaranchal, Haryana, Himachal Pradesh, Punjab and Jammu Kashmir state. Each state has their own State Electricity Boards / Corporations to manage their respective power generating plants. In this state, Uttar Pradesh Power Corporation Limited (UPPCL) manages the power transmission and distribution. Uttar Pradesh Rajya Vidyut Utpadan Nigam Limited (UPRVUNL) manages all the thermal power generation plants in the state and hydro power plants are managed by Uttar Pradesh Jal Vidyut Nigam Limited (UPJVNL). National Thermal Power Corporation (NTPC) and National Power Corporation (NPC) manage the central government owned power generation plants. The relevant grid for the determination of the combined margin is selected as the northern region grid. This is because, although electricity generation and distribution remains largely in the hands of the Uttar Pradesh Power Corporation Limited, the regional grid is becoming more integrated. Moreover, central sector generation from the entire northern region is transmitted to UP. The actual generation data of the northern grid for the recent five years are analysed.
GWh Fuel 2005 % 2004 % 2003 % 2002 % 2001 %
Hydro &Nuclear 43577 25.82 44662 26.859 38863 24.98 37239 24.6 35741 24.77 Coal, NG, Diesel 125218 74.18 121621 73.141 116701 75.02 113788 75.3 108515 75.22 Total 168795 100.00 166283 100 155564 100.00 151027 100 144256 100 From the table, it is evident that for the average quantity of electricity generated over the last three years for the northern grid, the contribution of the renewable energy based power projects is 25.9% and that from thermal based power projects is 74.1%. In the northern region, the low cost must run resources constitute less than 50% of the total grid generation. The simple operating margin is therefore selected as the appropriate method to calculate the OM emission factor. Calculation of Baseline Emission Factor Baseline emission factor of UP (EFy) is calculated as a combined margin (CM), consisting of the combination of operating margin (OM) and build margin (BM) factors according to the following three steps. STEP 1. Calculate the Operating Margin emission factor STEP 2. Calculate the Build Margin emission factor

PROJECT DESIGN DOCUMENT FORM (CDM PDD) - Version 02 CDM – Executive Board page 37 STEP 3. Baseline Emission Factor The baseline emission factor (EFy) of the chosen grid is calculated as combined margin (CM), consisting of the combination of operating margin (OM) and build margin (BM) factors following the guidelines in the section “Consolidated baseline methodology for grid-connected electricity generation from renewable sources” (ACM 0002). Step 1: Calculation of Operating Margin Emission Factor for the region based on Simple OM The simple OM emission factor (EFOM, simple,y) is calculated as the generation-weighted average emissions per electricity unit (tCO2/MU) of all generating sources serving the system, not including low-operating cost and must-run power plants. The detailed baseline information is given in Annex 3.
Σ Fi ,j, y * COEFi,j y EFOM, y =
Σ GENj,y
where Fi ,j, y is the amount of fuel i (in a mass or volume unit) consumed by relevant power sources j in year(s) y, j refers to the power sources delivering electricity to the grid, not including low-operating cost and must run power plants, and including imports5 to the grid, COEFi,j y is the CO2 emission coefficient of fuel i (tCO2 / mass or volume unit of the fuel), taking into account the carbon content of the fuels used by relevant power sources j and the percent oxidation of the fuel in year(s) y, and GENj,y is the electricity (MWh) delivered to the grid by source j. The CO2 emission coefficient COEFi is obtained as COEFi = NCVi * EFCO2,i * OXIDi where: NCVi is the net calorific value (energy content) per mass or volume unit of a fuel i, OXIDi is the oxidation factor of the fuel EFCO2,i is the CO2 emission factor per unit of energy of the fuel i.


PROJECT DESIGN DOCUMENT FORM (CDM PDD) - Version 02 CDM – Executive Board page 39 YPL has therefore adopted the ‘Simple OM’ method, and the simple OM emission factor is calculated using “A 3-year average statistics”
Generation GWh State 2005 2004 2003
Delhi 11170.38 10593 8780 Haryana 9646.44 9792 8908 Himachal Pradesh 16020.29 11753 8735 Jammu & Kashmir 6405.24 7270 5983 Punjab 22087.95 25581 23690 Rajasthan 25933.43 23045 21861 Uttar Pradesh 73954.87 74345 73837 Uttaranchal 3577.23 3904 3770
Factor 2005 2004 2003 ∑ Fi,,j,y x COEF i,,j (tons/year)
142011855 138597138 133070105
∑ GEN i,,j (MU) 12521.85 121621 116701 ∑ EF OM,y (tCO2/yr) 1134 1139.6 1140 Average ∑ EF OM,y 1137.9 tCO2 / GWh
Step 2: Calculation of Build Margin Emission Factor for the region (ex-ante): The project developer has adopted option 1 (Ex-ante), which requires to calculate the Build Margin emission factor EFBM,y ex-ante based on the most recent information available on plants already built for sample group m at the time of PDD submission. The data used to determine the simple BM emission factor (EFBM,y )
Σ Fi,m, y * COEFi,m EFBM, y =
Σ GENm,y where Fi,m,y, COEFi,m are analogous to the variables described for the simple OM method above for plants m.
A 20% of grid (MU) 33759 B Plants meeting 20% (MU) 34041 C Last Five Plants Total (MU) 12432
For the YPL project, the sample group m that consists of (b) the power plants capacity additions in the electricity system that comprise 20% of the system generation and that have built most

PROJECT DESIGN DOCUMENT FORM (CDM PDD) - Version 02 CDM – Executive Board page 40 recently is adopted. Below is a list of power plants that comprises 20% of the system generation and which are built most recently.
Power Plants Fuel
Generation (GWh) 2005
Emission factor IPCC tCO2/GWh
Emissions tCO2 2005
Year of Commission
Pragati CCGT Gas HBJ 2550.7 687 1751935 2003 Chamera II Hydro 1347.3 0 0 2003 Naptha Jhakri Hydro 5109.48 0 0 2003 Kota Coal 4F 1470 1168 1717075 2003 Suratgharh Coal 2W 1955 1074 2100409 2003 Ramgharh ST Gas HBJ 17 687 11676 2003 Baspa Hydro 1193.16 0 0 2002 Upper sindh Hydro 177.45 0 0 2002 Sewa Hydro 10.17 0 0 2002 Suratgharh Coal 2W 1951 1074 2096111 2002 Ramgharh GT Gas HBJ 342.93 687 235540 2002 Panipat Coal 4F 1482 1463 2168290 2001 Malana Hydro 269.66 0 0 2001 Chenani Hydro 77.33 0 0 2001 Suratgharh Coal 2W 1876 1074 2015533 2001 F'Bad CCGT Gas HBJ 484 2000 Ghanvi Hydro 74.08 0 0 2000 Ranjit sagar Hydro 1144.56 0 0 2000 Suratgharh Coal 2W 1704 1074 1830740 2000 RAPS Nuclear 1470 0 0 2000 RAPS Nuclear 1649 0 0 2000 Tanda Coal 4F 809 1844 1491700 2000 Tanda Coal 4F 841 1844 1550704 2000 Tanda Coal 4F 836 1844 1541484 2000 Tanda Coal 4F 832 1844 1534109 2000 F'Bad CCGT Gas HBJ 3161.9 484 1528889 1999 Unchahar Coal 3E 1690 1168 1974053 1999
∑ Fi,,j,y x COEF i,,j (tons/year) 23548247 ∑ GEN i,,j (MU) 34041 ∑ EF BM,y (tCO2/yr) 691.77
Step 3 Baseline Emission Factor (EF,y) The baseline emission factor EF,y is calculated as the weighted average of the Operating Margin emission factor (EFOM, y) and the Build Margin emission factor (EFBM,y) , where the weights

PROJECT DESIGN DOCUMENT FORM (CDM PDD) - Version 02 CDM – Executive Board page 41 WOM and WBM, by default, are 50% and EFOM,,y and EFBM,y are calculated as described in steps 1 and 2 above and are expressed in tCO2/MU. EFgrid,,y = 0.5(EFOM, y +EFBM, y)
∑ EF BM,y 691.77 tCO2e/ GWh ∑ EF OM,y 1137.99 tCO2e/ GWh ∑ EFy (Avg of OM &BM) 914.88 tCO2e/Gwh
Determine the Emission Reductions The project activity mainly reduces CO2 emissions through substitution of power and heat generation with fossil fuels by energy generation with biomass. The emission reduction ERy by the project activity during a given year y is given by: ERy = ERheat,y + ERelectricity,y +BEbiomass,y - PEy - Ly Where ERheat,y are the emission reductions due to displacement of heat during the year y in tons of CO2, ERelectricity,y are the emission reductions through substitution of electricity generation with fossil fuels BEbiomass,y are the baseline emissions due to natural decay or burning of anthropogenic sources of
biomass during the year y in tons of CO2 equivalents, PEy are the project emissions Ly are emissions due to leakage Emission Reductions The total net emission reductions due to the project activity are presented in Section E.6.

PROJECT DESIGN DOCUMENT FORM (CDM PDD) - Version 02 CDM – Executive Board page 42
Annex 4
MONITORING PLAN The M & V Protocol provides a range of data measurement, estimation and collection options/techniques in each case indicating preferred options consistent with good practices to allow project managers and operational staff, auditors, and verifiers to apply the most practical and cost-effective measurement approaches to the project. The aim is to enable Yash Papers Limited’s (YPL) project activity to have a clear, credible and accurate set of monitoring, evaluation and verification procedures. The purpose of these procedures would be to direct and support continuous monitoring of project performance/key project indicators to determine project outcomes, greenhouse gas (GHG) emission reductions. The monitoring and verification system is mainly concerned with power for captive purpose, power for SRB unit and the power for auxiliaries. The Bagasse pith and the other biomass input are also to be monitored. The measurement of the quantity of biomass used will produce evidence that the energy is being generated with zero net CO2 emissions. The YPL’s project activity has employed the latest state of art monitoring and control equipment that measure, record, report, monitor and control various key parameters. Parameters monitored are the quantity and quality of biomass fuel used, total power generated, power for captive purposes, emissions from the project etc. These monitoring and controls will be the part of the Distributed Control System (DCS) of the entire plant. All monitoring and control functions will be done as per the internally accepted standards and norms of YPL. The instrumentation system of the YPL project activity will mostly comprise microprocessor – based instruments of reputed make with desired level of accuracy. All instruments will be calibrated and marked at regular intervals so that the accuracy of measurement can be ensured all the time. The Emission Reductions from the project activity mainly depends on the project emissions from GHG sources and baseline emissions due to the displacement of electricity in the grid system. GHG SOURCES 1. Project Emissions from the fossil fuel usage Project emissions arise from the usage of fossil fuel used in the boiler. The emissions mainly include CO2. The amount of fossil fuel used for starting up the boiler is monitored and corresponding emissions from the same will be deducted from the emission reductions. 2. Project Emissions from transportation of biomass Project emissions arise from transportation of biomass. The amount of biomass (rice husk) imported will be monitored daily and the number of trucks loading and unloading and the fuel consumed by the vehicles will be monitored daily and recorded. Since the Bagasse pith and black liquor are generated within the project boundary by the paper plant, the emissions from the same are not considered. It is estimated that the project emissions from the transport of biomass are based mainly on the quantity of biomass and the distance from collection centres to storage units at the plant.

PROJECT DESIGN DOCUMENT FORM (CDM PDD) - Version 02 CDM – Executive Board page 43 3. Project Emissions from the burning of biomass Project emissions mainly comprising of CH4 and CO2 emissions arise from the burning of biomass in the boiler. These emissions chiefly depend on the amount and type of biomass fed into the boiler 4. Baseline Emissions due to displacement of grid electricity As the number of units generated by the cogeneration plant and displaced electricity from the grid determine the emission reductions from the project, it becomes important for the project to monitor the net units generated on real time basis. Therefore the net electricity (captive needs for paper plant and SRB unit) multiplied by the baseline emission factor gives the baseline emission reductions. Project Parameters affecting Emission Reduction Monitoring Approach The general monitoring principles are based on:
Frequency Reliability Registration and reporting
Frequency of monitoring The project developer has installed all metering and check metering facilities within the plant premises. The measurement will be recorded and monitored on a continuous basis by the project developer through DCS. Reliability The amount of emission reduction is proportional to the net energy generation from the project. The reliability of the monitoring system is governed by the accuracy of the measurement system and the quality of the equipment to produce the result all power measuring instruments is calibrated once a year for ensuring reliability of the system. Therefore the system ensures the final generation is highly reliable. Registration and reporting Registration of date is done on-line in the control cabin through a microprocessor. However, data will also be logged on an hourly basis in addition to that available on system memory. Daily, weekly and monthly reports of the generation are prepared. The power generation and certification of the same will be done by YPL. The other major factors which need to be ensured and monitored are: the consumption of biomass fuel for power generation, power for the paper plant, power for auxiliary purpose and the parameters that would ensure smooth and regular operation of the cogeneration. No other project specific indicators are identified that affect the emission reductions claims. Biomass Requirement and Utilization
PROJECT DESIGN DOCUMENT FORM (CDM PDD) - Version 02 CDM – Executive Board page 44 Availability of Biomass The major fuels used by the cogeneration power plant are rice husk and Bagasse pith. The Bagasse pith after paper processing will be supplied to cogeneration plant and the biomass will be procured from the market. Hence, production of electricity mainly depends on the biomass fed to the boiler. Quantity of the biomass fuel used in the boiler The biomass from the market will be first dumped in the fuel storage area from where it will be taken to the fuel processing machinery with the help of conveyor belts. The processed fuel from the machinery is delivered to boiler bunkers, again on conveyor belts and subsequently to the boiler. This section of conveyor belts is equipped with a metal detector, tramp iron detector, magnetic separator and online weighing systems. The purpose these detectors and magnetic separators is to detect and remove any metal particles that are present in the boiler feed steam. The purpose of the online weighing system is to measure and record the quantity of fuel being fed into the boiler and also to transmit the data to the control systems (DCS) for monitoring purposes. This weighing system is calibrated on a regular basis to ensure system accuracy. The main type of fuel proposed for the power generation is only rice husk and bagasse pith. The properties of the biomass fuels like ultimate analysis, calorific value, ash composition etc. are already established and will be consistent in the region. However, it is proposed to monitor these properties of biomass fuels by taking samples at random from the processed fuel stream so that in case of any drastic change in the properties of the fuel, corrective actions can be taken. The measurement of fuel properties like ultimate analysis, calorific value etc. will be done at reputed laboratories as per international practices and date or documents will be kept open to verifiers. The data will also be computerized and monitored through management information system of the DCS. The operational parameters of the YPL project activity are as follows: Total Power Generated The total power generated by the power project will be measured in the plant premises to the best accuracy and will be recorded, monitored on a continuous basis through DCS. Power consumed by the plant auxiliaries The power consumed by plant auxiliaries will be recorded to the best accuracy in the plant premises. The total quantum of power consumed by the auxiliaries would affect the total power supplied to the paper plant and therefore the amount of GHG reductions. Hence any increase in the consumption pattern of the auxiliary system would be attended to. Power consumed by the paper plant As explained, power consumption of the paper plant will also be recorded as accurately as possible and any anomalies will be attended to. Efficiency of the cogeneration project activity, major equipments like boiler & STG

PROJECT DESIGN DOCUMENT FORM (CDM PDD) - Version 02 CDM – Executive Board page 45 High-pressure boiler operating at 65 kg/cm2 at 465oC is being used by the project. The performance of the boiler is already predicted and can be verified. However, the boiler proposed for the project is a multi-fuel fired boiler, which can use almost any type of biomass fuel. The design of the boiler is such that any change in the fuel type will not lead to any adverse effect on the performance and life cycle of the boiler. The inlet and outlet steam parameters will be measured and monitored along with the parameters of fuel and feed water. Based on the measured input and output parameters cogeneration system efficiency of boiler and STG will be calculated and monitored by DCS. In case of any irregularity, the root cause of the deviations would be identified and the necessary corrective actions will be taken. All the above parameters/factors will demonstrate the performance of the project at any point of time. Verification The performance of the biomass based power project leads to CO2 emission reductions. In other words, longer the operational life of the cogeneration power plant, more would be the emission reductions. The project control system comprises a state-of-the-art sophisticated control and monitoring system like Distributed Control System which measures, records, monitors and controls the various process parameters on a continuous basis. Fully functional management information systems are built in DCS so that accessing and verification of actual data are possible at any point of time. The major activities to be verified are as under
- Verification of various measurement and monitoring methods - Verification of instrument calibration methods - Verification of data generated by DCS - Verification of measurement accuracy
Similar to above activities, following major project parameters which affect the emission claims need to be verified, based on the available operating data as follows:
- Biomass residues by paper unit - Quantity of the biomass fuel - Efficiency of project activity - Total generation of power and captive & auxiliary power requirements

PROJECT DESIGN DOCUMENT FORM (CDM PDD) - Version 02 CDM – Executive Board page 46
Annex 5
EMISSION REDUCTIONS The project activity mainly reduces CO2 emissions through substitution of power and heat generation using fossil fuels by energy generation with biomass. The emission reduction ERy by the project activity during a given year Y is given by: ERy = ERheat,y + ERelectricity,y +BEbiomass,y - PEy - Ly Where ERheat,y are the emission reductions due to displacement of heat during the year y in tons of CO2, ERelectricity,y are the emission reductions through substitution of electricity generation with fossil fuels BEbiomass,y are the baseline emissions due to natural decay or burning of anthropogenic sources of
biomass during the year y in tons of CO2 equivalents, PEy are the project emissions in tons for the year Y Ly are emissions due to leakage in tons for the year Y Baseline emissions due to the natural decay or uncontrolled burning of anthropogenic sources of biomass (BE Biomass,y)
In the absence of the project activity, excess of biomass would have been stored openly on-site for use (start up operations) during season, which often results in burning of bagasse in an uncontrolled manner due to the storage area being unattended to (e.g ignition from remote sources). To account for the associated emissions from methane, the methodology assumes that the biomass would have been burned in an uncontrolled manner for both baseline scenarios (natural decay and uncontrolled burning). Thus, for scenario 16,
BEBiomass,y= GWPCH4 * ∑BFi,y * NCVi * EFburning,CH4,i where: BEBiomass,y are the baseline emissions due to natural decay or burning of anthropogenic sources of biomass during the year y in tons of CO2 equivalents, GWPCH4 is the Global Warming Potential for methane valid for the relevant commitment period, BFi,y is the quantity of biomass type i used as fuel in the project plant during the year y in a volume or mass unit, NCVi is the net calorific value of the biomass type i in terajoules (TJ) per mass or volume of biomass, EFburning,CH4,i is the CH4 emission factor for uncontrolled burning of the biomass type i in tons CH4 per TJ. Emission Reductions or increase due to displacement of heat (ERheat,y): In case of scenario 16, the baseline scenario is that heat generated by the cogeneration project plant would in the absence of the project activity be generated in both fossil fuel fired boilers and heat only boilers fired with biomass type(s) that are also used in the project plant. ERheat,y = Qy * COEFi / [εboiler * NCVi ] Qy = Min {[Qproject plant,y], [Qtotal,y – (Qhistoric,3yr)/3]} - (Qbiomass,historic,3yr)/3

PROJECT DESIGN DOCUMENT FORM (CDM PDD) - Version 02 CDM – Executive Board page 47 Qbiomass,historic,3yr = εboiler biomass∑ BFk,boiler,historic,3yr * NCVi or k where: ERheat,y are the emission reductions due to displacement of heat during the year y in tons of CO2, Qy is the quantity of increased heat generation in the project plant (incremental to heat generation in any existing cogeneration plants) that displaces heat generation in fossil fuel fired boilers during the year y in MWh, Qproject plant,y is the net quantity of heat generated in the cogeneration project plant from firing biomass residues during the year y in MWh14, Qtotal,y is the net quantity of heat generated in all cogeneration units at the project site, generated from firing the same type(s) of biomass as in the project plant, including the cogeneration unit installed as part of the project activity and any previously existing units, during the year y in MWh, Qhistoric,3yr is the net quantity of heat generated during the most recent three years in all cogeneration plants at the project site, generated from firing the same type(s) of biomass as in the project plant, in MWh, Qbiomass,historic,3yr is the net quantity of heat generated during the most recent three years in all boilers at the project site, generated from firing the same type(s) of biomass as in the project plant, in MWh, εboiler is the energy efficiency of the boiler that would be used in the absence of the project activity, εboiler biomass is the energy efficiency of the biomass fired boiler that would be used in the absence of the project activity, BFk,boiler,historic,3yr is the quantity of biomass type k that has been fired in boilers for heat generation during the most recent three years at the project site, in a volume or mass unit, NCVi or k is the net calorific value of the fossil fuel type i or biomass fuel type k MWh per volume or mass unit, and COEFi is the CO2 emission factor of the fossil fuel type i fired in the boiler in the absence of the project activity in tons CO2 / mass or volume unit of the fuel. Baseline emissions from displacement of grid-electricity (ERelectricity,y) Emission reductions due to the displacement of electricity are calculated by multiplying the net quantity of electricity generated with biomass as a result of the project activity (EGy) with the CO2 baseline emission factor for the electricity displaced due to the project (EFgrid,y), as follows: ERelectricity,y = EGy * EFgrid,y Where: ERelectricity,y are the emission reductions due to displacement of electricity during the year y in tons of CO2 EGy is the net quantity of electricity generation as a result of the project activity during the year y in MWh, EFgrid,y is the CO2 baseline emission factor where part of the electricity displaced due to the project activity during the year y in tons CO2/MWh. (1) Electricity generation from the project activity (EGy) As per the ACM 0006, EGy corresponds to the lower value between (a) the net quantity of electricity generated in the new power unit that is installed as part of the project activity and (b) the difference

PROJECT DESIGN DOCUMENT FORM (CDM PDD) - Version 02 CDM – Executive Board page 48 between the total net electricity generation from firing the same type of biomass at the project site and the historical generation of the existing power unit(s), based on the three most recent years, as follows: EGy = Min {[EGproject plant,y], [EGtotal,y – (EGhistoric,3yr)/3]} Where: EGy is the net quantity of increased electricity generation as a result of the project activity (incremental to baseline generation) during the year y in MWh, EGproject plant,y is the net quantity of electricity generated in the project plant during the year y in MWh EGtotal,y is the net quantity of electricity generated in all power units fired with the same type of biomass at the project site, including the new power unit installed as part of the project activity and any previously existing units, during the year y in MWh, EGhistoric,3yr is the net quantity of electricity generated during the most recent three years in all power plants fired with the same type of biomass at the project in MWh, (2) Determination of Baseline Emission Factor (EFgrid,,y) The baseline emission factor (EFgrid,y) of the chosen grid is calculated as combined margin (CM), consisting of the combination of operating margin (OM) and build margin (BM) factors following the guidelines in the section “Consolidated baseline methodology for grid-connected electricity generation from renewable sources” (ACM 0002). Step 1: Operating Margin emission factor (EFOM,y) The operating margin emission factor can be calculated based on one of the four methods: (a) Simple OM, or (b) Simple adjusted OM, or (c) Dispatch Data Analysis OM, or (d) Average OM. As mentioned in the methodology, ‘Dispatch Data Analysis’ should be the first methodological choice. However, this method is not selected for OM emission factor calculations due to non-availability of activity data. ‘Simple OM’ method is adopted to project activity connected to the grid electricity system where the low-cost/must run resources constitutes less than 50% of the total grid generation. The simple OM emission factor (EFOM, simple,y) is calculated as the generation-weighted average emissions per electricity unit (tCO2/MU) of all generating sources serving the system, not including low-operating cost and must-run power plants. The detailed baseline information is given in Annex 3. Step 2: Build Margin emission factor (EFBM,y) The methodology suggests the project proponent to choose one of the two options available to calculate the Build Margin Emission Factor (EFBM,y): Option 1. Calculate the Build Margin emission factor EFBM,y ex-ante based on the most recent information available on plants already built for sample group m at the time of PDD submission. The sample group m consists of either the five power plants that have been built most recently or the power

PROJECT DESIGN DOCUMENT FORM (CDM PDD) - Version 02 CDM – Executive Board page 49 plants capacity additions in the electricity system that comprise 20% of the system generation, which have been built most recently. Option 2. For the first crediting period, the Build Margin emission factor EFBM,y must be updated annually ex-post for the year in which actual project generation and associated emissions reductions occur. For subsequent crediting periods, EFBM,y should be calculated ex-ante, as described in option 1 above. The sample group m consists of either the five power plants that have been built most recently or the power plants capacity additions in the electricity system that comprise 20% of the system generation and that have been built most recently. Project participants should use from these two options that sample group that comprises the larger annual generation. The project developer has adopted option 1, which requires to calculate the Build Margin emission factor EFBM,y ex-ante based on the most recent information available on plants already built for sample group m at the time of PDD submission. The data used to determine the simple BM emission factor (EFBM,y ex-ante) Step 3: Baseline emission factor (EFgrid,,y) The baseline emission factor EFgrid,,y is calculated as the weighted average of the Operating Margin emission factor (EFOM, simple,y) and the Build Margin emission factor (EFBM,y) , where the weights WOM and WBM, by default, are 50% and EFOM, simple,y and EFBM,y are calculated as described in steps 1 and 2 above and are expressed in tCO2/MU. Project Emissions (PEy) Project emissions include CO2 emissions from transportation of biomass to the project site (PETy) and CO2 emissions from on-site consumption of fossil fuels due to the project activity (PEFFy) and, where this emission source is included in the project boundary and relevant, CH4 emissions from the combustion of biomass (PEBiomass, CH4, y): PEy = PETy + PEFFco2, y + GWPCH4 * PEBiomass, CH4, y Where: PETy are the CO2 emissions during the year y due to transport of the biomass to the project
plant in tons of CO2, PEFFCO2, y are the CO2 emissions during the year y due to fossil fuels co-fired by the generation
facility in tons of CO2, GWPCH4 is the Global Warming Potential for methane valid for the relevant commitment period, PEBiomass, CH4, y are the CH4 emissions from the combustion of biomass during the year y. Project emissions from Biomass transportation to the Power plant (PETy) As per the proposed baseline methodology, the CO2 emissions associated with the transport of Biomass from suppliers to the power plant are to be taken into consideration as a part of the project emissions. The total quantity of biomass (Rice Husk) procured from outside is 80000TPA. The Biomass pith and Strong Black Liquor are generated at the project plant. Therefore no emissions from these biomass residues are calculated.

PROJECT DESIGN DOCUMENT FORM (CDM PDD) - Version 02 CDM – Executive Board page 50 The project participants have chosen the Option 1 (based on the transportation distance and the number of trips) for calculating the project emissions from the combustion of fossil fuels for transportation of biomass to the project plant. PETy. = Ny * AVDy * EFkm,CO2where: Ny is the number of truck trips during the period y. AVDy is the average return trip distance between the biomass fuel supply sites and the site of the project plant in kilometers (km), EFkm,CO2 is the average CO2 emission factor for the trucks measured in t CO2/km, and Ny is the number of truck trips during the period y AVDy is the average return trip distance between the biomass fuel supply sites and the site of the project plant in kilometers (km) EFkm,CO2 is the average CO2 emission factor for the trucks measured in t CO2/km is given as The project promoters have considered the project emissions from the transportation of biomass from the supply sites to the project plant and the same is presented in Section E. Project emissions from combustion of fossil fuel in the power plant (PEFFCO2, y) There will be no fossil fuel consumption in the plant therefore no carbon dioxide emissions from the combustion of such fossil fuels be accounted for. Methane emissions from combusting of biomass (PEBiomass, CH4, y) As per the proposed baseline methodology, the CH4 emissions associated with the uncontrolled combustion of biomass are to be taken into consideration as a part of the project emissions. PEBiomass, CH4, y = EFCH4 ∑ BFi,y * NCVi where: BFi,y is the quantity of biomass type i used as fuel in the project plant during the year y in a volume or mass unit, NCVi is the net calorific value of the biomass type i in terajoules (TJ) per mass or volume of biomass, EFCH4 CH4 emission factor for the combustion of biomass in the project plant tons CH4 per TJ. Leakage (Ly) As mentioned in ACM 0006 (scenarios 16), project participants shall demonstrate that the use of the biomass residues does not result in increased fossil fuel consumption elsewhere. For this purpose, project participants assessed as part of the monitoring the supply situation for the types of biomass used in the project plant. The following option is used to demonstrate that the biomass used in the plant does not increase fossil fuel consumption elsewhere: L2: “Demonstrate that there is an abundant surplus of the biomass in the region of the project activity which is not utilized. For this purpose, demonstrate that the quantity of available biomass in the region is at least 25% larger than the quantity of biomass that is utilized (e.g. for energy generation or as feedstock), including the project plant”.

PROJECT DESIGN DOCUMENT FORM (CDM PDD) - Version 02 CDM – Executive Board page 51 The project will be generating power by using crop residues and agro industries residue available in the surrounding area. The project participant covered a distance of 50 km radius around the project activity for biomass transports. Biomass assessment was carried out in three zones of 15 kms radius, 15 to 25 kms radius and 25 to 50 kms radius. The basic objective of the study was to assess the biomass resources availability, their consumption and therefore, the surplus biomass availability. This objective was kept in mind while devising the methodology and the same is presented in Section E. Emission Reductions The total net emission reductions due to the project activity are presented in Section E.6.