clean development mechanism project design document … pdd ver02.1 090402.pdf · clean development...
TRANSCRIPT

PROJECT DESIGN DOCUMENT FORM (CDM PDD) - Version 03
CDM – Executive Board page 1
CLEAN DEVELOPMENT MECHANISM PROJECT DESIGN DOCUMENT FORM (CDM-PDD)
Version 03 - in effect as of: 28 July 2006
CONTENTS A. General description of project activity B. Application of a baseline and monitoring methodology C. Duration of the project activity / crediting period D. Environmental impacts E. Stakeholders’ comments
Annexes Annex 1: Contact information on participants in the project activity Annex 2: Information regarding public funding Annex 3: Baseline information
Annex 4: Monitoring plan

PROJECT DESIGN DOCUMENT FORM (CDM PDD) - Version 03
CDM – Executive Board page 2 SECTION A. General description of project activity A.1. Title of the project activity: Xuzhou Landfill Gas Utilisation Project Version number of the document: 02 Date of completion: 02/04/2009
Version number Date Reason for changes
01 22/12/06 Initial PDD for GSP1
02 02/04/09 New data from FSR
A.2. Description of the project activity: Xuzhou Landfill Gas Utilisation Project (hereafter referred to as the “Project”) is located in Yanqun Village within Jiangsu Province. The landfill was opened in 2005 with a designed lifetime of 16 years. It covers an area of 40 hectares with a total storage capacity of 4,800,000m3. In its first year it received around 600 tonnes of waste daily, since then tipped waste has increased by 5% yearly and should continue to do so till closure. The Project activity will use Sindicatum Carbon Capital (SCC) state of the art proprietary LFG gas collection system. The gas collection system will include flaring equipment and power generation sets which will be installed and operated next to the landfill. According to the “Tool to determine methane emissions avoided from disposal of waste at a solid waste disposal site” ver04 the total volume of collected methane will be sufficient for the installation of 4 gas engines, each with a capacity of about 1.063MW. The collected gas will be utilised in gas engines each with a unit capacity of approximately 1MW and generate power, and any excess gas will be flared initially in an enclosed flare with a capacity of 1500 Nm3/h. The electricity generated by the Project will be delivered to the East China Power Grid via the Jiangsu Power Grid. Greenhouse gas (GHG) emission reductions will be achieved by maximum destruction of methane between the power generators and the flare. GHG emission reductions will also be achieved by displacing coal generated grid power in the East China Power Grid. The total estimated GHG emission reductions for the first crediting period is 1,438,580tCO2e in the crediting period. The project activity will result in a number of benefits for the city of Xuzhou and the project owners, as follows: Environmental benefits:
• The project will significantly improve local air quality; • The project will create global benefits through a reduced impact upon climate change; and • The project activity will ensure that the landfill is appropriately managed so as to optimise
landfill gas recovery. 1 http://www.netinform.net/KE/Wegweiser/Guide2_1.aspx?ID=2448&Ebene1_ID=26&Ebene2_ID=729&mode=1

PROJECT DESIGN DOCUMENT FORM (CDM PDD) - Version 03
CDM – Executive Board page 3 Social impacts:
• Improved air quality, through the reduction of odours, will have a marked impact upon the quality of life for those in the neighbouring communities;
• The utilisation of a renewable energy source to generate electricity will contribute to China’s sustainable development;
• Collection of the landfill gas will improve the safety aspects of the landfill, namely by reducing the dangers associated with the combustion and explosion of methane pockets; and
• The project will also create employment opportunities through the construction, operation and continuous monitoring of the project.
Economic impacts:
• The landfill operators will benefit from an additional source of revenue, which helps to secure their future and the continued provision of sanitary waste disposal; and
• Employment opportunities will be created through the construction, operation and continuous monitoring of the project activity.
A.3. Project participants:
Name of Party Involved (*) (host indicates a host
Party)
Private and/or public entity (is project participants (as applicable)
Indicate if the Party involved wishes to be considered as project participant (Yes/No)
The People’s Republic of China (host)
Xuzhou Smart Energy Environmental Protection Power Generation Co., Ltd.
No
UK (Annex I) Sindicatum Carbon Capital Ltd. (SCC) No A.4. Technical description of the project activity: A.4.1. Location of the project activity: A.4.1.1. Host Party(ies): The People’s Republic of China A.4.1.2. Region/State/Province etc.: Jiangsu Province A.4.1.3. City/Town/Community etc.: Yanqun Village, Dapeng Township, Tongshan County, Xuzhou City A.4.1.4. Details of physical location, including information allowing the unique identification of this project activity (maximum one page): The Project is sited at Xuzhou Yanqun Municipal Waste Sanitary Landfill in Yanqun Villige, to the west of Xuzhou City, Jiangsu Province. The landfill is approximately 20km from downtown Xuzhou and can be easily reached via the No. 310 national highway.

PROJECT DESIGN DOCUMENT FORM (CDM PDD) - Version 03
CDM – Executive Board page 4 The geographic coordinates of the project are 34°17.355N, 116°58.368E
Figure A.4-1. Location of Jiangsu province and Xuzhou city
Figure A.4-2. The location of the project activity

PROJECT DESIGN DOCUMENT FORM (CDM PDD) - Version 03
CDM – Executive Board page 5 A.4.2. Category(ies) of project activity: Sectoral Category 13 - Waste Handling and Disposal Sectoral Category 1 – Energy industries (renewable - / non-renewable sources) A.4.3. Technology to be employed by the project activity: The introduction of Sindicatum Carbon Capital proprietary LFG collection system to utilize LFG will directly transfer know-how of the project by training the local staff employed. Indirectly, it may bring new perspective in domestic waste handling in China. The scenario existing prior to the start of the implementation of the project activity is the atmospheric release of the landfill gas and existing and/or new grid connected power plants. Therefore, there is no list of equipments & systems in operation under this scenario. These existing scenarios are also the only remaining credible and plausible scenarios, and have been identified as the baseline scenario. The scope of project activity as illustrated by figure 3, the project will extract, capture and utilize landfill gas (LFG) from Xuzhou Landfill to generate electricity. The electricity generated will be exported to the Thailand grid. Whenever there is surplus LFG due to engine maintenance or other site factors, LFG will be sent to an enclosed ground flare or flares where the gas will be flared thus minimising methane emissions and maximising carbon abatement. Project activity will use Sindicatum Carbon Capital (SCC) state of the art proprietary LFG gas collection system that has been developed for Asian landfill sites. The design takes into account the different waste composition, climatic conditions and tipping practices of landfill sites in the China region when compared with more conventional systems and designs. The LFG system will form an integral part of the overall landfill operation and modifications will be made to the current tipping practice to enhance gas generation and recovery by improving surface water and leachate management. The performance of the LFG design will be continually assessed to ensure optimum LFG recovery, and where required modified to reflect actual site conditions and changes in waste composition and/or daily tipping rates. Landfill gas collection system: High density polyethylene (HDPE) horizontal collection pipes will be installed in the waste as an integral part of the tipping operation, these collection wells may be augmented by additional horizontal and vertical collection wells if required to maximise gas recovery and optimise carbon abatement. The collection pipes will be connected via main carrier pipes to the LFG extraction plant and a negative suction pressure applied. The LFG, comprising approximately 50% methane and 50% carbon dioxide will be used for power generation with any surplus gas flared. SCC proprietary LFG system has been design to optimise LFG recovery and utilisation and optimise carbon abatement, and is designed to overcome inherent problems associated with LFG projects in similar conditions. The recovered LFG will pass through the pre-treatment plant where moisture and particulates will be removed prior to the power generating engine. The specification of the pre treatment plant will be designed to ensure that the gas quality reaching the engines is in line with the manufacture requirements. A schematic layout of the pre treatment and utilisation plant is shown in Figure 2 below. Power generation units will be installed in line with electrical infrastructure capacity and also to match the LFG recovery profile, as more LFG is generated additional engines will be added to the project, sufficient

PROJECT DESIGN DOCUMENT FORM (CDM PDD) - Version 03
CDM – Executive Board page 6 flare capacity will be installed to ensure that any surplus LFG is flared if engine capacity is insufficient or during periods of maintenance or breakdown . The interface control and system management will be designed to allow real time adjustment of system performance thus optimising gas utilisation and carbon abatement. LFG generator sets: After the LFG has passed through the pre treatment plant the gas will be sent to spark ignition power generation units. The electricity produced will be distributed to the grid. The specification for the gas engine & generator set is a subject that might be changed in accordance to the design. For the ex-ante emission reduction calculation, it is assumed that manufacturer’s specification for gas engine & generator set is as follow:
Table A.4-1 Specifications for the generator sets
Item Data Gas engine Model J320C121 (Jenbacher) Generator Model J320C121 Rated power 1.063MW Rated rotating speed 1500rpm
Flaring system:
As described above there may be situations where there is surplus LFG that can not be used for power generation, under these conditions the surplus gas will be destroyed by a ground flare. The design will allow real time interface between the engines and flares to optimise the destruction of LFG. The flare considers the capacity to replace 1 generator set to flare the LFG in the case of troubleshooting & maintenance.
The flare installation used by this project meets all of the necessary conditions that are required by “Tool to determine project emissions from flaring gases containing methane”. The flaring system will be equipped with a monitoring system to measure the flow, the pressure, methane concentration and the temperature in order to comply with the tool. Below is summary of the technical specification of the initial flaring system.
Table A.4-2 Technical specifications for the Enclosed Flare
Item Data Capacity (Nm3/h) 1500 Flare temperature (°C) ≥500 Methane combustion efficiency (%) >98% Manufacturer Shunfeng Pioneer
The lifetime of the equipment is expected to meet the period of total crediting period. The emission sources and green house gases (GHGs) involved in the project activity as illustrated in figure 2 are:

PROJECT DESIGN DOCUMENT FORM (CDM PDD) - Version 03
CDM – Executive Board page 7
1. CH4 emission from decomposition of waste at the landfill site 2. CO2 emission from grid electricity consumption
Baseline scenario has identified as LFG2 (partial capture of LFG and destruction) and P6 (existing and/or new grid connected power plants). In Xuzhou existing operated landfill, LFG is vented to atmosphere to avoid structural failure of the retaining waste wall. Project activity undertaken without CDM is not economically feasible. Since there is no utilization of heat from LFG in the project activity, emission from cogen is not considered. The increasing price of fossil fuel has made the fossil fuel fired captive power plant is not preferable. Sources of renewable sources such as wind, hydro and biomass are not available at sufficient level; therefore renewable based captive power plant is also not preferable. Detailed process determination of baseline can be found at section B4.
A.4.4. Estimated amount of emission reductions over the chosen crediting period: A fixed crediting period (10yrs×1) has been chosen for the Project. It is expected that the project will reduce 1,438,580tCO2e over the first crediting period from September, 2009 to August, 2019.
Year Ex-ante estimation of emission reduction in tCO2e
2009 (Sept-Dec) 26,845
2010 91,021
2011 101,164
2012 119,857
2013 132,396
2014 144,847
2015 157,304
2016 167,776
2017 177,658
2018 187,715
2019 (Jan- Aug) 131,997
Total estimated reductions over the first crediting period (tonnes of CO2e)
1,438,580
Total number of years in the first crediting period 10 Annual average over the first crediting period of estimated reductions (tonnes of CO2e) 143,858
A.4.5. Public funding of the project activity: No public funding from Annex I countries is involved in the project activity.

PROJECT DESIGN DOCUMENT FORM (CDM PDD) - Version 03
CDM – Executive Board page 8 SECTION B. Application of a baseline and monitoring methodology B.1. Title and reference of the approved baseline and monitoring methodology applied to the project activity:
ACM0001 “Consolidated baseline and monitoring methodology for landfill gas project activities” (version 010)
“Tool for the demonstration and assessment of additionality” (version 05.2); “Tool to determine project emissions from flaring gases containing methane”; “Tool to calculate baseline, project and/or leakage emissions from electricity consumption”; “Tool to calculate the emission factor for an electricity system” (version 01.1); “Tool to determine methane emissions avoided from dumping waste at a solid waste disposal
site” (version 04).
Detailed information regarding these methodologies and tools please refer to http://cdm.unfccc.int/methodologies/approved. B.2. Justification of the choice of the methodology and why it is applicable to the project activity: ACM0001 is applicable to landfill gas capture project activities, where the baseline scenario is the partial or total atmospheric release of the gas and the project activities include situations such as: a) The captured gas is flared; and/or b) The captured gas is used to produce energy (e.g. electricity/thermal energy); c) The captured gas is used to supply consumers through natural gas distribution network. The baseline scenario of the project activity is total atmospheric release of the LFG. The project activity fulfils conditions a) and b) thus ACM0001 was considered the most appropriate methodology. B.3. Description of the sources and gases included in the project boundary: The project boundary includes landfill gas capturing, delivering system, generator sets, an enclosed flare, auxiliary facilities and all of the power plants equipment that is connected to the East China Power Grid.
Landfill LFG production
Fugitive emissions
LFG collection
Flaring
Power generation
Auxiliary usage
Delivery to the ECPG
PROJECT DESIGN DOCUMENT FORM (CDM PDD) - Version 03
CDM – Executive Board page 9
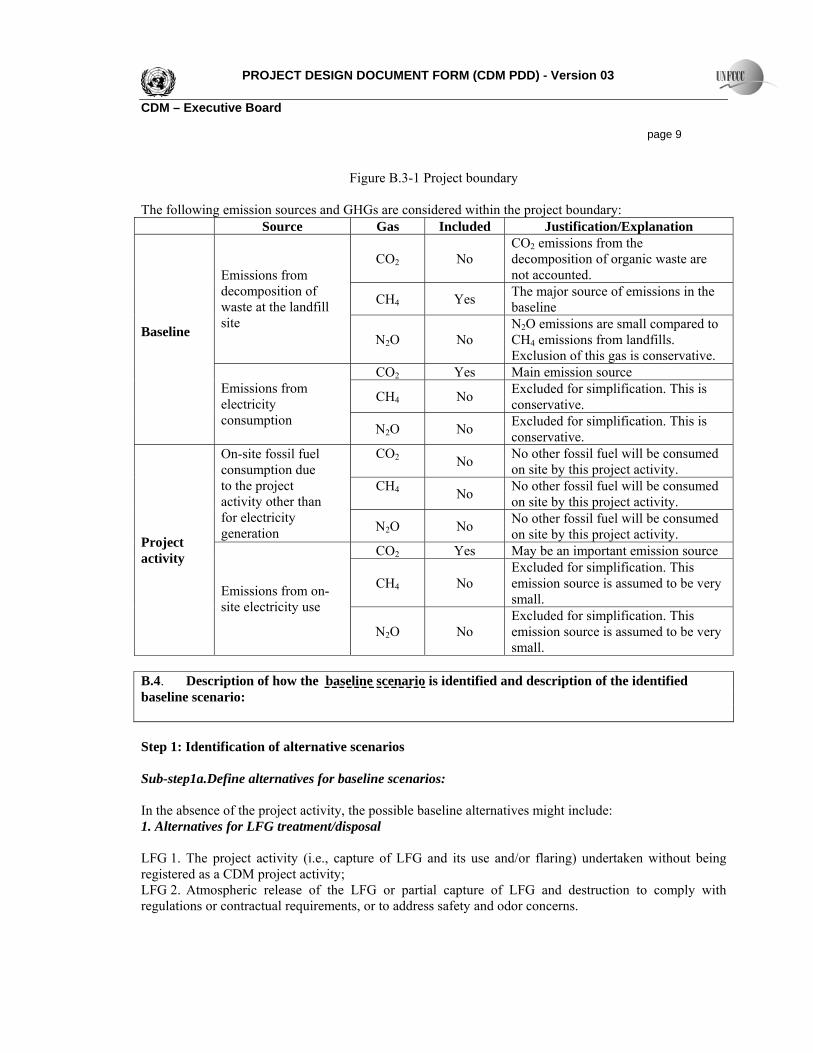
Figure B.3-1 Project boundary
The following emission sources and GHGs are considered within the project boundary: Source Gas Included Justification/Explanation
CO2 No CO2 emissions from the decomposition of organic waste are not accounted.
CH4 Yes The major source of emissions in the baseline
Emissions from decomposition of waste at the landfill site
N2O No N2O emissions are small compared to CH4 emissions from landfills. Exclusion of this gas is conservative.
CO2 Yes Main emission source
CH4 No Excluded for simplification. This is conservative.
Baseline
Emissions from electricity consumption N2O No Excluded for simplification. This is
conservative. CO2
No No other fossil fuel will be consumed on site by this project activity.
CH4 No No other fossil fuel will be consumed
on site by this project activity.
On-site fossil fuel consumption due to the project activity other than for electricity generation N2O No No other fossil fuel will be consumed
on site by this project activity. CO2 Yes May be an important emission source
CH4 No Excluded for simplification. This emission source is assumed to be very small.
Project activity
Emissions from on-site electricity use
N2O No Excluded for simplification. This emission source is assumed to be very small.
B.4. Description of how the baseline scenario is identified and description of the identified baseline scenario: Step 1: Identification of alternative scenarios Sub-step1a.Define alternatives for baseline scenarios: In the absence of the project activity, the possible baseline alternatives might include: 1. Alternatives for LFG treatment/disposal LFG 1. The project activity (i.e., capture of LFG and its use and/or flaring) undertaken without being registered as a CDM project activity; LFG 2. Atmospheric release of the LFG or partial capture of LFG and destruction to comply with regulations or contractual requirements, or to address safety and odor concerns.

PROJECT DESIGN DOCUMENT FORM (CDM PDD) - Version 03
CDM – Executive Board page 10 2. Alternatives for power generation P1. Power generated from landfill gas undertaken without being registered as a CDM project activity; P2. Existing or construction of a new on-site or off-site fossil fuel fired cogeneration plant; P3. Existing or construction of a new on-site or off-site renewable-based cogeneration plant; P4. Existing or construction of a new on-site or off-site fossil fuel-fired captive power plant; P5. Existing or construction of a new on-site or off-site renewable-based captive power plant; P6. Power supply from the East China Power Grid. There are no renewable energy resources (such as wind power, hydro-power and bio-mass power) that can be commercially developed in the region where this project is located. So, P3 and P5 are not realistic and credible alternatives to the baseline scenarios. Realistic and credible baseline scenarios, therefore, are LFG1, LFG2, P1, P2, P4 and P6. Sub-step1b. Consistency with mandatory laws and regulations: The following regulations in the Host Country Party dealing with the management of landfills and LFG are applicable to the project activity: • “Pollution Control Standards for Municipal Waste Landfills (GB16889-2008)”2 • “Technical Regulations on Sanitary Landfills for Municipal Wastes (CJJ17-2004)”3 The aforementioned two regulations only require fire and explosion control measures to be followed to ensure basic safety. There is currently no mandatory requirement for LFG collection and utilization hence there is no combustions or utilization of methane in the baseline. Therefore, Alternatives LFG1 and LFG2 comply with all of the applicable laws and regulations, but LFG1 is not mandated by the laws and regulations. P1 complies with all laws and regulations, but is not mandatory according to the laws and regulations. P2: There is no existing on-site or off-site fossil fuel-fired cogeneration plant. NDRC and the Ministry of Construction issued the document, “Temporary Provisions on Cogeneration and Gangue Utilization for power generation,”4 in which Clause 9 regulates that “in areas without central heat supply, no cogeneration projects will be constructed,” and Clause 10 regulates that “in warm areas, except for industrial areas, no other heat supply sets will be constructed.” Xuzhou city is considered to be located in a warm area without central heat, both Clause 10 and Clause 9 apply. P2 does not meet the requirement of laws and regulations, and should be eliminated.
2 http://www.msw.com.cn/ArticleShow.asp?ArticleID=1743 3 http://www.gfjl.org/home/dp-bbsthread-62045.html 4 http://www.sdpc.gov.cn/zcfb/zcfbtz/2007tongzhi/W020070131600619038667.doc
PROJECT DESIGN DOCUMENT FORM (CDM PDD) - Version 03
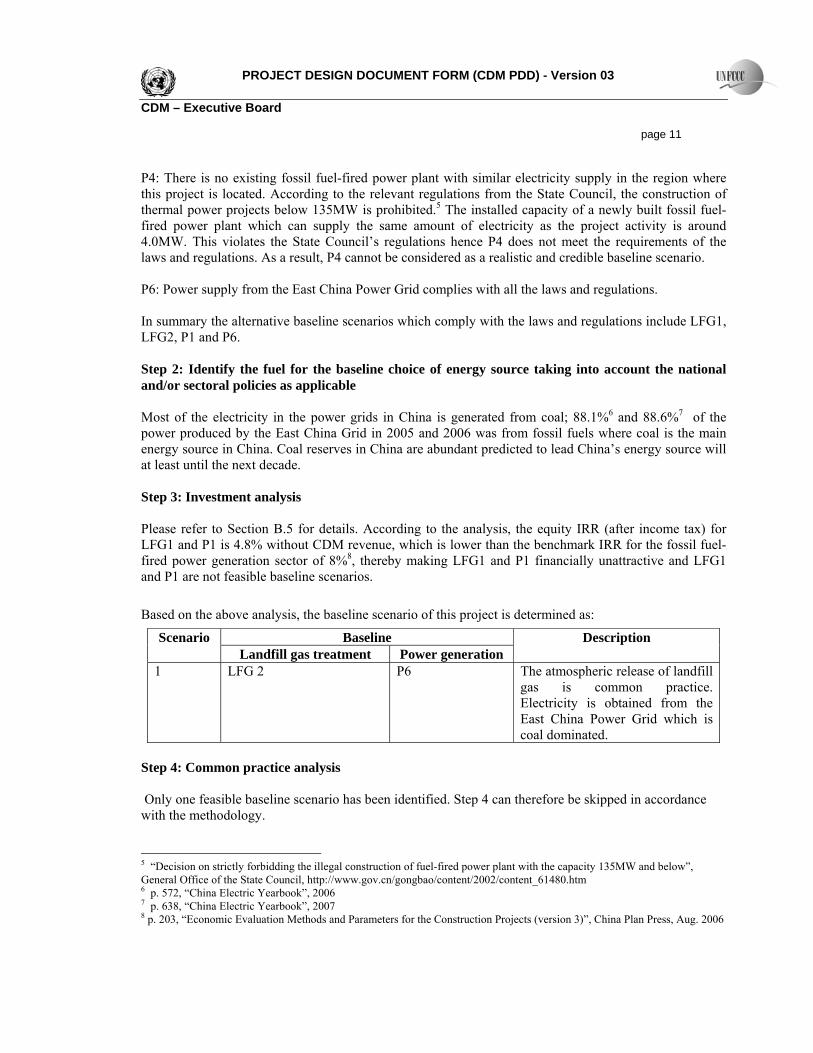
CDM – Executive Board page 11 P4: There is no existing fossil fuel-fired power plant with similar electricity supply in the region where this project is located. According to the relevant regulations from the State Council, the construction of thermal power projects below 135MW is prohibited.5 The installed capacity of a newly built fossil fuel-fired power plant which can supply the same amount of electricity as the project activity is around 4.0MW. This violates the State Council’s regulations hence P4 does not meet the requirements of the laws and regulations. As a result, P4 cannot be considered as a realistic and credible baseline scenario. P6: Power supply from the East China Power Grid complies with all the laws and regulations. In summary the alternative baseline scenarios which comply with the laws and regulations include LFG1, LFG2, P1 and P6. Step 2: Identify the fuel for the baseline choice of energy source taking into account the national and/or sectoral policies as applicable Most of the electricity in the power grids in China is generated from coal; 88.1%6 and 88.6%7 of the power produced by the East China Grid in 2005 and 2006 was from fossil fuels where coal is the main energy source in China. Coal reserves in China are abundant predicted to lead China’s energy source will at least until the next decade. Step 3: Investment analysis Please refer to Section B.5 for details. According to the analysis, the equity IRR (after income tax) for LFG1 and P1 is 4.8% without CDM revenue, which is lower than the benchmark IRR for the fossil fuel-fired power generation sector of 8%8, thereby making LFG1 and P1 financially unattractive and LFG1 and P1 are not feasible baseline scenarios. Based on the above analysis, the baseline scenario of this project is determined as:
Baseline Scenario Landfill gas treatment Power generation
Description
1 LFG 2 P6 The atmospheric release of landfill gas is common practice. Electricity is obtained from the East China Power Grid which is coal dominated.
Step 4: Common practice analysis Only one feasible baseline scenario has been identified. Step 4 can therefore be skipped in accordance with the methodology. 5 “Decision on strictly forbidding the illegal construction of fuel-fired power plant with the capacity 135MW and below”, General Office of the State Council, http://www.gov.cn/gongbao/content/2002/content_61480.htm 6 p. 572, “China Electric Yearbook”, 2006 7 p. 638, “China Electric Yearbook”, 2007 8 p. 203, “Economic Evaluation Methods and Parameters for the Construction Projects (version 3)”, China Plan Press, Aug. 2006

PROJECT DESIGN DOCUMENT FORM (CDM PDD) - Version 03
CDM – Executive Board page 12 B.5. Description of how the anthropogenic emissions of GHG by sources are reduced below those that would have occurred in the absence of the registered CDM project activity (assessment and demonstration of additionality): The project owner seriously considered CDM revenue in the decision to go ahead with the project activity. Below is a project event timeline to prove that CDM was the basis of the decision to invest in the power generation project.
Event Date PDD for GSP9 22nd Dec 2006 ERPA signed 10 18th March 2008 First Construction contract11 22nd April 2008 The additionality of the Project is demonstrated and assessed by using the “Tool for the demonstration and assessment of additionality (version 05.2)” approved by the CDM EB. Step 1: Identification of alternatives to the project activity consistent with current laws and regulations Sub-step 1a. Define alternatives to the project activity: Identify realistic and credible alternatives available to the project participants that provide outputs or services comparable with the proposed CDM project activity. All possible alternatives in absence of the project activity include: 1. Alternatives for LFG treatment/ disposal LFG1. The proposed project activity (capture, destroy and/or utilize the LFG) undertaken without being registered as a CDM project; LFG2. Atmospheric release or partial capture of LFG and destruction to comply with regulations, contractual requirements and/or to address safety and odor concerns 2. Alternatives for power generation P1. Power generated from LFG undertaken without being registered as CDM project activity; P2. Existing or Construction of a new on-site or off-site fossil fuel fired cogeneration plant; P3. Existing or Construction of a new on-site or off-site renewable based cogeneration plant; P4. Existing or Construction of a new on-site or off-site fossil fuel fired captive power plant; P5. Existing or Construction of a new on-site or off-site renewable based captive power plant; P6. Power supply from the East China Power Grid There are no renewable energy resources (such as wind power, hydro-power and bio-mass power) that can be commercially developed in the region where this project is located. So, P3 and P5 are not realistic and credible alternatives to the project activity. Realistic and credible alternatives to the project activity are LFG1, LFG2, P1, ,P2 P4 and P6.
9 http://www.netinform.net/KE/Wegweiser/Guide2_1.aspx?ID=2448&Ebene1_ID=26&Ebene2_ID=729&mode=1 10 Available to DOE at validation 11 Available to DOE at validation

PROJECT DESIGN DOCUMENT FORM (CDM PDD) - Version 03
CDM – Executive Board page 13 Sub-step 1b. Consistency with mandatory laws and regulations: According to analysis made in B.4, LFG1, LFG2, P1 and P6 meet all the requirements of laws and regulations whilst P2 and P4 do not comply with laws and regulations. LFG2+P6 is the baseline scenario and LFG1+P1 is the proposed project activity. Step 2: Investment Analysis The additionality of the project is going to be established by using an investment analysis of the project equity. The analysis will determine whether the proposed project activity is economically or financially less attractive than other alternatives without the revenues from the sale of certified emission reductions (CERs). To conduct the investment analysis, the following sub-steps will be followed: Sub-step 2a. Determine appropriate analysis method The “Tools for the demonstration and assessment of additionality (version 05.2)” recommends three analysis methods including simple cost analysis (Option I), investment comparison analysis (Option II) and benchmark analysis (Option III). The proposed project activity generates both CDM related income and electricity related income therefore, Option I cannot be used. The investment comparison analysis method (Option II) is only applicable to projects where alternatives are similar investment projects. The alternative baseline scenario of the project activity is the continuation of current scenario, simply not installing power generation and abetment equipment. There is no other investment to compare the proposed activity and therefore Option II should not be used. Option III is used where the returns of the investment in the project activity is compared to a benchmark return that is available to any investors in the country. An 8% benchmark value is selected for the benchmark analysis. Sub-step 2b. Option III. Apply Benchmark analysis The indicator to be used for financial analysis of the project activity is selected to be the Project Internal Rate of Return (IRR) in accordance with the “Tool for the demonstration and assessment of additionality”. The benchmark of 8% for the power generation project as recommended in the “Interim Rules on Economic Assessment of Electrical Engineering Retrofit Projects”, published by China electrical power press in 2003,12 is used in the benchmark analysis. Sub-step 2c. Calculation and comparison of financial indicators Based on the Feasibility Study Report of the project activity, basic data used for the IRR calculation are listed in Table B.5-1
Table B.5-1 Basic data used for the IRR calculation

PROJECT DESIGN DOCUMENT FORM (CDM PDD) - Version 03
CDM – Executive Board page 14
Parameters Values Installed capacity Year 1: 2.12
Year 4 onwards: 4.25 Electricity tariff Year 1-16: 0.5436 Yuan/KWh (0.1925Yuan/KWh
over basic rate) Initial static investment (2 engines) + (2 additional engines)
3,996.27 + 1,659.80
Period of assessment 10 years Value added tax rate 17% VAT 25%
Table B.5-2. Comparison of the equity IRR with and without CDM revenues IRR (total investment, after income tax)
Without CDM revenues 4 % With CDM revenues 19.1%
Benchmark value 8% Sub-step 2d: Sensitivity analysis The sensitivity analysis shows that even with 10% of variation of the underling parameters, the Project would not be attractive without CDM. The following parameters were selected:
• Capital investment • Operating cost • Power tariff
Table B.5-3 Sensitivity analysis
Sensitivity Analysis Summary IRR without CERs
90% 95% 100% 105% 110% Equity investment
5.7% 4.8% 4.0% 3.2% 2.5% 90% 95% 100% 105% 110%
Operating costs 5.3% 4.6% 4.0% 3.3% 2.7% 90% 95% 100% 105% 110%
Power tariff 1.5% 2.8% 4.0% 5.2% 6.3%
Benchmark 8% 8% 8% 8% 8%

PROJECT DESIGN DOCUMENT FORM (CDM PDD) - Version 03
CDM – Executive Board page 15
Sensitivity Analysis
0%2%4%6%8%
10%
90% 95% 100% 105% 110%
Percentage Variation
IRR
Equity investmentOperating costs
Power tariff
Benchmark
The sensitivity analysis in Table B.5-3 and Figure B.5-1 show that despite substantial variations on key parameters, the equity IRR will be always lower than the benchmark value is CER revenue is not included. The sensitivity analysis shows that the project is not financially attractive for the landfill to undertake the Project without CDM revue and hence current scenario of LFG venting would be continued. Step 4: Common practice analysis Sub-step 4a. Analyze other activities similar to the project activity: The overwhelming majority of landfills vent their LFG directly into the atmosphere for safety reasons (to prevent the build up of pockets of methane and potential explosions). The “National Action Plan for Recovery and Utilisation of Landfill Gas” (12/2001) states that landfill gas utilisation is not a widespread practice in the Host Country.13 There are no similar LFG to electricity projects in Anhui Province without CDM assistance. Sub-step 4b. Discuss any similar options that are occurring: Since there are no other similar projects in Anhui province operating without CDM fund, therefore, this project is not common practice and would not be financially feasible without CDM revenue. B.6. Emission reductions:
B.6.1. Explanation of methodological choices: Calculations of GHG emission reductions
13 National Action Plan on Landfill Gas Collection and Utilisation in China

PROJECT DESIGN DOCUMENT FORM (CDM PDD) - Version 03
CDM – Executive Board page 16 According to methodology ACM0001 (Version 010), baseline emission in year y is calculated as follows: BEy = (MDproject,y-MDBL,y) * GWPCH4 + ELLFG,,y * CEFelec,BL,y + ETLFG,y *CEFther,BL,y (1) Where: BEy = Baseline emission in year y (tCO2e)
yprojectMD , = The amount of methane that would have been destroyed/combusted during year y (tCH4) in project scenario;
MDBL,y = The amount of methane that would have been destroyed/combusted during year y in the absence of the project due to regulatory and/or contractual requirement (tCH4)
4CHGWP = Global Warming Potential value for methane for the first commitment period is 21 (tCO2e/tCH4)
yLFGEL , = Net quantity of electricity produced using LFG, which in the absence of this project activity would have been produced by power plants connected to the East China Grid during year y (MWh)
yBLelecCEF ,, = CO2 emissions intensity of the baseline source of electricity displaced, in tCO2e/MWh
ETLFG,y
= The quantity of thermal energy produced utilizing the landfill gas, which in the
absence of the project activity would have been produced from onsite/offsite fossil fuel fired boiler, during the year y in TJ = 0
CEFther,BL,y
= CO2 emissions intensity of the fuel used by boiler to generate thermal energy
which is displaced by LFG based thermal energy generation, in tCO2e/TJ. This is estimated as per equation (10) below = 0
Determination of MDBL,y The LFG is not captured or destroyed in baseline scenario, so MDBL,y=0. Determination of MDproject,y MDproject,y will be determined ex post by metering the actual quantity of methane captured and destroyed once the project activity is operational. It is determined by monitoring the quantity of methane actually flared and gas used to generate electricity and the total quantity of methane captured. The sum of the quantities fed into the flares and to the power plant must be compared annually with the total quantity of methane captured. The lowest value of the two must be adopted as MDproject,y. The working hours of the power plant should be monitored and no emission reduction could be claimed for methane destruction during non-operational hours of the power plant.
yyelectricityflaredyproject MDMDMD ,,, += + MDthermal,y + MDPL,y (2) Where:
yflaredMD , = Quantity of methane destroyed by flaring during year y(tCH4)
MDelectricity,y = Quantity of methane destroyed by generation of electricity during year y (tCH4) MDthermal, = Quantity of methane destroyed for the generation of thermal energy (tCH4)

PROJECT DESIGN DOCUMENT FORM (CDM PDD) - Version 03
CDM – Executive Board page 17 Determination of MDflared,y
Methane destruction through flaring shall be measured as follows:
4,4,4,, / CHyflareCHyCHyflareyflared GWPPEDLFGMD −∗∗= ω (3) Where:
yflareLFG , = Quantity of landfill gas fed to the flare during year y (m3)
yCH ,4ω = Average methane fraction of the landfill gas as measured during year y and expressed as a fraction (m3CH4/m3LFG)
4CHD = Methane density (tCH4/m3CH4)
yflarePE , = Project emissions from flaring of the residual gas stream in year y (tCO2e), determined following the procedure described in the “Tool to determine project emissions from flaring gases containing methane”. The calculation is shown below:
Tool to determine project emissions from flaring gases containing methane
Applicable steps include: STEP 1: Determination of the mass flow rate of the residual gas that is flared STEP 2: Determination of the mass fraction of carbon, hydrogen, oxygen and nitrogen in the residual gas STEP 5: Determination of methane mass flow rate of the residual gas on a dry basis STEP 6: Determination of the hourly flare efficiency STEP 7: Calculation of annual project emissions from flaring based on measured hourly values or based on default flare efficiencies.
STEP 1. Determination of the mass flow rate of the residual gas that is flared This step calculates the residual gas mass flow rate in each hour h, based on the volumetric flow rate and the density of the residual gas. The density of the residual gas is determined based on the volumetric fraction of all components in the gas.
(4)
(5)

PROJECT DESIGN DOCUMENT FORM (CDM PDD) - Version 03
CDM – Executive Board page 18
(6)
(7)
As a simplified approach, project participants may only measure the volumetric fraction of methane and consider the difference to 100% as being nitrogen (N2). STEP 2. Determination of the mass fraction of carbon, hydrogen, oxygen and nitrogen in the residual gas Determine the mass fractions of carbon, hydrogen, oxygen and nitrogen in the residual gas, calculated from the volumetric fraction of each component i in the residual gas, as follows:
(8)

PROJECT DESIGN DOCUMENT FORM (CDM PDD) - Version 03
CDM – Executive Board page 19
STEP 5. Determination of methane mass flow rate in the residual gas on a dry basis The quantity of methane in the residual gas flowing into the flare is the product of the volumetric flow rate of the residual gas (FVRG,h), the volumetric fraction of methane in the residual gas (fvCH4,RG,h) and the density of methane (ρCH4,n,h) in the same reference conditions (normal conditions and dry or wet basis). It is necessary to refer both measurements (flow rate of the residual gas and volumetric fraction of methane in the residual gas) to the same reference condition that may be dry or wet basis. If the residual gas moisture is significant (temperature greater than 60ºC), the measured flow rate of the residual gas that is usually referred to wet basis should be corrected to dry basis due to the fact that the measurement of methane is usually undertaken on a dry basis (i.e. water is removed before sample analysis).
(9)
STEP 6. Determination of the hourly flare efficiency In case of enclosed flares and use of the default value for the flare efficiency, the flare efficiency in the hour h ( hflare,h) is:
• 0% if the temperature in the exhaust gas of the flare (Tflare) is below 500 °C for more than 20 minutes during the hour h.
• 50%, if the temperature in the exhaust gas of the flare (Tflare) is above 500 °C for more than 40 minutes during the hour h, but the manufacturer’s specifications on proper operation of the flare are not met at any point in time during the hour h.

PROJECT DESIGN DOCUMENT FORM (CDM PDD) - Version 03
CDM – Executive Board page 20 • 90%, if the temperature in the exhaust gas of the flare (Tflare) is above 500 °C for more than 40
minutes during the hour h and the manufacturer’s specifications on proper operation of the flare are met continuously during the hour h.
Option of 90% default value has been chosen for this project. Continuous monitoring of compliance with manufacturer’s specification of flare (temperature, flow rate of residual gas at the inlet of the flare) must be performed. If in a specific hour any of the parameters are out of the limit of manufacturer’s specifications, a 50% default value for the flare efficiency should be used for the calculations for this specific hour
STEP 7. Calculation of annual project emissions from flaring Project emissions from flaring are calculated as the sum of emissions from each hour h, based on the methane flow rate in the residual gas (TMRG,h) and the flare efficiency during each hour h (hflare,h), as follows:
(10)
Determination of MDelectricity,y Methane destruction through electricity generation shall be measured as follows:
4,4,, CHyCHyyelectricityyelectricit DLFGMD ∗∗= ω (11) Where: MDelectricity,y = Quantity of methane destroyed by generation of electricity( tCH4) LFGelectricity,y = Quantity of landfill gas fed into electricity generator( m3) ωCH4,y = Volumetric fraction of methane in the residual gas on dry basis in hour
h( m3CH4/m3LFG) DCH4 = Methane density (tCH4/m3CH4) Calculation of the emission factor of the East China Power Grid The electricity generated by this project will replace the same quantity of electricity supplied by the East China Power Grid. According to methodology ACM0001ver 10, the emission factor should be calculated according to “Tool to calculate the emission factor for an electricity system.”

PROJECT DESIGN DOCUMENT FORM (CDM PDD) - Version 03
CDM – Executive Board page 21 Step 1: Identify the relevant electric power system The Office of National Coordination Committee on Climate Change issued a notice on Determination of China Grid Baseline Emission Factor on July 18, 2008,14 which gives clear definition on the seven Power Grids in China. Xuzhou falls under the East China Power Grid. Step 2: Select an operating margin (OM) method The calculation of the operating margin emission factor (EFgrid,OM,y) is based on one of the following methods: (a) Simple OM (b) Simple adjusted OM (c) Dispatch data analysis OM (d) Average OM The simple OM method can only be used if low-cost/must-run resources constitute less than 50% of total grid generation in average of the five most recent years. Electricity generated by low-cost/must-run power plant against the total electricity of the East China Power Grid is 9.63% in 200215, 10.96% in 200316, 9.77% in 200417, 11.94% in 200518, and 11.44% in 200619. Each of them is below 50%, which meets the application requirement of method (a). According to “Tool to calculate the emission factor for an electricity system”, the simple OM emission factor will be calculated ex ante as a 3-year generation-weighted average based on the most recent data available at the time of submission of the CDM-PDD to the DOE for validation, without requirement to monitor and recalculate the emission factor during the crediting period. Step 3: Calculate the operating margin emission factor according to the selected method The simple OM emission factor is calculated as the generation-weighted average CO2 emission per unit net electricity generation (tCO2/MWh) of all generating power plants serving the system, not including low-cost/must-run power plants. Since data on fuel consumption and power generation of each power plant is not available for the East China Power Grid, option C is used. The simple OM emission factor is calculated as follows:
EFgrid,OMsimple,y=y
iyiCOyiyi
EG
EFNCVFC∑ ⋅⋅ ,,2,,
(12)
Where:
14 China CDM website http://cdm.ccchina.gov.cn 15 “China Electric Power Yearbook” 2003, page 585 16 “China Electric Power Yearbook” 2004, page 709 17 “China Electric Power Yearbook” 2005, page 474 18 “China Electric Power Yearbook” 2006, page 572 19 “China Electric Power Yearbook” 2007, page 638

PROJECT DESIGN DOCUMENT FORM (CDM PDD) - Version 03
CDM – Executive Board page 22 EFgrid,OMsimple,y = Simple operating margin CO2 emission factor for the East China Power Grid in year
y (tCO2/MWh) FCi,y = Amount of fossil fuel type i consumed (ton for solid and liquid fuel, m3 for gas
fuel)in the East China Power Grid in year y NCVi,y = Net calorific value (energy content) of fossil fuel type i in year y (GJ/mass or
volume unit) EFCO2,i,y = CO2 emission factor for fossil fuel type i in year y (tCO2/GJ) EGy = Net electricity generated and delivered to the East China Power Grid by all power
sources serving the system, not including low-cost/must-run power plants/units, in year y (MWh)
i = All fossil fuel types combusted by all power plants in the East China Power Grid in year y
y = The three most recent years: 2004, 2005 and 2006. For the simple OM calculation, electricity imports from a connected electricity system to the East China Power Grid should be included. Step 4: Identify the cohort of power units to be included in the build margin The sample group of power unit m used to calculate the build margin consists of either: (a) The set of five power units that have been built most recently, or (b) The set of power capacity additions in the electricity system that comprise 20% of the system
generation (in MWh) and that have been built most recently. According to “Tool to calculate the emission factor for an electricity system”, the set of power units that comprises the larger annual generation should be used. Considering the number (much more than 5) of newly built power plants in the East China Power Grid, option (b) is selected. According to “Tool to calculate the emission factor for an electricity system”, Option 1 will be used for the calculation of BM. Namely, for the first crediting period, calculate the build margin emission factor ex-ante based on the most recent information available on units already built for sample m at the time of PDD submission to the DOE for validation. For the second crediting period, the build margin emission factor should be updated based on the most recent information available on units already built at the time of submission of the request for renewal of the crediting period to the DOE. For the third crediting period, the build margin emission factor calculated for the second crediting period should be used. Step 5: Calculate the build margin emission factor The build margin emission factor ( EFgird,BM,y) is the generation-weighted average emission factor (tCO2/MWh)of all power units m during the most recent year y for which power generation data is available, calculated as follows:
EFgrid,BM,y= ∑∑ ×
mym
m
ymELym
EG
EFEG
,
,,,
(13)

PROJECT DESIGN DOCUMENT FORM (CDM PDD) - Version 03
CDM – Executive Board page 23
Where: EFgrid,BM,y = Build margin CO2 emission factor of the East China Power Grid in year y (tCO2e/MWh) EFEL,m,y = CO2 emission factor of power unit m in year y(tCO2/MWh) EGm,y = Net quantity of electricity generated and delivered to the East China Power Grid by
sample group of power unit m in year y (MWh) m = Power units included in the build margin y = Most recent historical year for which power generation data is available, namely year
2004, 2005 and 2006. Sub-Step5a. Calculate the percentages of CO2 emissions of power generation using solid, liquid and gas fuels in total CO2 emissions.
(14)
(15)
(16)
Where: Fi,j,y = The amount of fuel i consumed by province j in year y (in mass or volume
unit) NCVi,y = The net caloric value of fuel i in year y (GJ/t for solid and liquid fuels, GJ/m3
for gas fuels) yjiCOEF ,,,2 = Emission factor of fuel I (tCO2/GJ)
Coal, Oil and Gas Solid fuels, liquid fuels and gas fuels Sub-Step 5b. Calculate fossil fuel-fired emission factor
AdvGasGasAdvOilOilAdvCoalCoalfiredfossilfuel EFEFEFEF ,,, ×+×+×=− λλλ (17) Where:
EFCoal,Adv,EFOil,Adv and EFGas,Adv = Emission factors corresponding to commercially optimal
∑∑
××
××= ∈
jiyjiCOyiyji
jCOALiyjiyiyji
yCoal EFNCVF
EFNCVF
,,,,2,,,
,,,,CO2,,,
,λ
∑∑
××
××= ∈
jiyjiCOyiyji
jOILiyjiyiyji
yOil EFNCVF
EFNCVF
,,,,2,,,
,,,,CO2,,,
,λ
∑∑
××
××= ∈
jiyjiCOyiyji
jGASiyjiyiyji
yGas EFNCVF
EFNCVF
,,,,2,,,
,,,,CO2,,,
,λ

PROJECT DESIGN DOCUMENT FORM (CDM PDD) - Version 03
CDM – Executive Board page 24
efficient power generation technology using coal, oil and gas. The specific parameters and calculation process can be seen in Annex 3
Sub-Step5c. Calculate Build Margin emission factor of the East China Power Grid
EF grid,BM,y = Total
firedfossilfuel
CAPCAP −
xEFfossil fuel-fired (18)
Where: CAPTotal = The total additional installed capacity CAPfossil fuel-fired = The total additional installed capacity for fossil fuel-fired power Step 6: Calculate the combined margin emission factor for the East China Power Grid (CEFelec,BL,y ) According to the baseline methodology, the combined margin emission factor (CEFelec,BL,y) is calculated as the weighted average of the Operating Margin emission factor (EFgrid,OM,y) and the Build Margin emission factor (EFgrid,BM,y ): CEFelec,BL,y grid,BM,yBMgrid,OM,yOM EFwEFw ⋅+⋅= (19) Where: EFgrid,BM,y = Build margin CO2 emission factor in year y (tCO2/MWh) EFgrid,OM,y = Operating margin CO2 emission factor in year y (tCO2/MWh) wOM = Weights of operating margin emission factor (%) wBM = Weights of build margin emission factor (%) According to “Tool to calculate the emission factor for an electricity system”, 0.5 will be used for both
OMw and BMw for the first crediting period, and OMw =0.25 and BMw =0.75 for the second and third crediting period. The OM emission factor ( grid,OM,yEF ) and BM emission factor ( grid,BM,yEF ) as well as combined margin emission factor of the East China Power Grid in the first crediting period are shown below: EFgrid,OM,y 0.9540tCO2/MWh EFgrid,BM,y 0.8236tCO2/MWh CEFelec,BL,y = (EFgrid,OM,y+EFgrid,BM,y)/2 0.8888tCO2/MWh Project emissions PEy = PEEC,y (20) Where: PEy = Project emissions during year y (tCO2e) PEEC,y = Emissions from consumption of electricity in the project case. The project emissions

PROJECT DESIGN DOCUMENT FORM (CDM PDD) - Version 03
CDM – Executive Board page 25
from electricity consumption will be calculated following the latest version of “Tool to calculate project emissions from electricity consumption.”
PEEC,y = ECPJ,y * CEFelec,BL,y * (1+TDLy) (21) Where: PEEC,y = Project emissions from electricity consumption by the project activity during the
year y (tCO2/yr) ECPJ,y = Quantity of electricity consumed by the project activity during the year y (MWh) CEFelec,BL,y = Emission factor for the East China Power grid in year y (tCO2/MWh) TDLy = Average technical transmission and distribution losses in the grid in year y for the
voltage level at which electricity is obtained from the grid at the project site. Leakage No leakage effects need to be accounted under ACM0001. Emission reduction ERy = BEy -PEy (22) Where: ERy = Emission reductions in year y (tCO2e/yr) BEy = Baseline emissions in year y (tCO2e/yr) PEy = Project emissions in year y (tCO2e/yr)
B.6.2. Data and parameters that are available at validation:
Data / Parameter: EGy Data unit: kWh Description: Quantity of electricity generated by the East China Power Grid in
year y. Source of data used: China Electric Power Yearbook 2005 – 2007 Value applied: Refer to Annex 3 Justification of the choice of data or description of measurement methods and procedures actually applied :
National Statistics
Any comment: No comment Data / Parameter: Installed capacity Data unit: kW Description: Installed capacity of provincial sub-girds of the East China Power
Grid

PROJECT DESIGN DOCUMENT FORM (CDM PDD) - Version 03
CDM – Executive Board page 26 Source of data used: China Electric Power Yearbook 2005-2007 Value applied: Refer to Annex 3 Justification of the choice of data or description of measurement methods and procedures actually applied :
National Statistics
Any comment: No comment Data / Parameter: EFCO2,i,y Data unit: tCO2/GJ Description: The carbon emission factor per unit of energy of the fuel i consumed
by sub-grid of the East China Power Grid. Source of data used: Revised 2006 IPCC Guidelines for National Greenhouse Gas
Inventories: Volume 2 Energy, Table 1.3 and 1.4, page 1.21-1.24, chapter 1.
Value applied: Refer to Annex 3 Justification of the choice of data or description of measurement methods and procedures actually applied :
National Statistics
Any comment: No comment
Data / Parameter: OXIDi Data unit: % Description: Oxidation factor of fuel i Source of data used: Revised 2006 IPCC Guidelines for National Greenhouse Gas
Inventories: Volume 2 Energy, Table 1.3 and 1.4, page 1.21-1.24, chapter 1.
Value applied: Refer to Annex 3 Justification of the choice of data or description of measurement methods and procedures actually applied :
IPCC default value
Any comment: No comment
Data / Parameter: NCVi,y Data unit: GJ/t or m3 Description: Net calorific value of fuel i in year y Source of data used: 2008 Baseline Emission Factors for Regional Power Grids in China Value applied: Refer to Annex 3 Justification of the choice of data or description of measurement methods and procedures actually applied :
National Statistics
Any comment: No comment

PROJECT DESIGN DOCUMENT FORM (CDM PDD) - Version 03
CDM – Executive Board page 27
Data / Parameter: ηflare,h Data unit: % Description: Flare efficiency in the hour h Source of data used: From “Tool to calculate project emissions from flaring gases
containing methane” Value applied: 90 Justification of the choice of data or description of measurement methods and procedures actually applied :
Follow the methodology
Any comment: No comment Data / Parameter: DCH4 Data unit: tCH4/ CH4m3 Description: Density of methane Source of data used: IPCC Value applied: 0.0007168 Justification of the choice of data or description of measurement methods and procedures actually applied :
As defined in ACM0001. This is the value at STP (0°C and 1013bar).
Any comment: No comment Data / Parameter: GWPCH4 Data unit: tCO2e/tCH4 Description: Global warming potential of CH4 Source of data used: IPCC Value applied: 21 Justification of the choice of data or description of measurement methods and procedures actually applied :
21 for the first commitment period. Shall be updated according to any future COP/MOP decisions.
Data / Parameter: FCi,y Data unit: t or m3 Description: The amount of fuel i (in a mass or volume unit) consumed by the East
China Power Grid in year y. Source of data used: China Energy Statistical Yearbook 2005-2007 Value applied: Refer to Annex 3 Justification of the choice of data or description of measurement methods and procedures actually applied :
National Statistics
Any comment: No comment

PROJECT DESIGN DOCUMENT FORM (CDM PDD) - Version 03
CDM – Executive Board page 28 Any comment: No comment Data / Parameter: Regulatory requirements relating to landfill gas Data unit: Description: Regulatory requirements relating to landfill gas Source of data used: Value applied: Justification of the choice of data or description of measurement methods and procedures actually applied :
Any comment: The information though recorded annually, is used for changes to the adjustment factor (AF) or directly MDBL,y at renewal of the credit period. Relevant regulations for LFG project activities shall be updated at renewal of each credit period. Changes to regulation should be converted to the amount of methane that would have been destroyed/combusted during the year in the absence of the project activity (MDBL,y). Project participants should explain how regulations are translated into that amount of gas.
B.6.3. Ex-ante calculation of emission reductions:
1. Ex-ante calculation of methane collection The methodology ACM0001 ver010 requires “project participants to provide an ex-ante estimation of emission reductions, by predicting the future GHG emissions of the landfill”. The ex-ante estimation of the amount of methane that would have been destroyed during the year is calculated according to the “Tool to determine emissions avoided from dumping waste at a solid waste disposal site” ver04. The calculation formula is shown below: MDproject,y = BECH4,SWDS,y/GWPCH4 (23) Where BECH4,SWDS,y = Methane generation from the landfill in the absence of the project activity at year y
(tCO2e), calculated as per the “Tool to determine methane emissions avoided from dumping waste at a solid waste disposal site”. The baseline of this project does not concern capture and utilization of methane, so the calculation formula is:
BECH4,SWDS,y=ϕ ·GWPCH4.·(1-OX) ·1216
·F·.DOCf.·MCF· )e(eDOCW jj kx)(ykj
y
x jj,x
−−−⋅
=
−⋅⋅∑∑ 11
(24)
Where BECH4,SWDS,y = Methane emissions avoided during the year y from preventing waste disposal at the

PROJECT DESIGN DOCUMENT FORM (CDM PDD) - Version 03
CDM – Executive Board page 29
solid waste disposal site(SWDS) during the period from the start of the project activity to the end of the year y (tCO2e)
Φ = Model correction factor to account for model uncertainties (0.9 is used) GWPCH4 = Global Warming Potential of methane, valid for the relevant commitment period OX = Oxidation factor (reflecting the amount of methane from SWDS that is oxidised in
the soil or other material covering the waste). Clay is used for covering the waste in this project, so 0.1 is used for OX
F = Fraction of methane in the SWDS gas (volume fraction). 0.5 is used by this project; DOCf = Fraction of degradable organic carbon (DOC) that can decompose. IPCC default
value 0.5 is used MCF = Methane correction factor. The landfill of this project is an anaerobic managed solid
waste disposal site. So 1.0 is used for this parameter Wj,x = Amount of organic waste type j prevented from disposal in the SWDS in the year x
(tons) DOCj = Fraction of degradable organic carbon (by weight) in the waste type j, determined in
accordance to “Tool to determine methane emissions from dumping waste at a solid waste disposal site”
kj = Decay rate for waste type j,which will be determined in accordance to “Tool to determine methane emissions from dumping waste at a solid waste disposal site”;
j = Waste type category; x = Year during the crediting period: x runs from the first year after the start of the
operation of the landfill (x=1) to the year y for which avoided emissions are calculated (x=y)
y = Year for which methane emissions are calculated In accordance with the latest version of ACM0001 (ver 010), sampling to determine the different waste types is not necessary. The waste composition can be obtained from previous studies. During its opening year in 2005 the landfill received a total of 600 tonnes. The FSR has estimated that the waste increase would be around 5% yearly due to population growth, until its closure.20
Table B.6-1 Estimated amounts of waste that have been tipped into the landfill since 2005
Year Annual waste tipping (tonnes/day)
Daily waste tipping (tonnes/year)
2005 600 219,000 2006 630 229,950 2007 662 241,448 2008 695 253,520 2009 729 266,196 2010 766 279,506 2011 804 293,481 2012 844 308,155 2013 886 323,563
20 Yearly waste tipping increase, Xuzhou FSR 081110, p. 16

PROJECT DESIGN DOCUMENT FORM (CDM PDD) - Version 03
CDM – Executive Board page 30
2014 931 339,741 2015 977 356,728 2016 1,026 374,564 2017 1,078 393,293 2018 1,131 412,957 2019 1,188 433,605 2020 1,247 455,285
After 2020 Landfill closed — Total 5,180,991
According to the feasibility study, the fraction of organic materials in Xuzhou municipal waste is 76.14% (on wet basis). The climate of Xuzhou falls into warm zone, with 14.3ºC of mean annual temperature, 842.5mm of mean annual precipitation and 1798.8mm of mean annual evaporation.21. It meets the conditions of MAT ≤20 and MAP/PET<1 according to “Tool to determine methane emissions avoided from dumping waste at a solid waste disposal site”, as a result, the values for DOCj and kj are shown in table B.6-2.
Table B.6-2 DOC and k values for type of waste j Waste type j DOCj (% wet) kj Wood and wood products (other than sludge)
43 0.02
Pulp, paper and cardboard (other than sludge)
40 0.04
Food, food waste, beverages and tobacco (other than sludge)
15 0.06
Textiles 24 0.04 Garden, yard and park waste 20 0.05
Because advanced LFG collection technology will be applied, the LFG collection efficiency can reach 80%. The estimation of methane collection during the first crediting period is shown in Table B.6-3.
Table B.6-3 Ex-ante estimation of methane collection
Year Annual methane generation during the first crediting
period (tCH4/year)
Annual methane collection during the first crediting period
(tCH4/year)
2009 (Sept- Dec) 1,383 1,106 2010 4,841 3,873 2011 5,512 4,410 2012 6,167 4,934 2013 6,812 5,450 2014 7,453 5,962 2015 8,094 6,475 2016 8,739 6,991
21 “Feasibility Study Research on Xuzhou Landfill Project” Xuzhou Engineering Consulting Centre and Xuzhou Municipal Design Institute p. 69

PROJECT DESIGN DOCUMENT FORM (CDM PDD) - Version 03
CDM – Executive Board page 31
2017 9,393 7,514 2018 10,058 8,046 2019 (Jan- Aug) 7,158 5,727
2. Ex-ante estimation of methane destroyed by power generation and flaring According to the technical specifications of Jenbacher generator set, gas consumption under different load is shown below:
Table B.6-4 Methane destroyed by power generation and flaring system Year Methane destroyed by
power generation (tCH4/yr) MDelectricity,y
Methane destroyed by flaring system
(tCH4/yr) MDflared,y 2009 (Sept-Dec) 880 226
2010 2,640 1,233 2011 2,640 1,770 2012 3,942 991 2013 4,355 1,095 2014 4,764 1,198 2015 5,174 1,301 2016 5,280 1,711 2017 5,280 2,234 2018 5,280 2,766
2019 (Jan- Aug) 3,520 2,207 3. Ex-ante estimation of electricity generation by the project activity The electricity generated by the project activity can be estimated by the following formula: ELLFG,y=MDelectricity,y*HVCH4*EE/3600 (21) Where: ELLFG,y = Net quantity of power produced using LFG in year y by this project (MWh) MDelectricity,y = Quantity of methane destroyed by generator sets in year y (tCH4); HVCH4 = The caloric value of methane (35.9MJ/m3CH4, under normal conditions); EE = Generator’s electric efficiency, 40.04% is used according to Jenbacher specification.
Table B.6-5 Estimation of power generation of the project activity

PROJECT DESIGN DOCUMENT FORM (CDM PDD) - Version 03
CDM – Executive Board page 32
4. Ex-ante estimation of baseline methane destruction (MDBL,y) No methane is destroyed in baseline scenario, therefore MDBL,y=0. 5. Estimation of emission reductions Assuming that no power from the grid will be consumed by this project, PEy=0. When leakage is neglected, ERy=BEy-PEy=BEy
Table B.6-6 Ex-ante estimation of emission reductions of the project activity
Year Total methane destroyed (tCO2e/y)
Project emissions (tCO2e/y)
Emission reduction (tCO2e/y)
2009 (Sept- Dec) 27,412 567 26,845 2010 93,888 2,867 91,021 2011 105,157 3,993 101,164 2012 122,353 2,496 119,857 2013 135,152 2,757 132,396 2014 147,863 3,016 144,847 2015 160,579 3,275 157,304 2016 171,924 4,148 167,776 2017 182,904 5,246 177,658 2018 194,078 6,363 187,715
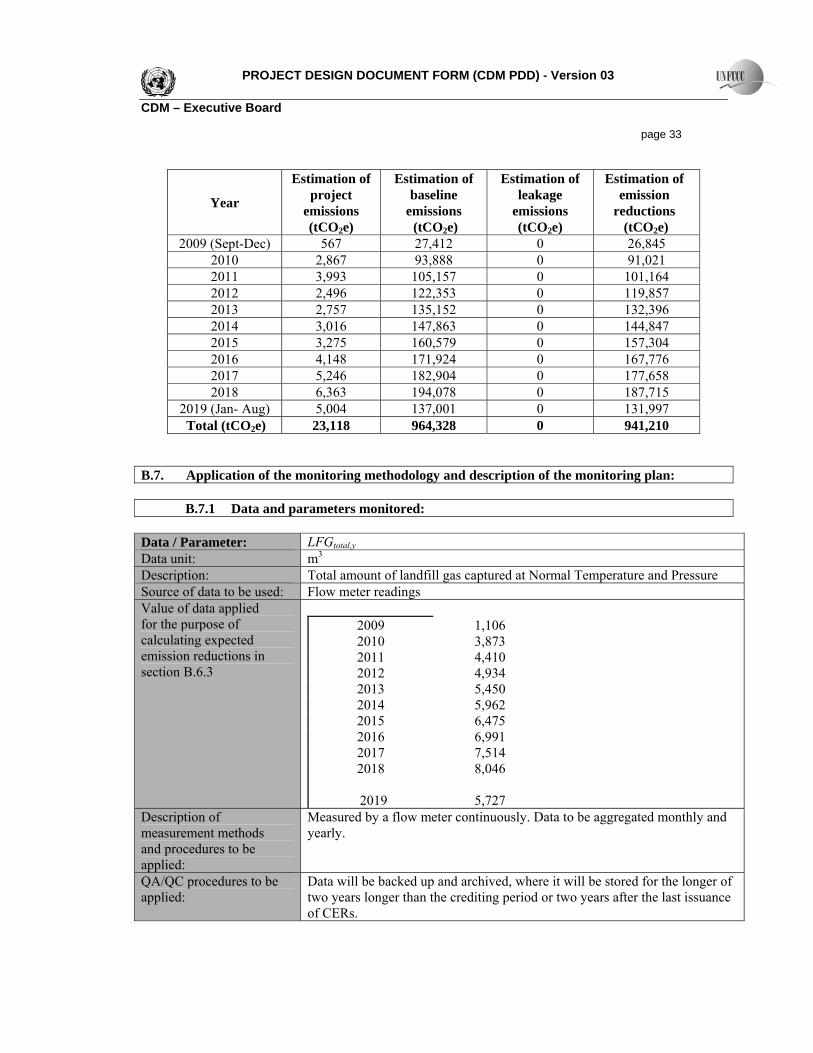
2019 (Jan-Aug) 137,001 5,004 131,997 B.6.4 Summary of the ex-ante estimation of emission reductions:
Fixed crediting period is selected for this project activity. The average annual GHG emission reductions within the first crediting period (Sept 2009 to Aug, 2019) are 143,858tCO2e.
Year Methane destroyed by power generation
(tCO2/y)
Power supply (MWh/y)
2009 (Sept-Dec) 18,480 4,961 2010 55,440 14,882 2011 55,440 14,882 2012 82,789 22,224 2013 91,450 24,548 2014 100,051 26,857 2015 108,655 29,167 2016 110,880 29,764 2017 110,880 29,764 2018 110,880 29,764
2019 (Jan-Aug) 73,920 19,843
PROJECT DESIGN DOCUMENT FORM (CDM PDD) - Version 03
CDM – Executive Board page 33
Year
Estimation of project
emissions (tCO2e)
Estimation of baseline
emissions (tCO2e)
Estimation of leakage
emissions (tCO2e)
Estimation of emission
reductions (tCO2e)
2009 (Sept-Dec) 567 27,412 0 26,845 2010 2,867 93,888 0 91,021 2011 3,993 105,157 0 101,164 2012 2,496 122,353 0 119,857 2013 2,757 135,152 0 132,396 2014 3,016 147,863 0 144,847 2015 3,275 160,579 0 157,304 2016 4,148 171,924 0 167,776 2017 5,246 182,904 0 177,658 2018 6,363 194,078 0 187,715
2019 (Jan- Aug) 5,004 137,001 0 131,997 Total (tCO2e) 23,118 964,328 0 941,210
B.7. Application of the monitoring methodology and description of the monitoring plan:
B.7.1 Data and parameters monitored:
Data / Parameter: LFGtotal,y Data unit: m3 Description: Total amount of landfill gas captured at Normal Temperature and Pressure Source of data to be used: Flow meter readings Value of data applied for the purpose of calculating expected emission reductions in section B.6.3
2009 1,106 2010 3,873 2011 4,410 2012 4,934 2013 5,450 2014 5,962 2015 6,475 2016 6,991 2017 7,514 2018 8,046
2019 5,727
Description of measurement methods and procedures to be applied:
Measured by a flow meter continuously. Data to be aggregated monthly and yearly.
QA/QC procedures to be applied:
Data will be backed up and archived, where it will be stored for the longer of two years longer than the crediting period or two years after the last issuance of CERs.

PROJECT DESIGN DOCUMENT FORM (CDM PDD) - Version 03
CDM – Executive Board page 34
Flow meters will be calibrated according to the manufacturer’s specifications. Total LFG flow will be checked by mass balance calculation with the flow to the generators and flare consumption.
Any comment: No comment
Data / Parameter: yyelectricitLFG , Data unit: m3 Description: Amount of landfill gas combusted in power plant at Normal Temperature
and Pressure Source of data to be used: Flow meter on the inlet to each generator Value of data applied for the purpose of calculating expected emission reductions in section B.6.3
2009 880 2010 2,640 2011 2,640 2012 3,942 2013 4,355 2014 4,764 2015 5,174 2016 5,280 2017 5,280 2018 5,280 2019 3,520
Description of measurement methods and procedures to be applied:
Measured by a flow meter continuously. Data to be aggregated monthly and yearly.
QA/QC procedures to be applied:
Data will be backed up and archived, where it will be stored for the longer of two years longer than the crediting period or two years after the last issuance of CERs. Flow meters will be calibrated according to the manufacturer’s specifications. Total flow to the generators will be checked by mass balance calculation with total LFG flow and flare consumption.
Any comment: No comment Data / Parameter: LFGflared,y Data unit: m3 Description: Amount of landfill gas flared at Normal Temperature and Pressure Source of data to be used: Flow meter on the inlet of the flare Value of data applied for the purpose of calculating expected emission reductions in section B.6.3
2009 226 2010 1,233 2011 1,770 2012 991

PROJECT DESIGN DOCUMENT FORM (CDM PDD) - Version 03
CDM – Executive Board page 35
2013 1,095 2014 1,198 2015 1,301 2016 1,711 2017 2,234 2018 2,766 2019 2,207
Description of measurement methods and procedures to be applied:
Measured by a flow meter continuously. Data to be aggregated monthly and yearly.
QA/QC procedures to be applied:
Data will be backed up and archived, where it will be stored for the longer of two years longer than the crediting period or two years after the last issuance of CERs. Flow meters will be calibrated according to the manufacturer’s specifications. Total flow to the flares will be checked by mass balance calculation with total LFG flow and generator consumption.
Any comment: No comment Data / Parameter: ELLFG,y Data unit: MWh Description: Net amount of electricity generated using LFG Source of data to be used: Electricity meter Value of data applied for the purpose of calculating expected emission reductions in section B.6.3
2009 (Sept-Dec) 4,961
2010 14,882 2011 14,882 2012 22,224 2013 24,548 2014 26,857 2015 29,167 2016 29,764 2017 29,764 2018 29,764
2019 (Jan- Aug) 19,843 Description of measurement methods and procedures to be applied:
Continuous electricity meter readings
QA/QC procedures to be applied:
The electricity meters will meet the relevant Chinese standards for fiscal calibration purposes. They will be maintained and calibrated according to manufacturer’s instructions or the relevant regulations. Data will be archived for 2 years after the crediting period or two years after the last issuance of CERs. The data can be corroborated against financial data from the export of power to the grid.

PROJECT DESIGN DOCUMENT FORM (CDM PDD) - Version 03
CDM – Executive Board page 36 Any comment: No comment Data / Parameter: wCH4,y Data unit: m3CH4/m3LFG Description: Methane fraction in the landfill gas Source of data to be used: Measured by gas quality analyser Value of data applied for the purpose of calculating expected emission reductions in section B.6.3
50%
Description of measurement methods and procedures to be applied:
Methane concentration will be measured by proprietary infra red instrumentation.
QA/QC procedures to be applied:
Data will be backed up and archived where it will be stored for the longer of two years longer than the crediting period or two years after the last issuance of CERs. The methane analyser will be calibrated according to the manufacturer’s specifications.
Any comment: No comment Data / Parameter: fvCH4,RG,h,
Data unit: - Description: Volumetric fraction of CH4 in the residual gas on dry basis in the hour h Source of data to be used: Measurements by project participants using a continuous gas analyzer
Value of data applied for the purpose of calculating expected emission reductions in section B.6.3
50%
Description of measurement procedure and procedures to be applied.
Ensure that the same basis is considered for this measurement and the measurement of the volumetric flow rate of the residual gas when the residual gas temperature exceeds 60 Degree
QA/QC procedures to be applied:
Analyzers must be periodically calibrates according to the manufacturer’s recommendation. A zero check and a typical value check should be performed by comparison with a standard certified gas.
Any comment: No comment Data / Parameter: P

PROJECT DESIGN DOCUMENT FORM (CDM PDD) - Version 03
CDM – Executive Board page 37 Data unit: Pa Description: Pressure of the landfill gas Source of data to be used: Pressure transmitter mounted in the gas pipe work between the gas treatment
package and the generator sets / flares. Value of data applied for the purpose of calculating expected emission reductions in section B.6.3
n/a
Description of measurement methods and procedures to be applied:
Pressure will be measured continuously and recorded no less than hourly
QA/QC procedures to be applied:
The pressure transmitter will be calibrated according to manufacturers’ instructions and the data will be recorded and archived for two years after the end of the crediting period or two years after the last issuance of CERs.
Any comment: No comment Data / Parameter: T Data unit: ºC Description: Temperature of the landfill gas Source of data to be used: Temperature probe in gas pipe Value of data applied for the purpose of calculating expected emission reductions in section B.6.3
n/a
Description of measurement methods and procedures to be applied:
Temperature will be measured continuously using a transmitter mounted in the gas pipe work between the gas treatment package and the generator sets / flares.
QA/QC procedures to be applied:
Data will be backed up and archived where it will be stored for the longer of two years longer than the crediting period or two years after the last issuance of CERs. The transmitter will be calibrated according to the manufacturer’s specifications.
Any comment: No comment Data / Parameter: Operation of the energy plant Data unit: Hours Description: Operation of the energy plant Source of data to be used: Feasibility Study Report Value of data applied for the purpose of calculating expected emission reductions in
7000

PROJECT DESIGN DOCUMENT FORM (CDM PDD) - Version 03
CDM – Executive Board page 38 section B.6.3 Description of measurement methods and procedures to be applied:
Data will be measured by the project developer. Data is monitored annually to ensure methane destruction is claimed for methane used in electricity plant and flare when it is operational.
QA/QC procedures to be applied:
No comment
Any comment: No comment Data / Parameter: PEflare,y
Data unit: tCO2 Description: Project emissions from flaring of the residual gas stream in year y Source of data to be used: Calculated Value of data applied for the purpose of calculating expected emission reductions in section B..6.3
n/a
Description of measurement methods and procedures to be applied:
As per the “ Tool to determine project emissions from flaring gases containing Methane”
QA/QC procedures to be applied:
Regular maintenance should ensure optimal operation of flares. The enclosed flare shall be operated and maintained as per the specifications prescribed by the manufacturer.
Any comment: No comment Data / Parameter: Tflare Data unit: °C Description: Temperature in the exhaust gas of the flare Source of data to be used: Thermocouple Value of data applied for the purpose of calculating expected emission reductions in section B.6.3
n/a
Description of measurement procedure and procedures to be applied.
Measure the temperature of the exhaust gas stream in the flare by a Type N thermocouple. A temperature above 500 ºC indicates that a significant amount of gases are still being burnt and that the flare is operating.
QA/QC procedures to be applied:
Data will be backed up and archived where it will be stored till at least two years after the crediting period or two years after the last issuance of CERs. Thermocouple will be calibrated according to the manufacturer’s specifications.

PROJECT DESIGN DOCUMENT FORM (CDM PDD) - Version 03
CDM – Executive Board page 39 Any comment: No comment
Data / Parameter: Laws and regulations about waste management system in China Data unit: n/a Description: Some relevant laws and regulations about solid waste management system in
China should be monitored yearly. While there is some changes, the baseline scenario or monitor plan will changed accordingly.
Source of data to be used: Measurements by project participants Value of data applied for the purpose of calculating expected emission reductions in section B.5
n/a
Description of measurement methods and procedures to be applied:
Regular follow-up of law and regulations by project participants (e.g. governmental publications, official communications, official journal, conferences)
QA/QC procedures to be applied:
Set responsibility for follow-up and logging information
Any comment: No comment
B.7.2. Description of the monitoring plan: A monitoring plan will be implemented to ensure that the approved monitoring methodology is correctly implemented in order to enable the accurate and transparent determination of avoided emissions. The plan will incorporate the QA/QC procedures described in B.7.1 above. 1. Parameters to be monitored Main data to be monitored by this project includes:
• The quantity of landfill gas captured in year y (LFGtotal,y); • The quantity of landfill gas destroyed by electricity generation in year y (LFGelectricity,y); • The quantity of landfill gas received by flare in year y (LFGflared,y); • Mass fraction of methane in landfill gas captured in year y (wch4,y); • The quantity of electricity exported by this project in year y, generated from landfill gas (ELLFG,y); • The quantity of electricity imported by this project in year y (ECPJ,y); • Annual operation hours of generator set; • Pressure of landfill gas captured in year y (P); • Temperature of landfill gas captured in year y (T); • Project emissions from flaring of residue gas stream in year y (PEflare,y); • Temperature of the flue gas of the flare (Tflare).
2. Management structure for the implementation of monitoring plan

PROJECT DESIGN DOCUMENT FORM (CDM PDD) - Version 03
CDM – Executive Board page 40 A specific CDM department will be established by the project owner and a CDM Manager will be appointed for the implementation of the monitoring plan, and a CDM director responsible for supervising the implementation of the monitoring plan. The organizational structure for the CDM department is shown as follows:
Figure B. 7-1 Organizational structure for the proposed CDM project
Responsibility and CDM management: A CDM Manager will be appointed at the landfill with responsibility for monitoring all Project related activities and organising training. The CDM Manager is responsible for overseeing the implementation of this procedure. Competency requirements for the position of CDM Manager will be defined and applied to ensure that the CDM Manager is able to implement this procedure. All calculations will be checked and signed off by the CDM manager who will also be responsible for preparing and checking documents required for verification. A CDM monitoring team will report directly to the monitoring manager and who will have day to day responsibilities for checking instrumentation, record keeping, data handling and data processing, filing, reporting, organising repair and maintenance of monitoring equipment and ensuring the monitoring plan is adhered to as indicated in the approved PDD. The monitoring staff will receive technical training and refresher training as well as safety training to minimise exposure to workplace hazards. At least one fully trained technical member of the monitoring team will be present on every shift. A management level link will be established to ensure effective co-operation between landfill staff and CDM monitoring staff.

PROJECT DESIGN DOCUMENT FORM (CDM PDD) - Version 03
CDM – Executive Board page 41 All relevant information, notes of meetings, data files, maintenance records, defect reports, hard copy and computerised records of monitoring will be kept at a designated location and arranged in an orderly and transparent manner to facilitate audit as and when required. Responsibilities, procedures, methods, equipment types and specifications are described in detail in a site-specific CDM monitoring manual. 3. Monitoring equipment and its installation The on-line monitoring system of this project strictly follows the requirements of methodology ACM0001. Monitoring equipment shown in Figure B.7-2:
Figure B.7-2 Monitoring system flowchart
4. Data collection and management
On-line monitoring All key meters required to determine GHG emissions and emission reductions will be monitored from a central control point which will record meter readings at a pre-determined interval as specified in the CDM monitoring manual. These data will be used to continually update total emission reductions as long as the generating plants are in operation.
Manual data recording system CDM Manager will implement a manual data recording system to act as a back-up for the on-line monitoring system. This will involve completion of a log sheet that records flow meter readings at the start of the day (which is also the end of the previous day). Spot readings of other values (methane concentration, temperature and pressure) will also be recorded periodically and at the times when flow meter readings are taken.
Data archiving The on-line monitoring system will automatically and periodically (eg. weekly) archive data in a safe manner. Electronic documents will be saved for backup, with written documents and back-ups safely kept. Calibration data should be saved electronically. All information related to monitoring such as meeting minutes, data documents, maintenance records, accident reports, hard copies as well as computer
Landfill Generator
CH4 T F P
Flare
PEflare,y
F
F
LFG
ECPG
ELLFG,y
ECPJ,,y

PROJECT DESIGN DOCUMENT FORM (CDM PDD) - Version 03
CDM – Executive Board page 42 records, should be kept in order at designated locations to ensure examination process transparent and highly effective. These data will be stored until 2 years after the end of the crediting period. 5. Maintenance and calibration of meters All meters will be purchased and maintained as specified in the CDM monitoring manual according to manufacturer specifications. All key meters will be subject to a quality control regime that will include regular maintenance and calibration. A record will be maintained showing the location and unique identification number of each meter, the calibration status of that meter (when last calibrated, when next due for calibration) and who performs the calibration service. Calibration certificates will be retained for all meters until two years after the end of the crediting period. 6. Treatment of missing or corrupted data When data in the on-line system are corrupted or missing whilst the generators are operating (as shown, for example, by electricity output) the missing data can be estimated by taking the lower value of the parameter one hour before the error and one hour after the system restart. If there is evidence that neither of these values is representative, use the average value of the parameter from the previous 24 hours. The error will be recorded in the daily log sheet and the occurrence of the error will be investigated and rectified as soon as possible. If the on-line system is compromised for more than 24 hours, data will be manually recorded. Manually recorded data table will be backup data for methane destruction amount and other key parameters. Any deficiencies in methane flow monitoring data will be rectified by calculation from power generation data. 7. Non essential data The on-line monitoring system will also record “non-essential” data. Such data is termed non-essential because it is not directly listed in the CDM Monitoring Methodology, but it will constitute a means of corroborating the on-line system. Non-essential data will include measurements of net and gross output from individual generators, certificated conversion efficiency, waste deposition and any other data considered relevant to the project activity. 8. Document Control The Project Manager will implement a document control system that ensures that the current versions of necessary documents are available at the point of use. 10. Preparation of monitoring report A monitoring report will be prepared by CDM department at the end of each year, which can be viewed as summary of monitoring work for the year and used by DOE for verification. The content of the monitoring report should include data monitoring and checking, calculation of emission reductions and record on maintenance and calibration of monitoring meters. 11. Audit function and management review The Project Manager will arrange for an audit of the management system periodically and at least once per year. The auditor will not be involved in the daily operation of the landfill and if necessary, may be

PROJECT DESIGN DOCUMENT FORM (CDM PDD) - Version 03
CDM – Executive Board page 43 sourced from a third party. The auditor will assess the implementation of the monitoring procedure and the preparation of the monitoring report. Audit findings, and steps taken to address findings will be recorded and reviewed in a Management Review meeting (convened at least annually) at which time the effectiveness of these procedures will be reviewed and necessary changes implemented. B.8. Date of completion of the application of the baseline study and monitoring methodology and the name of the responsible person(s)/entity(ies): The application of the baseline study and monitoring methodology of the Project was completed on 01/12/2006 by Giulia Sartori , CDM Project Officer. Sindicatum Carbon Capital is a project participant. SECTION C. Duration of the project activity / crediting period C.1. Duration of the project activity: C.1.1. Starting date of the project activity: 22/04/2008 (equipment purchase contract)22 C.1.2. Expected operational lifetime of the project activity: 16 years C.2. Choice of the crediting period and related information: C.2.1. Renewable crediting period: C.2.1.1. Starting date of the first crediting period: C.2.1.2. Length of the first crediting period: C.2.2. Fixed crediting period: 10 years C.2.2.1. Starting date: 01/09/2009 C.2.2.2. Length:
22 Pipe Installation and Base for LFG Pre treatment Facilities Construction contract, 22 April 2008

PROJECT DESIGN DOCUMENT FORM (CDM PDD) - Version 03
CDM – Executive Board page 44 SECTION D. Environmental impacts D.1. Documentation on the analysis of the environmental impacts, including transboundary impacts: According to rules and regulations of China, Environmental Impact Assessment of the project activity has been carried out. Environmental Protection Bureau of Jiangsu Province has approved the EIA on June 10, 2008 (Approval No. Suhuanbiaofu [2008] 121). 1. Noises Noise during construction period is mainly from construction machinery and transport vehicles. The usage of construction machinery has been unavoidable but temporary only to the construction period. The generator sets used by this project will be set in a house with sound insulation function. Evergreen trees will be planted around the border of the plant, which will reduce the influence to the environment by the noise from the plant. The project manager will ensure that the noise levels meet category III requirement of “Standard of noise at boundary of industrial enterprises” (GB12348-90). 2. Air Pollution Air pollutants during construction period include the waste gas emitted by construction machinery and vehicles and the dust created during civil construction, loading and unloading of construction materials, stacking and clearing of construction waste. The project will meet the requirements stipulated in “Integrated Emission standard of air pollutants-II” (GB16927-1996) (SO2: 550 mg/m
3, NOx: 240 mg/m
3,
fume: 120 mg/m3).
3. Sewage and wastewater Construction wastewater will be discharged into the landfill’s existing wastewater treatment station Living wastewater will be discharged into municipal wastewater treatment plant. After above treatment, wastewater will not affect surrounding environment. D.2. If environmental impacts are considered significant by the project participants or the host Party, please provide conclusions and all references to support documentation of an environmental impact assessment undertaken in accordance with the procedures as required by the host Party: The project uses LFG to generate electricity, which meets national policy on promoting energy production from solid waste material. The implementation of this project will avoid direct release of LFG into atmosphere and reduce environmental pollution which has become a priority in China environmental impacts are not considered significant. SECTION E. Stakeholders’ comments E.1. Brief description how comments by local stakeholders have been invited and compiled: The Stakeholder consultation meeting was convened at Xuzhou landfill site at 08:30–11:30 on Thursday 23
rd Nov 2006. 21 participants attended from a list of different stakeholders which were invited by
Xuzhou Landfill. As well as the invitations to relevant offices, a public notice was displayed by Xuzhou landfill management before the meeting. Figures 1 and 2 show the meeting and the landfill site. The questions raised at the meeting have been reported below.

PROJECT DESIGN DOCUMENT FORM (CDM PDD) - Version 03
CDM – Executive Board page 45
Fig.1. Introduction of the project by Mr. Gao, Party secretary and Mr. Yan, Environmental Division of Yanqun Landfill
Fig.2. Landfill site
E.2. Summary of the comments received: All the participants understood well the project and where supportive due to the environmental benefits. Most participants showed interest and urged the project to be implemented as swiftly and quickly as possible. Most of the questions asked by the village representatives and the environmental bureau leader addressed environmental impacts of the generators. The following questions and clarifications were asked and answered accordingly: Q: The environmental impacts of the generators to the villages near by (5km). In particular water safety from the generators. A: The generators use a minimum amount of water for internal cooling. The water circuit is a closed one, using an internal fan for cooling the water. The only time when the water will be flushed out of the generators is at times of maintenance but will not be discharged in the main city water system. Q: The water in Xuzhou is very hard and the water will need to have added chemicals when used in the generators. Will that be flushed out onto the land and have any adverse effect on the surrounding agricultural land? A: The water when changed for maintenance will not be directly flushed onto the land but will be taken to a specialised treatment facility. Q: Do the generators produce and gases and if so are the harmful? A: the generators will product exhaust gases and heat but none of them are harmful. Q: Will the landfill have to implement an additional container to stock the gas coming out of the landfill before sending it to the generators? A: No the pipes that will be placed in the landfill for gas collection will be directly attached to the

PROJECT DESIGN DOCUMENT FORM (CDM PDD) - Version 03
CDM – Executive Board page 46 generators. Q: Will Sindicatum Carbon Capital chose the generators equipment? A: Yes SCC in consultation with Xuzhou landfill will chose the most appropriate and most modern generators as possible. Q: What are the costs of the operation? A: The costs are fully taken by SCC which means that there are no costs on local administration budgets or the landfill management. Q: Can the generators be dangerous for people near them? A: the generators will be enclosed in sound proof containers for safety issues and to minimise the amount of noise to the surrounding areas. Only trained staff will have direct access to the generators which means they pose no safety threats. Clarifications were asked on the collection system to the generators. A detailed explanation of the collection pipes and their connection was given as explained in the above sections. E.3. Report on how due account was taken of any comments received: Special attention will be given to how we dispose of the generator cooling water.
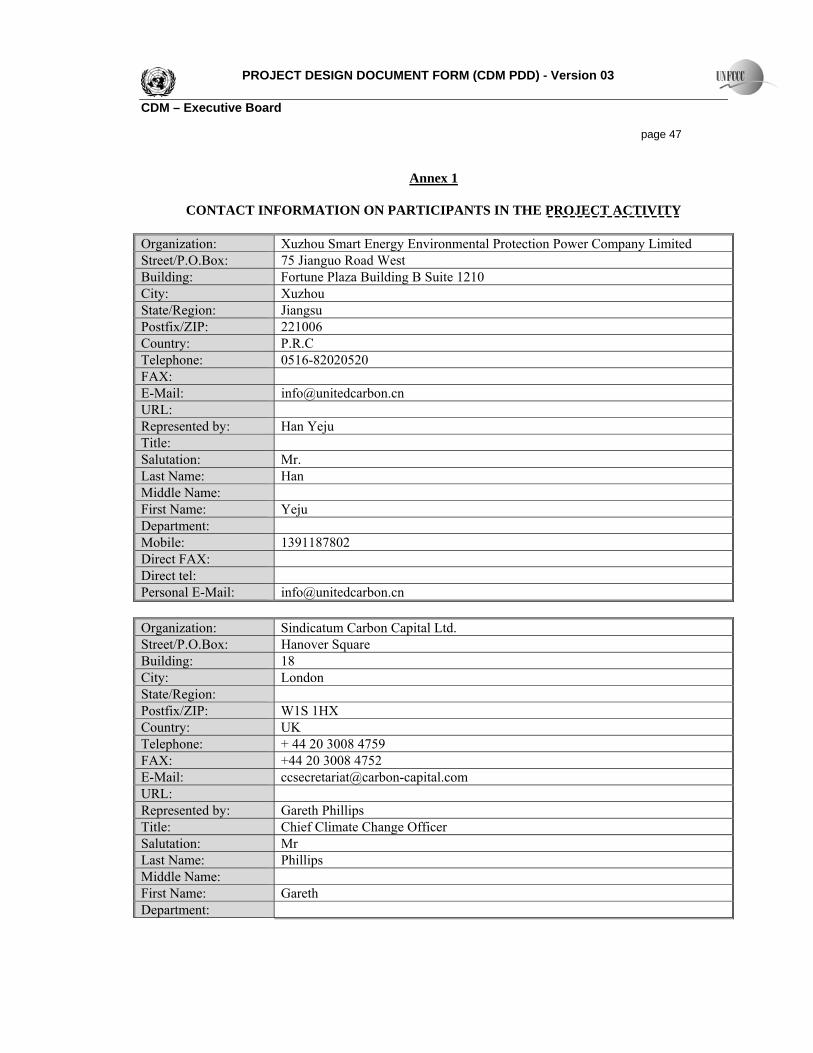
PROJECT DESIGN DOCUMENT FORM (CDM PDD) - Version 03
CDM – Executive Board page 47
Annex 1
CONTACT INFORMATION ON PARTICIPANTS IN THE PROJECT ACTIVITY Organization: Xuzhou Smart Energy Environmental Protection Power Company Limited Street/P.O.Box: 75 Jianguo Road West Building: Fortune Plaza Building B Suite 1210 City: Xuzhou State/Region: Jiangsu Postfix/ZIP: 221006 Country: P.R.C Telephone: 0516-82020520 FAX: E-Mail: [email protected] URL: Represented by: Han Yeju Title: Salutation: Mr. Last Name: Han Middle Name: First Name: Yeju Department: Mobile: 1391187802 Direct FAX: Direct tel: Personal E-Mail: [email protected] Organization: Sindicatum Carbon Capital Ltd. Street/P.O.Box: Hanover Square Building: 18 City: London State/Region: Postfix/ZIP: W1S 1HX Country: UK Telephone: + 44 20 3008 4759 FAX: +44 20 3008 4752 E-Mail: [email protected] URL: Represented by: Gareth Phillips Title: Chief Climate Change Officer Salutation: Mr Last Name: Phillips Middle Name: First Name: Gareth Department:

PROJECT DESIGN DOCUMENT FORM (CDM PDD) - Version 03
CDM – Executive Board page 48 Mobile: Direct FAX: +44 20 3008 4752 Direct tel: +44 20 3008 4759 Personal E-Mail: [email protected]

PROJECT DESIGN DOCUMENT FORM (CDM PDD) - Version 03
CDM – Executive Board page 49
Annex 2
INFORMATION REGARDING PUBLIC FUNDING There is no public funding from Annex I Parties for this project.

PROJECT DESIGN DOCUMENT FORM (CDM PDD) - Version 03
CDM – Executive Board page 50
Annex 3
BASELINE INFORMATION
Calculation of emission factor of the East China Power Grid 1. Calculation of OM Table A3-1. Calculation of simple OM emission factor of the East China Power Grid in 2004
Fuels Units Shanghai Jangsu Zhejiang Anhui Fujian Total Emission factor OXID NCV Emission (tCO2e)
(tc/TJ) (%) (MJ/t,m3
) J=G*H*I*F*44/12/10000(in mass)
A B C D E F=A+B+C+D+E G H I J=G*H*I*F*44/12/1000 (in volume
Raw coal 10,000 tones 2779.6 7601.9 4008.9 2906.2 2183.7 19480.3 25.8 100 20908 385,300,230
Washed coal 10,000 tones 0 25.8 100 26344 0
Other washed coal 10,000 tones 5.46 4.63 10.09 25.8 100 8363 79,826
coke 10,000 tones 0 29.2 100 28435 0
Coke oven gas 0.1billion m3
2.59 2.59 12.1 100 16726 192,198
Other gas 0.1billion m3
72.46 72.46 12.1 100 5227 1,680,380
Crude oil 10,000 tones 0 20 100 41816 0
Gasoline 10,000 tones 0 18.9 100 43070 0
Diesel 10,000 tones 2.69 27.17 6.23 36.09 20.2 100 42652 1,140,116
Fuel oil 10,000 tones 58.52 55.07 202.89 23.26 339.74 21.1 100 41816 10,991,148
LPG 10,000 tones 0 17.2 100 50179 0
Refinery gas 10,000 tones 0.77 0.55 1.32 15.7 100 46055 34,996
Natural gas 0.1billion m3
0.14 0.14 15.3 100 38931 30,576
Other petroleum products 10,000 tones
21.22 1.37 24.89 47.48 20 100 38369 1,335,957

PROJECT DESIGN DOCUMENT FORM (CDM PDD) - Version 03
CDM – Executive Board page 51 Other coking products 10,000 tones 0 25.8 100 28435 0
Other energy 10,000tce 6.43 15.48 21.91 0 100 0 0
Total
400,785,429
Data source: China Energy Statistical Yearbook 2005
Table A3-2. The amount of electricity of the East China Power Grid generated by thermal power plants in 2004
Province The amount of electricity
generated The amount of electricity
generated The proportion of electricity consumed by the
project The amount of electricity delivered
(GWh) (MWh) (%) (MWh)
Shanghai 711.27 71,127,000 5.22 67,414,171
Jangsu 1635.45 163,545,000 5.93 153,846,782
Zhejiang 952.55 95,255,000 5.68 89,844,516
Anhui 598.75 59,875,000 6.03 56,264,538
Fujian 504.9 50,490,000 6.07 47,425,257
Total 414,795,263
Data source: China Electric Power Yearbook 2005
Table A3-3. Calculation of simple OM of the East China Power Grid in 2004
The amount of electricity imported from Yangcheng, Shanxi( MWh) 11,649,610
Emission factor for Yangcheng, Shanxi(tCO2e/MWh) 1.113259
The amount of electricity imported from Central China Power Grid ( MWh) 26,933,850
Emission factor for Central China Power Grid (tCO2e/MWh) 0.82732
Total emission of East China Power Grid (tCO2e) 436,037,347
Total power delivered by East China Power Grid (MWh) 453,378,723
OM emission factor of East China Power Grid in 2004 (tCO2e/MWh) 0.96175
Data source: China Electric Power Yearbook 2005

PROJECT DESIGN DOCUMENT FORM (CDM PDD) - Version 03
CDM – Executive Board page 52
Table A3-4. Calculation of simple OM emission factor of the East China Power Grid in 2005
Data source: China Energy Statistical Yearbook 2006
Fuels Units Shanghai Jiangsu Zhejiang Anhui Fujian Total Emission
factor OXID NCV Emission(tCO2e)
(tc/TJ) (%) (MJ/t,m3
) J=G*H*I*F*44/12/10000(in
mass)
A B C D E F=A+B+C+D+E G H I J=G*H*I*F*44/12/1000 (in volume)
Raw coal 10,000 tones 2847.31 9888.06 4801.52 3082.9 2107.69 22727.48 25.8 100 20,908 449,526,100
Washed coal 10,000 tones 0 25.8 100 26,344 0
Other washed coal 10,000 tones 0 25.8 100 8,363 0
Coke 10,000 tones 0.03 0.03 29.2 100 28,435 913
Coke oven gas 0.1billion
m3 1.68 1.38 1.71 4.77 12.1 100 16,726 353,971
Other gas 0.1billion
m3 83.72 24.97 0.06 30 138.75 12.1 100 5,227 3,217,676
Crude oil 10,000 tones 27.01 27.01 20 100 41,816 828,263
Gasoline 10,000 tones 0 18.9 100 43,070 0
Diesel 10,000 tones 1.25 16 4.52 1.67 23.44 20.2 100 42,652 740,491
Fuel oil 10,000 tones 59.39 13.22 153.22 7.45 233.28 21.1 100 41,816 7,546,992
LPG 10,000 tones 0 17.2 100 50,179 0
Refinery gas 10,000 tones 0.57 0.83 1.4 15.7 100 46,055 37,117
Natural gas 0.1billion
m3 1.09 1.85 0.62 3.56 15.3 100 38,931 777,514
Other petroleum products 10,000 tones
21 8.38 34.8 64.18 20 100 38,369 1,805,850
Other coking products 10,000 tones 0 25.8 100 28,435 0
Other energy 10,000 tce 12.36 15.29 27.65 0 100 0 0
Total 464,834,887
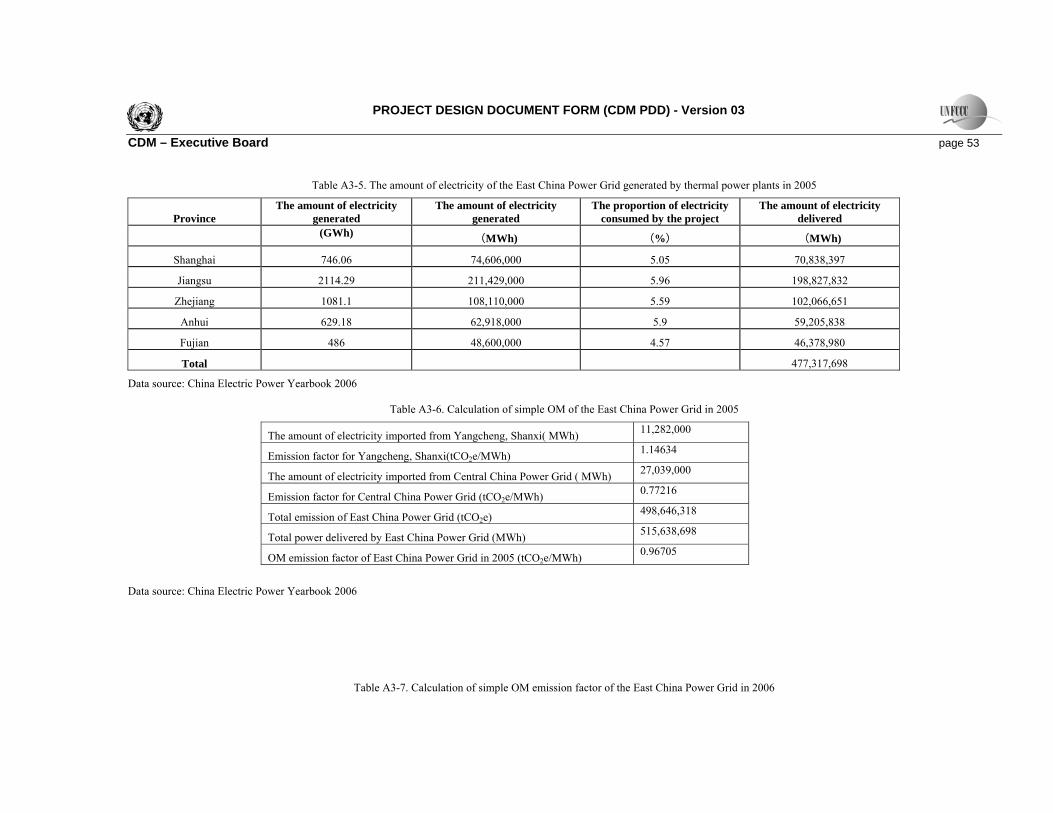
PROJECT DESIGN DOCUMENT FORM (CDM PDD) - Version 03
CDM – Executive Board page 53
Table A3-5. The amount of electricity of the East China Power Grid generated by thermal power plants in 2005
Province The amount of electricity
generated The amount of electricity
generated The proportion of electricity
consumed by the project The amount of electricity
delivered
(GWh) (MWh) (%) (MWh)
Shanghai 746.06 74,606,000 5.05 70,838,397
Jiangsu 2114.29 211,429,000 5.96 198,827,832
Zhejiang 1081.1 108,110,000 5.59 102,066,651
Anhui 629.18 62,918,000 5.9 59,205,838
Fujian 486 48,600,000 4.57 46,378,980
Total 477,317,698
Data source: China Electric Power Yearbook 2006
Table A3-6. Calculation of simple OM of the East China Power Grid in 2005
The amount of electricity imported from Yangcheng, Shanxi( MWh) 11,282,000
Emission factor for Yangcheng, Shanxi(tCO2e/MWh) 1.14634
The amount of electricity imported from Central China Power Grid ( MWh) 27,039,000
Emission factor for Central China Power Grid (tCO2e/MWh) 0.77216
Total emission of East China Power Grid (tCO2e) 498,646,318
Total power delivered by East China Power Grid (MWh) 515,638,698
OM emission factor of East China Power Grid in 2005 (tCO2e/MWh) 0.96705
Data source: China Electric Power Yearbook 2006
Table A3-7. Calculation of simple OM emission factor of the East China Power Grid in 2006

PROJECT DESIGN DOCUMENT FORM (CDM PDD) - Version 03
CDM – Executive Board page 54
Data source: China Energy Statistical Yearbook 2007
Fuels Units Shanghai Jiangsu Zhejiang Anhui Fujian Total Emission
factor OXID NCV Emission(tCO2e)
(tc/TJ) (%) (MJ/t,m3
) J=G*H*I*F*44/12/10000(in
mass)
A B C D E F=A+B+C+D+E G H I J=G*H*I*F*44/12/1000 (in volume)
Raw coal 10,000 tones 2744.45 10945.42 6065 3455.2 2369.63 25579.7 25.8 100 20,908 505,940,068
Washed coal 10,000 tones 0 25.8 100 26,344 0
Other washed coal 10,000 tones 150.54 23.06 173.6 25.8 100 8,363 1,373,419
Coke 10,000 tones 39.07 39.07 29.2 100 28,435 1,189,463
Coke oven gas 0.1billion
m3 1.71 3.13 0.23 0.71 5.78 12.1 100 16,726 428,920
Other gas 0.1billion
m3 84.64 106.54 3.28 25.12 219.58 12.1 100 5,227 5,092,160
Crude oil 10,000 tones 20.3 20.3 20 100 41,816 622,501
Gasoline 10,000 tones 0 18.9 100 43,070 0
Diesel 10,000 tones 2.13 3.7 4.11 1.21 1.11 12.26 20.2 100 42,652 387,305
Fuel oil 10,000 tones 44.51 3.77 71.98 0.02 4.5 124.78 21.1 100 41,816 4,036,838
LPG 10,000 tones 0 17.2 100 50,179 0
Refinery gas 10,000 tones 0.29 0.4 2.95 3.64 15.7 100 46,055 96,505
Natural gas 0.1billion
m3 3.2 13.5 9.18 25.88 15.3 100 38,931 5,652,267
Other petroleum products 10,000 tones
18.82 3.57 22.39 20 100 38,369 629,993
Other coking products 10,000 tones 0 25.8 100 28,435 0
Other energy 10,000 tCe 6.66 2.8 27.45 3.21 40.12 0 100 0 0
Total
525,449,440
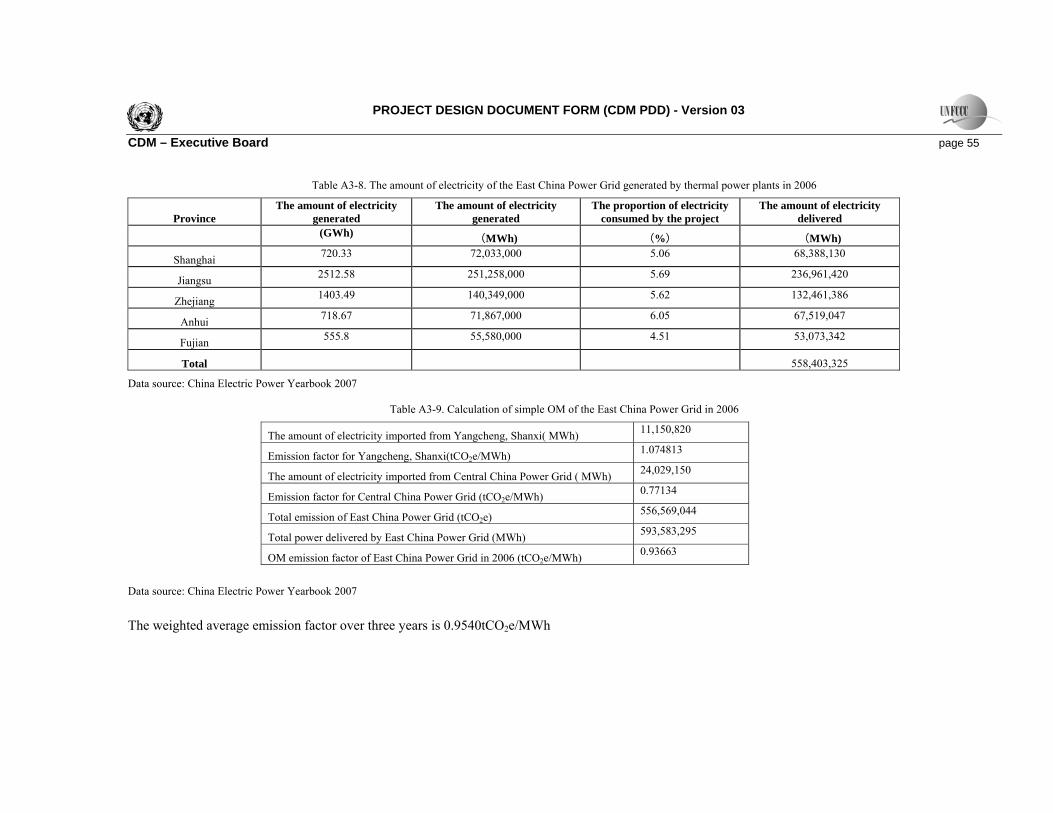
PROJECT DESIGN DOCUMENT FORM (CDM PDD) - Version 03
CDM – Executive Board page 55
Table A3-8. The amount of electricity of the East China Power Grid generated by thermal power plants in 2006
Province The amount of electricity
generated The amount of electricity
generated The proportion of electricity
consumed by the project The amount of electricity
delivered
(GWh) (MWh) (%) (MWh)
Shanghai 720.33 72,033,000 5.06 68,388,130
Jiangsu 2512.58 251,258,000 5.69 236,961,420
Zhejiang 1403.49 140,349,000 5.62 132,461,386
Anhui 718.67 71,867,000 6.05 67,519,047
Fujian 555.8 55,580,000 4.51 53,073,342
Total 558,403,325
Data source: China Electric Power Yearbook 2007
Table A3-9. Calculation of simple OM of the East China Power Grid in 2006
The amount of electricity imported from Yangcheng, Shanxi( MWh) 11,150,820
Emission factor for Yangcheng, Shanxi(tCO2e/MWh) 1.074813
The amount of electricity imported from Central China Power Grid ( MWh) 24,029,150
Emission factor for Central China Power Grid (tCO2e/MWh) 0.77134
Total emission of East China Power Grid (tCO2e) 556,569,044
Total power delivered by East China Power Grid (MWh) 593,583,295
OM emission factor of East China Power Grid in 2006 (tCO2e/MWh) 0.93663
Data source: China Electric Power Yearbook 2007
The weighted average emission factor over three years is 0.9540tCO2e/MWh
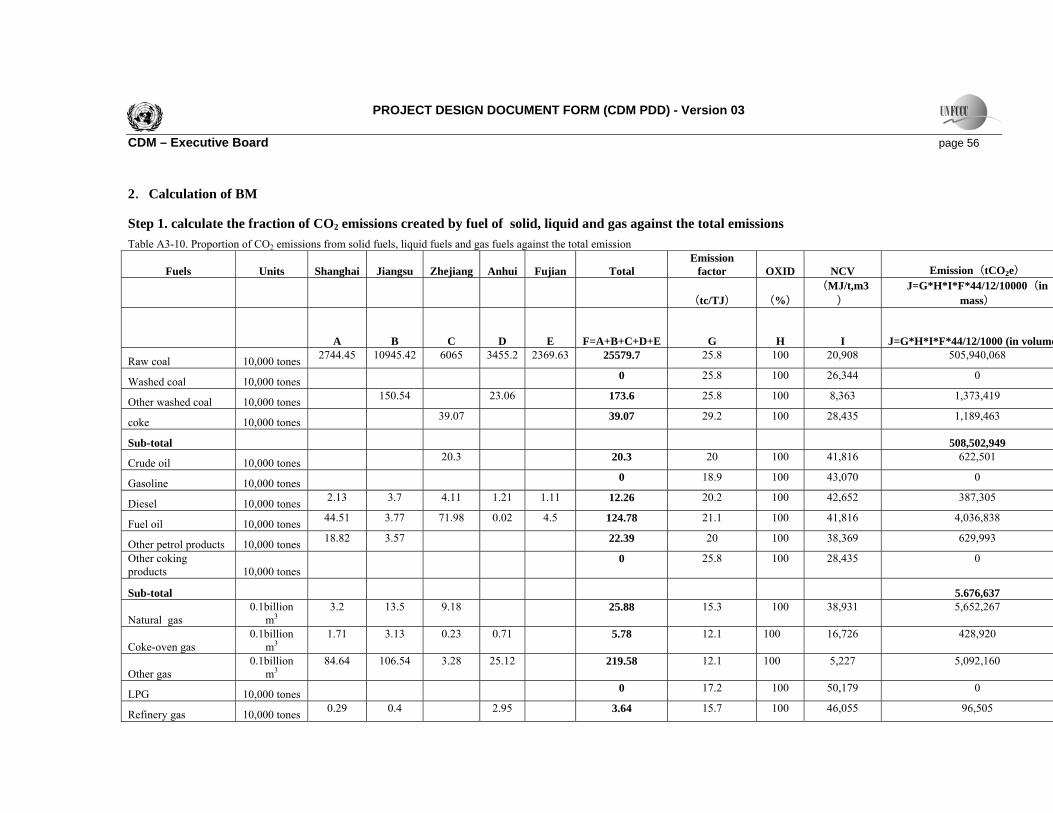
PROJECT DESIGN DOCUMENT FORM (CDM PDD) - Version 03
CDM – Executive Board page 56
2.Calculation of BM
Step 1. calculate the fraction of CO2 emissions created by fuel of solid, liquid and gas against the total emissions Table A3-10. Proportion of CO2 emissions from solid fuels, liquid fuels and gas fuels against the total emission
Fuels Units Shanghai Jiangsu Zhejiang Anhui Fujian Total Emission
factor OXID NCV Emission(tCO2e)
(tc/TJ) (%) (MJ/t,m3
) J=G*H*I*F*44/12/10000(in
mass)
A B C D E F=A+B+C+D+E G H I J=G*H*I*F*44/12/1000 (in volume
Raw coal 10,000 tones 2744.45 10945.42 6065 3455.2 2369.63 25579.7 25.8 100 20,908 505,940,068
Washed coal 10,000 tones 0 25.8 100 26,344 0
Other washed coal 10,000 tones 150.54 23.06 173.6 25.8 100 8,363 1,373,419
coke 10,000 tones 39.07 39.07 29.2 100 28,435 1,189,463
Sub-total 508,502,949
Crude oil 10,000 tones 20.3 20.3 20 100 41,816 622,501
Gasoline 10,000 tones 0 18.9 100 43,070 0
Diesel 10,000 tones 2.13 3.7 4.11 1.21 1.11 12.26 20.2 100 42,652 387,305
Fuel oil 10,000 tones 44.51 3.77 71.98 0.02 4.5 124.78 21.1 100 41,816 4,036,838
Other petrol products 10,000 tones 18.82 3.57 22.39 20 100 38,369 629,993
Other coking products 10,000 tones
0 25.8 100 28,435 0
Sub-total 5.676,637
Natural gas 0.1billion
m3 3.2 13.5 9.18 25.88 15.3 100 38,931 5,652,267
Coke-oven gas 0.1billion
m3 1.71 3.13 0.23 0.71 5.78 12.1 100 16,726 428,920
Other gas 0.1billion
m3 84.64 106.54 3.28 25.12 219.58 12.1 100 5,227 5,092,160
LPG 10,000 tones 0 17.2 100 50,179 0
Refinery gas 10,000 tones 0.29 0.4 2.95 3.64 15.7 100 46,055 96,505

PROJECT DESIGN DOCUMENT FORM (CDM PDD) - Version 03
CDM – Executive Board page 57 Sub-total 11,269,853
Total 525,449,440
Based the data from above table and formula (10), (11) and (12), it can be figure out that yCoal,λ =96.78%, yOil,λ =1.08%, yGas,λ =2.14%. Step 2. Calculate emission factor for fossil fuel-fired power
AdvGasyGasAdvOilyOilAdvCoalyCoalThermal EFEFEFEF ,,,,,, ×+×+×= λλλ =0.8991(tCO2e/MWh)
Step 3. Calculate BM emission factor for the East China Power Grid
Table A3-11. Installed capacity of the East China Power Grid in 2006 Installed capacity Unit Shanghai Jiangsu Zhejiang Anhui Fujian Total Thermal power MW 14,526 51,776 35,391 14,134 13,001 128,828 Hydro-power MW 0 136 8,369 1,001 8,957 18,463
Nuclear power MW 0 0 3,066 0 0 3,066 Wind power and
others MW 253 162 43 0 89 547
Total MW 14,779 52,074 46,869 15,135 22,047 150,904 Data source: China Electric Power Yearbook 2007
Table A3-12. Installed capacity of the East China Power Grid in 2005
Installed capacity Units Shanghai Jiangsu Zhejiang Anhui Fujian Total Thermal power MW 13,114 42,506 27,688 11,423 9,345 104,077 Hydro-power MW 0 142.6 6,952 750 8,225 16,069
Nuclear power MW 0 0 3,066 0 0 3,066 Wind power and
others MW 253 59 37 0 52 401
Total MW 13,367 42,708 37,743 12,173 17,622 123,613 Data source: China Electric Power Yearbook 2006

PROJECT DESIGN DOCUMENT FORM (CDM PDD) - Version 03
CDM – Executive Board page 58
Table A3-13. Installed capacity of the East China Power Grid in 2004 Installed capacity unit Shanghai Jiangsu Zhejiang Anhui Fujian Total Thermal power MW 12,015 28,290 21,440 9,365 8,315 79,424 Hydro-power MW 0 127 6,418 692.8 7,180 14,418
Nuclear power MW 0 0 3,056 0 0 3,056 Wind power and
others MW 3.4 17.5 39.7 0 12 72.6
Total MW 12,018 28,434 30,954 10,057 15,508 96,971 Data source: China Electric Power Yearbook 2005
Table A3-14. Calculation of BM emission factor for the East China Power Grid
Installed
capacity in 2004
Installed capacity in
2005
Installed capacity in
2006
Newly added installed capacity
from 2004 till 2006
Proportion against newly added installed capacity
A B C D=C-A Thermal power (MW) 79,424 104,077 128,828 49,404 91.60%
Hydro-power (MW) 14,418 16,069 18,463 4045 7.50%
Nuclear power (MW) 3,056 3,066 3,066 10 0.02%
Wind power (MW) 72.6 401.3 547 474.4 0.88%
Total (MW) 96,971 123,613 150,904 53,933 100.00%
Share against total installed capacity in 2006
64.26% 81.92% 100%
EFgrid,BMsimple,y=0.8991x91.6%=0.8236tCO2e/MWh.
Annex 4

PROJECT DESIGN DOCUMENT FORM (CDM PDD) - Version 03
CDM – Executive Board page 59
MONITORING INFORMATION
- - - - -