classification ofrat behaviorwith an image
TRANSCRIPT
Behavior Research Methods, Instruments, & Computers2000,32 (1),63-71
Classification of rat behavior with animage-processing method and a neural network
J, B. 1.ROUSSEAUUtrecht University, Utrecht, The Netherlands
P. B. A. VAN LOCHEMNoldus Information Technology, Wageningen, The Netherlands
and
W. H. GISPEN and B. M. SPRUlJTUtrecht University, Utrecht, The Netherlands
Video recordings of 11 rats were digitized at five frames per second, and parameters describing theshape and the position of the rat were calculated. The behavior displayed by the rats was observed byan experienced observer. Separate neural networks were trained and validated, using the data for eachindividual rat. The neural networks correctly classified an average of 76.53% of the frames in the validation set and 98.18% of the frames in the training set. A single neural network was trained with 6 ratsand validated with 5 rats. The neural network correctly classified 63.74% of the frames in the validationset and 82.85%of the frames in the training set.
To quantify and qualify the effects of experimentalmanipulations, observers or researchers often measurethe overt, postural behavior of a subject or the activity asubject performs. To reduce the complexity of the registration, a selection of behaviors is made from the totalnumber ofbehaviors that a subject can perform. This listof behavioral categories is known as the ethogram. Themeasurements of these categories, often expressed inunits of time (duration) or in frequency of occurrence,are extensively used in multiple research areas, such aspharmacology, agricultural science, and biomedical research. The postures, transition of postures, or series ofpostures that constitute a behavioral element have beendescribed for several species. These publications are usedas a standard within a field to form a consensus on thedefinition of a behavioral category. Previous publications have described the typical postures that constitutethe behavioral categories of the rat (Rattus norvegicus;Timmermans, 1978) or the mouse (Mus musculus; VanAbeelen, 1963). In the case ofrats, the postures ofa singleanimal (Renner & Seltzer, 1991; Timmermans, 1978),the ontogenical development of these postures (Geisler,Westerga, & Gramsbergen, 1993), and the postures oftwosocially interacting animals (Grant & Mackintosh, 1963;Timmermans, 1978) have been described.
This work was supported by Eureka Grant EU88011. The authorsthank all the participants in the Eureka project who participated over thepast years for their valuable discussions on rat behavior and behaviorregistration. Correspondence concerning this article should be addressed to B. M. Spruijt, Rudolf Magnus Institute for Neurosciences,Department of Medical Pharmacology, Utrecht University, P.O. Box80040,3508 TA Utrecht, The Netherlands (e-mail: [email protected]).
63
Human observers record the majority ofthe behavioralmeasurements described in the literature, either from direct observation or from videotape. The observations arestored on such media as check sheets, audiotapes, andcomputer disks. The need for automated behavior registration is prompted by the acknowledgment ofthe limitedcapacity of human observers for registering behavior accurately. Registration of behaviors with short duration,of behaviors that alternate rapidly, or of observations oflong duration is beyond the registration capacity of mosthuman observers. These limitations ofhuman observationcapacity lead to methodological problems, such as lowintra- and interobserver reliability and consequent lowtest/retest reliability, and they limit the validity ofthe comparison ofresults obtained at different laboratories or overa large time span at one laboratory.
From the early days of behavioral research, methodswere developed that allowed automated quantification ofbehavior, such as capacitance measuring devices (Stoff,Stauderman, & Wyatt, 1983; Tomkins & O'Donovan,1981), infrared beams and photobeam detectors (Delbarre,Dumas, & Guionniere, 1970; Makanjuola, Hill, Maben,Dow, & Ashcroft, 1977), Doppler shift radar (Marsden &King, 1979), touch panels (Kao, Shaw, Young, & Jan,1995), and weight gauges (Gapenne, Simon, & Lannou,1990; Schlingmann, van de Weerd, Baumans, Remie, &van Zutphen, 1998). In recent years, the use of imageprocessing hardware and software for behavior registration has gained popularity. Such techniques are used toquantify such behaviors as movement in an open field (Bonatz, Steiner, & Huston, 1995; Cools, Ellenbroek, Gingras,Engbersen, & Heeren, 1997; Dai & Carey, 1994), orientation behavior in Morris mazes (Gallagher, Burwell, &
Copyright 2000 Psychonomic Society, Inc.

64 ROUSSEAU, VAN LOCHEM, GISPEN, AND SPRUUT
Table 1Description of the Behaviors (Ethogram)
as Scored by the Human Observer
Sit
Groom•
Head dip
Stretched attend
Rear
Head raise
Hunch
& Harmon, 1997). A neural network quantified whethethe pigs were huddling or spread out, thus indicating thcomfort ofthe animals in their pens. Neural network tedniques have also been applied to behavior classificatioof rats, using data from a modified Stoelting electroniactivity monitor (Gonzalez & Arnaldo, 1993).
An automated system using artificial neural networkmust address a number of issues to successfully classifthe behavior ofanimals. The primary concern is to devisand select relevant features of the digital representatioof the animal by which to discriminate the various behaxioral classes. The second issue is to select a suitable neunnetwork architecture and learning parameters. These s(lections include the number oflayers, the number of'neirons per layer, and the optimal learning function. Thtime-dependent nature ofbehavior and the modificatiorover time must also be attended to in either the featureor the architecture. Finally, the generalization ability (neural network classification from one animal to an atimal not used in the training has to be assessed.
The objective ofthis study was to address some oftlissues mentioned above. The temporal nature of behaiior is accounted for by presenting the parameters calctlated from the digital representation of the animal OVI
three consecutive time points. The applied architectui
Figure 1. A number of typical examples ofthe postures cornsponding to the behavioral classes used to train the neural network. Classes that consist of a number of consecutive posture:such as walking and stationary rotation, are not displayed. Thexamples for sit and head raise are taken from two consecutivframes from the same videotape.
DescriptionBehavior
Burchinal, 1993; Wolfer & Lipp, 1992), and the social interactions between 2 rats (Arakawa & Ikeda, 1991; SamsDodd, 1995; Spruijt, Hoi, & Rousseau, 1992). Such methods only register the spatial position (x-, y-coordinates)of the animal by calculating the spatial coordinates of thecenter of gravity of the group of pixels representing theanimal. These coordinates are subsequently used to calculate parameters that quantify distance moved, the timespent in certain areas of the observation area, and thepath shape.
Alternatively, other groups have developed imageprocessing systems that qualify the ongoing behavior,using the whole digital representation of the animal(Kernan, Mullenix, & Hopper, 1988; Spruijt & Gispen,1983). These systems calculate a large number of parameters describing the postures ofa rat and use these toclassify behavior with statistical classification or rulebased techniques. A promising alternative classificationtechnique, which has been researched extensively in thepast decade, is the classification using artificial neuralnetworks implemented on standard computers. Neuralnetworks are particularly successful in labeling classesfrom noisy and fuzzy data and are generally able to correctly generalize from examples used during the trainingto examples never presented before. The behavior ofanimals contains fuzzy transitions from one behavioralclass to another, and various behavioral classes can occurirrespective of the orientation of the animal relative tothe observer. These considerations possibly make traditional classification methods, such as statistical classification or rule-based classification, less suitable for theclassification of behavior.
Neural networks have been successfully used for classification problems in such diverse fields as ECG classification (Simon & Eswaran, 1997), recognition ofvocalizations of fallow deer (Reby et aI., 1997), and pistachionut sorting (Ghazanfari, Kusalik, & Irudayaraj, 1997).Neural network classification of digital images has alsobeen applied to behavioral observations of pigs (Shao, Xin,
Head raise
SitWalkHead dip
Hunch
Missing frame
Stretched attendGroomRear
The rat is immobile.The rat displaces itself.The rat dips its head over the edge of the obser
vation platform.The rat raises its head; the point of its nose is
above the back.The body of the rat is stretched and immobile.The rat licks and rubs its paws on its body.The rat stands on its hind legs, and the back is
straight.The rat stands on its hind legs while the back is
bent.Stationary rotation The rat rotates the front part of the body with-
out moving the hind legs.The digitalization program misses a frame,
owing to excessive random noise.

BEHAVIOR CLASSIFICATION NEURAL NETWORK 65
and learning rule of the neural network are a multilayerfeed-forward network and standard backpropagation witha momentum term. The generalization is addressed by using two data sets. In one, the parameters belonging to a single rat are split at random in half; the first halfis used totrain the neural network, and the second half is used tovalidate the classification of the network. A separate network is trained for each animal. In the second data set, halfof all the animals are assigned to the training set, and theother half to the validation set. A single network is trained,to assess the generalization capability over animals ofthe neural network.
MATERIALS AND METHOD
Eleven male rats (UWU/CPB-Wistar) bred at the GOL, UtrechtUniversity (227 ± 28 gram) were used. The animals were placed ona nonreflecting black metal plate with a 50 X 50 em area. The platewas placed on a box at a height of 33 cm from the floor. The platewas placed against a black background. A standard monochromeCCO camera (Sony AVC-OSCE) was placed on a tripod at a distance of96 cm from the back of the plate, at a height of 70 cm. Thecamera was slightly inclined downward. Simultaneously, recordings were made from directly above the platform, but the data fromthis angle were not used. The recordings were performed under redlight and lasted for 10 min. The observations were recorded with astandard VCR (Sanyo VHR-S700ES). The recordings were digitized with the Etho Vision software at a sample rate of five framesper second over a period of 8 min. The resulting digital movies
could be replayed with a custom-developed computer program. Allthe software was developed in cooperation with Noldus Information Technology (Wageningen, The Netherlands).
An experienced human observer scored the digital recordings of2,400 frames per rat according to the ethogram described in Table I.The behaviors scored are head dip (the rat bends its neck over theedge ofthe observation platform), sit, walk, head raise (the rat raisesits head so that the point of the nose is above the back), stretchedattend (the rat stands on three or four legs and is slightly inclinedforward; the head is bent forward), groom (the rat grooms itself;this category includes all kinds ofgrooming, such as flank, head, oranogenital grooming), rear (the animal stands supine on two legs,and the back is straight), hunch (the animal stands on two legs, andthe back is slightly curved), stationary rotation (the rat rotates without actually moving), fall (the rat falls off the observation platform),and missing frame (a frame could not be digitized, owing to randomnoise). A number of typical examples of the postures of the rats forsome behavioral categories are displayed in Figure I.
By using a custom-designed software program, the parameterslisted in Table 2 were calculated for each frame of the digitalmovies. Figure 2 shows an example of the location of a number ofthe parameters on a digital representation ofa rat. The tail of the ratwas eliminated from the image of the rat by means of imageprocessing techniques (erosion and dilation) for the calculation ofthe shape parameters (centralized moments, scalar invariant, andcircularity). The relative positions ofthe nose and tail points withinthe rectangle bounding the rat were also calculated. Some framescould not be digitized properly, owing to random noise in the videorecordings. These frames were coded with a missing value. Theframes during which the rat was not visible on the recording, because it had fallen off the observation platform, were also scored
Table 2Parameters Calculated From the Digital Image of the Rat
Parameter Explanation Parameter
FRAME NUMBER Sequential number of the CIRCULARITYframe in a movie
AREA Area of the rat in pixels PRINCIPAL AXIS(equals CMOO)
CENTERX x ordinate of the center of ANGLEIgravity projected on the medial axis
CENTERY y ordinate of the center of ANGLE2gravity projected on the medial axis
TAILBODYX x ordinate of the base of the tail ANGLE3
TAILBODYY y ordinate of the base of the tail LENGTHI
NOSEX x ordinate of the nose LENGTH2
NOSEY y ordinate of the nose LENGTH3
BOXXI x ordinate of the upper left corner DMOof the bounding rectangle
BOXYI y ordinate of the upper left corner DMIof the bounding rectangle
BOXX2 x ordinate of the lower right corner DM2of the bounding rectangle
BOXY2 y ordinate of the lower right corner DM3of the bounding rectangle
CMII toCM40 Centralized moment 1,1 to DM4centralized moment 4,0(Masters, 1994)
Sil to Sill Centralized moments, scale andorientation independent (Kernan,Mullenix, & Hopper, 1988)
Explanation
Closeness (variance) of thedigital shape to the circular shape
Axis through the digital shapewith the minimal dispersion
Angle of the line between thecenter of gravity and the nose point
Angle of the line between thecenter of gravity and the tail point
Angle of the lines between thenose point/center of gravity andthe tail point/center of gravity
Length of the line between thecenter of gravity and the nose point
Length of the line between thecenter of gravity and the tail point
Length of the line between thetail point, the center of gravity,and the nose point
Displacement of the center ofgravity over one frame
Displacement of the center ofgravity over two frames
Displacement of the center ofgravity over three frames
Displacement of the center ofgravity over four frames
Displacement of the center ofgravity over five frames

66 ROUSSEAU, VAN LOCHEM, GISPEN, AND SPRUUT
ITail point I
ICenter of gravity I
IAngle 21
I Angle 1 I
ILength 21
r""Nose point .J
IAngle 31Figure 2. An example of some of the parameters calculated from the digital representation of a rat. The pa
rameters displayed include the nose and tail points and the center of gravity. The various angles and the lengthsbetween these points are calculated as well. The shape parameters (centralized moments) are not depicted in thisfigure.
with a missing value. All the parameters were normalized over allthe observations with a z-transformation. Each behavior was codedin a separate data column in a I-of-C format-that is, each behavioral class was coded with a I if that behavior occurred and with aoif the behavior did not occur.
The observations were split into two data sets. (I) The observation of each individual rat was split at random into a training and avalidation set, with equal frequencies ofeach of the behavioral categories (Data Set I). A separate neural network was trained for eachof the observations. (2) Six of the observations were randomly assigned to a data set used to train a single neural network, and thefive remaining observations were used to assess the performance ofthis neural network (Data Set 2). The comparison of the classifications for both data sets is indicative of the ability of a neural network classifier to generalize over observations.
Using the Stuttgart Neural Network Simulator (Institute of Parallel and Distributed High-Performance Systems, University ofStuttgart), a feed-forward neural network was constructed with threelayers of 165 input neurons, 80 hidden neurons, and 10 output neurons. The input layer was fed with the parameters of three consecutive frames. Each of the neurons in the output layer correspondedto one of the behavioral classes (see Figure 3). The network wastrained during 200 cycles, during which each ofthe frames from thetraining sets was presented to the network in random order. A filecontaining the state of the neural network was saved each 5 training cycles, and the classification on the training and validation setswas calculated. The learning function was backpropagation with amomentum term (Rumelhart, Hinton, & Williams, 1986). The valuesofthe two parameters ofthe learning function were learning rate (a),.2, and momentum term, .0 I.
After training, the performance of the network was assessed,using the neural network with the optimal classification. For furtheranalysis, in the case of Data Set I, the neural nets obtained after thecomplete 200 training cycles were used. In the case of Data Set 2,
Input
Hidden
Output
Rear Walk Sit Groom .....
Figure 3. An example of a neural network architecture. The network is divided into three layers: the input, hidden, and outpulayers. Each neuron (unit) in the input layer receives as input thlz-transformed value of one of the parameters. This value is feeforward to each unit in the hidden layer and is modified according to the weight of the connection. Similarly, the activations of tbunits in the hidden layer are fed to the final (output) layer. Eaclneuron in the output layer corresponds to one behavioral categoryAfter training, the behavior classified by the neural network iconsidered to be the output neuron with the highest activation.
BEHAVIOR CLASSIFICATION NEURAL NETWORK 67
110 [ o Validation (mean =76.53 %)100 "'-"'
90c:
800~as(J 70~
'iiiIf) 60as'0U 50~ 40~
0(J
'::!i!. 300
20
10
01 2 3 4 5 6 7 8 9 10 11
Observation (rat) number
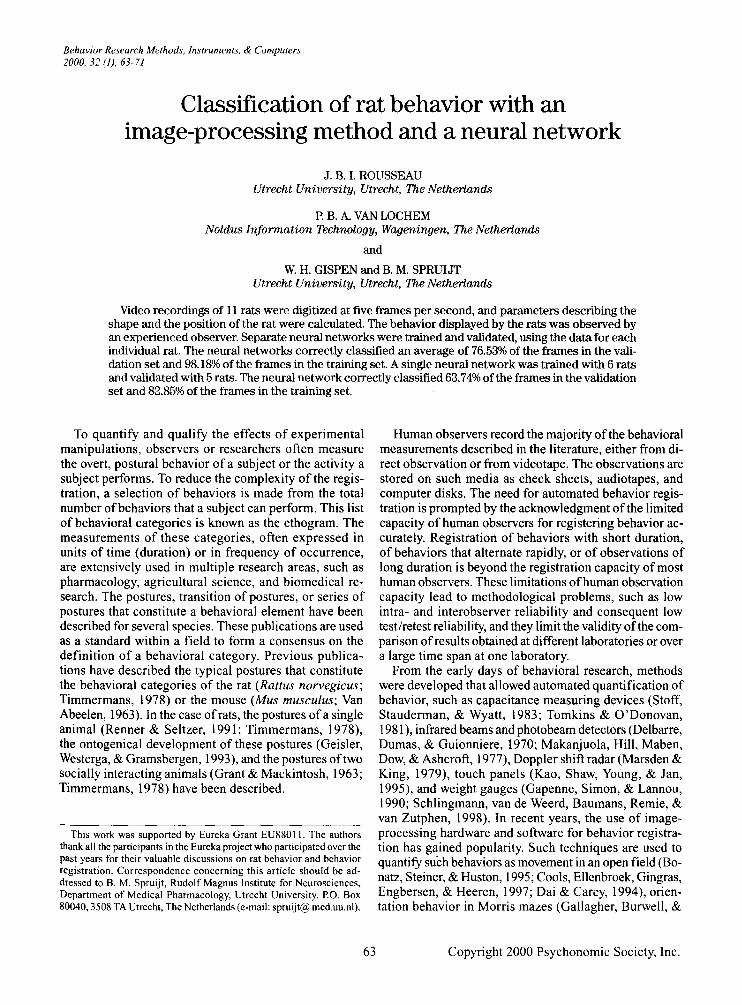
Figure 4. The classification of behavior (Data Set 1). A separate neural network was trained on each observation. This observation was split at random into a training set and a validation set. The average for correctly classified behaviors was 76.53% for thetraining sets and 98.18% for the validation sets.
the neural network with the maximal percentage of correctly classified behaviors was selected from the 40 available neural networks.Each of the data points in the validation set was presented to thenetwork. and the activation values of each of the output neuronswere written to a file. The behavioral category coded by the neuronwith the highest activation level was considered to be the behaviorclassified by the neural network. This method is also known as winner takes all. Behaviors classified by the neural network with a duration of one frame were disregarded, and the previous behaviorwas considered to be still active.
The performance of the neural network classification can be assessed by using two approaches. The first approach compares theclassification on the basis ofsingle individual frames ofO.2-sec duration. The classification ofthe human observer and the neural network were compared in confusion matrices that included two mea-
sures of interobserver classifications appropriate for k-class situations: normalized mutual information (NMI; Forbes, 1995) and Cohen's kappa (x; Cohen, 1960). This approach was used for bothData Sets I and 2. In the second approach, the durations and frequencies of behaviors derived from the human and the neural networks were compared with a one-way analysis ofvariance (ANOVA),using SPSS for Windows Version 6.1.4.
RESULTS
Data Set 1The percentage ofcorrectly classified frames for Data
Set I is displayed in Figure 4. The average percentage ofcorrectly classified frames is 76.53% for the validation
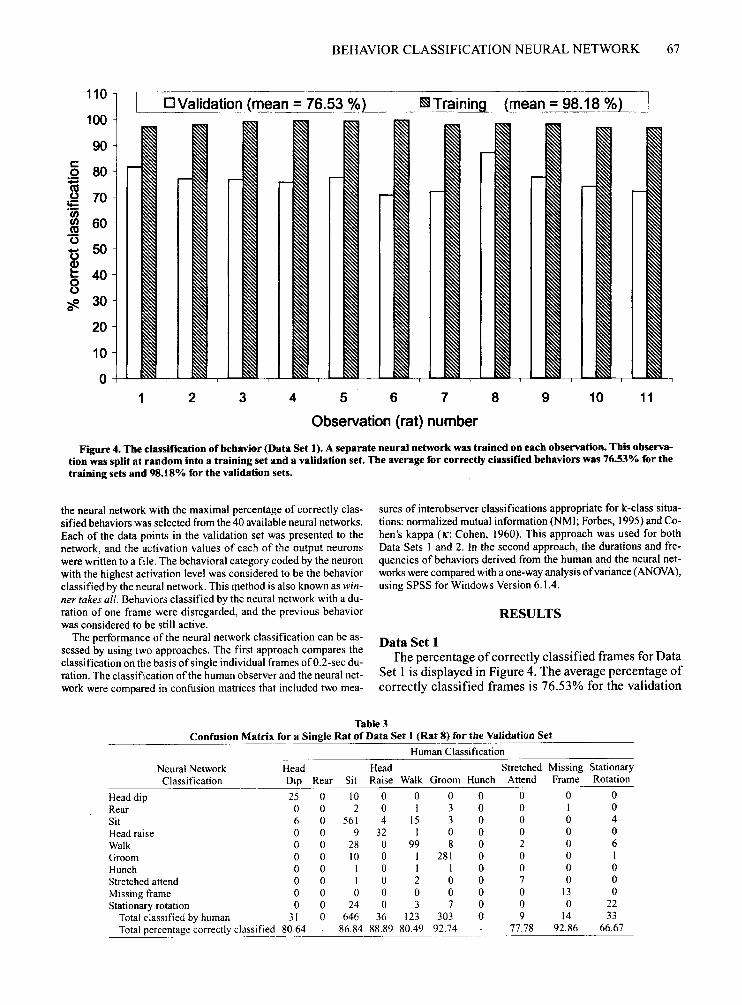
Table 3Confusion Matrix for a Single Rat of Data Set I (Rat 8) for the Validation Set
Human Classification
Neural Network Head Head Stretched Missing StationaryClassification Dip Rear Sit Raise Walk Groom Hunch Attend Frame Rotation
Head dip 25 0 10 0 0 0 0 0 0 0Rear 0 0 2 0 I 3 0 0 I 0Sit 6 0 561 4 15 3 0 0 0 4Head raise 0 0 9 32 I 0 0 0 0 0Walk 0 0 28 0 99 8 0 2 0 6Groom 0 0 10 0 I 281 0 0 0 IHunch 0 0 I 0 I I 0 0 0 0Stretched attend 0 0 I 0 2 0 0 7 0 0Missing frame 0 0 0 0 0 0 0 0 13 0Stationary rotation 0 0 24 0 3 7 0 0 0 22
Total classified by human 31 0 646 36 123 303 0 9 14 33Total percentage correctly classified 80.64 86.84 88.89 80.49 92.74 77.78 92.86 66.67
68 ROUSSEAU, VAN LOCHEM, GISPEN, AND SPRUUT
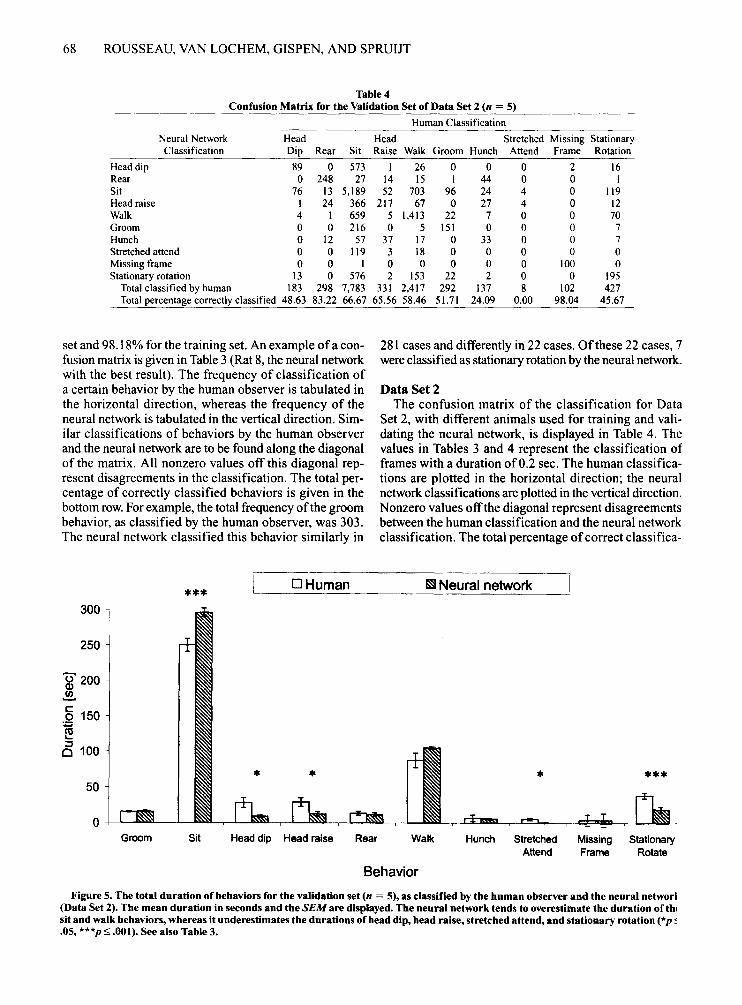
Table 4Confusion Matrix for the Validation Set of Data Set 2 (n = 5)
Human Classification
Neural Network Head Head Stretched Missing StationaryClassification Dip Rear Sit Raise Walk Groom Hunch Attend Frame Rotation
Head dip 89 0 573 I 26 0 0 0 2 16Rear 0 248 27 14 15 I 44 0 0 ISit 76 13 5,189 52 703 96 24 4 0 119Head raise I 24 366 217 67 0 27 4 0 12Walk 4 I 659 5 1,413 22 7 0 0 70Groom 0 0 216 0 5 151 0 0 0 7Hunch 0 12 57 37 17 0 33 0 0 7Stretched attend 0 0 119 3 18 0 0 0 0 0Missing frame 0 0 I 0 0 0 0 0 100 0Stationary rotation 13 0 576 2 153 22 2 0 0 195
Totalclassified by human 183 298 7,783 331 2,417 292 137 8 102 427Totalpercentage correctly classified 48.63 83.22 66.67 65.56 58.46 51.71 24.09 0.00 98.04 45.67
set and 98.18% for the training set. An example ofa confusion matrix is given in Table 3 (Rat 8, the neural networkwith the best result). The frequency of classification ofa certain behavior by the human observer is tabulated inthe horizontal direction, whereas the frequency of theneural network is tabulated in the vertical direction. Similar classifications of behaviors by the human observerand the neural network are to be found along the diagonalof the matrix. All nonzero values off this diagonal represent disagreements in the classification. The total percentage of correctly classified behaviors is given in thebottom row.For example, the total frequency ofthe groombehavior, as classified by the human observer, was 303.The neural network classified this behavior similarly in
281 cases and differently in 22 cases. Ofthese 22 cases, 7were classified as stationary rotation by the neural network.
Data Set 2The confusion matrix of the classification for Data
Set 2, with different animals used for training and validating the neural network, is displayed in Table 4. Thevalues in Tables 3 and 4 represent the classification offrames with a duration of 0.2 sec. The human classifications are plotted in the horizontal direction; the neuralnetwork classifications are plotted in the vertical direction.Nonzero values offthe diagonal represent disagreementsbetween the human classification and the neural networkclassification. The total percentage ofcorrect classifica-
***DHuman mNeural network
250
0' 200Q)
~
§ 150;
~
6 100
50
Groom Sit Head dip Head raise Rear Walk
* ***
rDssm ...., cf-..I.. c._Hunch Stretched Missing Stationary
Attend Frame Rotate
Behavior
Figure 5. The total duration of behaviors for the validation set (n = 5), as classified by the human observer and the neural networl(Data Set 2). The mean duration in seconds and the SEM are displayed. The neural network tends to overestimate the duration ofthlsit and walk behaviors, whereas it underestimates the durations of head dip, head raise, stretched attend, and stationary rotation (*p ~
.05, ***p::; .001). See also Table 3.
BEHAVIOR CLASSIFICATION NEURAL NETWORK 69
tions per behavioral category is displayed in the bottomrow of the table. The overal1 percentage ofcorrect classifications for the 0.2-sec frames for Data Set 2 was 82.85%(K" = .729, NMI = .531) for the training set and 63.74%(K" = AI I, NMI = .239) for the validation set.
The results of the assessment of the neural networkperformance expressed in duration and frequencies aredisplayed in Figures 5 and 6. The total duration of eachbehavior category for the validation set (n = 5) is displayed in Figure 5. A one-way ANOVAyielded a significant difference for the duration of the fol1owing behaviors: sit [F(8,1) = 19.20,p =.002], head dip [F(8,1) =7.30, P = .027], head raise [F(8,1) = 6.17, P = .038],stretched attend [F(8, I) = 6.36, P = .036], and stationaryrotation [F(8, I) = 17.29,P = .003]. The other behaviorsdid not yield significant differences.
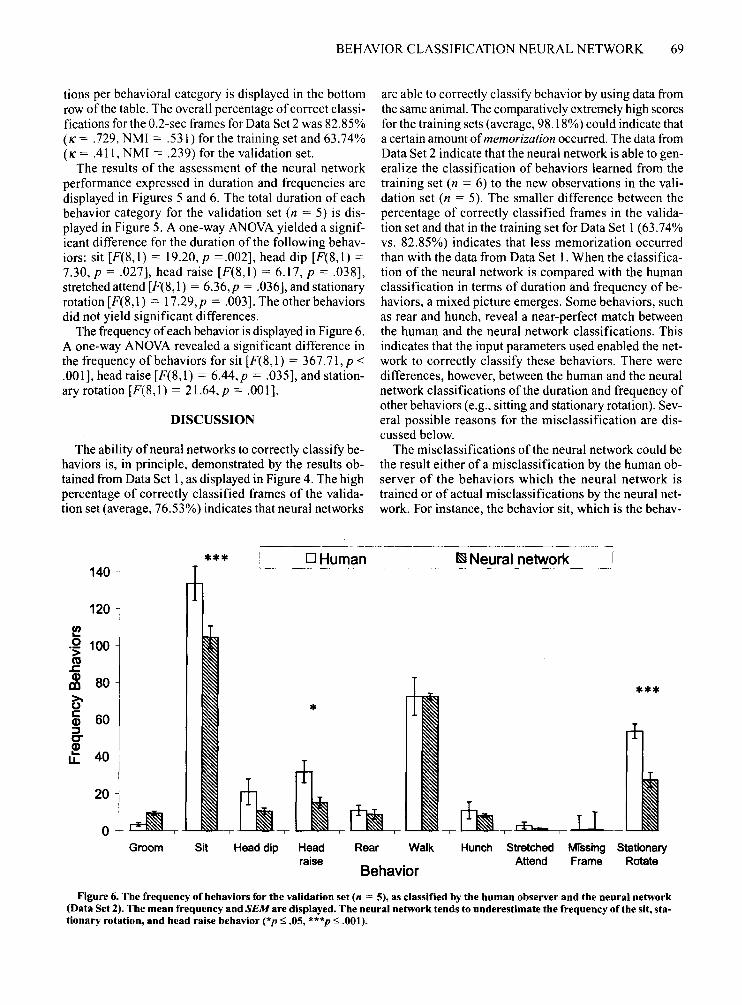
The frequency ofeach behavior is displayed in Figure 6.A one-way ANOVA revealed a significant difference inthe frequency of behaviors for sit [F(8,1) = 367.71,p <.001], head raise [F(8,1) = 6A4,p = .035], and stationary rotation [F(8, I) = 21.64, P = .00 I].
DISCUSSION
The ability ofneural networks to correctly classify behaviors is, in principle, demonstrated by the results obtained from Data Set I, as displayed in Figure 4. The highpercentage of correctly classified frames of the validation set (average, 76.53%) indicates that neural networks
are able to correctly classify behavior by using data fromthe same animal. The comparatively extremely high scoresfor the training sets (average, 98.18%) could indicate thata certain amount of memorization occurred. The data fromData Set 2 indicate that the neural network is able to generalize the classification of behaviors learned from thetraining set (n = 6) to the new observations in the validation set (n = 5). The smal1er difference between thepercentage of correctly classified frames in the validation set and that in the training set for Data Set I (63.74%vs. 82.85%) indicates that less memorization occurredthan with the data from Data Set I. When the classification of the neural network is compared with the humanclassification in terms of duration and frequency of behaviors, a mixed picture emerges. Some behaviors, suchas rear and hunch, reveal a near-perfect match betweenthe human and the neural network classifications. Thisindicates that the input parameters used enabled the network to correctly classify these behaviors. There weredifferences, however, between the human and the neuralnetwork classifications of the duration and frequency ofother behaviors (e.g., sitting and stationary rotation). Several possible reasons for the misclassification are discussed below.
The misclassifications of the neural network could bethe result either of a misclassification by the human observer of the behaviors which the neural network istrained or of actual misclassifications by the neural network. For instance, the behavior sit, which is the behav-
*** I§lI Neural network
Hunch Stretched Missing StationaryAttend Frame Rotate
***
Behavior
Rear WalkHead dip Headraise
Sit
140
120
~0 100'>co.c:Q)
80rn>.0c: 60Q)::JC"~ 40u.
20
0Groom
Figure 6. The frequency of behaviors for the validation set (n = 5), as classified by the human observer and the neural network(Data Set 2). The mean frequency and SEM are displayed. The neural network tends to underestimate the frequency ofthe sit, stationary rotation, and head raise behavior (*p::; .05, ***p::; .001).
70 ROUSSEAU, VAN LOCHEM, GISPEN, AND SPRUIJT
ior with the highest frequency, is misclassified by theneural network as walk in 659 cases, as compared withthe human observer. Conversely, the behavior walk, asclassified by the human observer, is classified as sit in703 cases by the neural network. A human observer hasgreat difficulty in accurately determining the end timepoint of the continuous movement of an animal; therefore, it is probable that this is the main source ofthe errorin classification. If the misclassifications were resolvedbetween the behaviors sit and walk, the total percentageof correctly classified behavior would rise to 75.11 %.The most accurate method ofquantifying the movementsof animals is calculating the displacement of the centerof gravity of the animal being tracked, using imageprocessing software and hardware that are similar to thoseused in this study.
Another possible strategy that could improve the classification is the elimination ofirrelevant input parameters.The 55 parameters per frame that were used can be reduced, using techniques from statistical classification theory, such as hierarchical clustering, or techniques derivedfrom artificial neural networks, which are generally knownas feature selection techniques (Dash & Liu, 1997). Thisincludes, for example, optimal brain surgery, selectivelyremoving neurons from a network, and genetic algorithms. The generalization ability of neural networks isknown to improve when the number of irrelevant inputparameters (features) is reduced. Conversely,new featurescould be devised that could improve the classification ofbehaviors with large differences in classification betweenthe human and the neural network. The neural networkunderestimates both the frequency and the total durationof the stationary rotation behavior. A new parameter couldbe devised that represents the displacements of the noseand tail points over a number of previous frames. This isanalogous to the displacements ofthe center ofgravity overfive frames, currently used. A further improvement oftheclassification could be obtained ifthe number ofobservations in the training set were to be increased, as comparedwith the number of observations in the validation set.
To make possible the successful application of neuralnetwork classification of behavior in standard tests usedin pharmacological research, several factors have to betaken into account. First, the sample of animals used totrain a neural network must consist of a large and representative sample of all the possible behaviors that onewants to classify, Similarly, animals ofdifferent sizes mustbe used in the training set, although the possible confounding effects of size can be expected to be counteracted bythe scale-invariant parameters used in this study. Furtherresearch is also required to assess the ability ofneural networks to classify observations recorded from differentcamera positions relative to the observed animal andunder different lighting conditions. Finally, experimentswith drugs have to be conducted, to examine whetherneural networks reveal drug effects similar to those revealed by human observations.
The fuzzy boundaries between behavioral classesfor instance, the transitions from walk to sit or rear tohunch-result in differences in classification ofthese behaviors by human observers. Toensure reliable and reproducible behavior classification, observers have to betrained extensively, and periodic evaluations of observershave to be conducted. These difficulties have led to a situation in which these safeguards are implemented onlywithin laboratories, hampering the comparison ofresultsobtained at different laboratories. Comparison amonglaboratories is not impossible, but a substantial effort hasto be made to ensure similar behavior classifications. Forexample, the International Program on Chemical Safetycollaborative study on neurobiological screening methodsorganized a 2-day training session to train a representative from each of the participating laboratories to classify the behaviors studied (Moser, Reeking, MacPhail, &Kulig, 1997). The use of standardclassification tools wouldeliminate such cumbersome protocols. Automated classification also allows continuous observations over longperiod of times, thus eliminating the effects of observerfatigue and allowing unexpected late-onset drug effectsto be registered.
This study indicates that neural networks seem to offera flexible classification framework that could be allowedto accommodate different behavioral categories. Furtherresearch is required to compare the interobserver reliabilities of automated classification techniques with theinterobserver reliabilities ofhuman observers before suchtechniques become widely accepted. However, the acceptance of such behavior classification techniques by the biomedical research community would eliminate some of themethodological deficiencies that behavioral observationsare currently subject to.
REFERENCES
ARAKAWA, 0., & IKEDA, T. (1991). Apomorphine effect on single andpaired rat open-field behavior. Physiology & Behavior, 50, 189-194.
BONATZ, A. E., STEINER, H., & HUSTON, J. P.(1995). Video image analysis of behavior by microcomputer: Categorization of turning and locomotion after 6-0HDA injection into the substantia nigra. JournalofNeuroscience Methods, 22,13-26.
COHEN, J. (1960). A coefficient of agreement for nominal scales. Educational & Psychological Measurement, 20, 37-46.
COOLS, A. R., ELLENBROEK, B. A., GINGRAS, M. A., ENGBERSEN, A., &HEEREN, D. (1997). Differences in vulnerability and susceptibility todexamphetamine in Nijmegen high and low responders to novelty: Adose-effect analysis of spatio-temporal programming of behaviour.Psychopharmacology, 132, 181-187.
DAI, H., & CAREY, R. J. (1994). A new method to quantify behavioral attention to a stimulus object in a modified open-field. Journal ofNeuroscience Methods, 53, 29-34.
DASH, M., & LIU, H. (1997). Feature selection for classification. Intelligent Data Analysis, 1,131-156.
DELBARRE, B., DUMAS, G., & GUIONNIERE, M. (1970). An autornatecopen field method. Psychopharmacologia, 18,227-230.
FORBES, A. D. (1995). Classification-algorithm evaluation: Five performance measures based on confusion matrices. Journal of ClinicaMonitoring, 11,189-206.
GALLAGHER, M., BURWELL, R., & BURCHINAL, M. R. (1993). Severit;of spatial learning impairment in aging: Development of a learnin!
BEHAVIOR CLASSIFICATION NEURAL NETWORK 71
index for performance in the Morris water maze. Behavioral Neuroscience, 101,618-626.
GAPENNE, 0 .• SIMON, P., & LANNOU, J. (1990). A simple method forrecording the path ofa rat in an open field. Behavior Research Methods. Instruments. & Computers, 22, 443-448.
GEISLER, H. c. WESTERGA. J., & GRAMSBERGEN, A. (1993). Development of posture in the rat. Acta Neurobiologiae Experimentalis, 53,511-523.
GHAZANFARI, A., KUSALlK, A., & IRUDAYARAJ, J. (1991). Applicationofa multi-structure neural network (MSNN) to sorting pistachio nuts.International Journal of Neural Systems, 8, 55-61.
GONZALEZ, L. P., & ARNALDa, C. M. (1993). Classification of druginduced behaviors using a multi-layer feed-forward neural network.Computer Methods & Programs in Biomedicine, 40, 161-113.
GRANT, E. C; & MACKINTOSH, J. H. (1963). A description of the socialpostures of some laboratory rodents. Behaviour, 21, 246-259.
KAO, S. D., SHAW, E Z., YOUNG, M. S., & JAN, G. J. (1995). A new automated method for detection and recording of animal moving path.Journal ofNeuroscience Methods, 63, 205-209.
KERNAN, W. J., JR., MULLENIX, P.1., & HOPPER, D. L. (1988). Patternrecognition of rat behavior. Pharmacology. Biochemistry & Behavior, 21, 559-564.
MAKANJUOLA, R. 0., HILL, G.. MABEN, I., Dow, R. C, & ASHCROFT,G. W. (1977). An automated method for studying exploratory andstereotyped behaviour in rats. Psychopharmacology, 52, 271-277.
MARSDEN, C. A., & KING, B. (1919). The use of Doppler shift radar tomonitor physiological and drug induced activity patterns in the rat.Pharmacology. Biochemistry & Behavior, 10,631-635.
MASTERS, T (1994). Signal and image processing with neural networks:A C++ sourcebook (1st ed.). New York: Wiley.
MOSER, V. c., BECKING, G. c., MACPHAIL, R. c., & KULIG, B. M.(1997). The IPCS collaborative study on neurobehavioral screeningmethods. Fundamental Applied Toxicology, 35, 143-151.
REBY, D., LEK, S., DIMOPOULOS, I., JOACHIM, 1., LAUGA, J., & AuLAGNIER, S. (1997). Artificial neural networks as a classificationmethod in the behavioural sciences. Behavioural Processes, 40, 35-43.
RENNER, M. J.. & SELTZER, C. P. (1991). Molar characteristics of exploratory and investigatory behavior in the rat (Rattus norvegicusi.Journal ofComparative Psychology, 105,326-339.
RUMEI.HART, D. E., HINTON, G. E., & WII.LlAMS, R. J. (1986). Learningrepresentations by back-propagating errors. Nature, 323, 533-536.
SAMS-DoIlD, E (1995). Automation of the social interaction test by avideo-tracking system: Behavioural effects of repeated phencyclidinetreatment. Journal of Neuroscience Methods, 59, 157-167.
SCHLINGMANN, E, VAN DE WEERD, H. A., BAUMANS, v.,REMIE, R., &VAN ZUTPHEN, L. F. M. (1998). A balance device for the analysis ofbehavioural patterns of the mouse. Animal Welfare, 1, 177-188.
SHAO, J., XIN, H., & HARMON, J. D. (1997). Neural network analysis ofpostural behavior ofyoung swine to determine their thermal comfortstate. Transactions ofthe ASAE, 40, 755-760.
SIMON, B. P.,& ESWARAN, C. (1997). An ECG classifier designed usingmodified decision based neural networks. Computers Biomedical Research, 30, 257-272.
SPRUIJT, B. M., & GISPEN, W. H. (1983). Prolonged animal observationby use of digitized videodisplays. Pharmacology. Biochemistry &Behavior, 19, 765-169.
SPRUIJT, B. M., HoI., T, & ROUSSEAU, J. (1992). Approach, avoidance,and contact behavior of individually recognized animals automatically quantified with an imaging technique. Physiology & Behavior,51,141-752.
STOFF, D. M., STAUDERMAN, K., & WYATT, R. 1. (1983). The time andspace machine: Continuous measurement of drug-induced behaviorpatterns in the rat. Psychopharmacology, 80, 319-324.
TIMMERMANS, P.J. A. (1978). Social behaviour in the rat. Unpublisheddoctoral thesis, Nijmegen, The Netherlands.
TOMKINS, P.T, & O'DONOVAN, D. 1. (l98\). A fully automated openfield apparatus incorporating rearing detection. Physiology & Behavior, 26, 741-746.
VAN ABEELEN, J. H. F. (1963). Mouse mutants studied by means ofethological methods: I. Ethogram. Genetica, 34, 79-94.
WOLFER, D. P., & LIPP, H. P. (1992). A new computer program for detailed off-line analysis of swimming navigation in the Morris watermaze. Journal ofNeuroscience Methods, 41, 65-14.
(Manuscript received March 10, 1999;revision accepted for publication November I, 1999.)