classification of an agrosilvopastoral system using rgb
TRANSCRIPT
Classification of an Agrosilvopastoral SystemUsing RGB Imagery from an Unmanned
Aerial Vehicle
Luís Pádua1,2(&) , Nathalie Guimarães1, Telmo Adão1,2 ,Pedro Marques1 , Emanuel Peres1,2 , António Sousa1,2 ,
and Joaquim J. Sousa1,2
1 School of Science and Technology,University of Trás-os-Montes e Alto Douro, 5000-801 Vila Real, Portugal{luispadua,nsguimaraes,telmoadao,pedro.marques,
eperes,amrs,jjsousa}@utad.pt2 Centre for Robotics in Industry and Intelligent Systems (CRIIS), INESC
Technology and Science (INESC-TEC), Porto 4200-465, Portugal
Abstract. This paper explores the usage of unmanned aerial vehicles (UAVs)to acquire remotely sensed very high-resolution imagery for classification of anagrosilvopastoral system in a rural region of Portugal. Aerial data was obtainedusing a low-cost UAV, equipped with an RGB sensor. Acquired imageryundergone a photogrammetric processing pipeline to obtain different dataproducts: an orthophoto mosaic, a canopy height model (CHM) and vegetationindices (VIs). A superpixel algorithm was then applied to the orthophotomosaic, dividing the images into different objects. From each object, differentfeatures were obtained based in its maximum, mean, minimum and standarddeviation. These features were extracted from the different data products: CHM,VIs, and color bands. Classification process – using random forest algorithm –
classified objects into five different classes: trees, low vegetation, shrubland,bare soil and infrastructures. Feature importance obtained from the trainingmodel showed that CHM-driven features have more importance when com-paring to those obtained from VIs or color bands. An overall classificationaccuracy of 86.4% was obtained.
Keywords: Agrosilvopastoral systems � Unmanned aerial vehicles �Photogrammetric processing � Superpixels � Random forest
1 Introduction
Employing unmanned aerial vehicles (UAVs) in environmental monitoring activities isincreasing, with a wide range of applications in forestry [1], agriculture [2], andgrassland monitoring [3]. This remote sensing platform provides high flexibility byenabling superior temporal and spatial resolutions [4] with lower costs, in medium andsmall projects, when compared to traditional remote sensing platforms [5].
In the classification process of data, collected by UAVs, it is essential to select thebest machine learning algorithm. There are three common algorithms being used in
© Springer Nature Switzerland AG 2019P. Moura Oliveira et al. (Eds.): EPIA 2019, LNAI 11804, pp. 248–257, 2019.https://doi.org/10.1007/978-3-030-30241-2_22

remote sensing: (1) random forest; (2) support vector machines; and (3) artificial neuralnetworks. The selection of the most appropriate method is dependent on the type ofproblem being solved. In case of having multiple features but limited records, supportvector machines might work better. In case of having a considerable number of recordsbut less features, Neural Networks present better prediction/classification accuracy [6].On the other hand, Random forest is a type of ensemble classifier that producesmultiple decision trees by using a random subset of training samples and variables. Itcan handle high data dimensionality and multicollinearity swiftly and is insensitive tooverfitting [7]. Indeed, random forest is widely used in remote sensing applications,being applied to urban vegetation mapping [8], land use and land cover mapping[9, 10], grassland classification [11] and tree species classification [12–14].
This study aims to classify an agrosilvopastoral system using a random forestalgorithm and data driven from photogrammetric processing of UAV-based RGBimagery. Agrosilvopastoral systems can be defined as a collective name for land-usesystems, which include the woody component (trees and/or shrubs), crops and cattle.Essentially, these systems are associated to a model of production and conservationcentered on silvicultural practices and agricultural activities [15]. According to Nair[16] agrosilvopastoral systems “include the use of woody hedgerows for browse, mulchand green manure as well as for soil conservation”.
This paper is structured as follows: the next section presents the study area,describes the UAV used and related imagery acquisition process. Methods used forimagery segmentation, features extracted, and the classification algorithm are alsopresented; Sect. 3 presents and discusses obtained results. The last section has someconclusions and describes steps towards future developments.
2 Materials and Methods
2.1 Study Area
The study area is located in north-eastern Portugal (41°22043.800N, 7°35000.800W) and iscomposed of trees (mainly Pinus Pinaster and Castanea Sativa Mill.), shrublandcommunities (Cytisus striatus), low-land vegetation and crops, such as grassland andpotatoes, along with bare soil areas and some men-made infrastructures. An areaoverview is presented in Fig. 1. Pine trees are present in both the north and eastsections of the study area, with some small trees located in the central section. Twochestnut plantations are also present: one located in the central section and a smallerplantation in the north section. Regarding shrubland communities, those are locatedthroughout the study area, being prevalent around its boarders. Low-land vegetation ismainly located in the south section and is composed of grassland and a potato plan-tation. Bare soil areas are spread throughout the study area, some covered by dryvegetation – mostly in between pine trees and shrubs – and some granite stones nearman-made infrastructures. As for the latter, they represent a smaller area in the southand southwest sections of the study area and are used mainly as livestockaccommodations.
Classification of an Agrosilvopastoral System Using RGB Imagery 249

2.2 Data Acquisition
Aerial data acquisition was made using the DJI Phantom 4 (DJI, Shenzhen, China). It iscost-effective multi-rotor UAV equipped with a Global Navigation Satellite System(GNSS) receiver and a 12.4 MP RGB sensor mounted in a 3-axis electronic gimbal[17]. Its remote controller, which serves as ground station, enables the connection to asmartphone. Depending on the objective, there are different applications to performimage and video acquisition for this UAV model. In this study, it is intended to performan autonomous flight to acquire aerial imagery for photogrammetric processing. Assuch, mission planning and data acquisition was done using Pix4Dcapture (Pix4D SA,Lausanne, Switzerland) in an Android smartphone: it enables the user to define an areato survey, setting different parameters, such as flight height, camera angle, UAV speedand images’ overlap.
The UAV-based imagery acquisition was conducted in 21 May 2017 at 3 PM(GMT). A single-grid flight was performed at a flight height of 100 m from the take-offpoint, covering a 255 m � 150 m area. The RGB sensor was point towards a nadiralposition, with a front overlap of 80% and a side overlap of 70%. These parameters werechosen based on previous studies [18]. A total of 102 images were acquired in fourminutes, with a ground sample distance (GSD) of approximately 4 cm.
Fig. 1. General overview of the study area. Coordinates in WGS84 (EPSG:4326).
250 L. Pádua et al.

2.3 Photogrammetric Processing
The acquired UAV-based RGB high-resolution imagery was subjected to pho-togrammetric processing. This step was achieved using Pix4Dmapper Pro (Pix4D SA,Lausanne, Switzerland), which can transform a set of images into point cloud datausing Structure from Motion (SfM) algorithms, by identifying common tie points.Moreover, it enables to compute different data products for geodetic analysis. Theprocessing pipeline of Pix4Dmapper Pro is divided into three main steps: (i) initialprocessing, which is responsible for camera position, orientation optimization, com-putation of tie points, and for creating a sparse point cloud; (ii) point cloud and mesh,where the sparse point cloud is used, along with the imagery, to compute a dense pointcloud; and (iii) DSM, orthophoto mosaic and index, which is mostly responsible forproviding orthorectified raster outcomes by point cloud interpolation, such as digitalsurface models (DSMs), orthophoto mosaics, digital terrain models (DTMs) andvegetation indices (VIs) [17].
Within the scope of this study the initial processing was conducted using defaultparameters: a high point density was selected to generate the dense point cloud, and thelatter was interpolated – by means of the inverse distances weighted (IDW) methodwith noise filtering and a sharp surface smoothing approach - to generate the rasteroutcomes. The photogrammetric processing generates: (i) a orthophoto mosaic; (ii) aRGB representation of the acquired imagery; (iii) a DSM that consists in a raster withaltitude information of the above surface objects; (iv) a DTM in the shape of a rasterwith altitude information about points that corresponds to ground (some areas whereground was not directly visible were interpolated); and (v) the selected VIs.
Computed VIs are presented in Table 1. VIs are arithmetic operations using thedifferent spectral bands. Depending on the sensor, bands other than RGB can be used(e.g. near infrared) with different narrowness levels [4]. Both RGBVI and GRVI shownto be good when discriminating vegetation from non-vegetation areas [19, 20]. GBVI,BRVI, BGVI were included in this study due to the usage of the blue band.
To have height information from the above ground objects, a CHM was calculated.This process was achieved by subtracting the DTM to the DSM [24], as presented in
Table 1. Vegetation indices used in this study.
Vegetation index Equation Reference
Red Green Blue vegetation index(RGBVI)
RGBVI ¼ Green2�Blue�RedGreen2 þBlue�Red
Bendig et al. [21]
Green-Red vegetation index (GRVI) GRVI ¼ Green�RedGreenþRed
Tucker [22]
Green-Blue vegetation index(GRVI)
GBVI ¼ Green�BlueGreenþBlue
Blue/Red pigment index BRVI ¼ BlueRed
Zarco-Tejada et al. [23]
Blue/Green pigment index BGVI ¼ BlueGreen
Zarco-Tejada et al. [23]
Classification of an Agrosilvopastoral System Using RGB Imagery 251

(1). As such, altitude difference in both models is used as surface features height. QGISraster calculator, a free and open source Geographic Information System (GIS) wasused in this operation.
CHM ¼ DSM� DTM ð1Þ
Moreover, the orthophoto mosaic was converted to a different color space – the huesaturation and value (HSV) color space [25].
2.4 Data Processing and Classification
The simple linear iterative clustering (SLIC) algorithm [26] was used to segmentimages into multiple superpixels. By applying superpixels oversegmentation to animage, compact and uniform groups of pixels that have similar characteristics areformed [27]. The orthophoto mosaic was used in this process.
Then, a dataset was created with properties obtained from the different availabledata products, divided into three categories: structural, spectral and color. As a struc-tural product, the CHM was used. Spectral products were composed by the fivecomputed VIs. Color products are composed of the red, green, blue and the hue (fromHSV) bands. Therefore, only the pixels from each cluster were considered for dataextraction. Then, four features were extracted from each product: the mean, maximum,minimum and standard deviation. To avoid potential outliers, minimum and maximumfeatures were estimated using the 10% lower and higher values, respectively.
Considering the knowledge from the study area, each cluster was classified in fiveclasses: (I) trees, encompassing forest trees and trees for agronomic purposes; (ii) lowvegetation, composed of grassland and seasonal agriculture plantations; (iii) shrubland,which considers the shrub communities existing in the area and some shrubs located inforest canopy gaps; (iv) bare soil, encompassing areas with little to no ground vege-tation and dry vegetation; (v) and infrastructures, composed of man-made buildingsand stone walls. This process was achieved in QGIS by converting the super pixelobjects to a polygon shapefile.
With the segmentation done, the features extracted, and data classified, a randomforest model was trained for classification purposes. Data was divided into 75% fortraining and 25% for classification. Feature importance was also evaluated. For accu-racy assessment, different metrics were evaluated, namely: producer accuracy, useraccuracy, and the overall accuracy. Producer accuracy is obtained by the percentage ofhow many objects on the map are correctly labeled, including errors of omission anduser accuracy is obtained by the percentage of all objects that were correctly identified,encompassing errors of commission.
3 Results and Discussion
Some of the digital products obtained through the photogrammetric processing – CHM,RGBVI, BGVI, BRVI, GBVI, and GRVI – are presented in Fig. 2. Differences betweenthe computed VIs and the CHM height are clearly visible. The photogrammetric
252 L. Pádua et al.

processing was done in about 1 h 30 m, using a workstation with two Intel®Xeon®CPUE5-2680 v4, 128 GB RAM, two Nvidia Quadro M4000 and 1 TB SSD.
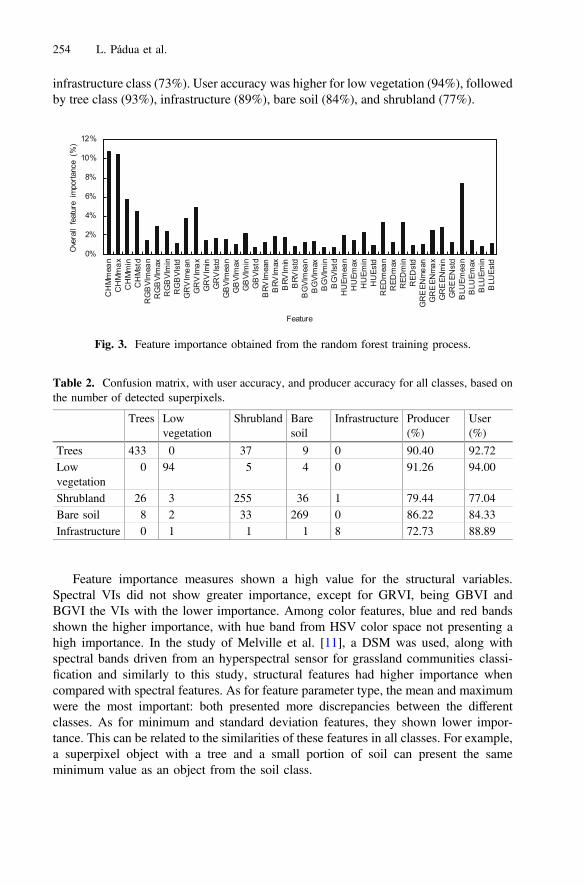
The overall training accuracy, using random forest algorithm, was of 99.33%.Superpixels object size varied approximately from 5 m2 to 90 m2. As for featuresimportance (Fig. 3), spectral features (VI-based) were the most relevant (35%), fol-lowed by color features (34%) and color features (31%). However, when individuallyanalyzing each feature, the most relevant is CHM’s mean value (10.8%), followed byCHM’s maximum value (10.5%) and the blue band mean value (7.5%). By analyzingeach digital outcome individually, CHM has the highest importance (32%). The VIwith higher feature importance was the GRVI (12%). Considering color features, bothblue and red bands had the higher importance (11% and 9%, respectively). Whenregarding feature parameter type (i.e. mean, maximum, minimum, and standard devi-ation) the mean value showed the higher percentage (34%), followed by the maximum(29%), minimum (23%) and, lastly, the standard deviation (14%).
A confusion matrix with the random forest classification results is provided inTable 2. The overall accuracy was 86.4%. Producer accuracy was higher for low vege-tation class (91%), followed by tree class (90%), bare soil (86%), shrubland (79%) and
Fig. 2. Generated structural and spectral products in a color-coded representation. Top (left toright): CHM, RGBVI, and BGVI. Bottom (left to right): BRVI, GBVI, and GRVI. Coordinates inWGS84 (EPSG:4326).
Classification of an Agrosilvopastoral System Using RGB Imagery 253
infrastructure class (73%). User accuracy was higher for low vegetation (94%), followedby tree class (93%), infrastructure (89%), bare soil (84%), and shrubland (77%).
Feature importance measures shown a high value for the structural variables.Spectral VIs did not show greater importance, except for GRVI, being GBVI andBGVI the VIs with the lower importance. Among color features, blue and red bandsshown the higher importance, with hue band from HSV color space not presenting ahigh importance. In the study of Melville et al. [11], a DSM was used, along withspectral bands driven from an hyperspectral sensor for grassland communities classi-fication and similarly to this study, structural features had higher importance whencompared with spectral features. As for feature parameter type, the mean and maximumwere the most important: both presented more discrepancies between the differentclasses. As for minimum and standard deviation features, they shown lower impor-tance. This can be related to the similarities of these features in all classes. For example,a superpixel object with a tree and a small portion of soil can present the sameminimum value as an object from the soil class.
Table 2. Confusion matrix, with user accuracy, and producer accuracy for all classes, based onthe number of detected superpixels.
Trees Lowvegetation
Shrubland Baresoil
Infrastructure Producer(%)
User(%)
Trees 433 0 37 9 0 90.40 92.72Lowvegetation
0 94 5 4 0 91.26 94.00
Shrubland 26 3 255 36 1 79.44 77.04Bare soil 8 2 33 269 0 86.22 84.33Infrastructure 0 1 1 1 8 72.73 88.89
0%
2%
4%
6%
8%
10%
12%
CH
Mm
ean
CH
Mm
ax C
HM
min
CH
Mst
d R
GB
VIm
ean
RG
BVI
max
RG
BVI
min
RG
BVI
std
GR
VIm
ean
GR
VIm
ax G
RV
Imin
GR
VIs
td G
BVI
mea
n G
BVI
max
GB
VIm
in G
BVI
std
BRV
Imea
n B
RVIm
ax B
RVIm
in B
RVIs
td B
GVI
mea
n B
GVI
max
BG
VIm
in B
GVI
std
HU
Emea
n H
UEm
ax H
UEm
in H
UEs
td R
EDm
ean
RED
max
RED
min
RED
std
GR
EEN
mea
n G
RE
ENm
ax G
RE
ENm
in G
RE
ENst
d B
LUEm
ean
BLU
Emax
BLU
Emin
BLU
Estd
Ove
rall
feat
ure
impo
rtanc
e (%
)
Feature
Fig. 3. Feature importance obtained from the random forest training process.
254 L. Pádua et al.
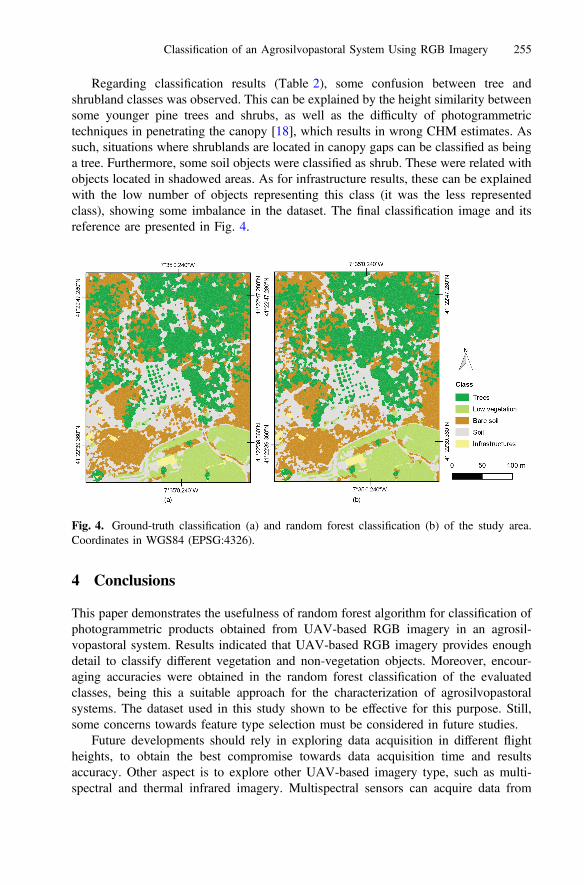
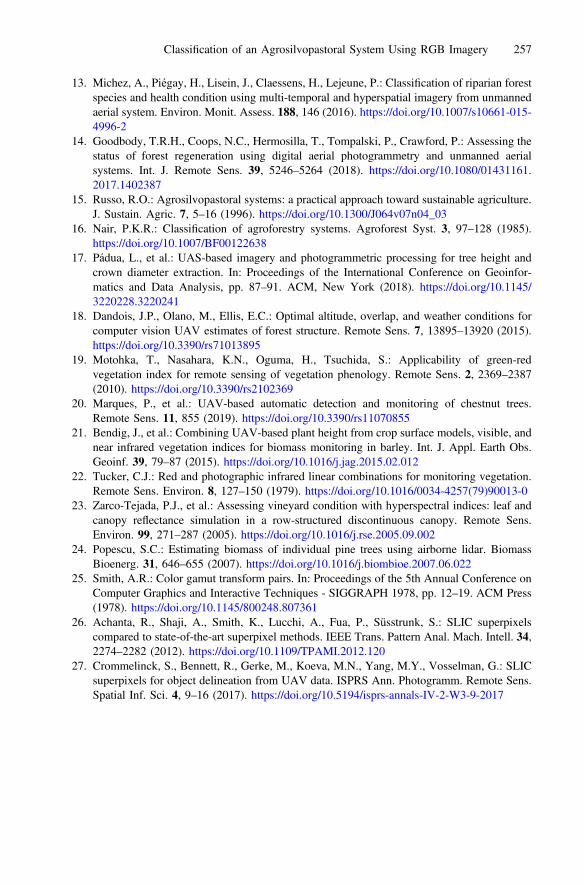
Regarding classification results (Table 2), some confusion between tree andshrubland classes was observed. This can be explained by the height similarity betweensome younger pine trees and shrubs, as well as the difficulty of photogrammetrictechniques in penetrating the canopy [18], which results in wrong CHM estimates. Assuch, situations where shrublands are located in canopy gaps can be classified as beinga tree. Furthermore, some soil objects were classified as shrub. These were related withobjects located in shadowed areas. As for infrastructure results, these can be explainedwith the low number of objects representing this class (it was the less representedclass), showing some imbalance in the dataset. The final classification image and itsreference are presented in Fig. 4.
4 Conclusions
This paper demonstrates the usefulness of random forest algorithm for classification ofphotogrammetric products obtained from UAV-based RGB imagery in an agrosil-vopastoral system. Results indicated that UAV-based RGB imagery provides enoughdetail to classify different vegetation and non-vegetation objects. Moreover, encour-aging accuracies were obtained in the random forest classification of the evaluatedclasses, being this a suitable approach for the characterization of agrosilvopastoralsystems. The dataset used in this study shown to be effective for this purpose. Still,some concerns towards feature type selection must be considered in future studies.
Future developments should rely in exploring data acquisition in different flightheights, to obtain the best compromise towards data acquisition time and resultsaccuracy. Other aspect is to explore other UAV-based imagery type, such as multi-spectral and thermal infrared imagery. Multispectral sensors can acquire data from
Fig. 4. Ground-truth classification (a) and random forest classification (b) of the study area.Coordinates in WGS84 (EPSG:4326).
Classification of an Agrosilvopastoral System Using RGB Imagery 255

other near infrared regions of the electromagnetic spectrum, which combined withtemperature, may improve the classification results.
Acknowledgments. This work is financed by the ERDF – European Regional DevelopmentFund through the Operational Programme for Competitiveness and Internationalisation -COMPETE 2020 Programme within project «POCI-01-0145-FEDER-006961» and by NationalFunds through the FCT – Fundação para a Ciência e a Tecnologia (Portuguese Foundation forScience and Technology) as part of project UID/EEA/50014/2013. The research activities of LuísPádua were funded by the Portuguese Foundation for Science and Technology (SFRH/BD/139702/2018).
References
1. Torresan, C., et al.: Forestry applications of UAVs in Europe: a review. Int. J. Remote Sens.38, 2427–2447 (2017). https://doi.org/10.1080/01431161.2016.1252477
2. Castaldi, F., Pelosi, F., Pascucci, S., Casa, R.: Assessing the potential of images fromunmanned aerial vehicles (UAV) to support herbicide patch spraying in maize. PrecisionAgric. 18, 76–94 (2017). https://doi.org/10.1007/s11119-016-9468-3
3. von Bueren, S.K., Burkart, A., Hueni, A., Rascher, U., Tuohy, M.P., Yule, I.J.: Deployingfour optical UAV-based sensors over grassland: challenges and limitations. Biogeosciences12, 163–175 (2015). https://doi.org/10.5194/bg-12-163-2015
4. Pádua, L., et al.: UAS, sensors, and data processing in agroforestry: a review towardspractical applications. Int. J. Remote Sens. 38, 2349–2391 (2017). https://doi.org/10.1080/01431161.2017.1297548
5. Matese, A., et al.: Intercomparison of UAV, aircraft and satellite remote sensing platformsfor precision viticulture. Remote Sens. 7, 2971–2990 (2015). https://doi.org/10.3390/rs70302971
6. Shakhatreh, H., et al.: Unmanned aerial vehicles: a survey on civil applications and keyresearch challenges. arXiv:1805.00881 [cs] (2018)
7. Belgiu, M., Drăguţ, L.: Random forest in remote sensing: a review of applications and futuredirections. ISPRS J. Photogram. Remote Sens. 114, 24–31 (2016). https://doi.org/10.1016/j.isprsjprs.2016.01.011
8. Feng, Q., Liu, J., Gong, J.: UAV remote sensing for urban vegetation mapping using randomforest and texture analysis. Remote Sens. 7, 1074–1094 (2015). https://doi.org/10.3390/rs70101074
9. Akar, Ö.: The rotation forest algorithm and object-based classification method for land usemapping through UAV images. Geocarto Int. 33(5). https://www.tandfonline.com/doi/abs/10.1080/10106049.2016.1277273
10. Ma, L., et al.: Evaluation of feature selection methods for object-based land cover mappingof unmanned aerial vehicle imagery using random forest and support vector machineclassifiers. IJGI 6, 51 (2017). https://doi.org/10.3390/ijgi6020051
11. Melville, B., Lucieer, A., Aryal, J.: Classification of lowland native grassland communitiesusing hyperspectral unmanned aircraft system (UAS) imagery in the tasmanian midlands.Drones 3, 5 (2019). https://doi.org/10.3390/drones3010005
12. Nevalainen, O., et al.: Individual tree detection and classification with UAV-basedphotogrammetric point clouds and hyperspectral imaging. Remote Sens. 9, 185 (2017).https://doi.org/10.3390/rs9030185
256 L. Pádua et al.
13. Michez, A., Piégay, H., Lisein, J., Claessens, H., Lejeune, P.: Classification of riparian forestspecies and health condition using multi-temporal and hyperspatial imagery from unmannedaerial system. Environ. Monit. Assess. 188, 146 (2016). https://doi.org/10.1007/s10661-015-4996-2
14. Goodbody, T.R.H., Coops, N.C., Hermosilla, T., Tompalski, P., Crawford, P.: Assessing thestatus of forest regeneration using digital aerial photogrammetry and unmanned aerialsystems. Int. J. Remote Sens. 39, 5246–5264 (2018). https://doi.org/10.1080/01431161.2017.1402387
15. Russo, R.O.: Agrosilvopastoral systems: a practical approach toward sustainable agriculture.J. Sustain. Agric. 7, 5–16 (1996). https://doi.org/10.1300/J064v07n04_03
16. Nair, P.K.R.: Classification of agroforestry systems. Agroforest Syst. 3, 97–128 (1985).https://doi.org/10.1007/BF00122638
17. Pádua, L., et al.: UAS-based imagery and photogrammetric processing for tree height andcrown diameter extraction. In: Proceedings of the International Conference on Geoinfor-matics and Data Analysis, pp. 87–91. ACM, New York (2018). https://doi.org/10.1145/3220228.3220241
18. Dandois, J.P., Olano, M., Ellis, E.C.: Optimal altitude, overlap, and weather conditions forcomputer vision UAV estimates of forest structure. Remote Sens. 7, 13895–13920 (2015).https://doi.org/10.3390/rs71013895
19. Motohka, T., Nasahara, K.N., Oguma, H., Tsuchida, S.: Applicability of green-redvegetation index for remote sensing of vegetation phenology. Remote Sens. 2, 2369–2387(2010). https://doi.org/10.3390/rs2102369
20. Marques, P., et al.: UAV-based automatic detection and monitoring of chestnut trees.Remote Sens. 11, 855 (2019). https://doi.org/10.3390/rs11070855
21. Bendig, J., et al.: Combining UAV-based plant height from crop surface models, visible, andnear infrared vegetation indices for biomass monitoring in barley. Int. J. Appl. Earth Obs.Geoinf. 39, 79–87 (2015). https://doi.org/10.1016/j.jag.2015.02.012
22. Tucker, C.J.: Red and photographic infrared linear combinations for monitoring vegetation.Remote Sens. Environ. 8, 127–150 (1979). https://doi.org/10.1016/0034-4257(79)90013-0
23. Zarco-Tejada, P.J., et al.: Assessing vineyard condition with hyperspectral indices: leaf andcanopy reflectance simulation in a row-structured discontinuous canopy. Remote Sens.Environ. 99, 271–287 (2005). https://doi.org/10.1016/j.rse.2005.09.002
24. Popescu, S.C.: Estimating biomass of individual pine trees using airborne lidar. BiomassBioenerg. 31, 646–655 (2007). https://doi.org/10.1016/j.biombioe.2007.06.022
25. Smith, A.R.: Color gamut transform pairs. In: Proceedings of the 5th Annual Conference onComputer Graphics and Interactive Techniques - SIGGRAPH 1978, pp. 12–19. ACM Press(1978). https://doi.org/10.1145/800248.807361
26. Achanta, R., Shaji, A., Smith, K., Lucchi, A., Fua, P., Süsstrunk, S.: SLIC superpixelscompared to state-of-the-art superpixel methods. IEEE Trans. Pattern Anal. Mach. Intell. 34,2274–2282 (2012). https://doi.org/10.1109/TPAMI.2012.120
27. Crommelinck, S., Bennett, R., Gerke, M., Koeva, M.N., Yang, M.Y., Vosselman, G.: SLICsuperpixels for object delineation from UAV data. ISPRS Ann. Photogramm. Remote Sens.Spatial Inf. Sci. 4, 9–16 (2017). https://doi.org/10.5194/isprs-annals-IV-2-W3-9-2017
Classification of an Agrosilvopastoral System Using RGB Imagery 257